
Abstract
In virtue of the exceptional material characteristics, Polyethylene (PE) components are broadly utilised in various engineering applications such as pressure-rated gas, water systems and sustainable energy systems, etc. However, during practical applications, PE components could be vulnerable to such damages as the Backside Wall-thinning Defect (BWD) which is resulted from the improper installation process or lateral impact, etc. The structural integrity and safety of PE components are severely threatened by the defect. Therefore, efficient testing, imaging and evaluation of BWDs are highly demanded for non-intrusive inspection of PE components. Complementary to other non-destructive evaluation techniques, Microwave Testing (MWT) has been found to be superior in the inspection of dielectric structures. In light of this, in this paper the visualised evaluation of BWDs in the planar PE component via the Ka-band MWT is intensively scrutinised. In an effort to evaluate the planar dimension and depth of a BWD, the 3D profiling of the BWD based on the U-Net is investigated together with the multiple hypothesis test-based signal-feature selection. The feasibility and applicability of MWT, along with Ka-band (26.5 ∼ 40 GHz) microwave reflectometry and the proposed algorithms, for the detection, visualisation, and assessment of BWDs in PE components are demonstrated by the experimental results.
Keywords
Introduction
As one of the pivotal materials, Polyethylene (PE) component has become indispensable in various engineering fields owing to its outstanding physical properties. It is usually adopted as the base material of the critical components in such industries as energy, oil and gas transportation, etc.1–3 However, in-service PE components could be vulnerable to the Backside Wall-thinning Defects 4 (BWDs) due to the abrasion and lateral impacts on the back wall of the component. Such defects have been posing a severe threat to the structural integrity and safety of PE components. Therefore, it is indispensable to non-intrusively detect, characterise, visualise and evaluate the BWDs in PE components via effective Non-destructive Testing (NDT) techniques.
Complementary to the conventional NDT techniques for inspection of PE components such as infrared thermography testing, 5 radiographic testing, 6 and ultrasonic testing,7–9 Microwave Testing (MWT), as one of the emerging methods, has been found to be promising in detection of hidden flaws in dielectric structures and particularly PE components. 10 MWT has demonstrated significant technical advantages in terms of high sensitivity, strong penetration capabilities and non-contact inspection without the ionizing radiation hazards, 11 and attracted much attention in the field of electromagnetic NDT. Hitherto, research of MWT has been focused mostly on the defect imaging and identification, quantitative assessment of volumetric defects. For the defect imaging, Gao et al. employed a complex network in lieu of traditional imaging algorithms to achieve high-resolution imaging. 12 Li et al. utilised a combination of near-field and far-field microwave testing methods to realize high-resolution imaging of fibre wrinkling defects in reinforced glass fibre composite panels. 13 In regard to the defect identification, Nawaf et al. extracted defect information at various frequency points using the maximum overlap discrete wavelet packet transform technique, and furthermore integrating a bidirectional long short-term memory network to effectively identify debonding defects in GFRP. 14 For recognition and assessment of the defect, Atsushi et al. quantified the size of delamination defects in GFRP plates by using the amplitude differences in reflection coefficients. 15 Zhang et al. proposed a method using principal component analysis to improve signal-to-noise ratio which enables effective assessment of subsurface defects. 16
It is noteworthy that the previous research mostly focused on microwave imaging for defect identification and evaluation of planar size of flaws under interrogation which has opened a door for 3D sizing of BWDs in the PE component. In light of this, in the paper the imaging and size evaluation of BWDs in the PE slab based on microwave reflectometry in the Ka band (26.5 GHz ∼ 40 GHz) are intensively investigated. The U-Net together with the multiple hypothesis test-based signal-feature selection is proposed for 3D sizing of BWDs.
The experimental system and analysis of testing-signal characteristics
A Ka-band MWT system is built up for detection and visualised assessment of BWDs in PE slabs. It consists of a vector network analyser (Keysight N5224A), rectangular waveguide (XiBao OW28-OS2.4 K) with the length and aperture size of 214 mm and 7.12 mm × 3.56 mm, respectively, a scanning controller (Ruicheng RC08PCI), three-axis scanning table (Ruicheng RCDW-2I) and the PE slab. The schematic illustration and photo of the system are portrayed in Figure 1. The parameters of the system setup are listed in Table 1.
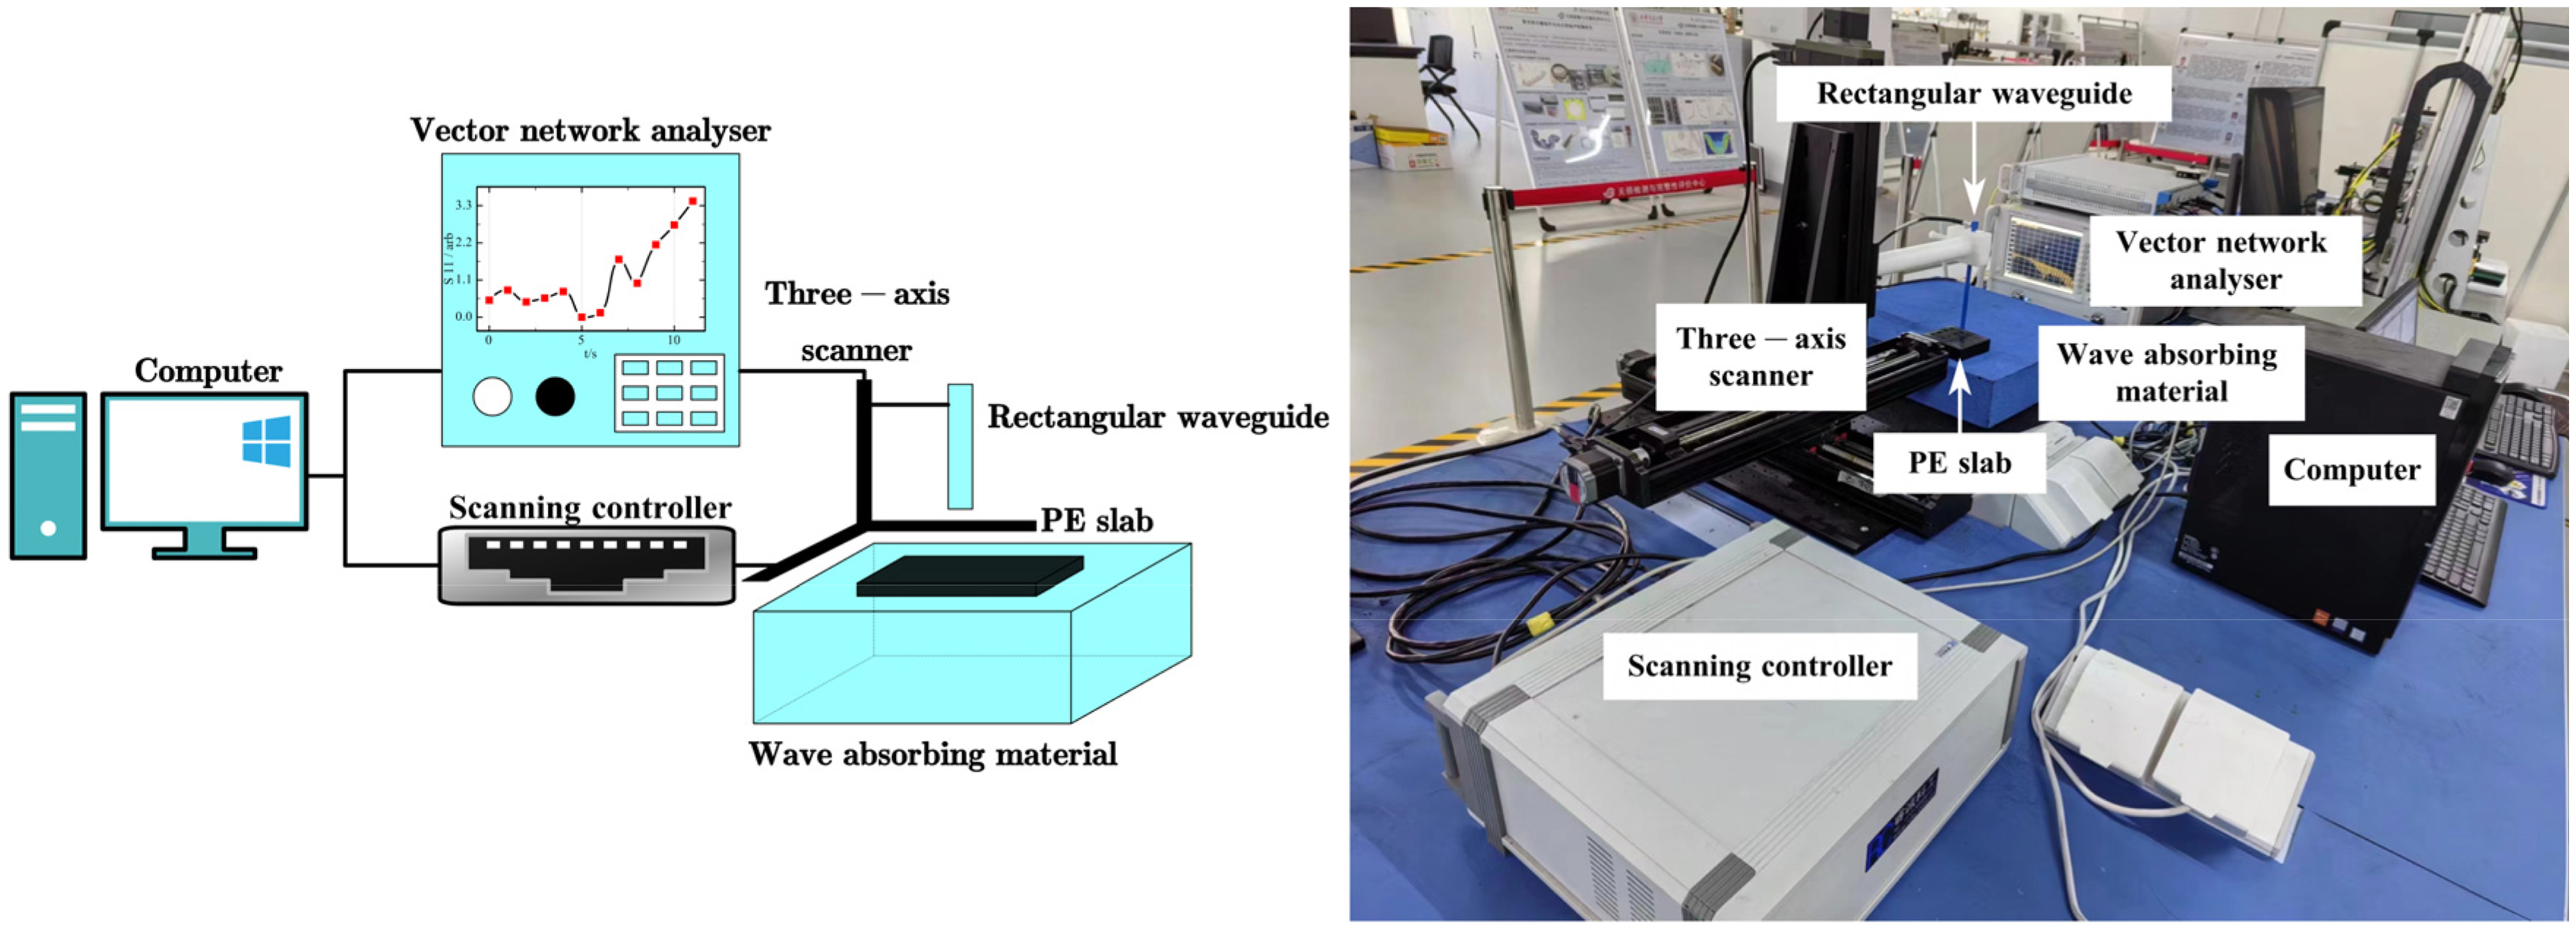
Schematic illustration and photo of the MWT system.
The parameters of the MWT system.

Two PE slabs with the length, width and thickness of 200 mm × 200 mm × 20 mm, respectively are utilised as the testing specimens for experiments. The BWDs with different profiles and sizing parameters are fabricated in the back surface of each slab. The localised depth information for PE#1 and PE#2 is illustrated in Figure 2. Note that: (1) in Figure 2, d denotes the localised defect depth; and (2) the total number of the excitation-frequency samples is 1351. For the BWD size evaluation based on the machine learning, the MWT results for PE#1 are adopted as the training set, while those for PE#2 are used as the validation set.
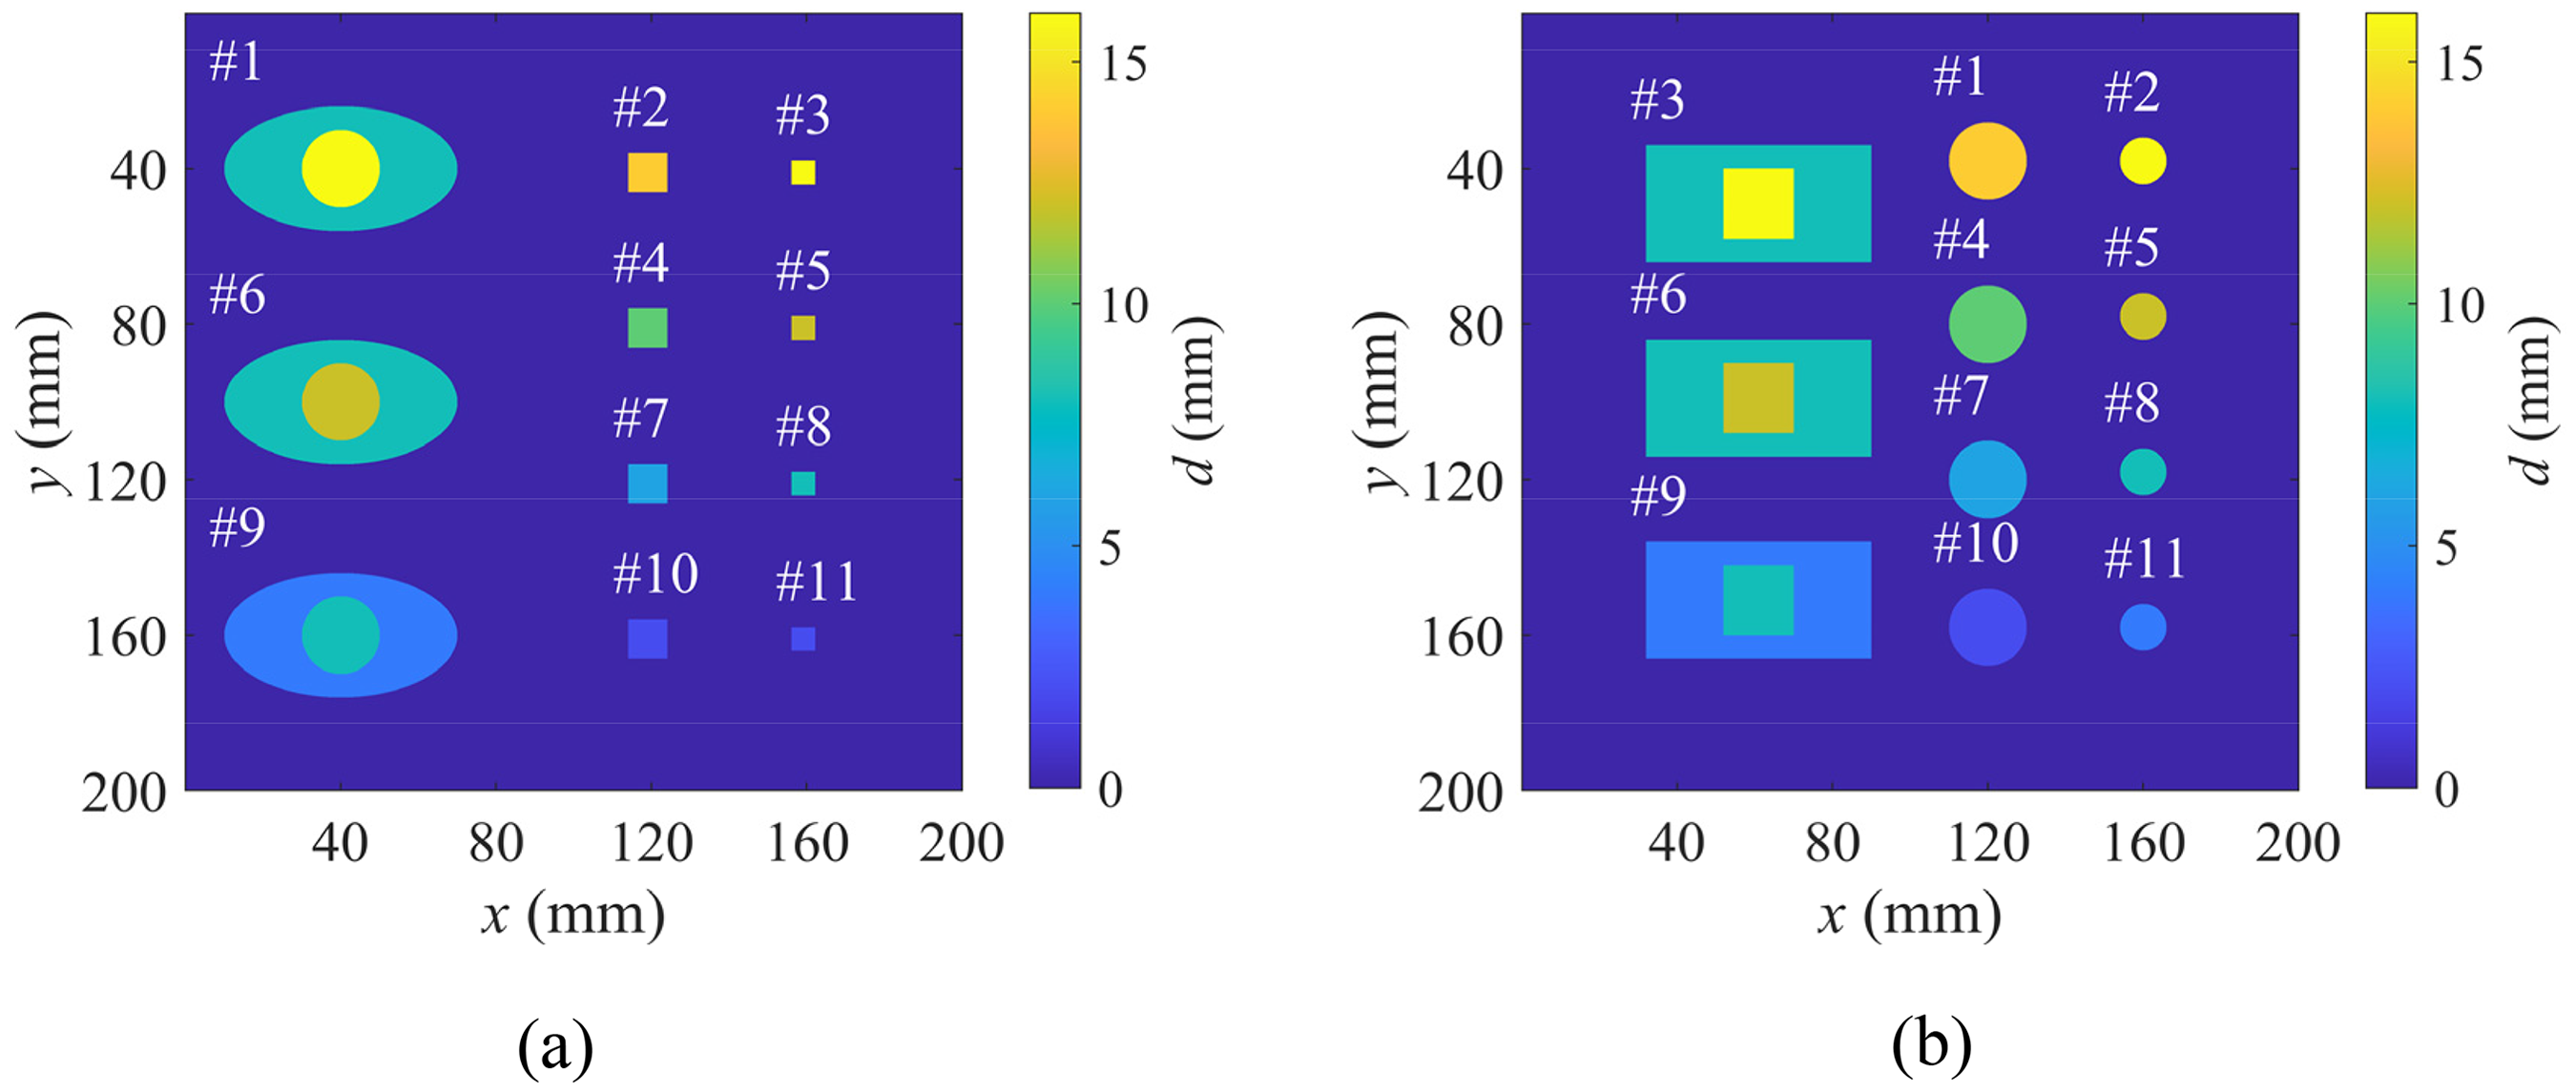
The true images of the PE specimens, i.e., PE#1 and PE#2 together with the information regarding the profile and localised depth of BWDs.
During the scanning of each PE slab using the proposed system, the incident microwave excited by a computer-controlled vector network analyser is transmitted via the coaxial cable to the rectangular waveguide. It is subsequently radiated directionally toward the PE slab from the rectangular waveguide deemed as a microwave probe. After the incident wave is reflected at heterogeneous interfaces inside the PE slab, the reflected wave is simultaneously captured by the waveguide, and transmitted back to the vector network analyser for processing and analysis. The reflection coefficient (S11) in function of the excitation frequency, i.e., the testing signal is thereby obtained. Note that S11 is a dimensionless parameter. As can be seen in Table 1, the scanning interval is set as 2.0 mm. In consideration of the side length of each PE slab, 101 scanning points are utilised along either x or y direction. Therefore, 10,201 testing signals in either the training set or validation set are acquired from the scanning of each PE slab.
In a bid to analyse the relation between the testing signal and the BWD depth, the average S11 signal with the absolute magnitude (|S11|) is derived by taking the mean of the testing signals within the area of a BWD in PE#1, and compared with that for the defect-free region. The comparison result is exhibited in Figure 3.
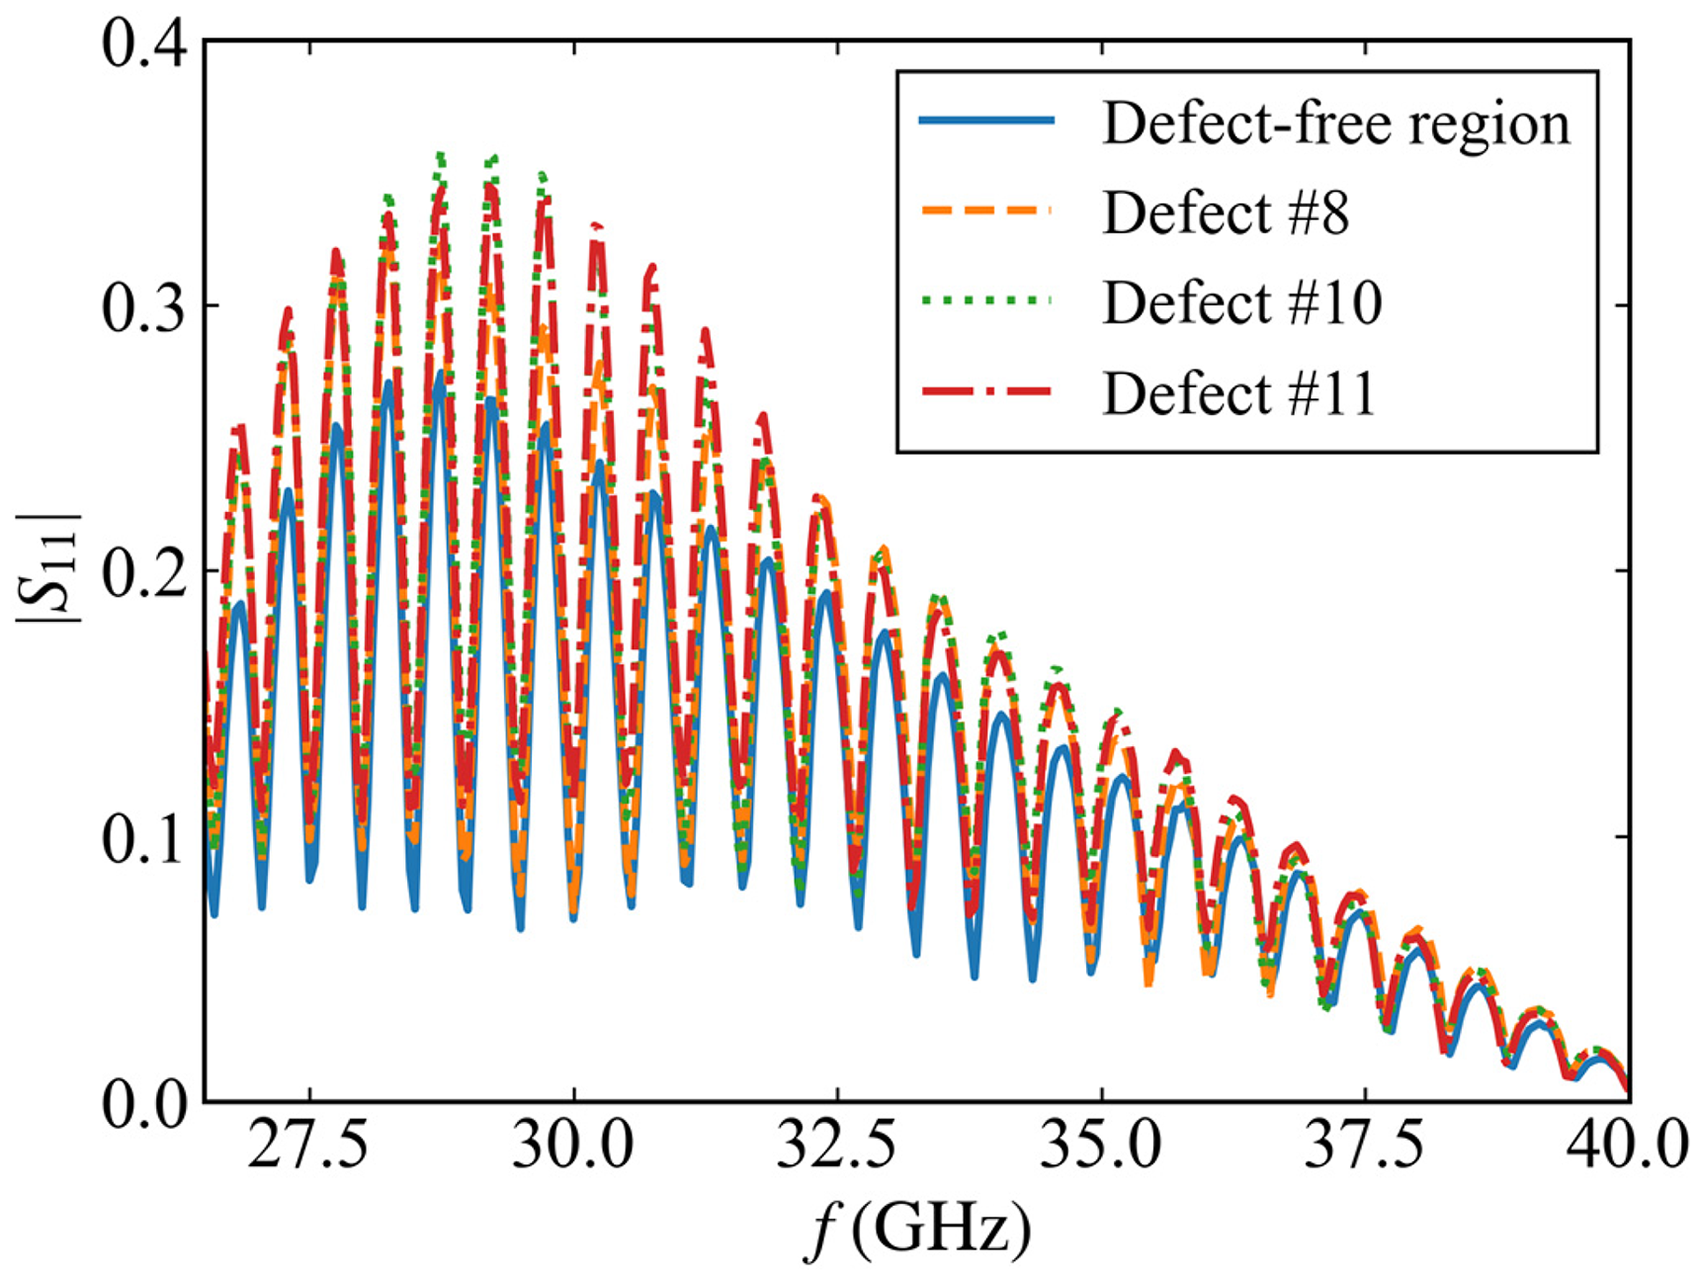
Average S11 signals vs. different BWD cases (Defects #8, #10 and #11 with the localised depths of 6 mm, 4 mm, and 2 mm in PE#1).
It is observed from Figure 3 that in the presence of a BWD with the variable depth, the signal variation can be identified. This is due to the fact that the wave reflectance and microwave attenuation is essentially changed by the BWDs with different depths. This indicates that the BWD sizing parameters could be quantitatively evaluated by employing the differential characteristics of the testing signals. As a result, a mapping relationship between the signal feature and BWD sizing parameter is established for further analysis.
BWD imaging and feature selection for 2D defect profiling
In a bid to evaluate the size of a BWD, it is crucial to utilise the testing signal at each scanning point for defect identification. This is essentially a binary classification problem based on signal features. In an effort to retrieve the defect information from the testing signals and extract the signal features, the process for feature extraction and selection is scrutinised. It is exhibited in Figure 4. As illustrated in Figure 4, a three-stage algorithm is employed. It involves the feature extraction, preliminary feature selection based on the multiple hypothesis testing and secondary feature selection via the greedy algorithm 17 to further refine the feature set. It is noted that: (1) in Figure 4, P1, P2 and P3 denote the probability associated with the hypothesis of Feature 1, Feature 2 and Feature 3 in the hypothesis testing, respectively; and (2) the entire process is realised in Python.
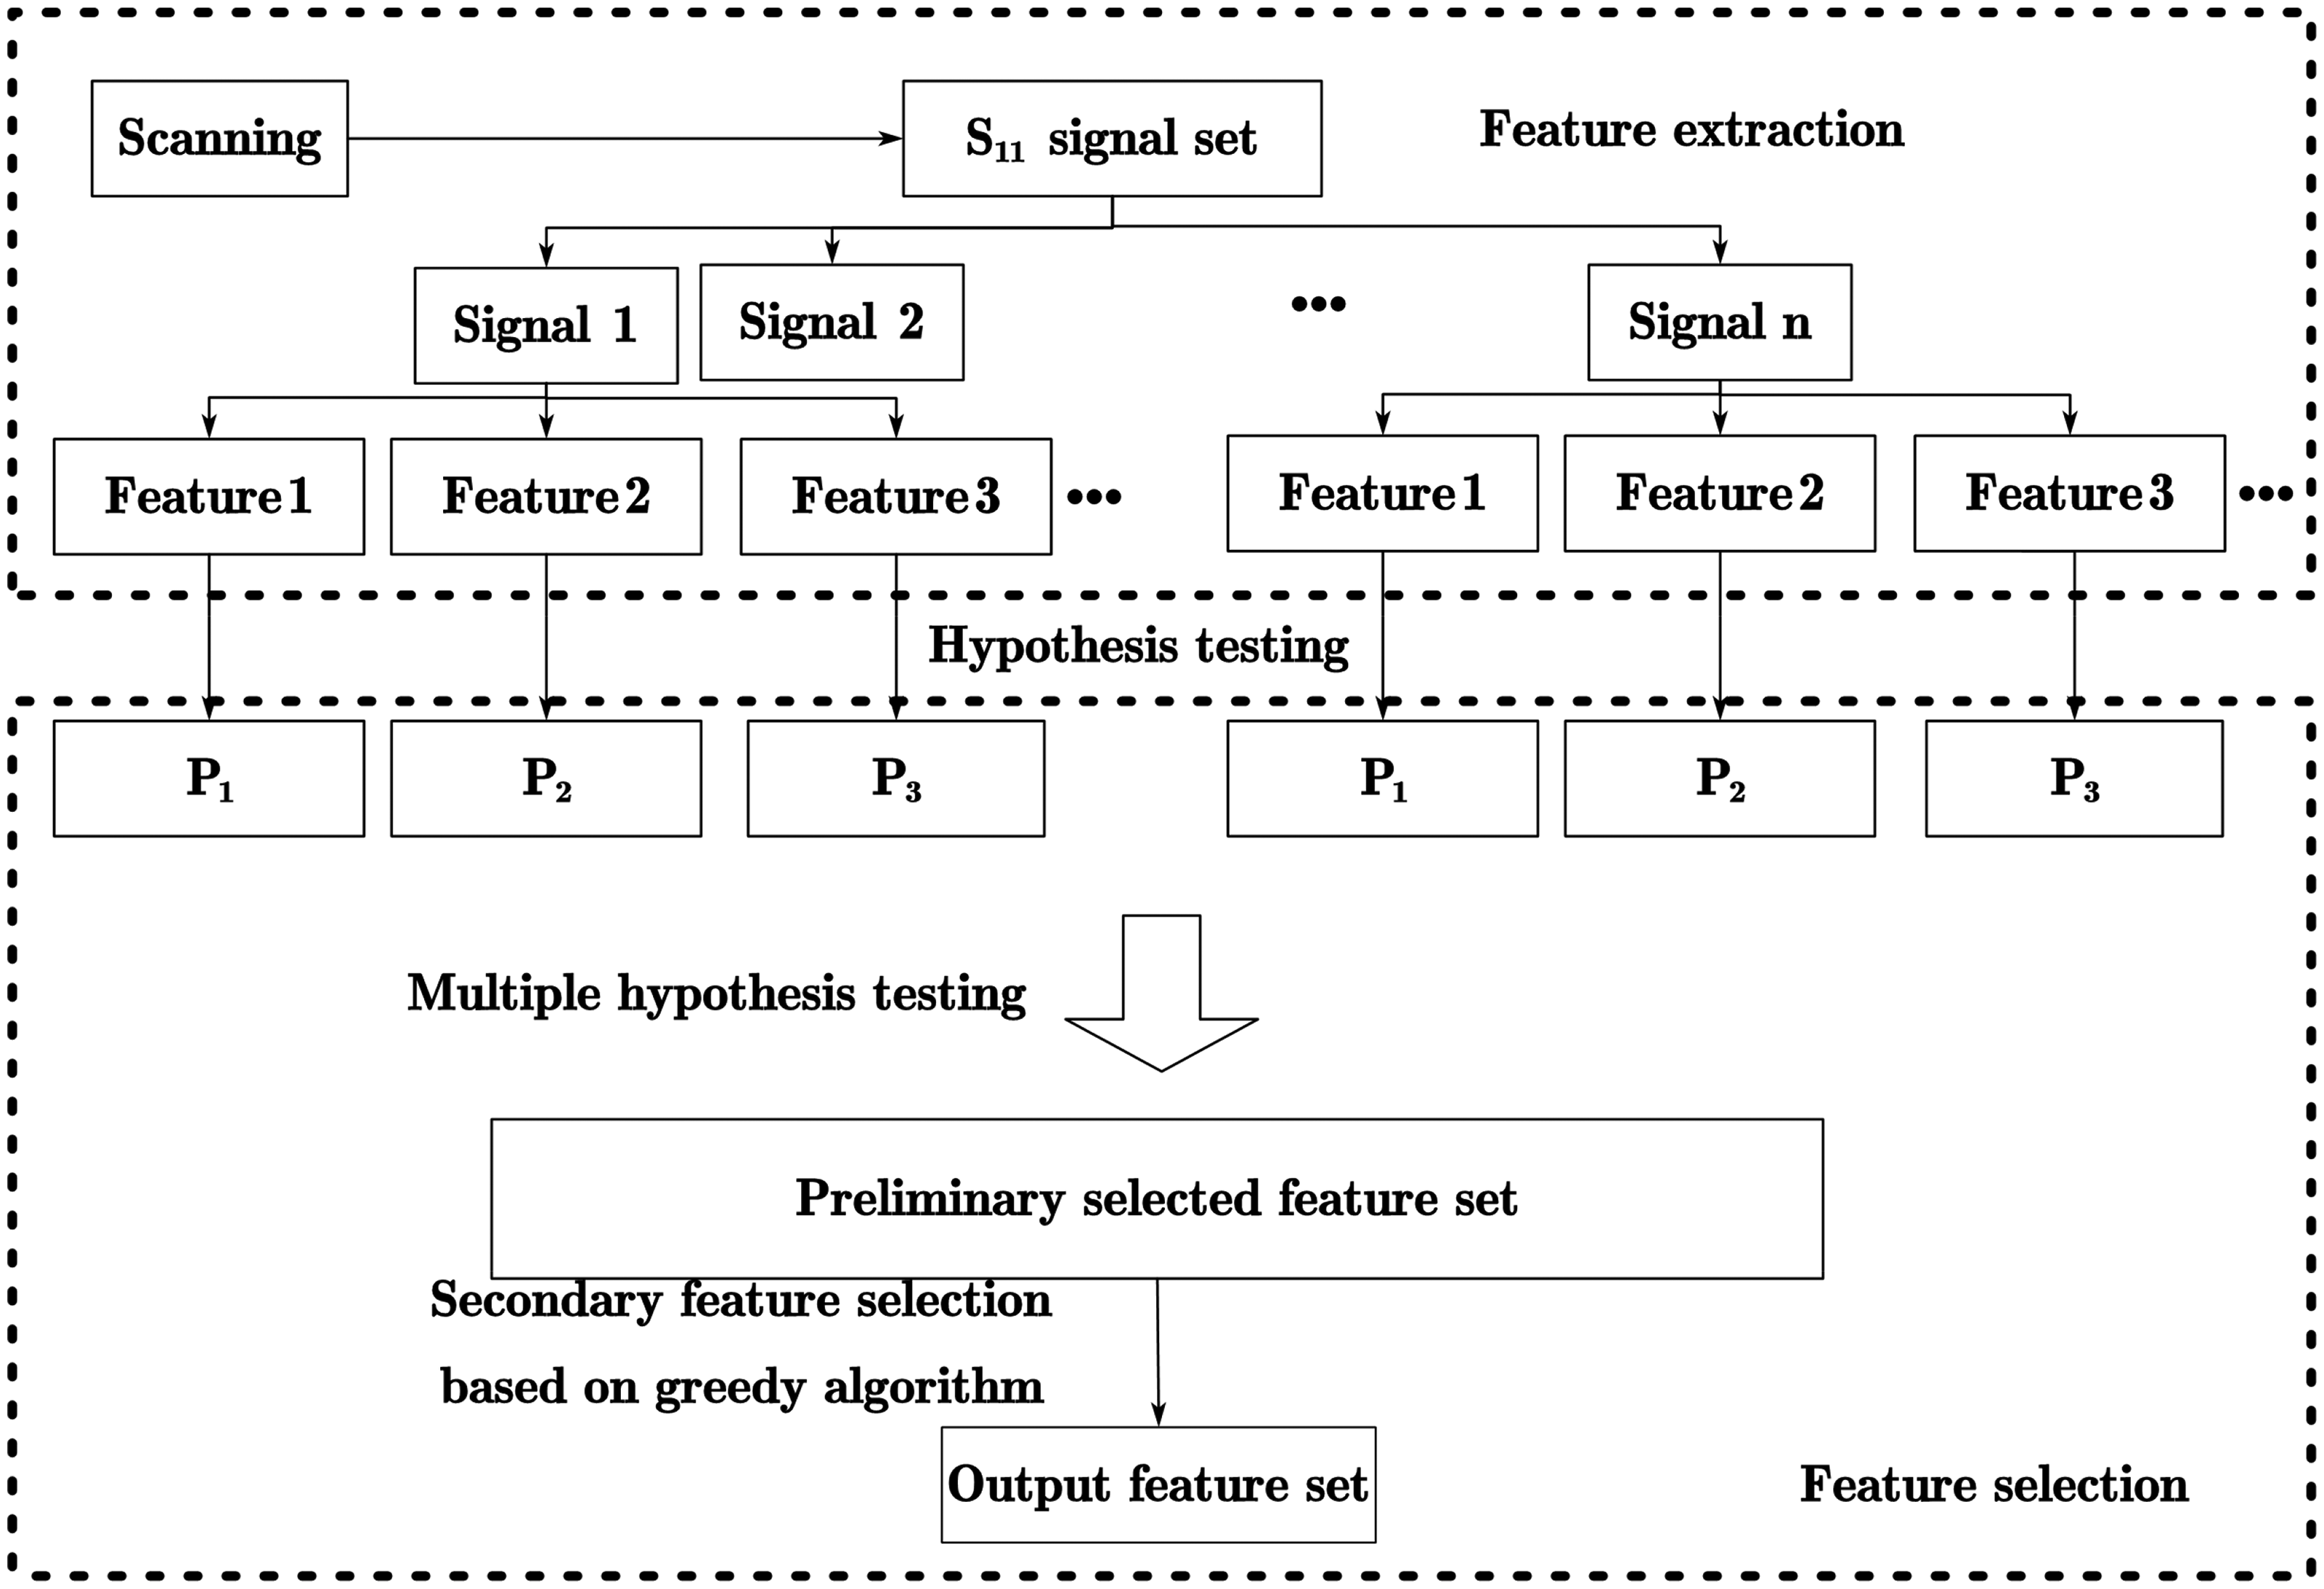
Schematic illustration of the process for feature extraction and selection.
As one of the built-in Python algorithms, “tsfresh” is normally preferred for feature extraction,
18
and thus used in the process. 787 signal features are thus extracted from the testing signal at a scanning position. The multiple hypothesis testing
19
is subsequently employed for the preliminary screening of the features. It is noteworthy that in the multiple hypothesis testing, the null hypothesis and alternative hypothesis are the vital hypotheses. They are expressed individually as: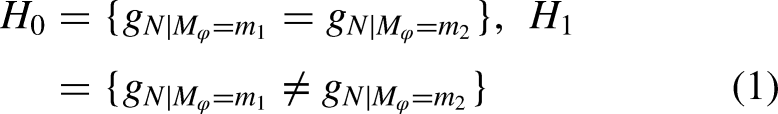
Based on the null hypothesis and alternative hypothesis, when the probability associated with a hypothesis (e.g., P1 or P2 in Figure 4) is less than the significance level, the hypothesis is invalid and thus rejected. Whereas, among all rejected hypotheses, it is inevitable that some hypotheses are mistakenly rejected. They are taken as the incorrectly rejected hypotheses. The expected ratio of the number of the incorrectly rejected hypotheses to the total rejection number is termed as the False Discovery Rate (FDR).
20
Note that FDR is deemed as a metric indicator for the cumulative statistical error, and written as:
After the preliminary feature selection, the greedy algorithm is adopted to further seek the most informative features. The process is initiated by identifying two feature groups. These features are then used as the initial set for the subsequent search. The process iterates until all features are obtained. After the features are selected, they are fed into the Random Forest (RF) 21 for training. The trained RF model is used to perform classification and pixel binarization for the validation set. The results of the RF model-based classification and pixel binarization of the validation set after feature selection are displayed in Figure 5(a). It is noticed from Figure 5(a) that a few points within the defect region are hardly identified. In a bid to enhance the identification accuracy for subsequent planar-dimension assessment of a BWD, the connecting processing algorithm is proposed. In the algorithm, the large connected region is identified as either the defective or flawless area whilst the small connected region is regarded as a “phantom” and given the identification result of its adjacent area.
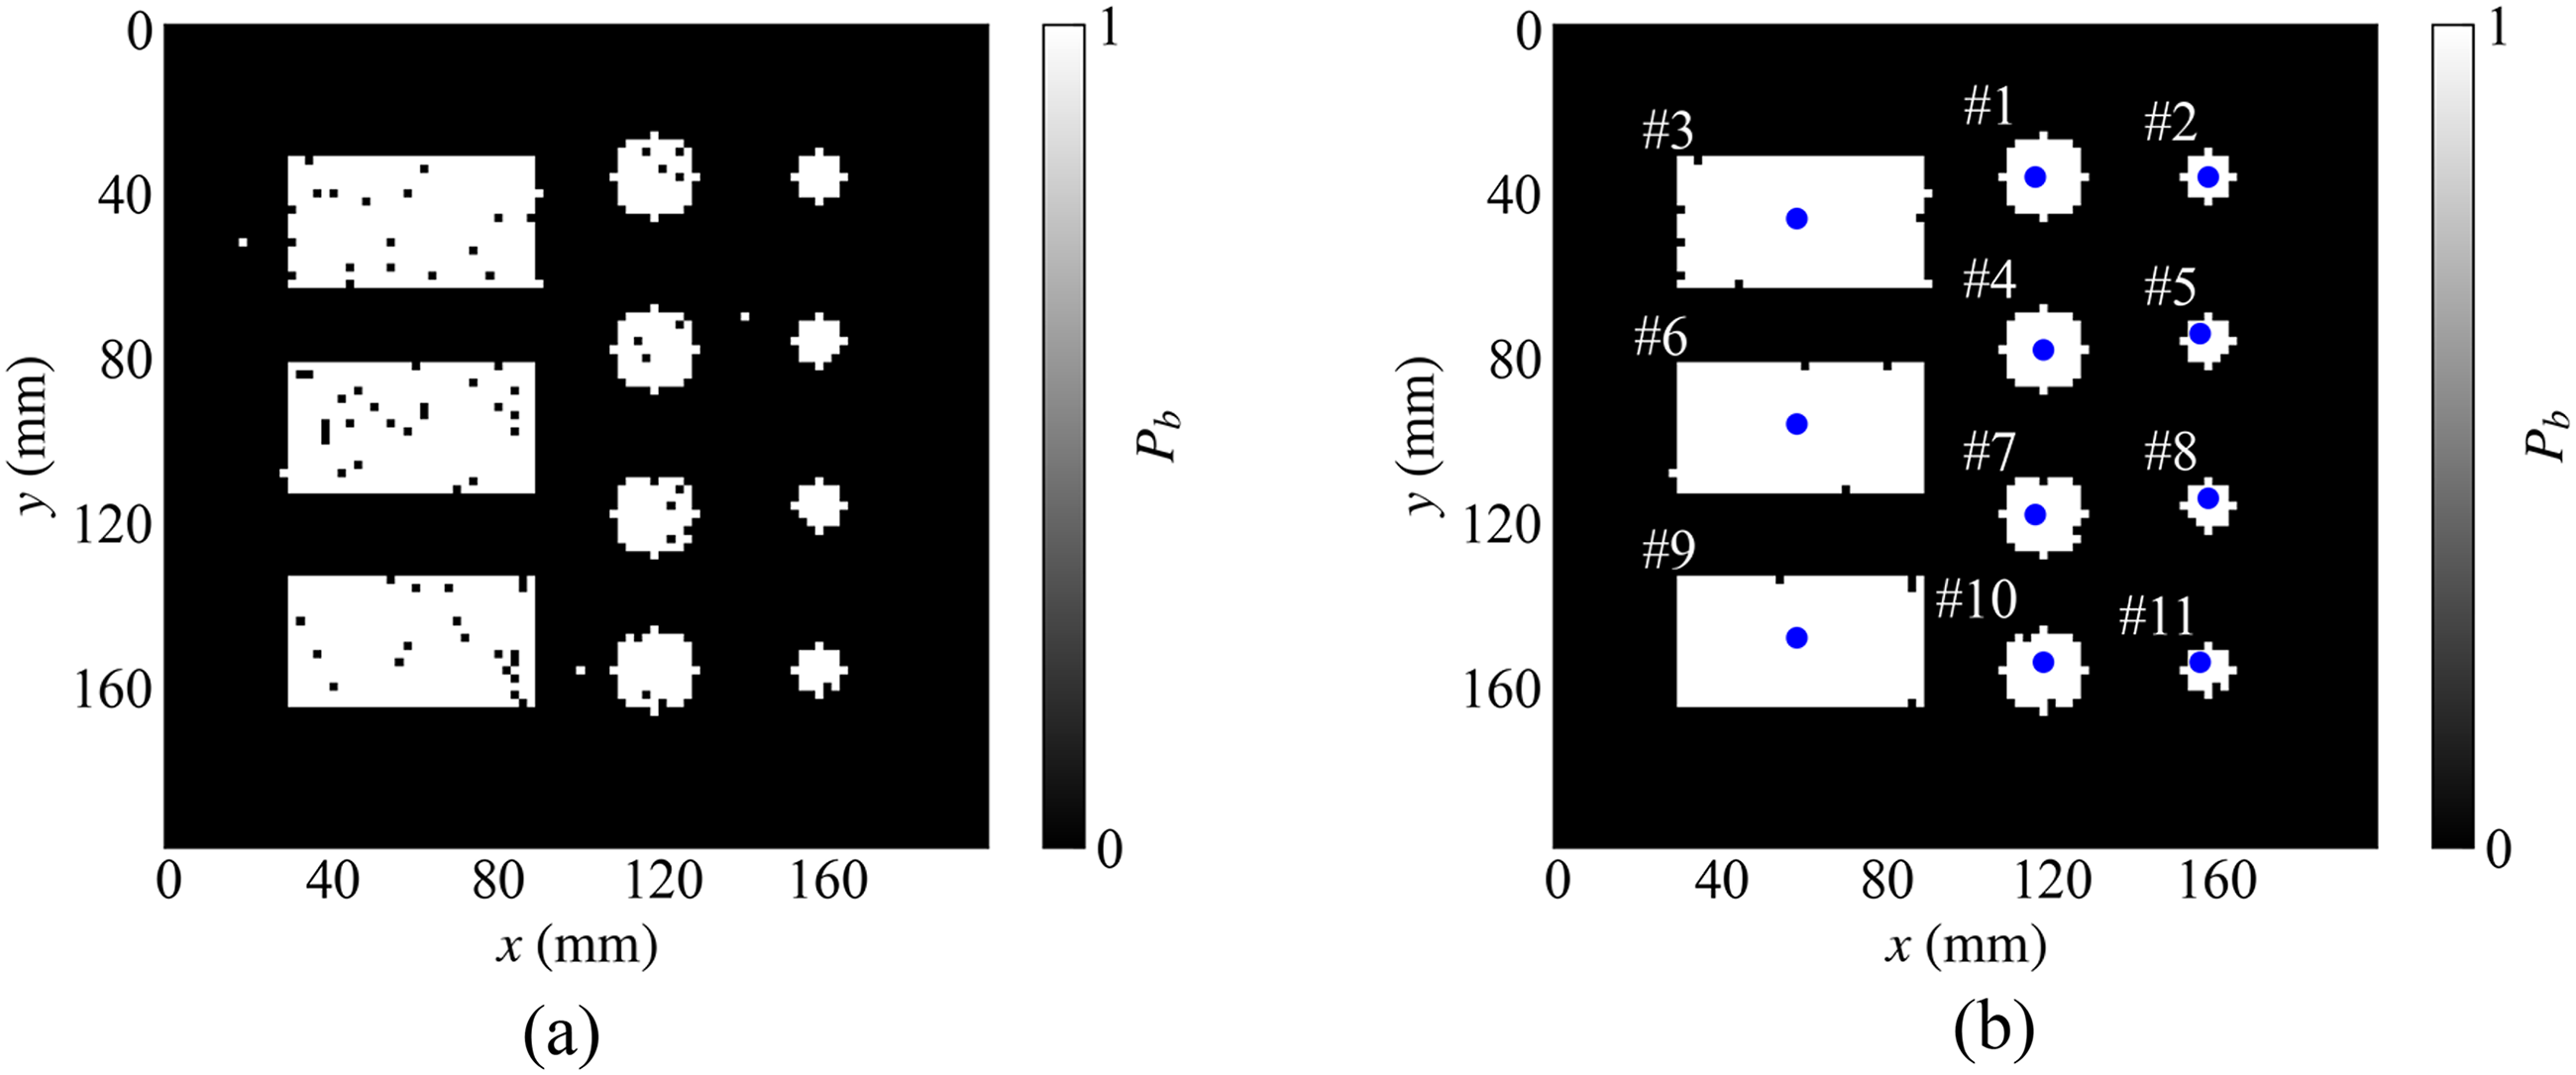
Defect-pixel binarization results of the validation set. (a) Binarized image after feature selection. (b) Binarized image with the connecting processing algorithm.
The binarization results after the connecting processing and the localisation of defect centres are illustrated in Figure 5(b). The binarized pixel value is denoted as a dimensionless parameter, i.e., Pb. The imaging results in Figure 5(b) are favourable for the planar-size evaluation and localisation of a BWD. The errors in the defect-area assessment and the positioning of the defect centre are calculated and tabulated in Table 2. As can be noticed from Table 2, the planar defect imaging is achieved by the proposed method along with the defect-area evaluation accuracy over 92% and centre-positioning error less than 1.5 mm.
Error regarding the BWD localisation and opening-area evaluation.
Localised BWD-depth evaluation based on the U-Net
Following the defect localisation and planar-size evaluation, a method for quantifying defect depth is demanded for three-dimensional reconstruction of BWDs. Addressing the issue of the defect-depth assessment, a depth-assessment method based on the U-Net is proposed. The schematic illustration of the method in portrayed in Figure 6.
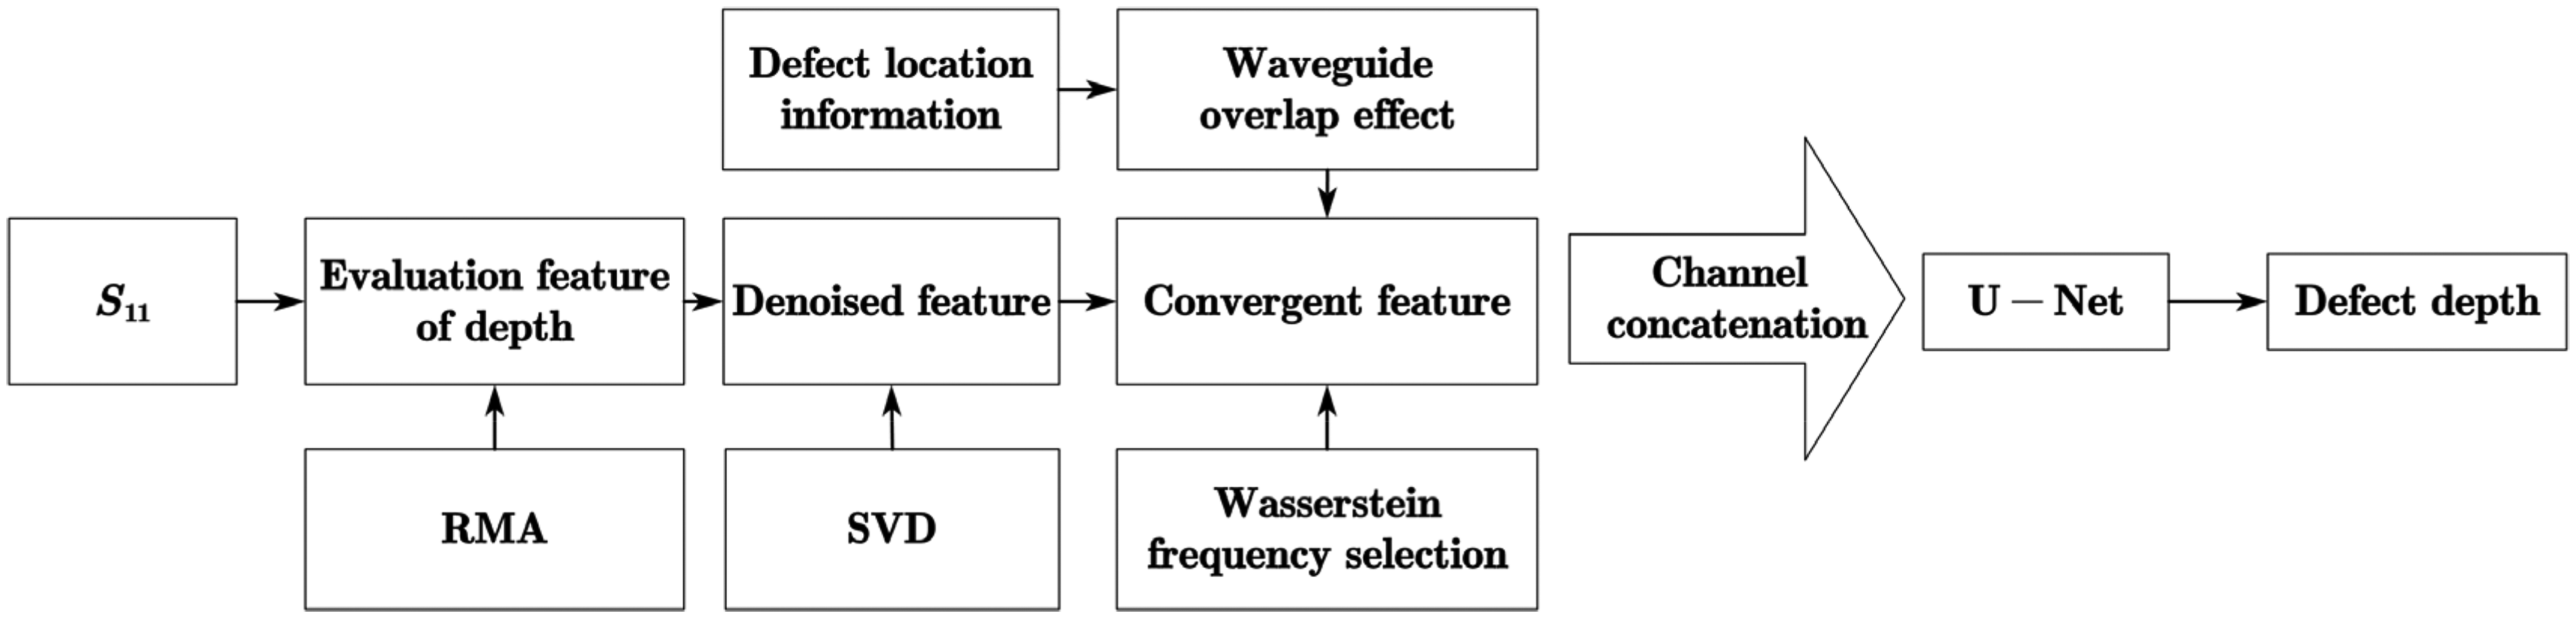
Depth-evaluation method for PE components subject to BWDs based on U-Net.
As shown in Figure 6, the testing signal is processed with the Range Migration Algorithm (RMA), 22 since it is believed that the processed signal is more closely related to the defect depth. The Singular Value Decomposition (SVD) 23 is subsequently utilised for signal denoising. Following this, the Wasserstein-based frequency selection method is proposed, and utilised to mitigate the distribution discrepancies between the training and validation datasets whilst the channel concatenation 24 is adopted to reduce the boundary-related errors. The RMA and SVD are realised by MATLAB while the Wasserstein-based frequency selection method and U-Net are programmed in Python.
Following the processing of the raw testing signal via RMA, by taking the sum of the RMA amplitudes at different frequency samples, the total RMA magnitude, i.e., SA is acquired, and taken as the feature for producing defect images. Note that SA is a dimensionless parameter. The defect images of two PE slabs are presented in Figure 7(a) and Figure 7(b). It can be observed from Figure 7(a) and Figure 7(b) that the BWD profile can hardly be recognised from the imaging results, due to the significant influence from the direct wave on the processed signal. This incurs the deteriorated defect information retrieved from the BWD image. In light of this, the SVD-based direct-wave suppression method 22 is employed to suppress the direct wave. The processed imaging results with the SVD-based direct-wave suppression method are exhibited in Figure 7(c) and Figure 7(d). Compared with Figure 7(a) and Figure 7(b), it is noticeable from Figure 7(c) and Figure 7(d) that the SVD-based direct-wave suppression method is applicable for enhancement of BWD-image quality together with the improved defect profiling.
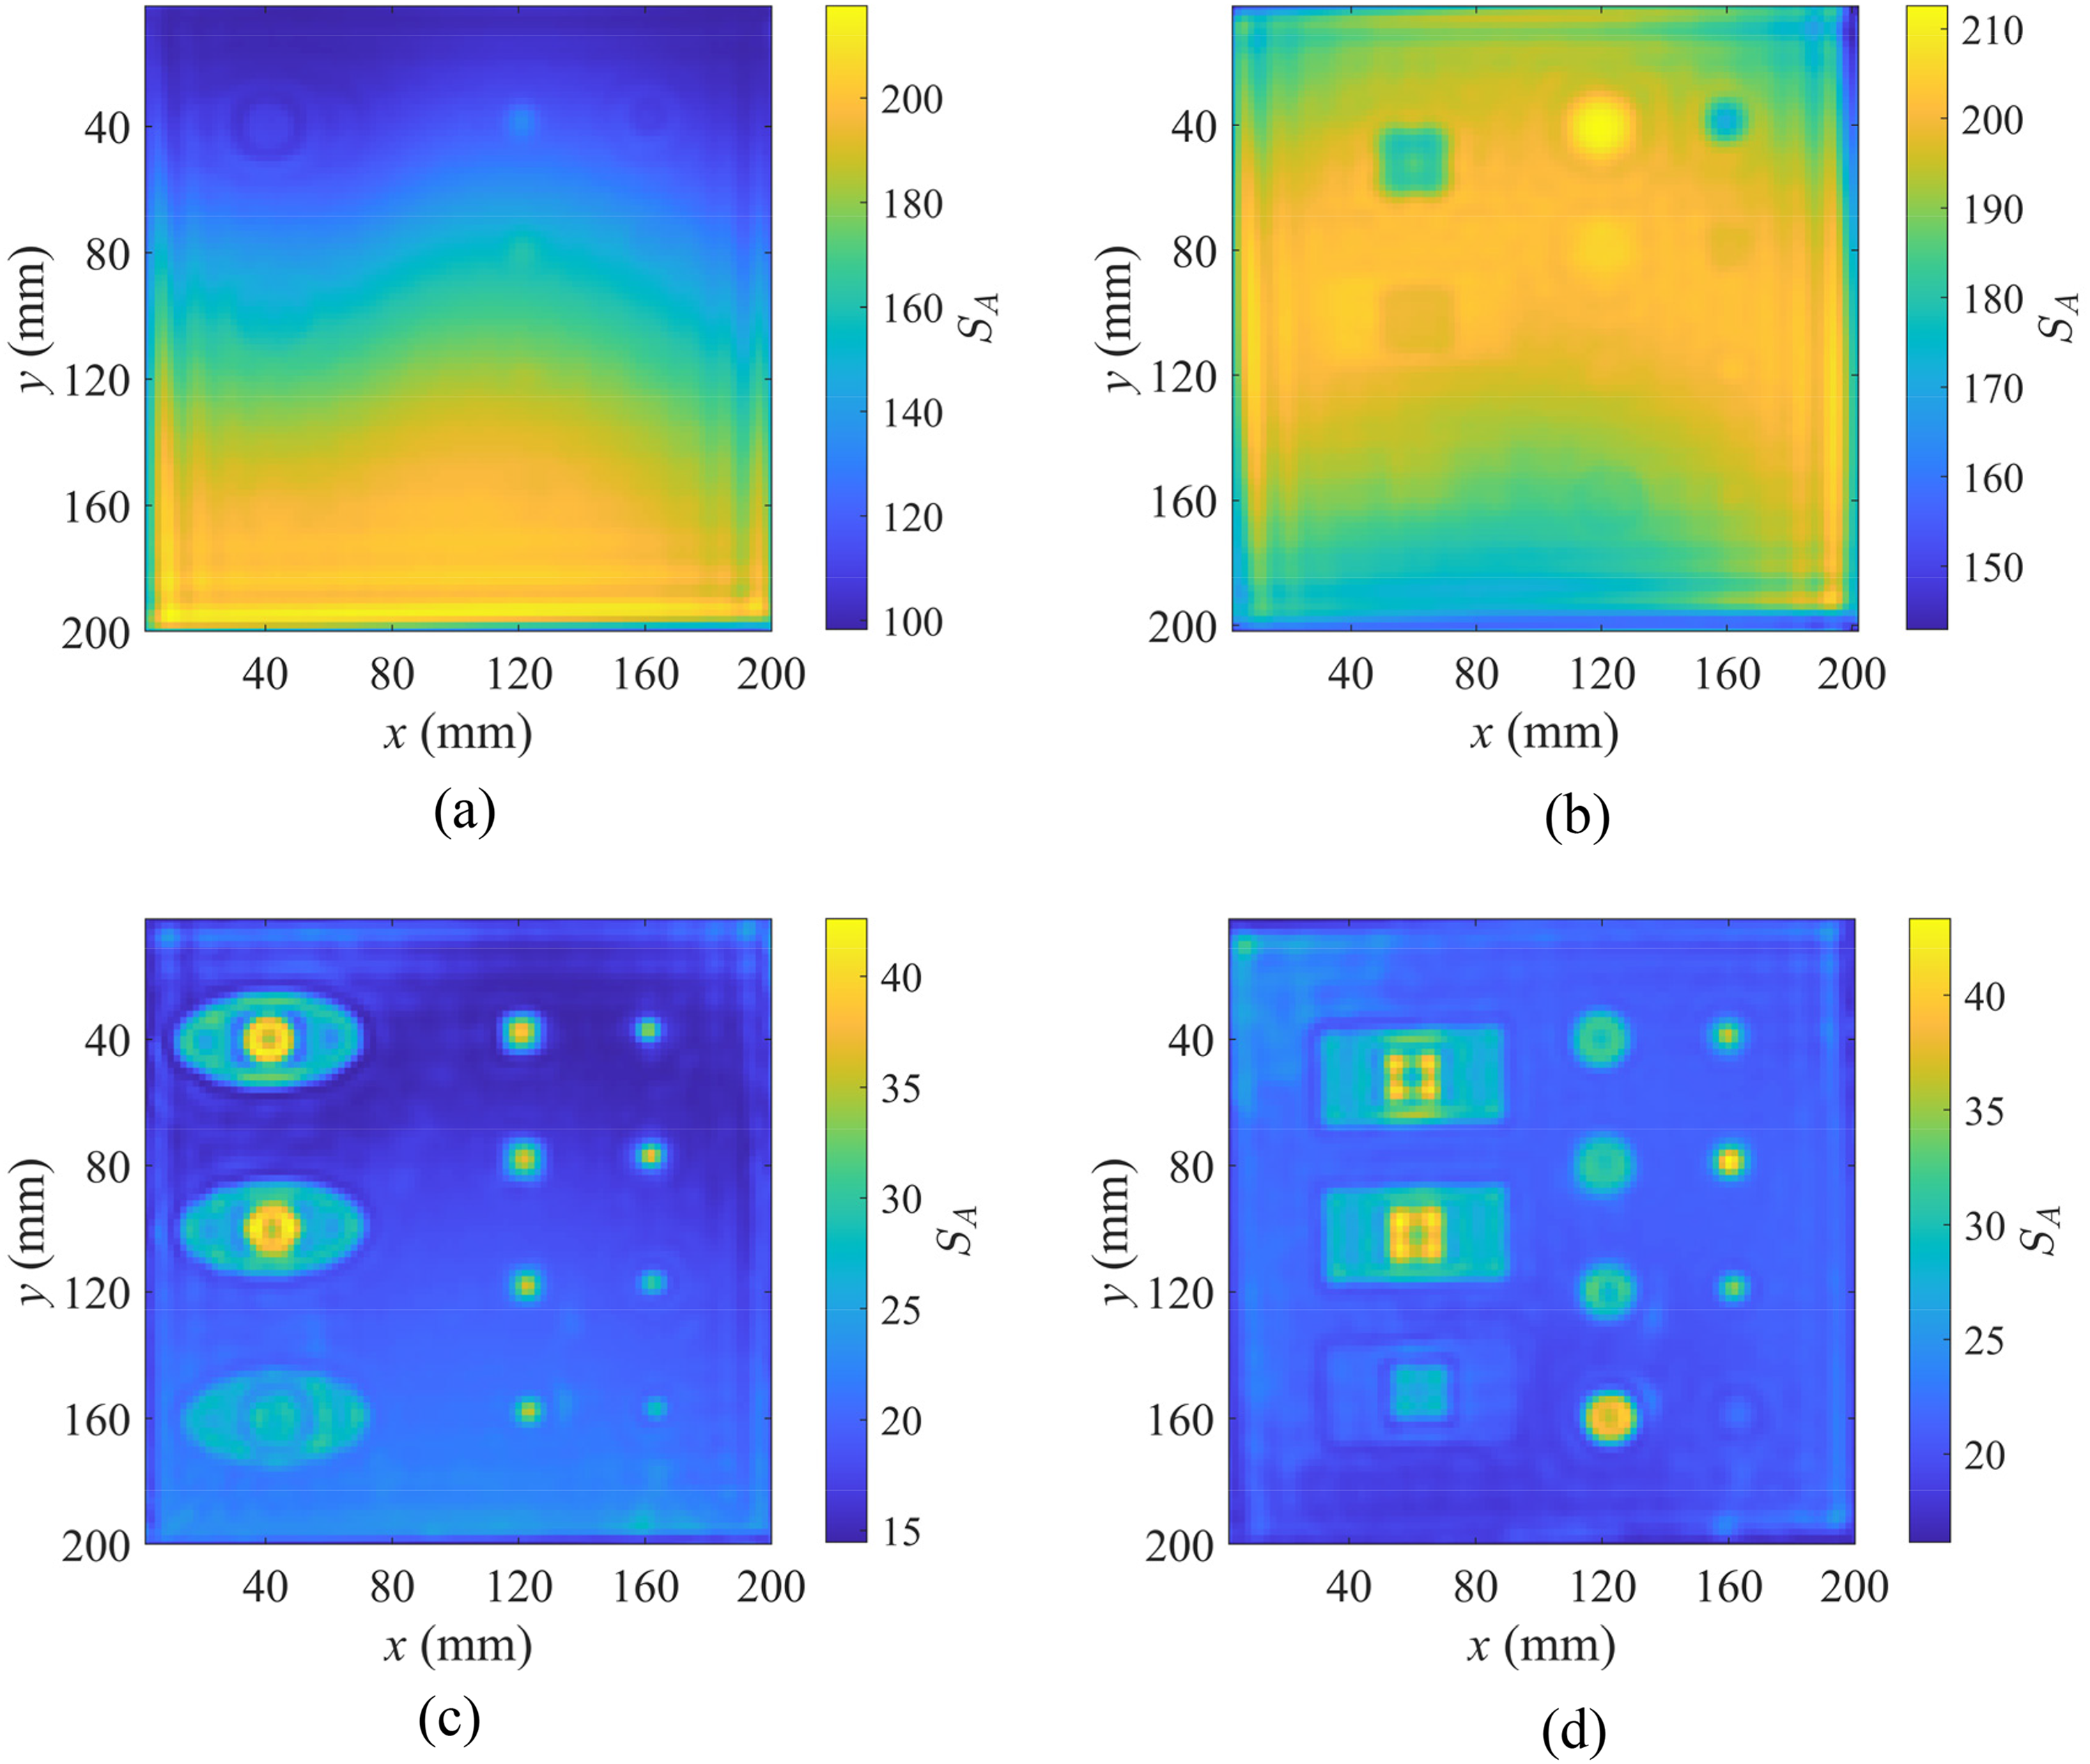
RMA-based imaging results with and without the SVD-based direct-wave suppression method for PE#1 and PE#2. (a) RMA-processed image for PE#1. (b) RMA-processed image for PE#2. (c) Processed image with the SVD-based direct-wave suppression method for PE#1. (d) Processed image with the SVD-based direct-wave suppression method for PE#2.
It is noteworthy that the distribution of the S11 magnitude at an excitation frequency (i.e., S11(fn), n = 1, 2, 3…1351) differs between the training and validation datasets. In an attempt to mitigate the influence of the distribution discrepancy, the Wasserstein-based frequency selection method is proposed to quantify the distribution differences. It is noteworthy that the Wasserstein distance (WP) is a pivotal parameter in the proposed method, and formulated as
25
:
It is noticed that during the defect assessment, errors occur significantly at the edges of defects. In bid to mitigate this issue, the influence of the overlapping area between the waveguide aperture and defect planar profile is taken into account to reduce boundary-related errors. The channel concatenation algorithm for merging the value of the overlap area and the matrix regarding the testing signal is illustrated in Figure 8. Note that in computation, the value of the overlap area is reshaped into a matrix with the dimension same as that of the testing signal. The reshaped matrix is subsequently concatenated with the matrix of the testing signal along the channel dimension. Following this, the concatenated matrix is fed into the U-Net model. Based on the aforementioned procedure, the U-Net model is trained by using the training set.
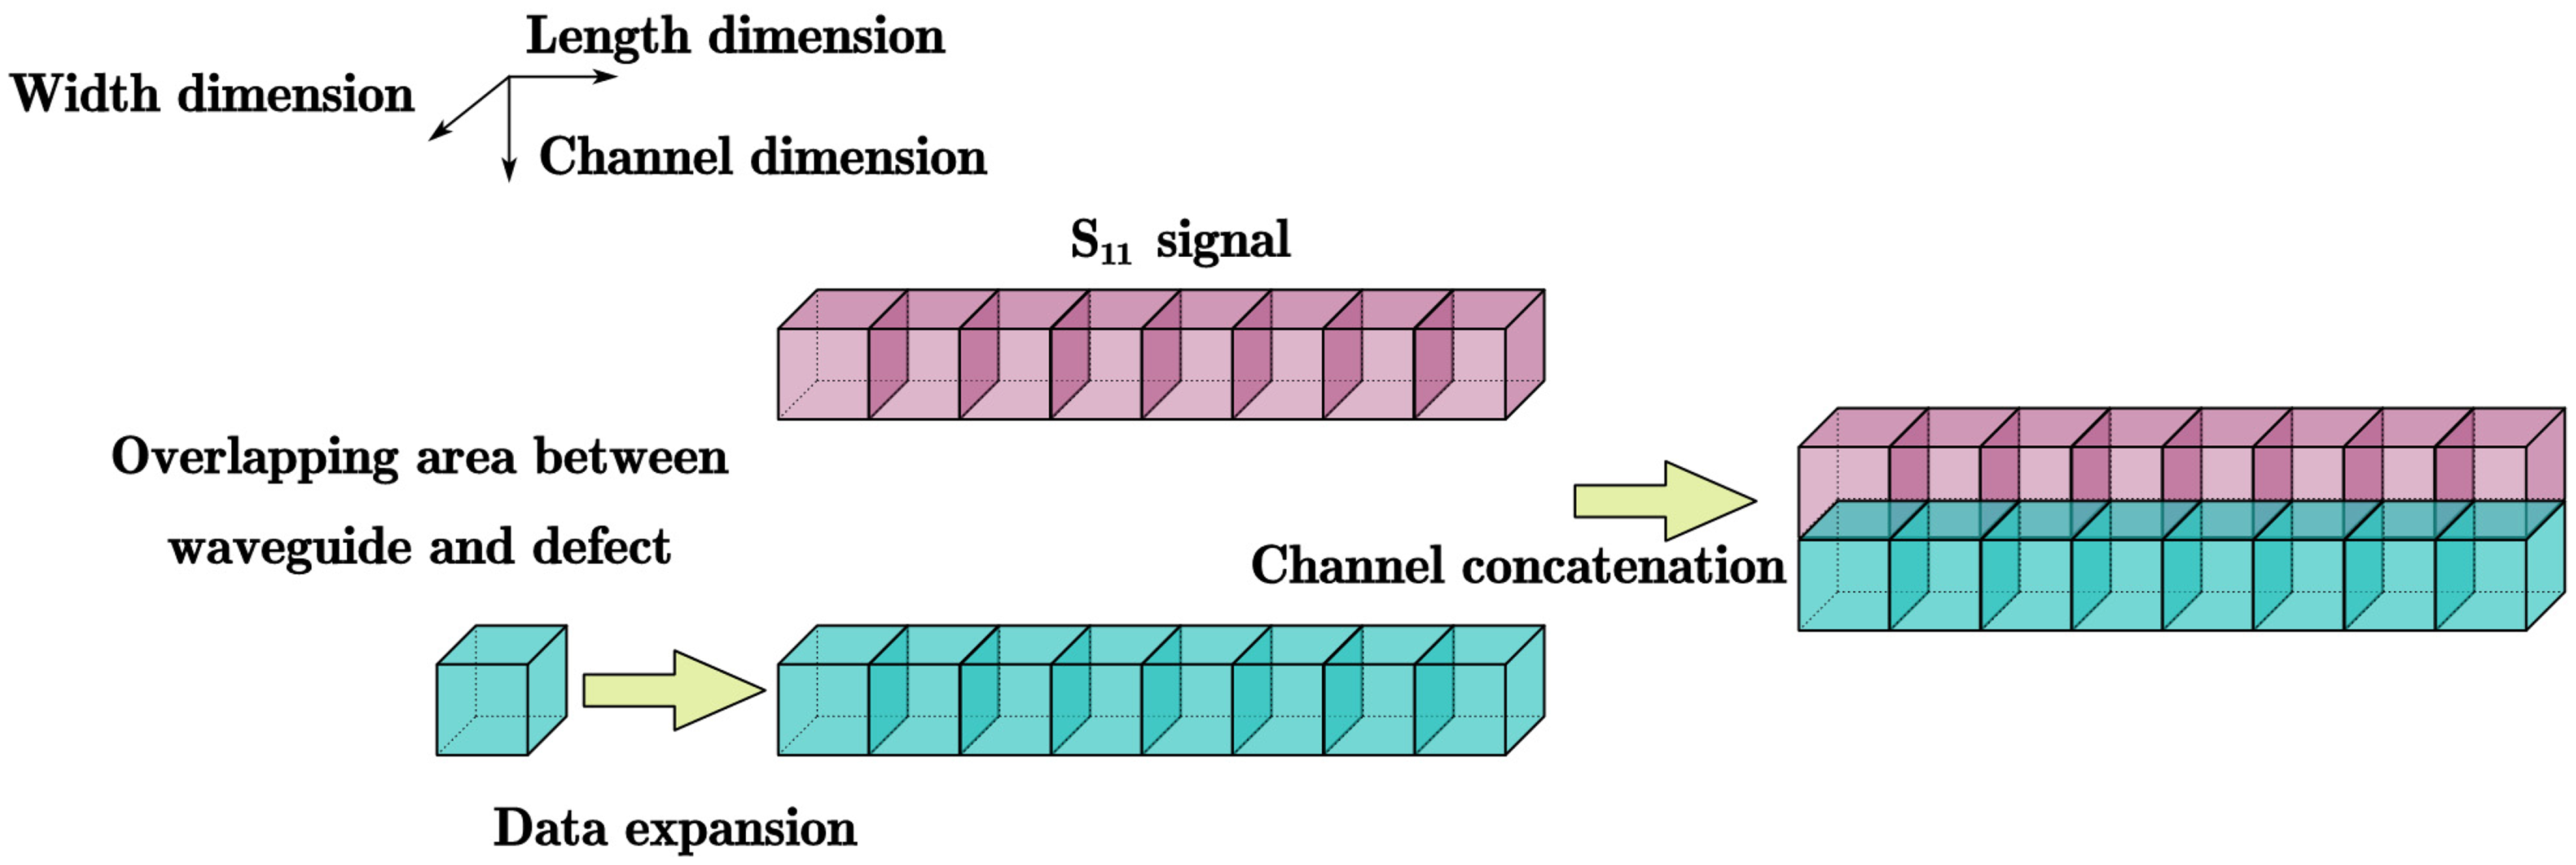
The overlapping area information channel concatenation.
By adopting the proposed U-Net-based depth-assessment method, the testing signals of the validation set corresponding to PE#2 are input into the trained U-Net model to obtain the localised depth in a BWD region. In conjunction with the binarization results in Figure 5(b) and localised depth-assessment results of the BWDs, the three-dimensional morphology of the BWDs in the PE slab can be recovered. The results are portrayed in Figure 9. As can be observed in Figure 9, for the BWDs with the depth larger than 2.0 mm, compared with the true value the accuracy of the approximated localised depth (d) is larger than 91.3%. This implies that the proposed methods are feasible and capable of effectively assessing the planar size and localised depth of the BWD in PE slabs. However, for a BWD with the depth of 2 mm, the relative error is relatively larger. This is mostly due to the limitations regarding the microwave wavelength and the waveguide aperture size.
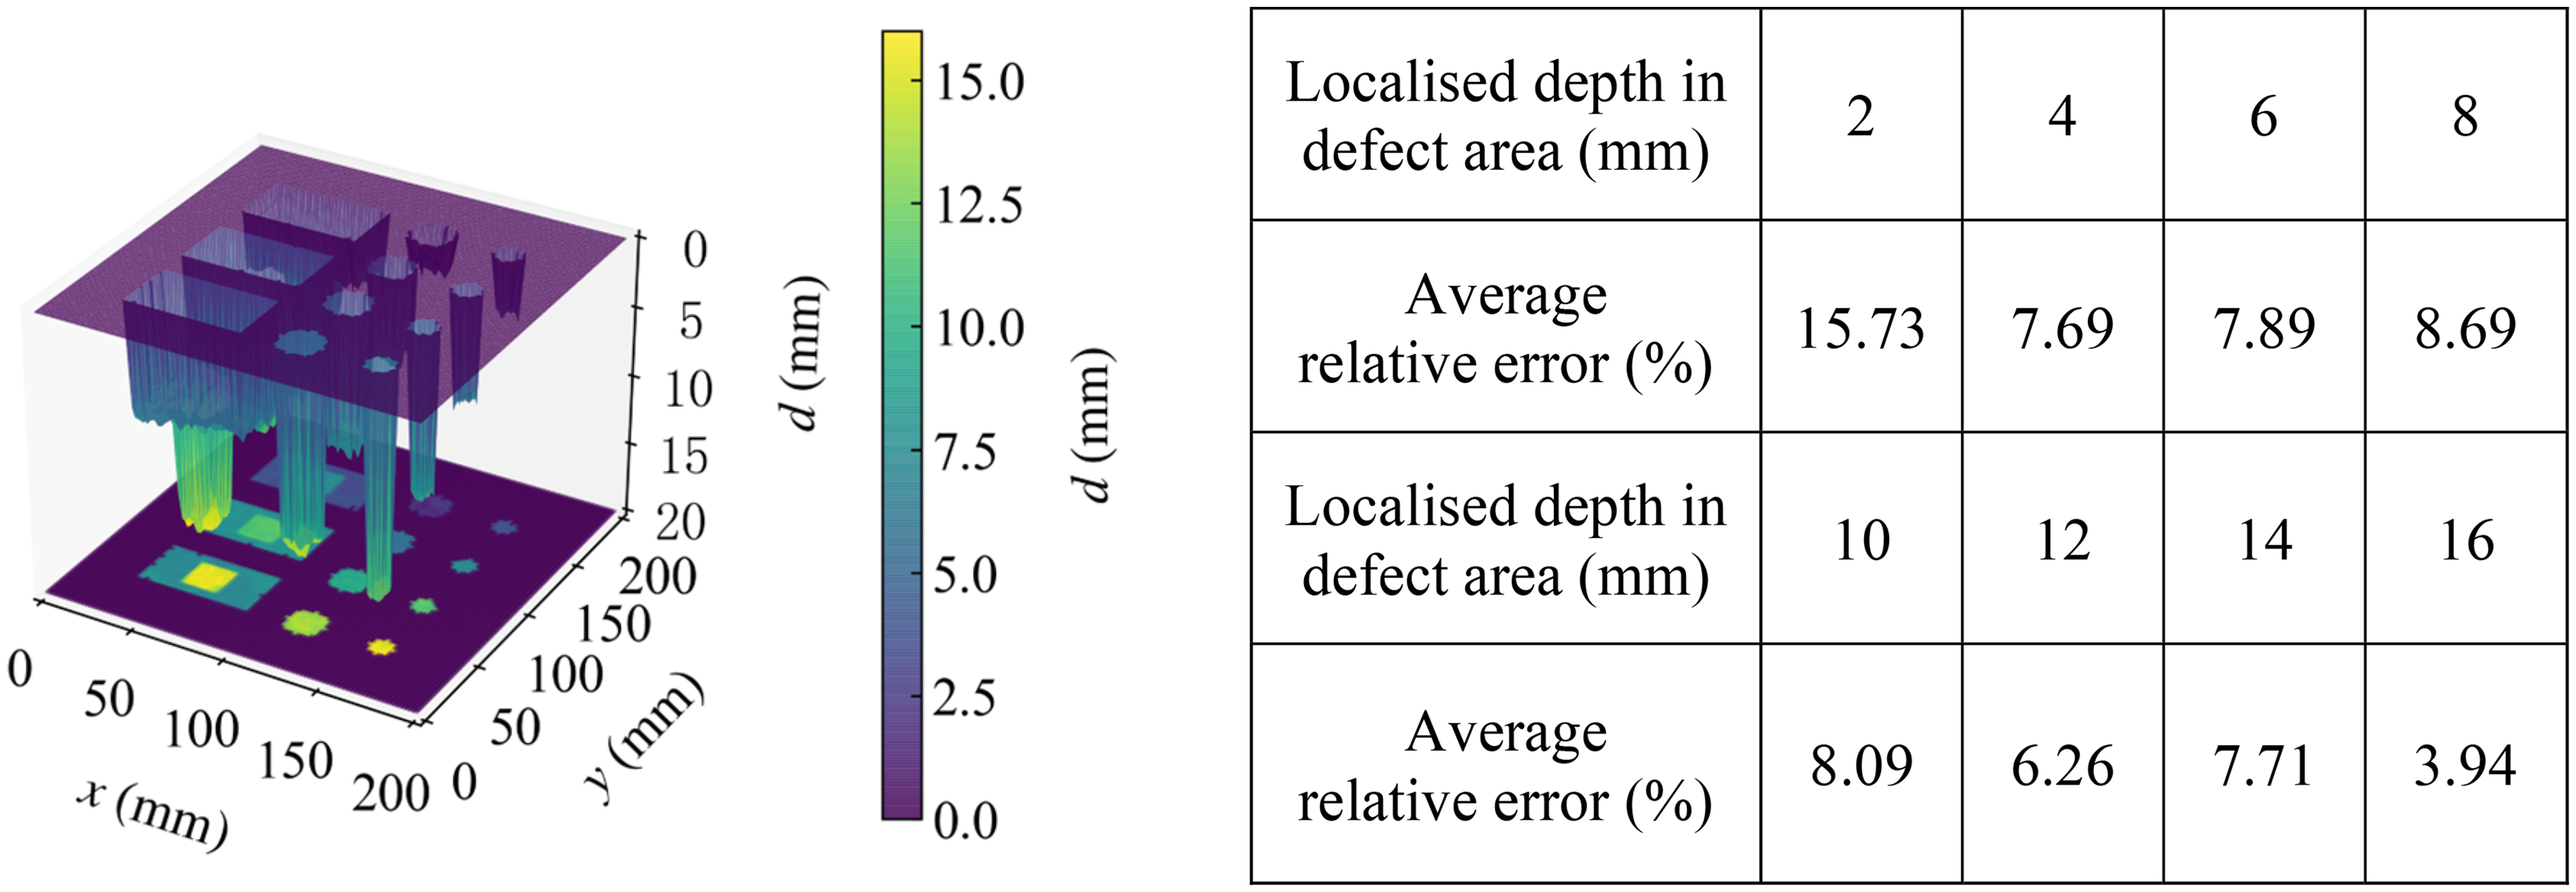
The three-dimensional morphology of PE#2 and and average relative error in the depth evaluation for the verification set.
Conclusion
In this paper, the imaging and 3D profiling of the BWDs in PE slabs with the Ka-band MWT are intensively investigated via experiments. The MWT system for the co-polarisation microwave reflectometry has been established. Following the 2D scanning of the PE specimen, based on the testing signal at each scanning position, the multiple hypothesis test and greedy algorithm are employed to seek the most informative features for localisation and opening-area estimation of each BWD. The binarized BWD image is produced with RF alongside the selected features. Based on this, the BWD planar area can be estimated with the average relative error of 3.83% while the error regarding the localization of the BWD central point is less than 1.5 mm. For localised BWD depth assessment, a tri-component signal pre-processing strategy is proposed alongside the SVD, the channel concatenation and Wasserstein-based frequency selection. In regard to the localized depth of the BWD, the average relative error of the estimated BWD depth is 8.25%. This indicates that the proposed method successfully achieves three-dimensional defect size assessment for the BWD.
Nevertheless, it should be pointed out that the presented research is still subject to the technical limitations including: (1) the relatively large discrepancy in assessment of the BWD with its diameter smaller than 2.0 mm, due to the physical constraints such as the microwave wavelength and probe size; and (2) the influence from the lift-off variations during the probe scanning on the imaging results. These drawbacks have opened the door for optimisation of the proposed method in the follow-up investigation. The related research would be beneficial to MWT-based inspection and visualisation-based evaluation of wall-thinning defects hidden within such engineering PE components as the roadbed, anchor plate and pipe, etc.
Footnotes
Acknowledgements
The authors would like to thank the National Natural Science Foundation of China (Grant numbers: 52577013 and 52577014) for funding this research.
Funding
The authors disclosed receipt of the following financial support for the research, authorship, and/or publication of this article: This work was supported by the National Natural Science Foundation of China, (grant numbers: 52577013 and 52577014).
Declaration of conflicting interests
The authors declared no potential conflicts of interest with respect to the research, authorship, and/or publication of this article.