
Abstract
In the era of artificial intelligence, the traditional English teaching model can no longer meet the needs of society, and online English teaching has become the main development direction of English teaching in the future. In order to study the efficiency of English online teaching system, based on machine learning algorithms, this paper constructs an efficiency improvement model of English online teaching system. Moreover, in view of the shortcomings of current situation estimation algorithms that cannot coexist in terms of flexibility, causal interpretability and complexity, this paper proposes a biological immune algorithm framework that uses GBDT algorithm coding, which objectively and accurately shows the spread of the situation. In addition, for the problem that redundant information between features will reduce the accuracy of the framework, this paper proposes a streaming feature selection algorithm based on bagging learning. Finally, this paper designs a control experiment to analyze the performance of the model. The research results show that the model constructed in this paper is highly reliable.
Introduction
The future development prospects of the online English learning system are broad, and this paper will provide help for related research. The specific plan for the future research content is to design a network English online learning system by stimulating the students’ inner learning motivation. To this end, we use in-depth research and application of a series of strategies to motivate, maintain and enhance students’ learning motivation. Through the interaction of the network English online learning platform, students can use computers to realize human-computer interaction. The improvement of students’ interest in learning will further realize students’ active participation in learning, and then better change their own learning habits. According to the learning attitude, learning characteristics and learning progress of different students, by formulating suitable and suitable learning methods for students and creating a good learning environment, it can lay a theoretical foundation for the research and development of online English learning systems [1].
In modern society, network technology is increasingly developed, and networked learning will be the global learning trend. By analyzing relevant research works at home and abroad in recent years, it can be found that some large training institutions have gradually introduced English online learning and training models. Moreover, they began to develop a variety of network databases to manage the teaching content and use a variety of tools to assist in learning and teaching activities [2]. Online learning can share information and resources. In teaching, we can use the Internet to search for the latest and most advanced teaching materials. This is very convenient for scholars to easily master the latest knowledge. Therefore, online teaching is also a beacon of reform. What learners need is an autonomous learning environment, and the combination of the Internet and teaching just provides a new learning environment that is not restricted by time and place. It can increase students’ interest in autonomous learning and can also challenge the use of knowledge learned to experience life in different environments, help them solve practical problems, and improve the quality of teaching. The rapid development of online teaching has promoted the perfect development of teaching concepts [3].
For now, both home and abroad are paying close attention to networked education, and in-depth research has been carried out on all factors affecting network courses, learning tools, environment and so on. Autonomous learning theory is the central idea of network teaching design, and learners design learning models exclusively. Autonomous learning is the biggest feature of network teaching, so the basic structure and function of the network are also designed reasonably around the learners’ own needs. The campus network is gradually established, the Internet is gradually popularized, and network teaching has slowly developed in the context of such an era’s progress. This is reflected in the change of network multimedia teaching from classrooms to computer classrooms, and network teaching is widely used in education and teaching.Online teaching has strong interaction compatibility with traditional teaching. Students can use network equipment to simply operate to obtain network resources and discuss and ask questions spontaneously. Moreover, students can participate in learning instead of just listening and watching, and they have the spatial power to choose the content and progress of learning during the learning process.
Related work
Students’ learning behavior is tracked and recorded in real time using mobile devices, and a web-based online learning platform is established. Moreover, the behavioral data learned by students using mobile communication devices will be transmitted to web servers and databases. At the same time, teachers or administrators can obtain students’ learning content, learning feedback, self-evaluation, and online homework through log records, and form timely feedback and evaluation to students based on this [4]. In addition, in order to simplify the teaching process, the United States has also created an online student performance management platform Engrade, which includes 9 major functions such as testing, management, homework, and evaluation. Teachers can check the learning status of students at any time and adjust the teaching plan accordingly, which enables the reuse of teaching resources and improves teaching efficiency [3].
The literature [4] used the distance education network teaching platform to conduct empirical research, studied the relationship between the teacher-student interaction rate and the cumulative online learning time and the cumulative number of online learning, and listed some issues worthy of discussion. The literature [5] used a questionnaire survey to analyze the problems existing in the online security learning process of college students (less learning and more entertainment, lack of learning resources, lack of teacher guidance). Moreover, it discussed the main factors affecting college students’ online learning behaviors (insufficient computer skills of students, low network literacy of teachers, lack of online learning resources), and proposed corresponding improvement strategies (online quality education, strengthening informatization construction, network teaching training).
Educational psychology divides people’s learning behavior into two big dimensions. Explicit behaviors are behaviors that we can directly observe and record, while implicit behaviors are behaviors that are performed externally based on the ideas of the inner world. It can be seen that the recording of online learners’ learning behavior mainly relies on online learning platforms to record students’ explicit learning behaviors (learning time, learning progress, discussion and exchange, homework, testing, Q&A, etc.) to the network server and database through the Internet. After that, the teacher obtains the learner’s learning behavior from the log records in the background of the learning platform. However, the implicit learning behavior of students is usually obtained by questionnaire survey [6].
The literature [8] designed a personalized learning system. This system uses a fuzzy reasoning mechanism to infer the strength of the learner’s learning ability based on the learner’s response to the courseware learning, so as to recommend the learner’s learning courseware with a degree of difficulty consistent with the learner’s learning ability. Through the order of nodes browsed by learners and related links opened during online learning, the literature [9] analyzes learners’ learning preferences and learning styles and recommends corresponding learning content. The literature [10] proposed a recommendation system for the learning process of smart learning spaces. The entire system is divided into four layers. The first two layers are mainly responsible for the collection and classified storage of learners’ online learning behavior data. Moreover, the third layer is responsible for analyzing the data obtained from the first two layers to calculate learner similarity, and the fourth layer is to recommend learning paths and personalized services to learners based on the results of calculation and analysis. The literature [11] elaborated on the idea of constructing a personalized learning system based on smart learning theory and learning analysis theory and constructed a personalized online learning system. It is not difficult to see that the literature dedicated to the study of personalized learning resources and intelligent services promotes learners’ learning behavior from two routes. The first is to improve the online learning environment and learning resources to meet the learning needs of learners, and the second is to provide learners with personalized learning resources, learning paths, learning strategies and learning interventions through the creation of a personalized learning service platform [12].
The literature [13] proposed a series of models for learning behavior analysis. For example, the OCCP classification model divides learning behavior from low-level to high-level into four levels, namely, operation, cognition, collaboration, and problem solving; S-F-T three-dimensional classification model is divided into structure, function, and method; the conceptual model of the online learning behavior system is divided into elements, description, classification, influence, data acquisition, analysis, and research significance; the network learning information model realizes XML binding, and finally the network learning prototype system is designed and developed and put into practice and application demonstration model. The literature [14] analyzed the shortcomings of the existing learning behavior analysis model, that is, does not reflect the process description of online learning analysis, and built a network that is divided into data layer, mechanism layer, and result layer from the bottom up. The data layer is responsible for collecting data generated or released by learners and forming a behavior feature library. The literature [15] built a cyclic and iterative online learning intervention model based on the traditional response to Intervention (RTI) model that includes five elements: screening, monitoring, multi-level intervention, decision-making, and analysis. Moreover, it used experiments to test the effectiveness of the algorithm, and after screening the learning behavior data of online learners, it predicted learners who may be at risk to make appropriate interventions.
Gradient boosting decision tree (GBDT) related concepts
Gradient boosting decision tree is a representative algorithm of machine learning boosting method. Boosting method is a learning method based on the development of statistical theory, and it is widely used in various fields. The Boosting algorithm assigns a weight coefficient to each sample. At the same time, it also trains and learns multiple base classifiers, and synthesizes multiple base classifiers into one by linear combination, thereby improving the accuracy of the model in recognition.
(1) Adaboost algorithm
There are many ways to improve, and the Adaboost algorithm is the most widely used. For a binary classification problem data set [16], there is:
Among them, x i ∈ χ ⊆ R n represents the feature of the sample, y i ∈ γ = { - 1, + 1 } is the label of the sample, χ is the feature space. At the same time, γ is the data label. The Adaboost algorithm will learn different base classifiers from the given training data set, and these base classifiers will be weighted and summed into a strong learning classifier.
The main steps of the algorithm are as follows [17]:
Each training sample is assigned the same weight coefficient:
N represents the total number of samples in the training set.
1. For m = 1, 2, ⋯ , M, there is
A. The sample data with weight distribution D
m
is trained to learn a weak learning classifier:
B. The current judgment error rate of G
m
(x) weak classifier is:
C. The weight factor of G
m
(x) weak classifier is:
D. The weight factor of the weak classifier is:
In the formula, Z
m
is a normalization factor.
2. Weighted summation of weak classifiers
The final strong learning classifier is obtained
(2) Boosting tree algorithm
The boosting algorithm of the weak classifier using the decision tree model is called the boosting tree algorithm. The basic classification model is also weighted and summed into a strong classifier model, and the forward distribution algorithm is introduced.
The boosted tree is represented by a linear combination of a series of decision trees [18]:
Among them, T (x ; Θ m ) represents the basic weak classifier, Θ m is the parameter of the basic weak classifier, and M is the number of the basic weak classifier.
The boosting tree adopts the forward distribution algorithm. First, the basic decision tree model f0 (x) = 0 is initialized, then the basic decision tree model of the m-th step is:
Among them, fm-1 (x) is the basic classifier at the current moment, and the parameter Θ
m
of the basic classifier at the next moment is determined by minimizing the experience risk:
Different loss functions are selected to solve different problems of lifting tree algorithms. Commonly used functions include square error function and exponential loss function.
Function and exponential loss function.
If a training data set T ={ (x1, y1) , (x2, y2) , ⋯ , (x
N
, y
N
) } is given, x
i
∈ χ ⊆ R
n
represents the input feature, and y
i
∈ γ ∈ R is the output. At the same time, χ is the feature space and γ is the data label. For a weak classifier, if the feature space χ is divided into J non-overlapping spaces R1, R2, ⋯ R
J
through training and learning, each space will output a constant C
j
as the regression prediction value under the feature space. Then, the decision tree of the weak classifier can be expressed as:
Among them, Θ represents the model parameters of the weak decision tree, and J represents the number of leaves on each tree.
1. f0 (x) = 0 is initialized
2. For m = 1, 2, ⋯ , M, there is
(A) The residual value of the current weak classifier fitting data is calculated
(B) By fitting the residual value, a new weak classifier is learned, that is, T (x ; Θ m )
(C) The strong classifier model is updated
3. The boosted tree classifier is as follows:
(3) Gradient boosting tree (GBDT) algorithm
The difference between the gradient boosting tree and the boosting tree is that the gradient boosting tree uses the negative gradient value of the loss function when fitting the residual value of the data in formula (14) (that is, the fastest gradient descent algorithm).
is approximately the residual of the model. Adopting this method not only improves the training speed of the model, but more importantly, when the loss function is not an exponential loss or a square loss, each step of the traditional method is very difficult to optimize. However, the gradient boosting method can be easily solved.
Based on the biological immune algorithm, this paper proposes a framework structure for situation estimation, and the resulting framework structure flow chart is shown in Fig. 1 [19]:
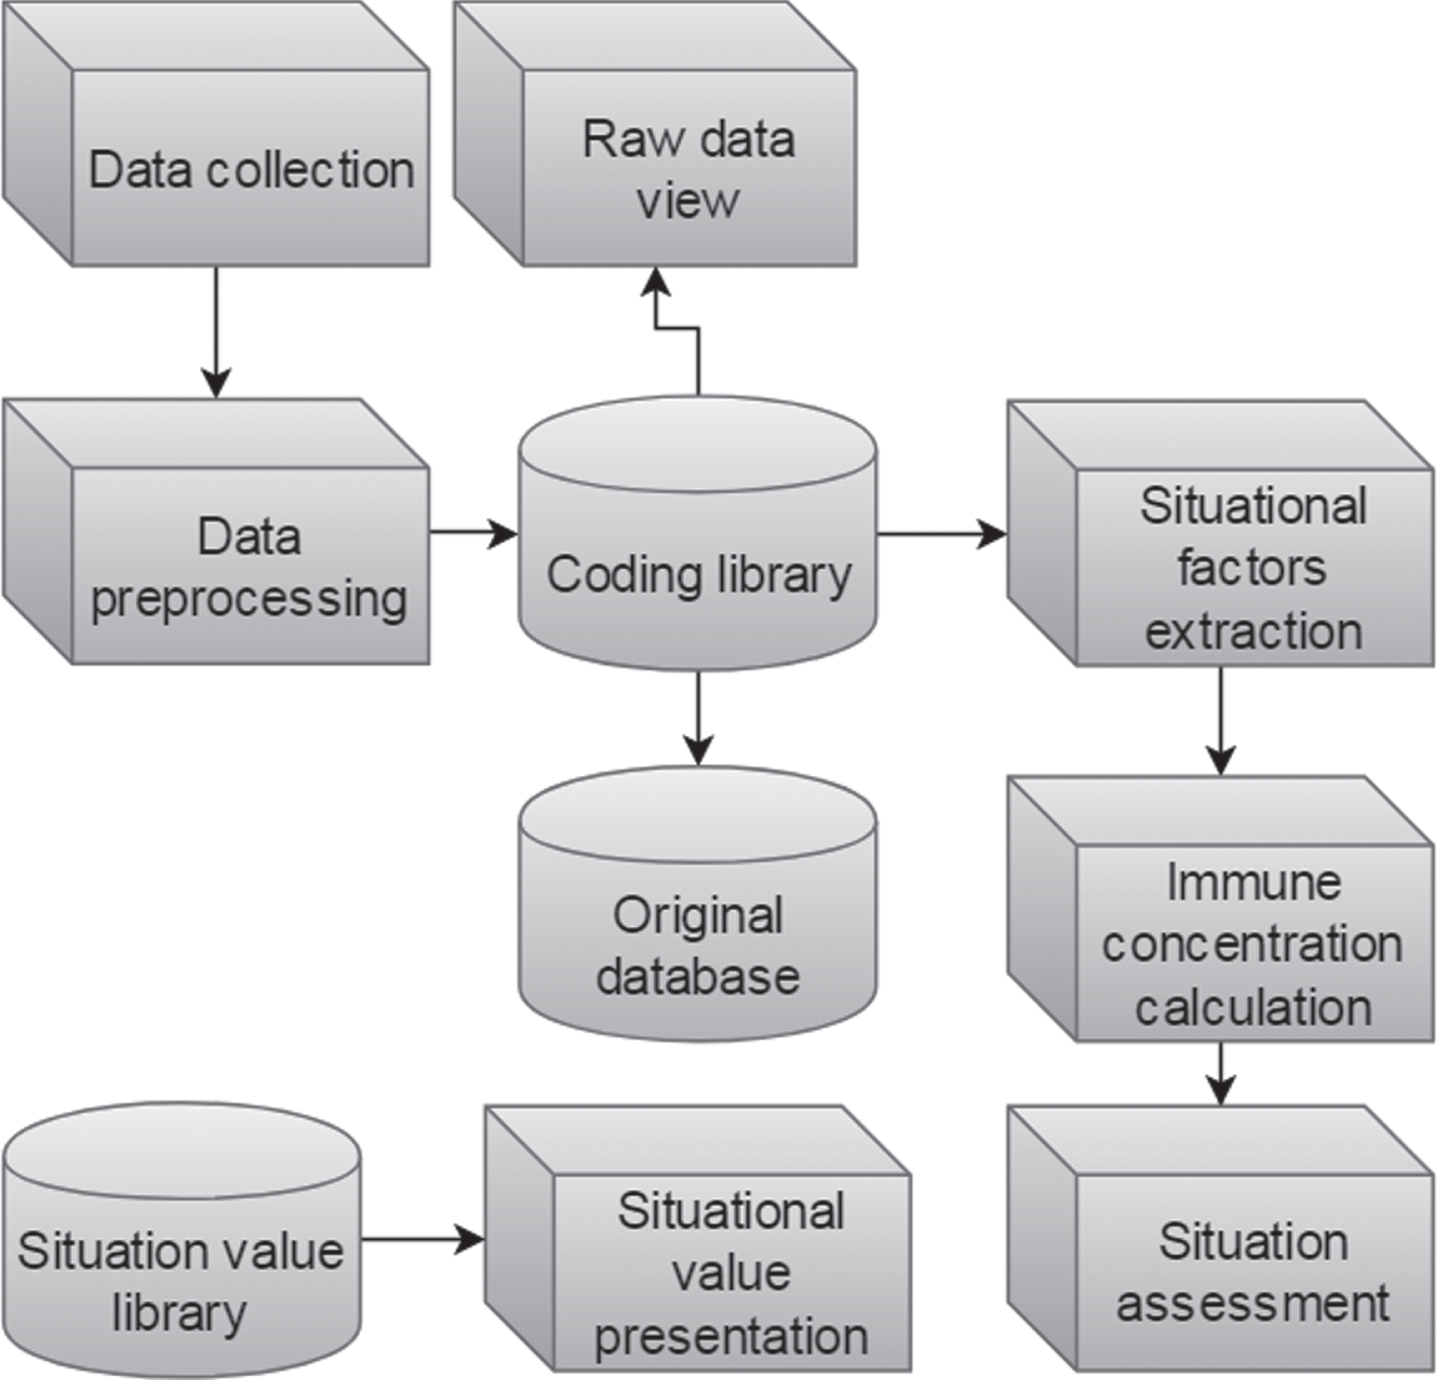
Flow chart of situation estimation framework based on biological immune algorithm.
First, the raw data is extracted from the sensor in real time. After the original data is cleaned and preprocessed, the encoding library encodes it into a fixed-length gene. The encoded gene is matched with the knowledge base in the situation gene library for immune concentration, that is, similarity detection, and the final situation estimation value will be presented. This framework opens up the human-computer interaction layer, and the entire raw data and intermediate processing data will be stored in the database. The situation estimation decision maker can manually modify, add or delete the situation estimation library according to needs. The most important point of this framework is that the results of situation assessment have causality visualization, and decision makers can view the basis and rules of judgment.
Gradient Boosting Tree Algorithm (GBDT) coding is used
In the commonly used biological immune evolution framework, a binary string with a fixed length of L is often used to represent antibody and antigen genes, and each feature after discretization corresponds to a position in the gene. The commonly used binary codes are shown in Fig. 2 [20]:

Schematic diagram of binary encoding.
There are some problems with binary encoding:
1. In the situation assessment process, the situation assessment framework based on the biological immune system is actually a template matching technology. The advantage of template matching is that its time complexity is linear. When the characteristic variables of situation estimation are tens of thousands or hundreds of millions, the framework can evaluate the situation value in real time. However, precisely because template matching is a linear model, the learning ability is limited.
2. In the process of evaluating the situation, the binary code cannot clearly show the rules of judgment and the basis of classification. For situation assessment technology, visually displaying the source of the results plays an important role in the final decision of the decision maker.
The GBDT algorithm is a boosting model that integrates multiple decision trees (weak learning classifiers). A simple tree has limited learning and expression ability and is not enough to express various cross-combination characteristics. The expressive ability of multiple trees will be stronger.
Figure 3 is a gradient boosting tree model that has been trained. The boosted tree model has N decision trees, which are represented by different colors. As a whole, the boosting tree is divided into four layers: input feature layer, tree node split layer, feature conversion layer and linear classifier layer. Aiming at the problem of binary encoding, GBDT encoding has the following improvements [21]:

Schematic diagram of gradient boosting tree.
(1) Position coding of leaf nodes in the middle layer
In Fig. 3, two decision trees are represented by blue and red colors. The blue tree has a total of 3 leaf nodes, and the red tree has a total of 2 leaf nodes. X is input as a piece of sample data. After traversing two trees, the GBDT algorithm selects the best splitting direction of features according to the minimization loss function. The X samples fall on the middle layer leaf node No. 2 of the blue tree and the middle layer leaf node No. 1 of the red tree respectively, then the X samples are coded as 2, 1 respectively. N trees will be encoded into a string of length N.
In order to verify the feasibility of the encoding method, this chapter uses the real data set KDD-CUP99 for network security to encode all samples through the GBDT algorithm, and reduces the dimensionality of the encoded result to a 2-dimensional space through the PCA algorithm, and then checks the location of various samples. Since the pixels of the original image are too high to display all of them, a part of the original image is selected for display, and its visualization is shown in Fig. 4. From Fig. 4, we can clearly see that network security behavior and network abnormal behavior are represented by numbers 0 and 1, respectively. After the high-dimensional encoding of the two types of data is reduced to a 2-dimensional space, the clustering effect is obvious and can be easily distinguished. The 2-dimensional spatial visualization graph fully proves the feasibility of using GBDT algorithm to encode samples in this paper.

Visualization of 2-dimensional space samples.
(2) The tree path of the decision tree is the discriminant rule
The GBDT algorithm determines the bifurcation direction of the binary decision tree based on the best split point of the eigenvalue. Each node in Fig. 3 represents a feature, and the path from the root node to the middle layer leaf node is a classification judgment rule that satisfies the data distribution. Visualizing this path has a very good auxiliary effect for decision makers [22].
Figure 4 Visualization of 2-dimensional space samples
Biological immune mechanism evolution model
(1) Basic theory
The sample data is abstracted into fixed-length genes through coding. The main task of situation assessment is to complete the calculation of the immune concentration. It detects the similarity of unknown genes with antibody and antigen genes, and compares the immune concentration to distinguish whether the gene belongs to normal self-behavior or abnormal foreign body behavior. The schematic diagram of its core content is shown in Fig. 5 [23]:

Core content of immune mechanism.
The state of the problem space is
(2) Evolution related definitions
1. Definition of antibody and antigen:
Antibodies and antigens are represented by ANT,
Among them, L is the gene sequence representing the feature code of the cell, and M is the length of the gene sequence. At the same time, age represents the current life span of the cell, and max _ age represents the maximum life cycle of the cell. Both age and max _ age are mainly used to control the existence and disappearance of cells. f self represents the matching similarity with the antibody gene library, f noself represents the matching similarity with the antigen gene library, and p is the immune concentration of the cell.
2. Definition of semi-mature antibody and antigen:
Semi-mature antibodies are denoted by ANT1 ={ L, age, max _ age < ∞ , f self > β }. Among them, because semi-mature antibodies have a tolerance cycle, they must be deleted if they cannot be successfully transformed into memory cells during the tolerance cycle. max _ age is not indefinite. The similarity with the self is higher than the set threshold β.
The semi-mature antigen is represented by ANT2 ={ L, age, max _ age < ∞ , f noself > θ }, which is consistent with the semi-mature antibody. However, the similarity between the semi-mature antigen and the foreign body is higher than the set threshold θ.
3. Definition of antibody memory cells and antigen memory cells:
The antibody memory cell is represented by MANT1 ={ L, age, max _ age = ∞ , f noself = 1 }. Semi-mature antibody cells will become anti-antibody memory cells through the process of self-tolerance. Antibody memory cells will permanently exist in the collection of antibody gene banks. It has an infinite life cycle, unless managers manually delete it.
The antigen memory cell is represented by MANT1 ={ L, age, max _ age = ∞ , f noself = 1 }, which is basically the same as the antibody memory cell. It has an infinite life cycle, exists in the antigen gene bank collection, and only the manager can delete it manually.
(3) Evolution process
A. Immune concentration calculation
The formula for calculating the degree of matching with the antibody is as follows:
The formula for calculating the degree of matching with the antigen is as follows:
L is the gene code, M is the length of the gene code, and Y is the gene code in the gene bank. F (x, y) is defined as follows:
Among them, x and y respectively represent the coding values of the corresponding positions of the two sets of genes.
The formula for calculating the estimated threat situation of the final unknown behavior is:
B. Immune evolution model
Figure 6 shows the evolutionary model of the immune system. In the model, its main function is to update the antibody and antigen gene bank in real time, self-tolerate, and self-learn. The model first collects unknown behaviors or artificially added behaviors, and encodes the unknown behavior features to calculate the immune concentration. If the immune concentration is higher than the set threshold, the behavioral gene will be transformed into semi-mature antibody cells or semi-mature antigen cells. Otherwise, it will be declared dead and will be deleted from the semi-mature cell gene bank through gene deletion operations. If semi-mature cells can successfully tolerate themselves, they will grow into memory cells after gene cloning. Memory cells will always be stored in the knowledge gene bank, and the gene bank will be updated accordingly. If the self-tolerance is unsuccessful, it is declared dead and deleted.
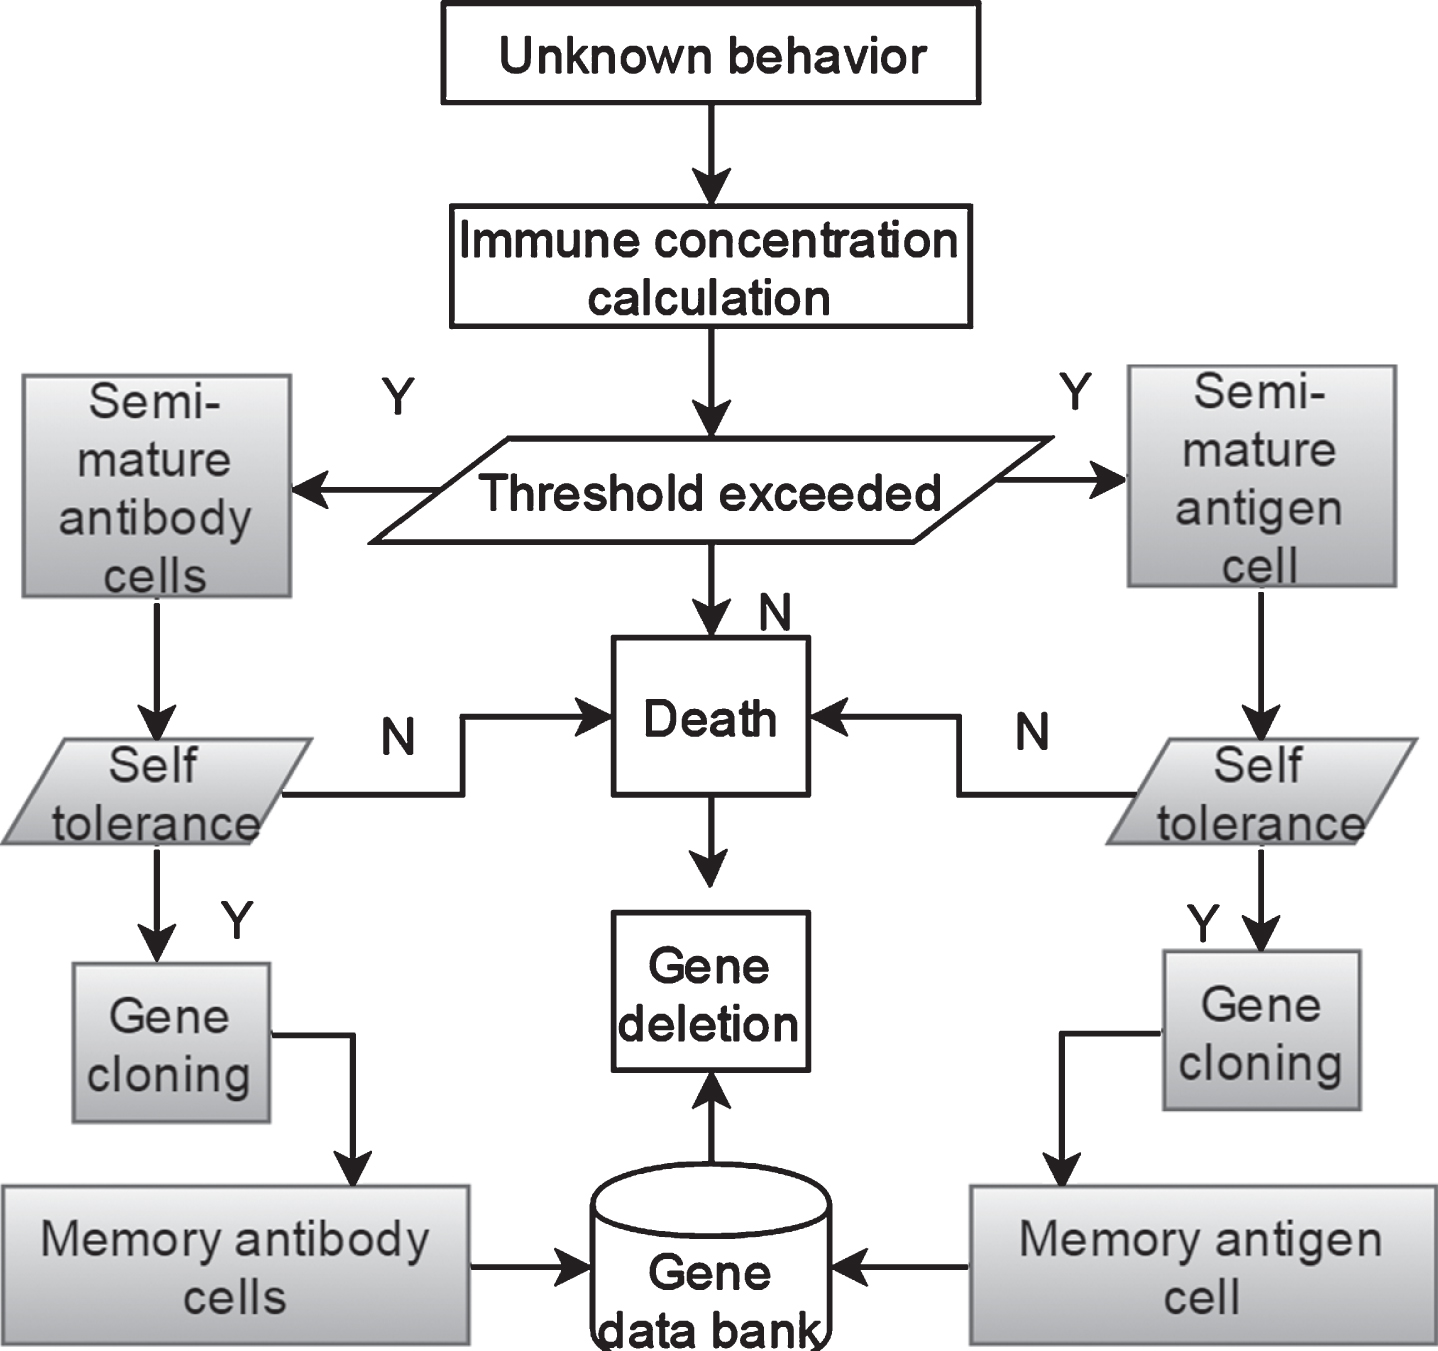
Evolutionary map of immune evolution.
Related indicators
In order to be able to verify the feasibility and effectiveness of the framework of biological immune situation estimation based on GBDT code, this paper uses three indicators of accuracy, false alarm rate and false alarm rate to evaluate. First, the confusion matrix in machine learning is introduced. The confusion matrix clearly describes the relationship between the predicted result and the real result. The matrix is shown in Table 1:
Confusion matrix
In the table:
TP means: the number of samples whose normal network behavior is judged to be normal behavior
FN means: the number of samples whose normal network behavior is judged to be abnormal
FP means: the number of samples in which abnormal network behavior was judged to be normal behavior
TN means: the number of samples in which abnormal network behavior is judged to be abnormal
TP and TN indicate the number of samples whose network behavior is judged correct, and FN and FP indicate the number of samples whose network behavior is judged incorrectly. TP + FN represents the number of samples whose true labels are normal network behaviors, and FP + TN represents the number of samples whose true labels are abnormal network behaviors. TP + FN + FP + TN is the sum of the number of samples in the training data set.
Then, the three indicators to measure the performance of the framework are defined as follows:
(1) Accuracy
The accuracy rate is used to describe the ratio of the number of samples judged to be correct to the total number of all training samples. The higher the accuracy, the better the effect.
(2) False report rate
The false negative rate is used to describe the ratio of the number of samples whose abnormal network behavior is incorrectly judged as normal network behavior to the total number of abnormal network behaviors. The lower the false negative rate, the better the effect.
(3) False alarm rate
The false alarm rate indicates the proportion of samples whose normal network behavior is incorrectly judged as abnormal network behavior to the total number of samples of normal network behavior. The lower the false alarm rate, the better the effect.
This paper uses the learning efficiency of online English teaching in three colleges and universities as examples to carry out research and analysis. The efficiency of each student is calculated by class as shown in Table 2 and Fig. 7 below.
Statistical table of efficiency values before the test

Statistical diagram of efficiency values before the test.
Next, this paper compares the efficiency of online teaching systems. Class 1 adopts the model constructed in this paper, class 2 adopts traditional classroom teaching mode, and class 3 adopts online teaching mode. After a four-month experiment, the statistical learning efficiency is shown in Table 3 and Fig. 8.
Statistical comparison table of English online teaching efficiency after the test
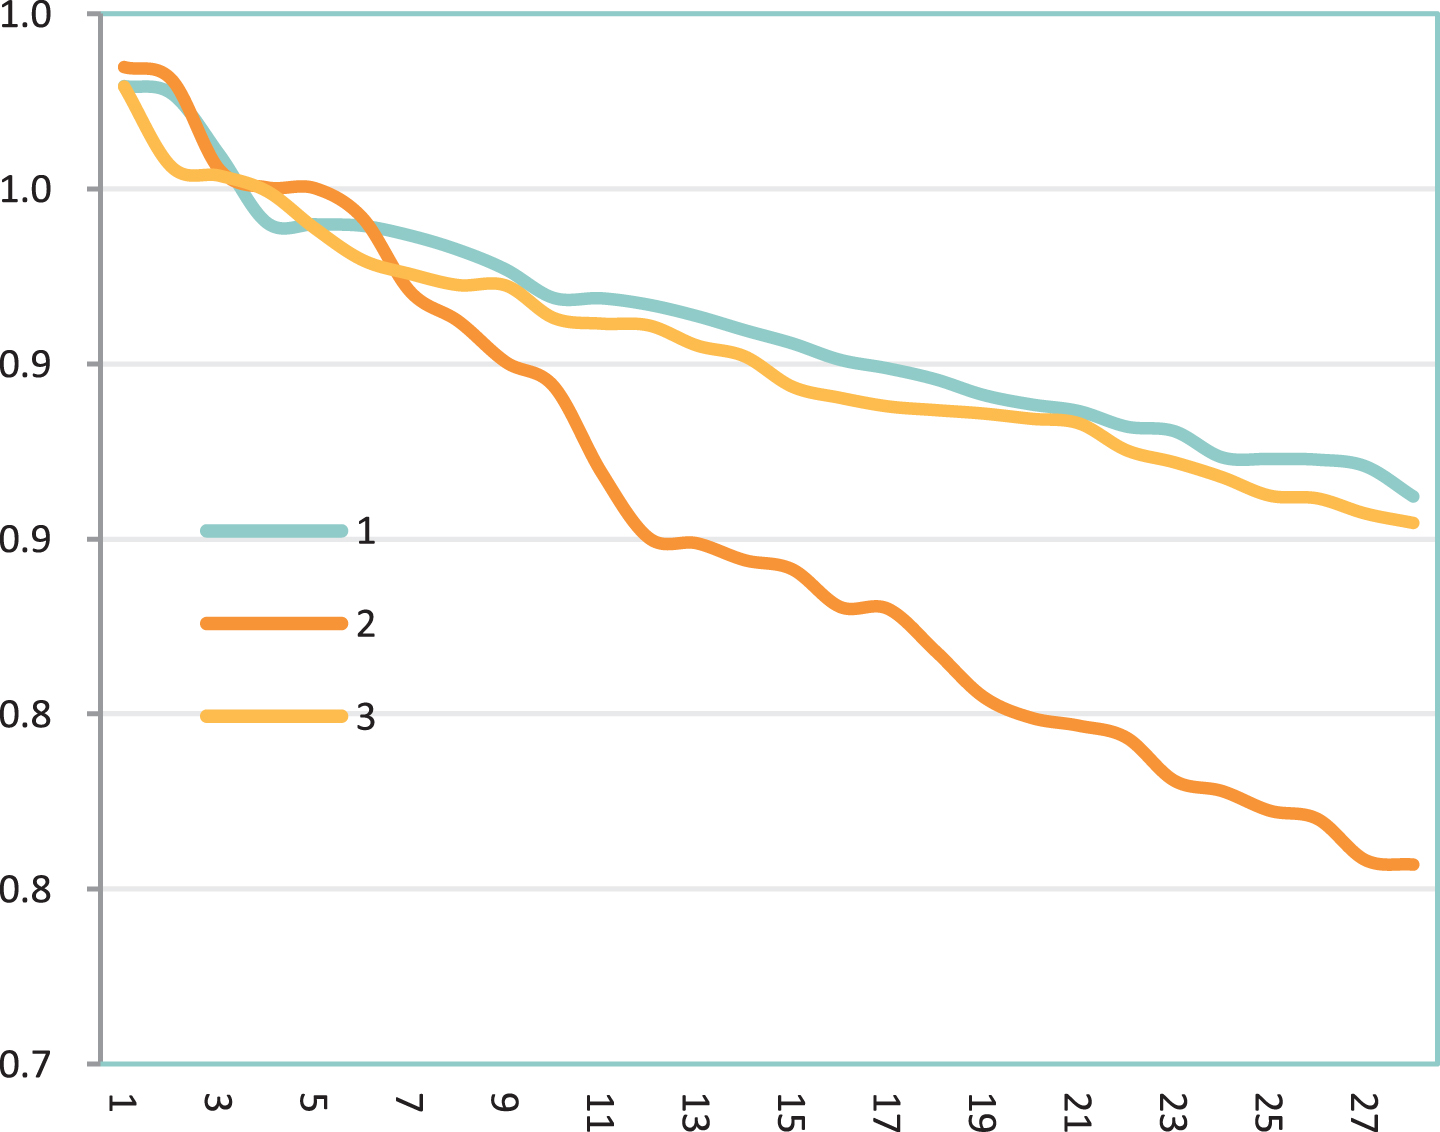
Comparison of statistical diagram of English online teaching efficiency after the test.
From the results in Table 3 and Fig. 8, it can be seen that the model constructed in this paper has certain advantages compared with other models and meets actual needs. After that, the performance of the model can be verified.
This research mainly analyzes the specific results of the model from various aspects. Among them, the absolute fit index refers to the degree of matching between the data and the model; while the relative fit index measures the model from another aspect. This index compares the theoretical model with the virtual model and judges the degree of improvement of the model through the results of the comparison. Finally, this test also tests the data of parsimonious fitting index, which is mainly to pay attention to the factor of model parsimony. The reliability test mainly uses Cronbach’s alpha method. In general exploratory research, the Cranbach’s coefficient is above 0.6, and the benchmark research is above 0.8. Normally, when the Cranbach’s coefficient is above 0.6, the reliability is considered high. According to the analysis, we can see that the coefficient of this study is 0.866. The reliability test of each latent variable is shown in Table 4 and Fig. 9. The results show that the coefficients of all the above latent variables are within the acceptable range. This shows that the data collected by this research has good reliability and reliable internal consistency.
Reliability test situation

Statistical chart of reliability test situation.
Traditional teaching is mostly courseware display, and the teacher mainly operates the courseware. Online teaching is different. The English online learning system takes students as the main body to actively acquire knowledge and information from the network system. The English online learning system is a resource connection with Internet-related websites, and the content is relatively large and wide. Learners use the English online learning network system to carry out quality-expanding research studies based on their own time, preferences, location, and learning basis. The network online system has its advantages, so the development process is also very fast. This paper adopts the English online teaching efficiency substitute model based on bagging learning sixty feature selection to improve the efficiency of the English online teaching system. Moreover, this paper proposes an artificial immune situation estimation framework based on improved coding. The main body of this framework is the biological immune evolution mechanism. In addition, under this mechanism, the framework can continuously update itself, learn from itself, and has a good human-computer interaction function. Management decision makers can modify the knowledge base according to their needs to improve the efficiency of artificial intelligence English online teaching. The experimental results show that the model proposed in this paper is effective.