



Abstract
Background
Plasma biomarkers have recently emerged for the diagnosis, assessment, and disease monitoring of Alzheimer's disease (AD), but have yet to be fully validated in preclinical AD. In addition to AD pathologic plasma biomarkers (amyloid-β (Aβ) and phosphorylated tau (p-tau) species), a proteomic panel can discriminate between symptomatic AD and cognitively unimpaired older adults in a dementia clinic population.
Objective
Examine the added value of a plasma proteomic panel, validated in symptomatic AD, over standard AD pathologic plasma biomarkers and demographic and genetic (apolipoprotein (APOE) ɛ4 status) risk factors in detecting preclinical AD.
Methods
125 cognitively unimpaired older adults (mean age = 66 years) who completed Aβ PET and plasma draw were analyzed using multiple regression with Aβ PET status (positive versus negative) as the outcome to determine the best fit for predicting preclinical AD. Model 1 included age, education, and gender. Model 2 and 3 added predictors APOE ɛ4 status (carrier versus non-carrier) and AD pathologic blood biomarkers (Aβ42/40 ratio, p-tau181), respectively. Random forest modeling established the 5 proteomic markers from the proteomic panel that best predicted Aβ PET status, and these markers were added in Model 4.
Results
The best model for predicting Aβ PET status included age, years of education, APOE ɛ4 status, Aβ42/40 ratio, and p-tau181. Adding the top 5 proteomic markers did not significantly improve the model.
Conclusions
Proteomic markers in plasma did not add predictive value to standard AD pathologic plasma biomarkers in predicting preclinical AD in this sample.
Introduction
Alzheimer's disease (AD) is the fifth leading cause of death for adults over the age of 65 in the United States, 1 and a projected 13.8 million people will have the disease by 2050. 2 The discovery of preclinical AD, 3 a phase of AD during which amyloid-β plaques (Aβ) accumulate in the brain but older adults are cognitively unimpaired (CU), and do not yet exhibit any clinical symptoms of dementia, led to targeting potential secondary prevention therapeutics in AD, with the eventual goal of treating AD pathology prior to diagnosis, when cognitive symptoms and loss of function are already evident. Currently, one new therapy has been approved by the US Food and Drug Administration (FDA) for removing Aβ in symptomatic AD patients and another is pending FDA approval. However, clinical trials of preventative AD therapeutics are not cost-effective and have high screen-fail rates, as identifying preclinical disease in the general population requires screening of thousands of individuals.
Current measures to assess for the presence of preclinical AD include Aβ positron emission tomography (PET) scans using radioactive ligands and cerebrospinal fluid (CSF) testing using lumbar puncture. Secondary prevention treatment, once available, will require point-of-care screening for preclinical AD, which is not sustainable from a public health perspective using Aβ PET and CSF testing. Both techniques come with relatively high cost, low accessibility, are moderately invasive, and require specialist teams for administration and interpretation. Therefore, there is an unmet need to develop biomarkers for the detection of preclinical AD that are minimally invasive, cost-effective, and can be administered in point-of-care (i.e., primary care provider) settings and analyzed on site or analyzed at a central laboratory to: (1) advance secondary prevention treatment goals; and (2) improve cost and time efficiency of preclinical AD trials of new potential therapeutics.
There are standard demographic factors that increase risk for preclinical and clinical AD: age, gender, and educational attainment. Additionally, the apolipoprotein (APOE) ɛ4 allele has a critical role in Aβ deposition levels, aggregation of lipids, and regulation of α-synuclein aggregation, neuroinflammation, lipid metabolism, and synaptic plasticity. 4 APOE ɛ4 status in CU older adults was found to be different between those who were positive (Aβ+) versus negative (Aβ−) on Aβ PET, showing correlation between carrying at least one copy of the APOE ɛ4 allele and Aβ+ status, 5 and clinical trials of AD prevention therapeutics have focused on APOE ɛ4 as a key target risk factor for enrollment. 6
Plasma biomarkers have emerged as a potential minimally invasive, cost-efficient, accessible biomarker for both symptomatic and preclinical AD. Unlike Aβ PET and lumbar puncture, a blood draw can be performed in a point-of-care setting and is relatively inexpensive to process/interpret. Established AD pathology related biomarkers of AD in plasma include Aβ42/40, phosphorylated tau181 (p-tau181), phosphorylated tau231 (p-tau231), phosphorylated tau217 (p-tau217), glial fibrillary acidic protein (GFAP), and neurofilament light (NfL). Whereas these biomarkers have been assessed and validated for diagnosis and disease monitoring in symptomatic AD,7–12 their use and validation in preclinical AD requires further research.13,14
However, there are many other processes that are synergistic to AD pathogenesis. Notably, the current AD research framework for diagnosis of AD left open the consideration of new biomarkers as the field progressed. 15 Inflammation is a known attribute of AD pathogenesis. 16 Specifically, Aβ and tau can bind to receptors in astrocytes and microglia, which are key components of the innate immune system, and trigger an immune response that releases inflammatory mediators throughout the brain. When these mediators accumulate, there are higher amounts of neuroinflammation which in turn worsens AD pathogenesis. 17 Inflammation can also interfere with the brain's immune processes and response to further enhance disease progression. 16 Additionally, both vascular (see 18 for a review) and metabolic changes 19 are known contributors to AD pathogenesis. Therefore, plasma biomarkers examining inflammatory, metabolic, and vascular changes hold can be valuable tools for AD diagnosis, assessment, and disease monitoring.
To that end, O’Bryant et al. 20 developed a panel composed of inflammatory, metabolic, and vascular proteins that accurately diagnosed symptomatic AD versus healthy control participants in the Texas Alzheimer's Research and Care Consortium, a sample largely recruited through dementia specialty clinics (area under the curve (AUC) = 0.91). The panel has also been validated for detection of symptomatic AD in the Alzheimer's Disease Neuroimaging Initiative sample, 21 and across assay platforms, 22 as well as across 4 large, independent, multi-ethnic and community/clinic based cohorts. 23
The proteomic panel is comprised of: c-reactive protein (CRP), intercellular adhesion molecule1 (ICAM1), vascular cellular adhesion molecule 1 (VCAM1), serum amyloid A (SAA), interleukin (IL)-6, IL-10, tumor necrosis factor (TNF)-α, IL-5, IL-7, Eotaxin-3, thymus and activation related chemokine (TARC), alpha-2-microglobulin (A2 M), beta-2-microglobulin (B2 M), factor VII (FVII), tenascin-C (TNC), fatty acid binding protein-3 (FABP-3), IL-18, pancreatic polypeptide (PPY), thrombopoietin (TPO) and t-lymphocyte secreted protein I-309 (I-309).
In normal aging, both age and the APOE ɛ4 allele confer increased risk for cerebral amyloid accumulation,24–28 and eventually clinical AD development, but their predictive value is not specific to AD. Therefore, AD pathologic and proteomic biomarkers are ideally positioned to detect AD risk in a point-of-care setting. Here, our aim was to: (1) apply an blood-based proteomic panel to predict Aβ PET positivity in CU older adults; and (2) examine the incremental utility of this proteomic panel over using age, APOE ɛ4 status, and AD pathologic plasma biomarkers to predict Aβ PET status in this population. We hypothesize, due to inflammatory, vascular, and metabolic changes associated with cerebral amyloidosis, that the proteomic panel in plasma will add value to standard demographic risk factors and AD pathologic plasma biomarkers in predicting preclinical disease.
Methods
Participants
This study used a cross-sectional, retrospective research design. Participants were recruited from Butler Alzheimer's Prevention Registry (BAPR), a research database that holds over 1100 registrants from the community and contains the following data: basic demographics, medical history, and APOE genotype. Registrants can choose to complete optional specimen banking (plasma, cerebrospinal fluid). Inclusion criteria included: (1) member of BAPR; (2) age 55–85 inclusive; (3) willing and able to provide informed consent; (4) completed blood draw within 24 months of Aβ PET scan; (5) cognitively unimpaired (CU) as determined by brief cognitive screen (≥ 27/30 on Mini-Mental State Examination (MMSE) or ≥ 26/30 on Montreal Cognitive Assessment (MoCA)). Exclusion criteria for this study included: (1) history of brain injury or other known neurologic disease; (2) poorly controlled major depression/psychiatric disorder within the past year; (3) history of schizophrenia or psychosis within the past year; (4) history of alcohol or substance abuse within the past year. Participants that did not have an available numerical value for MoCA or MMSE score (N = 2) were deemed cognitively normal by existing clinical trial screening protocols in the Butler Hospital Memory & Aging Program and a Clinical Dementia Rating Score (CDR) of 0. N = 125 participants met these criteria, including N = 82 Aβ PET− and N = 43 Aβ PET + (see Table 1). This study was approved by the Butler Hospital Institutional Review Board and written informed consent was obtained from all human participants in accordance with the Declaration of Helsinki.
Demographic characteristics of entire sample, Aβ PET + group, and Aβ PET − group.
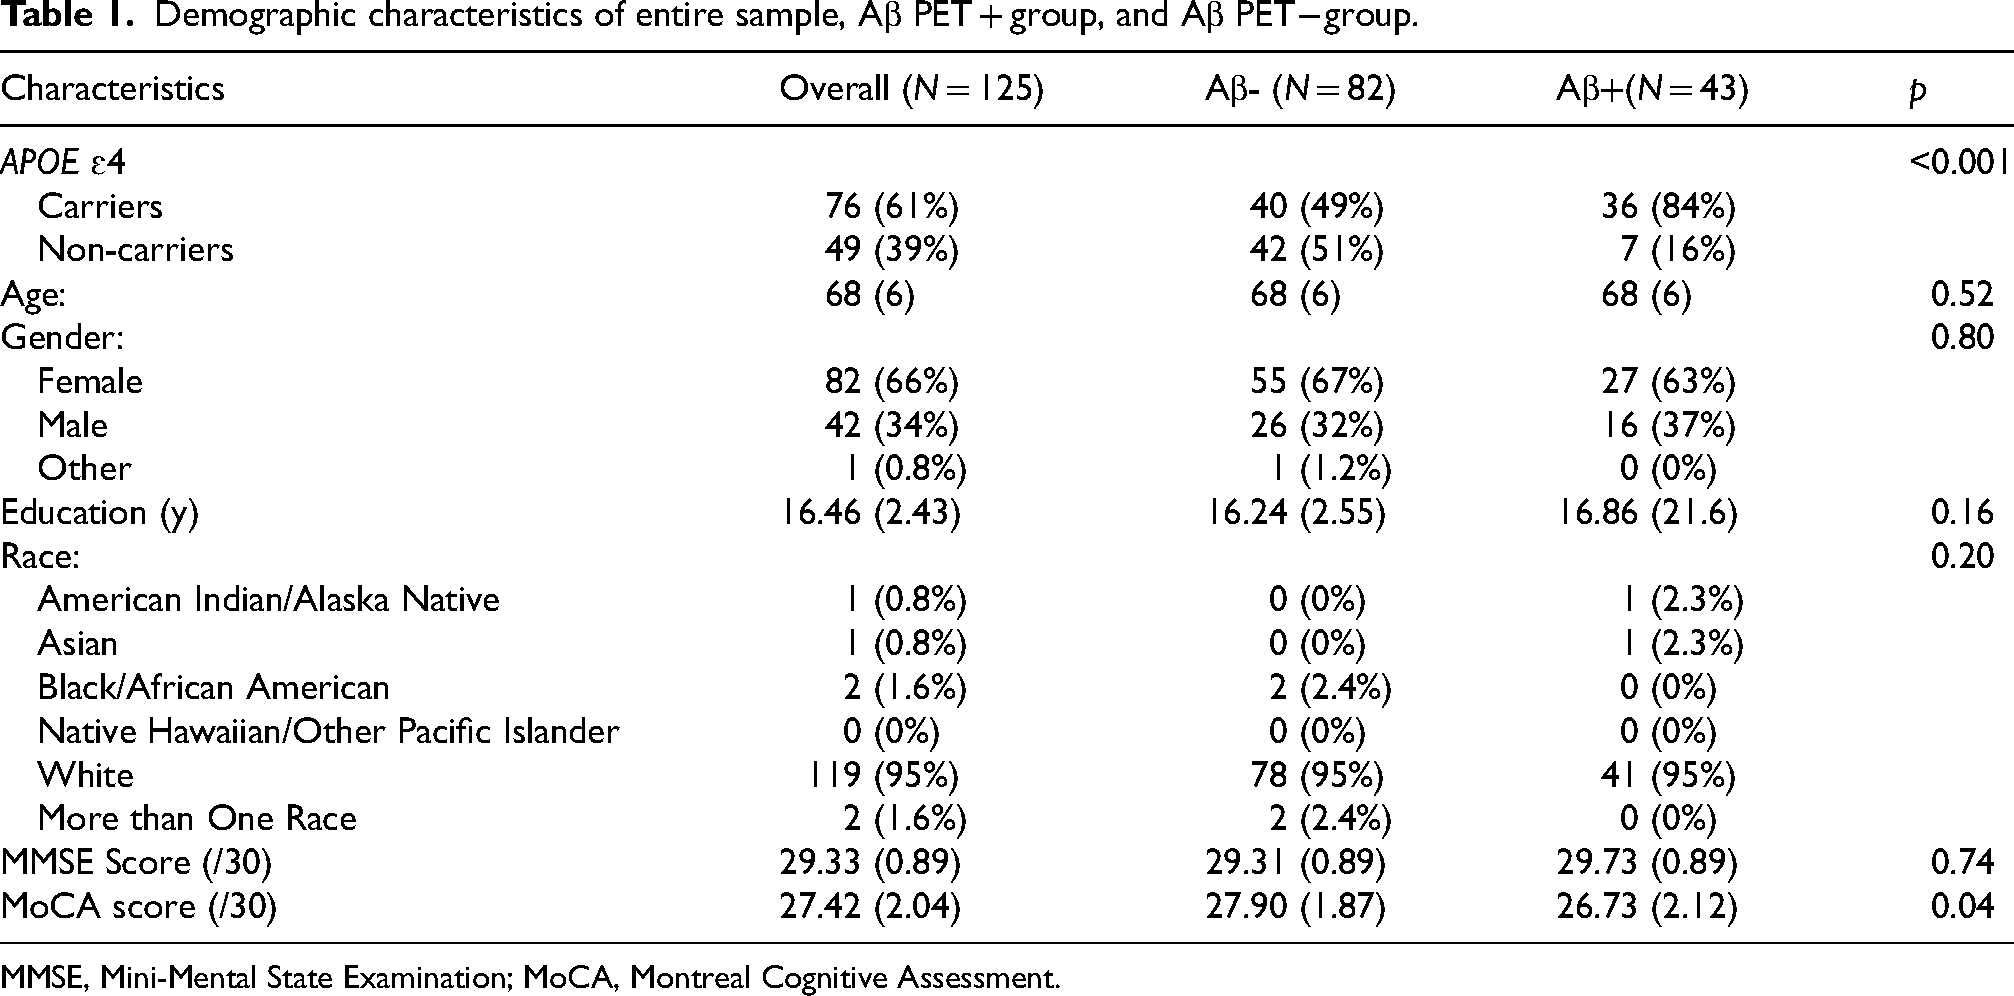
MMSE, Mini-Mental State Examination; MoCA, Montreal Cognitive Assessment.
Procedures
Amyloid PET
Aβ PET scans were assessed via previous participation in clinical trials at the Butler Memory & Aging Program. Depending on the source of the Aβ PET scan, three different ligand tracers were used: florbetapir (N = 89), florbetaben (N = 17), and NAV4694 (N = 19). The prevention studies that utilized florbetapir ligand tracer were evaluated visually by two qualified raters and quantitatively, with Aβ PET positivity designated with a Standard Uptake Value Ratio (SUVr) cutoff value of 1.10.29,30 For florbetaben and 2-18F-fluoro-6-(methylamino)-3-pyridinyl]-1-benzofuran-5-ol (NAV) ligands, binary visual reads (positive versus negative) were conducted by at least two qualified neuroradiologists as part of an AD clinical prevention protocol according to established protocols for each radioactive ligand.31,32
Plasma sample collection and processing
Blood collection and preprocessing procedures were completed by trained phlebotomy staff according to published pre-analytic standard protocols. 33 Samples were shipped to the O’Bryant Laboratory at the University of North Texas, and processed according to standardized protocol. 23 A customized Hamilton Robotic StarPlus system (Microlab STAR line) was utilized to ensure precision of the prepared samples and plates for assay. Blood samples were processed in duplicate on a multiplex platform using electrochemiluminescence (ECL) technology using the SECTOR Imager 2400 A from Meso Scale Discovery (available: http://www.mesoscale.com). Biomarkers used in this study include A2 M, B2 M, SAA, FVII, CRP, svCAM-1, siCAM-1, TNC, FAB3, TPO, TARC, IL-18, PPY, IL-7, I-309, Eoxtain-3, TNF-a, IL-6, Il-5, and IL-10 in addition to Aβ42, Aβ40, and p-tau181. p-tau217 and p-tau231 plasma assays were not available at the time the analysis was performed.
APOE genotyping
A portable reverse transcription polymerase chain reaction (PCR) (real time [RT]- PCR) device that analyzes epithelial cells from a cheek swab (Spartan Bioscience) was used for analysis of APOE genotype. The Spartan Cube has been found to have 100% concordance with the Clinical Laboratory Improvement Amendments (CLIA) certified gold standard laboratory assays. 34 Participants provided cheek swab samples as a part of their participation in the registry. Study staff were trained in cheek swab sample acquisition and processing prior to beginning data collection, either remotely or in person, by Spartan Bioscience, to ensure compliance with procedure and minimize sample contamination.
Statistical analysis
Analyses were performed using R statistical software (version 4.2.1, Vienna, Austria). Plasma data that was below the detectable threshold for each biomarker was excluded. APOE genotype was also recoded as either APOE ɛ4 carrier or APOE ɛ4 non-carrier, as the sample contained very few ɛ4 homozygotes (N = 13). Independent samples t-tests were used to compare demographic variables between Aβ PET + and Aβ PET− groups. Specific plasma analytes (CRP, sVCAM1, and SAA) were converted to the same scale as the other plasma markers for analytic purposes. Participants missing more than 80% of the proteomic data (N = 9) or APOE status (N = 8) or Aβ PET (N = 3) data were excluded from analyses, leaving a total of 125 participants. Any remaining missing data were handled using a multiple imputation approach. 35 Random forest modeling using the randomForest package 36 for R was used to examine the accuracy of the plasma biomarkers in the proteomic panel 20 in predicting Aβ PET status. Random forest is a supervised machine-learning based method that employs several decision trees. The RF model has four steps: (1) generate many random subsets (bootstrap samples) from the original data; (2) build a decision tree from each random subset; (3) make a prediction from each decision tree model, and 4) combine the predictions from each individual tree to get the final prediction. The RF model can be used to predict both binary/categorical outcomes and continuous outcomes. In this analysis, it was used to enhance classification of a binary outcome (Aβ PET + versus Aβ PET−). To do this, the RF model builds many classification trees, and then combines the predictions from individual trees by a majority vote approach. This method has been shown to perform well in many classification and prediction scenarios,37,38 including algorithmic approaches to CSF, 39 EEG 40 and fMRI 41 findings. Importantly, this approach has been used previously with this proteomic panel in order to classify binary/categorical and continuous outcomes.21,23,42,43 The number of features entered in Random Forest Modeling can affect the outcome in two ways: selecting many features increases the strength of the individual trees, whereas reducing the number of features leads to a reduction in the correlation among the trees, strengthening the forest as a whole. 44 Because no existing data optimizes the number of features selected in this population, we compared random forest models with a wide range of features (N = 20, 10, N = 8, and N = 5) to determine which combination of proteomic markers best predicted Aβ PET positivity in this population. Statistics used to evaluate model fit included sensitivity, specificity, positive predictive value (PPV), negative predictive value (NPV), and area under the curve (AUC). Then, multiple regression models were constructed with Aβ PET status (positive versus negative) as the key outcome variable. In order to assess the incremental utility of plasma biomarkers over APOE genotype alone, the following models were created: (1) age, education, gender; (2) age, education, gender, and APOE status (carrier versus non-carrier); (3) age, education, gender, APOE status (APOE ɛ4 carrier versus APOE ɛ4 non-carrier), Aβ42/40 ratio, p-tau181; (4) age, education, gender, APOE status, Aβ42/40 ratio, p-tau181, and the best predictor model identified in the random forest analysis; and for comparison purposes, (5) age, education, gender, APOE status (carrier versus non-carrier) and all 21 proteomic markers. Likelihood ratio tests were used to compare the models, accounting for multiple imputation.
Results
Demographics
There were no significant differences between the Aβ PET + and Aβ PET − groups in terms of gender, age, years of education, race, and MMSE score (all p > 0.05, see Table 1). Aβ PET + CU older adults had a significantly lower MoCA score (mean = 26.73, SD = 2.12) than Aβ PET– CU older adults (mean = 27.90, SD = 1.87, See Table 1), although both groups were above the clinical cut-off for cognitive impairment. Finally, as expected, there were more APOE ɛ4 allele carriers in the Aβ PET + than the Aβ PET− group (p < 0.001, see Table 1).
Proteomic panel: random forest analysis
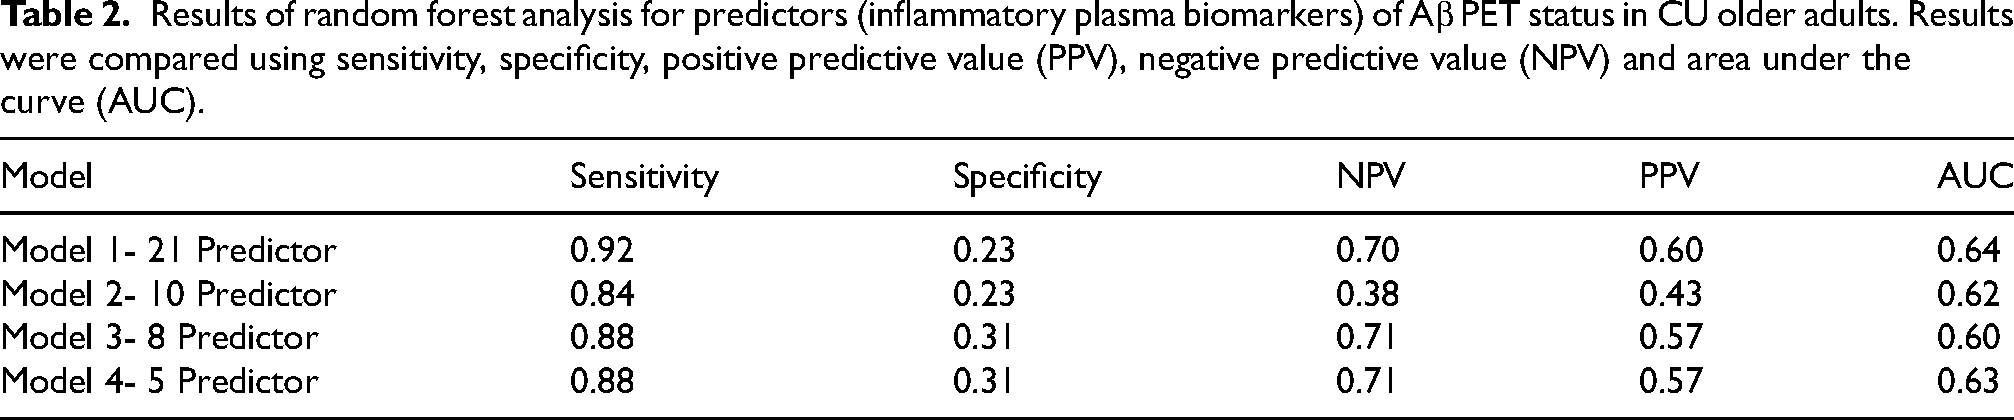
Random forest modeling was used to determine the most accurate combination of the 20 proteins assayed as part of the proteomic panel to predict Aβ PET status (positive versus negative). We tested random forest models that included all 20 inflammatory proteins, as well as the top 10, 8, and 5 inflammatory proteins. Models were compared based on sensitivity, specificity, PPV, NPV, and AUC (see Table 2, Figure 1). The model including the top 5 proteins (CRP, SAA, sVCAM1, TNFα, and TARC) was the best fit with sensitivity of 0.88, specificity of 0.31, PPV of 0.71, NPV of 0.57 and AUC of 0.63. This model was then used to run the remaining multiple regression analyses.
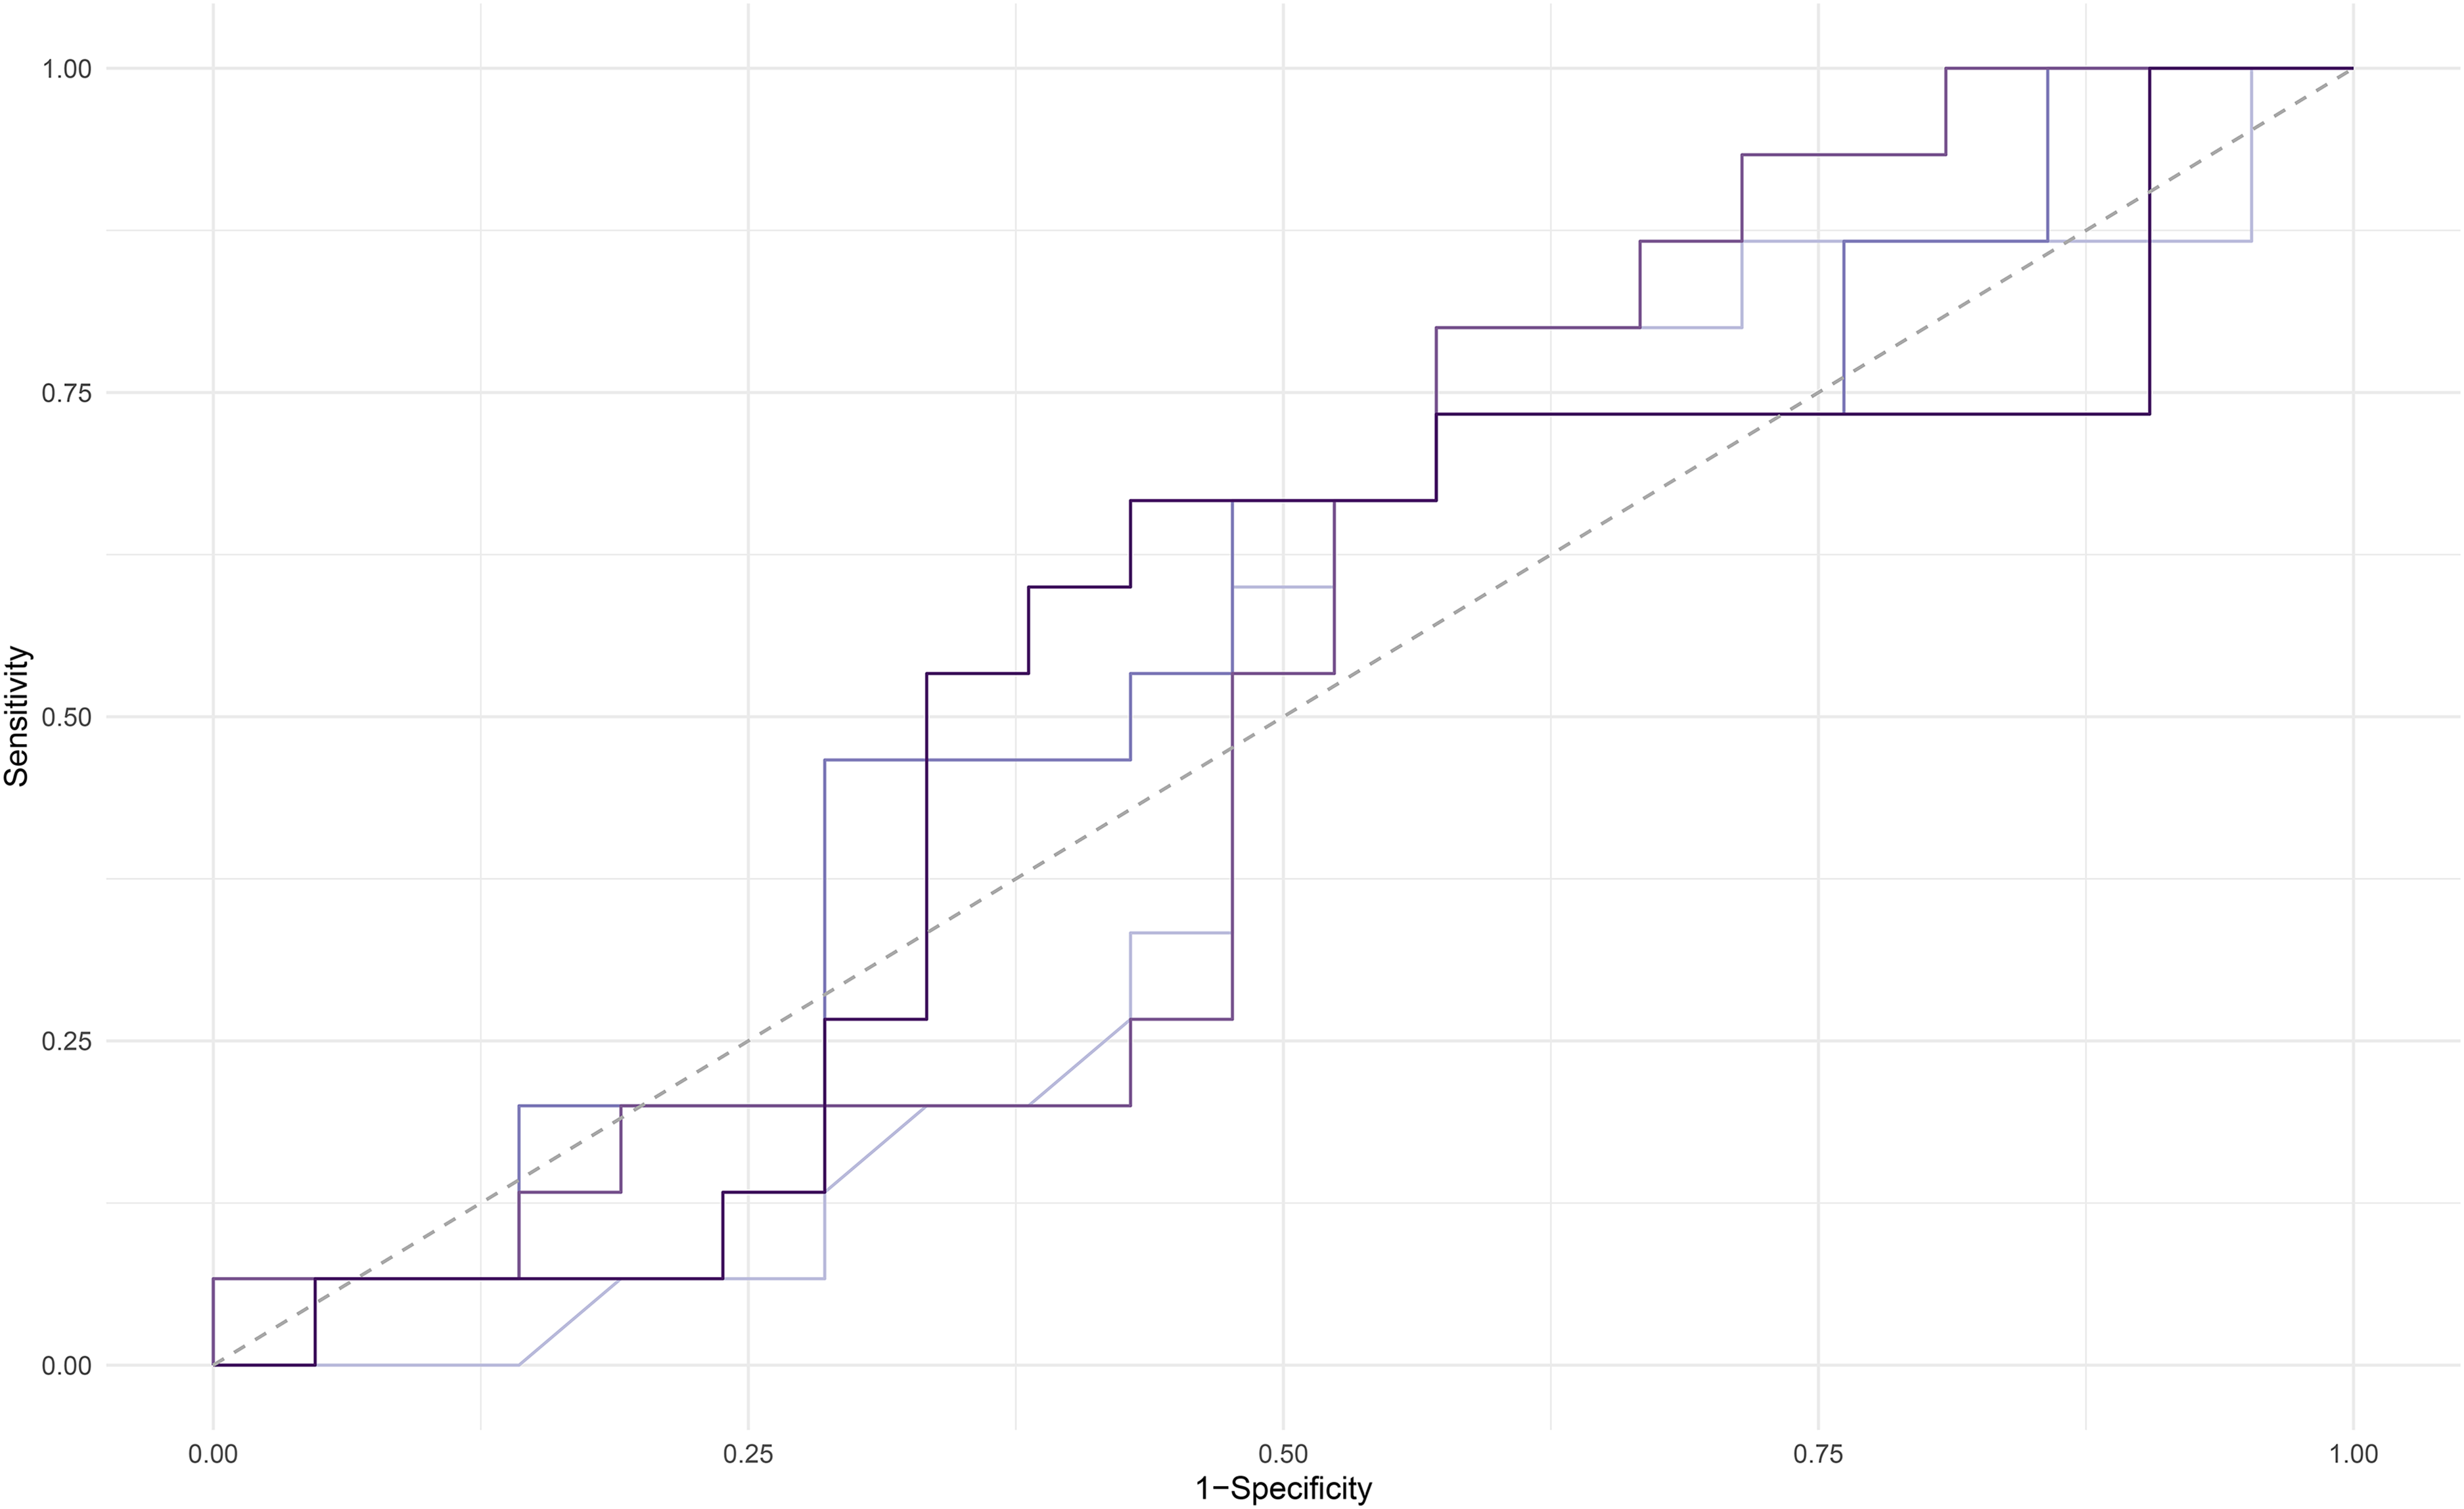
AUC curve for 4 models generated in random forest analysis. Light purple line = 21 predictor model. Dark purple = 10 predictor model. Light blue = 8 predictor model. Dark blue = 5 predictor model.
Results of random forest analysis for predictors (inflammatory plasma biomarkers) of Aβ PET status in CU older adults. Results were compared using sensitivity, specificity, positive predictive value (PPV), negative predictive value (NPV) and area under the curve (AUC).
Additive value of proteomic panel to standard pathologic AD plasma biomarkers
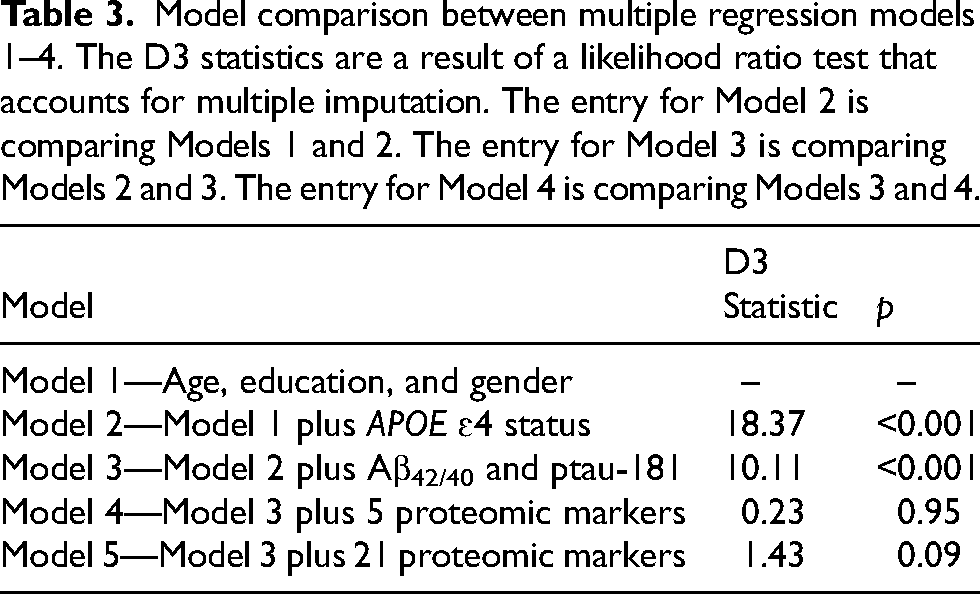
Multiple regression analyses were used to examine the best model for predicting Aβ PET status. In model 1, age, education, and gender were not significant predictors of Aβ PET results (p = 0.16). Model 2 with variables age, education, gender, and APOE status was a significant predictor of Aβ PET status (p=<0.01, see Table 4), and showed significant improvement over Model 1 (p < 0.01; see Table 3). Model 3 with variables age, education, gender, APOE status, Aβ42/40 ratio, and ptau181 was a significant predictor of Aβ PET status (p=<0.01; see Table 4), and showed significant improvement over Model 2 (D3 = 10.11, p < 0.001, Table 3). Adding the 5-predictor model identified through Random Forest analysis (Table 2; Figure 1) to Model 3 did not significantly improve the model (p = 0.23; Table 3), showing that the proteomic panel biomarkers did not significantly improve prediction of Aβ PET status over APOE ɛ4 status and pathologic AD plasma biomarkers (Aβ42/40, ptau181) in this sample (Table 4). For comparison purposes, Model 5 shows that adding all proteomic markers to Model 3 does not significantly improve prediction of Aβ PET status (p = 0.09; Table 3) over APOE ɛ4 status and pathologic AD plasma biomarkers (Aβ42/40, ptau181) in this sample (Table 4).
Model comparison between multiple regression models 1–4. The D3 statistics are a result of a likelihood ratio test that accounts for multiple imputation. The entry for Model 2 is comparing Models 1 and 2. The entry for Model 3 is comparing Models 2 and 3. The entry for Model 4 is comparing Models 3 and 4.
Multiple regressions (outcome measure Aβ PET status (positive versus negative) for models 2, 3, and 4 including odds ratio (OR), 95% confidence interval (95% CI), and p value for all included model variables.
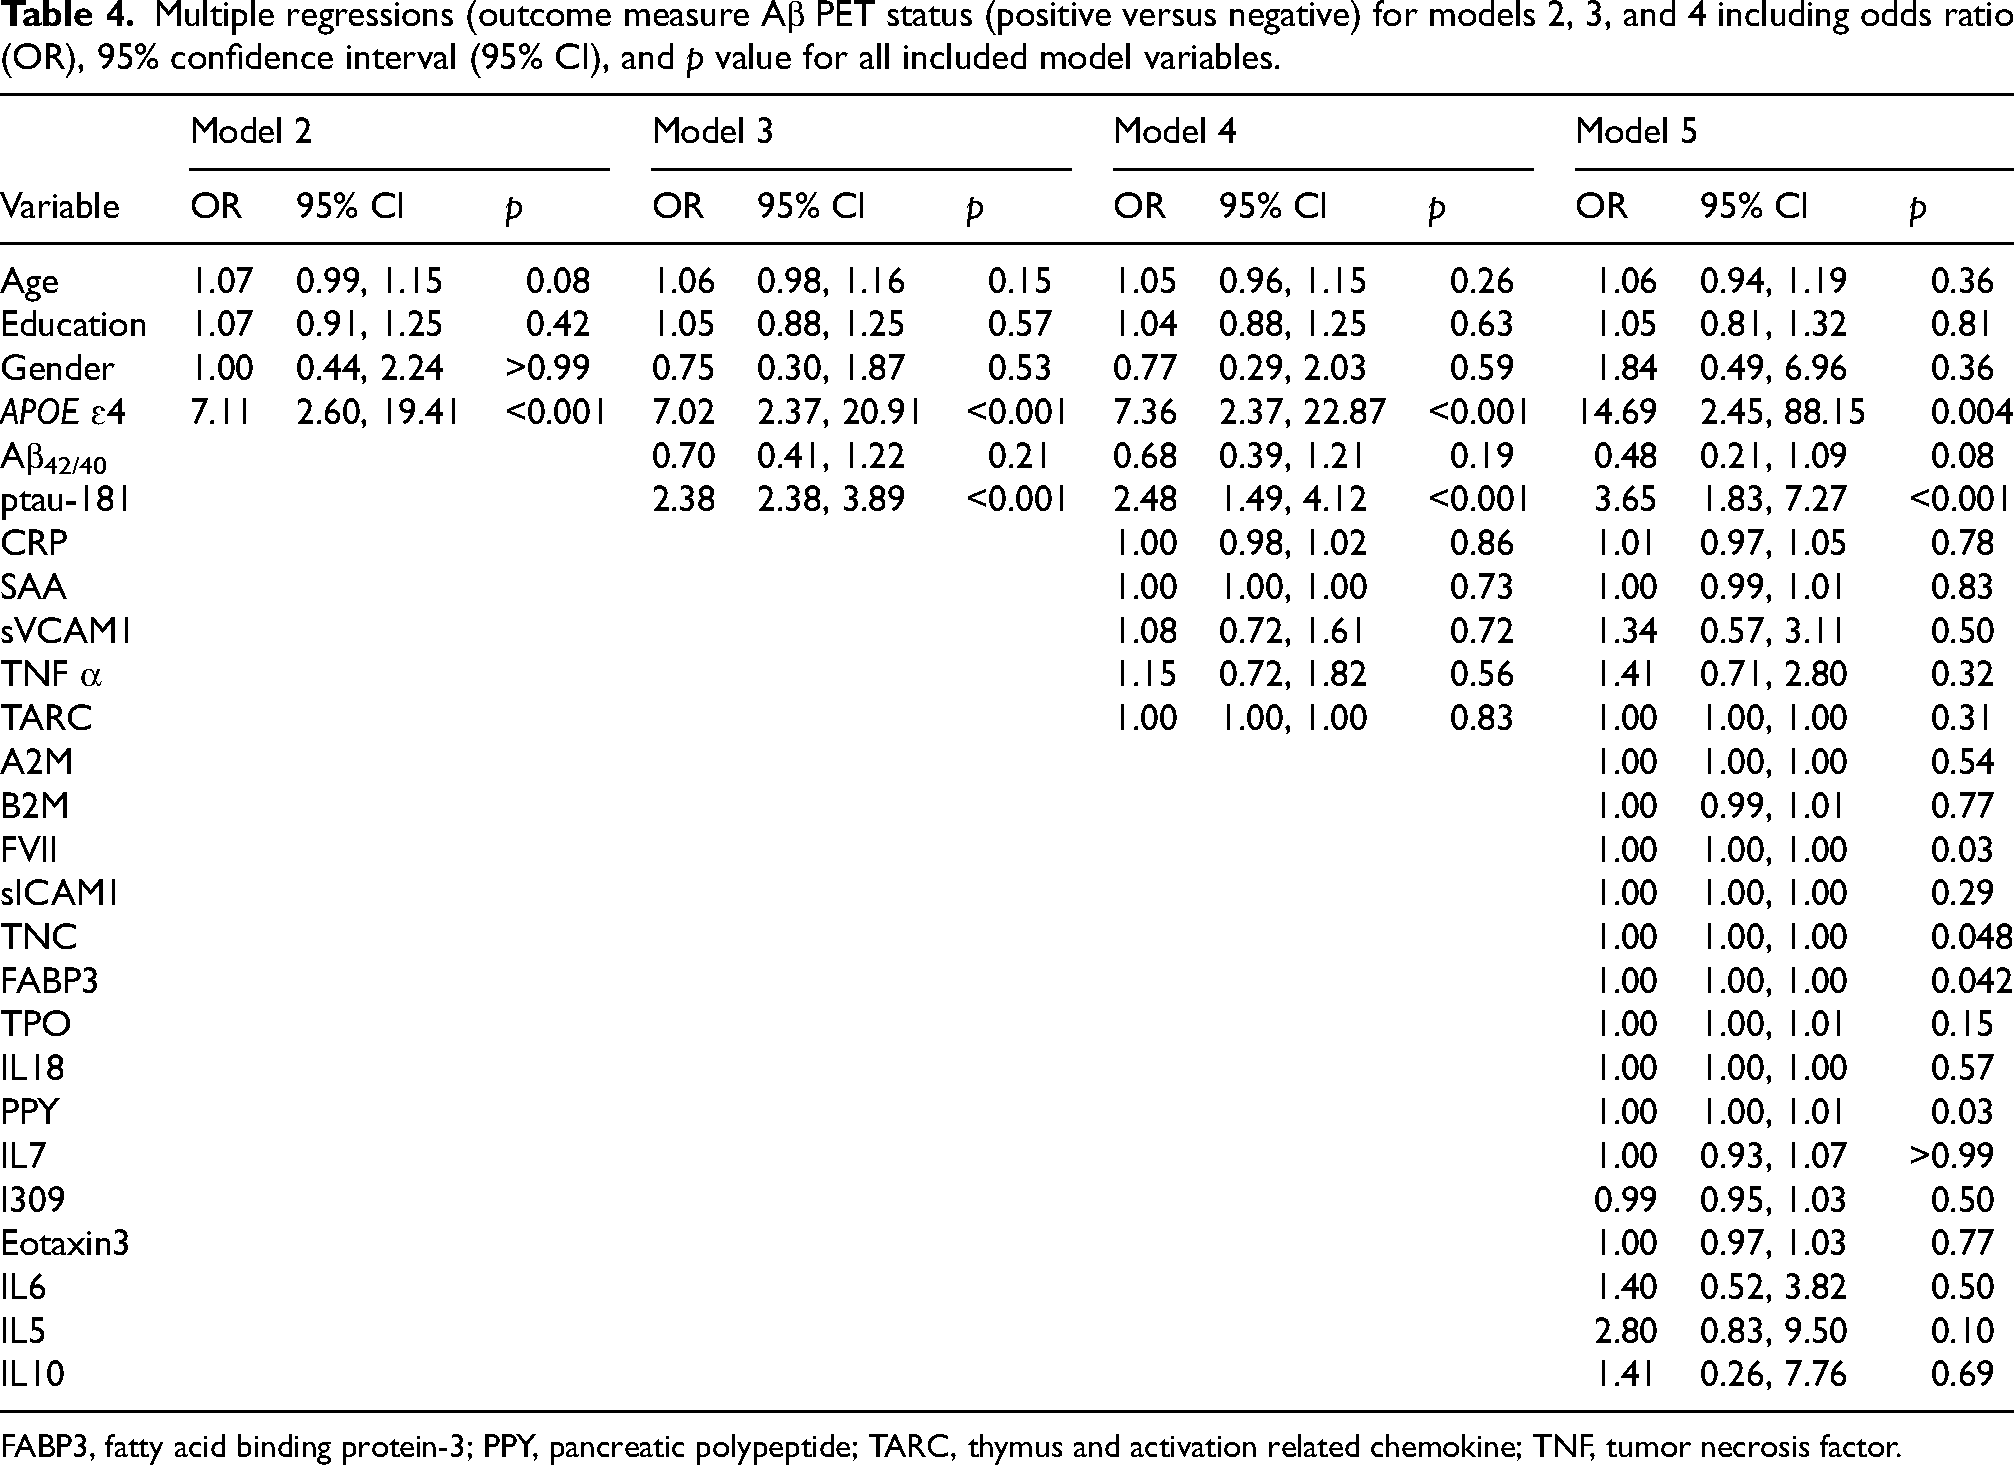
FABP3, fatty acid binding protein-3; PPY, pancreatic polypeptide; TARC, thymus and activation related chemokine; TNF, tumor necrosis factor.
Discussion
In this sample of CU older adults, the best model for predicting Aβ PET positivity included age, years of education, gender, APOE ɛ4 status, plasma Aβ42/40 ratio and plasma p-tau181. Adding the top 5 markers from a 21-item proteomic panel previously validated for discriminating mild cognitive impairment (MCI) and dementia due to AD from CU older adults in dementia clinics 20 did not significantly improve the ability of the model to predict Aβ PET status in CU older adults. This study, to our knowledge, was the first to examine the ability of this proteomic panel to detect preclinical AD.
Inflammation is a well-known and well-studied response to AD pathology; however, other research suggests that inflammatory responses may occur later downstream. 45 In response to amyloid plaque accumulation, microglia produce inflammatory cytokines leading to neuroinflammation, 46 and exacerbating Aβ and tau pathology. 47 This constant state of inflammation leads to worsening degeneration and contributes to the progression of AD. 48 Phase I and Phase IIa clinical trials in rodent models of AD have revealed that preventive anti-inflammatory strategies reduce AD neuropathology such as synaptic loss, astrogliosis, and excitotoxicity as well as decreases in cognitive functioning. 49
The five inflammatory proteins found to be the best fit for predicting Aβ PET status were CRP, SAA, sVCAM1, TNFα, and TARC. Together, these markers had a high positive predictive value and high sensitivity to amyloid PET status, suggesting potential use for identifying preclinical AD in the general population. However, the low NPV and specificity reduce enthusiasm for use as a screening tool for preclinical AD in CU older adults. All 5 of these inflammatory markers have shown changes in clinical AD50–53 compared to CU older adults. Existing research on these biomarkers in preclinical AD is limited (see 54 ). TNFα is associated with greater risk of progression to incident MCI in CU older adults, 55 suggesting that longitudinal monitoring of CU older adults with heightened expression of TNFα may be warranted. In a sample of 1323 CU older adults, Metti et al. 56 found that extreme CRP variability over a 10-year follow-up period was associated with cognitive decline, specifically in women and APOE ɛ4 non-carriers, which they attributed to greater vascular and metabolic disease burden. In an interesting study, Wang et al. 57 examined CRP levels and their relationship to AD biomarkers across the lifespan in CU older adults in 4 large cohorts and found that elevated CRP was associated with decreased hippocampal volume across the lifespan but had no relationship to Aβ PET or CSF Aβ. They did find that APOE ɛ4 was associated with lower CRP across the lifespan and suggested a lifespan approach to determine whether APOE ɛ4 is associated with diminished inflammatory response across the lifespan, and how this may affect incident dementia risk. In contrast, Oberlin et al. 58 found that elevated CRP at baseline predicted greater increase over a two-year follow-up period in global and regional Aβ deposition (as measured by Aβ PET) in CU older adults, especially in those who were Aβ PET + at baseline. Our study was cross-sectional, and future longitudinal follow-up is warranted to determine whether these proteomic panel markers may predict longitudinal change in cerebral amyloidosis in preclinical AD.
Our results indicate that the inflammatory changes associated with AD may occur later downstream in the pathogenesis of the disease. Alternatively, these results could indicate that the pathological inflammatory processes associated with cerebral amyloidosis are not detectable above a critical threshold using these particular plasma biomarkers in CU older adults. Using a binary outcome (Aβ PET + versus Aβ PET−) in our analysis may limit the generalizability of our results. It is possible that these proteomic markers in plasma may reflect more subtle and/or regional accumulation of cerebral amyloid measured continuously (i.e., using the centiloid scale) in this population. Studies are ongoing to test this hypothesis. Additionally, we compared binary (positive versus negative) reads across 3 different tracers in this study, and although the majority of our sample used the florbetapir tracer (N = 89), the use of the centiloid scale would eliminate tracer-driven variability from the other two tracers (N = 36).
Our results confirm previous studies indicating that the APOE ɛ4 allele and p-tau181 measured in plasma are both strong predictors of Aβ PET positivity in CU older adults. Previous studies have found that the APOE ɛ4 allele predicts Aβ PET positivity24–26 and cognitive, specifically episodic memory decline,27,28 one of the first emergent cognitive symptoms in AD, in CU older adults. In a recent publication, plasma p-tau181 was comparable to Aβ PET in predicting cerebral amyloid accumulation over a 2–10 year follow-up period in CU older adults. 59 Moreover, plasma p-tau181 predicted Aβ PET status with high accuracy in CU older adults in the Australian Imaging, Biomarker and Lifestyle (AIBL) study (AUC = 0.808). 60 Interestingly, in preclinical AD, ptau181 shows faster accumulation over time in APOE ɛ4 carriers than non-carriers, 61 which corroborates work suggesting that p-tau181 increases in preclinical AD in APOE ɛ4 carriers 7–13 years prior to disease onset, 62 and that longitudinal increase in this biomarker is related to reduction of encoding-related activity in the hippocampus. 62 Overall, our results support a growing body of literature that both APOE ɛ4 and plasma p-tau181 are accurate predictors of cerebral amyloidosis in CU older adults.
Our study has some notable limitations. First, plasma p-tau217 and p-tau231 assays were not yet publicly available at the time these samples were analyzed. Research shows high discriminative accuracy for Aβ PET status in these biomarkers between patients with AD compared to other neurodegenerative diseases. 12 Also, GFAP, hypothesized to be a sensitive biomarker for cerebral Aβ accumulation in CU older adults 5 was not included in the study, which is an area of opportunity for future research. Additionally, future work should include a larger and more racial/ethnically diverse sample to ensure population-based representation. It should be noted that the participants in the study were community volunteers who signed up for the BAPR online due to interest in AD research, many due to a family history of AD, and therefore APOE ɛ4 carriers could have been over-represented in our sample. Finally, inflammatory response may fluctuate depending on many other factors; examination of these longitudinal fluctuations in these proteomic plasma biomarkers will add to the literature about this panel in preclinical AD. Of note, the processes of inflammation and AD pathogenesis could be additive or synergistic. Mechanistically, pathologic inflammation could be increasing concentrations of AD pathologic markers such as ptau181, or vice versa.
Future work should examine the timeline of the inflammatory response outside of Aβ and tau pathologies in preclinical AD to fully grasp this inflammation cascade in this critical phase of AD development. Longitudinal studies examining proteomic markers in plasma from preclinical disease to mild cognitive impairment, to symptomatic AD dementia, will provide much needed information on the inflammation cascade throughout the AD disease continuum.
Footnotes
Acknowledgments
We would like to thank the participants in this study for donating their time to research at the Butler Hospital Memory & Aging Program.

Author contributions
Haley Leclerc (Formal analysis; Writing—original draft; Writing—review & editing); Athene K.W. Lee (Conceptualization; Data curation; Formal analysis; Funding acquisition; Investigation; Methodology; Project administration; Writing—review & editing); Zachary J. Kunicki (Formal analysis; Methodology; Supervision; Writing—review & editing); Jessica Alber (Conceptualization; Formal analysis; Funding acquisition; Investigation; Methodology; Project administration; Supervision; Writing—original draft; Writing—review & editing).
Funding
The author(s) disclosed receipt of the following financial support for the research, authorship, and/or publication of this article: This project was supported by Institutional Development Award Number U54GM115677 from the National Institute of General Medical Sciences of the National Institutes of Health, which funds Advance Clinical and Translational Research (Advance RI-CTR). The content is solely the responsibility of the authors and does not necessarily represent the official views of the National Institutes of Health.
Declaration of conflicting interests
The author(s) declared the following potential conflicts of interest with respect to the research, authorship, and/or publication of this article: JA receives funding from R21AG074153, R01AG079241, and the Warren Alpert Foundation. AL receives funding from R01AG068990, U24AG057437, U01AG057195 and the Alzheimer's Association.
Data availability
The data supporting the findings of this study are available on request from the corresponding author. The data are not publicly available due to privacy or ethical restrictions.