
Abstract
Background
Alzheimer's disease (AD) is a common neurodegenerative disorder, currently lacking effective early diagnostic methods. However, natural killer (NK) cells may play a potential role in AD pathogenesis.
Objective
This study aims to identify AD-related feature genes from NK cell markers to construct a diagnostic model and explore their potential biological mechanisms in AD.
Methods
Single-cell RNA sequencing data was used to identify NK cell markers. A novel feature selection algorithm, adaptive dynamic graph convolutional network (ADGCN), was proposed to extract AD-related feature genes and construct a diagnostic model. Differential, correlation and enrichment analyses were performed to understand the biological mechanisms of these genes. Immune infiltration analysis compared the immune microenvironment between AD and controls. Two regulatory networks explored interactions between feature genes, transcription factors and microRNAs. The association between SNPs and feature genes' expression was examined through expression quantitative trait loci analysis. Differential CpG sites were identified to analyze their association with the NK cell markers' expression.
Results
We developed an optimal diagnostic model (ADGCN-XGBoost) with 17 feature genes, demonstrating high diagnostic effectiveness across datasets. These genes were primarily related to macromolecule biosynthesis, cytoplasmic translation biological processes and ribosome pathway, and potentially modulated immune infiltration of AD patients. We predicted 27 target miRNAs and 21 transcription factors influencing these genes. Multimodal analysis identified 57 significant SNP-gene associations and seven CpG-gene pairs.
Conclusions
This study proposed a novel feature selection algorithm and developed a diagnostic model based on 17 feature genes, providing new potential biomarkers for AD diagnosis.
Introduction
Alzheimer's disease (AD) is a chronic neurodegenerative disorder marked by progressive cognitive decline, memory impairment and diminished daily living capabilities. Its pathological changes include amyloid-β (Aβ) deposition, synaptic dysfunction, and neuroinflammation. 1 With the increasing trend of an aging population, AD poses a significant global health challenge. Despite extensive research efforts to unravel the pathogenesis of AD, effective treatment strategies are still lacking, partly because analyses at the tissue level may obscure the complexities of inter- and intra-cellular modifications. 2 Single-cell RNA sequencing (scRNA-seq) is a high-throughput experimental technique for quantitative gene expression profiling of specific cell populations at the single-cell level. 3 Many studies have utilized scRNA-seq data to identify potential biomarkers for AD diagnosis. Thus, integrating single-cell sequencing technologies promises a clearer understanding of the mechanisms of AD. Natural Killer (NK) cell, a subtype of innate immune cells, can promote and participate in anti-tumor immunity. 4 Studies have found that NK cell played a crucial role in controlling the onset and progression of brain inflammation, 5 suggesting its potential involvement in AD pathogenesis. However, its phenotypes and functions in AD remain largely unexplored. Qi et al. found that the number and activity of NK cells decreased in AD patients by scRNA-seq analysis. 6 Zhang et al. explored the impact of NK cell on AD, and demonstrated that NK cell possessed pro-inflammatory characteristics, negatively impacting cognitive function. 7 Although studies suggested that NK cell impacted cognitive functions and AD progression, related research remains relatively limited needs further exploration. Utilizing scRNA-seq analysis could reveal the role of NK cell in AD pathogenesis, offering new perspectives for diagnosis and treatment.
Feature selection plays a critical role in identifying disease biomarkers. However, many biological datasets exhibit High-Dimensional and Low-Sample Size (HDLSS) characteristics, 8 making it challenging to achieve good classification accuracy in disease diagnosis due to feature redundancy, high collinearity, and low sample numbers. 9 Therefore, extracting key feature subsets from high-dimensional and redundant feature sets is crucial for optimizing the performance of diagnostic models. With the development of machine learning and deep learning technologies, many efficient feature selection algorithms have been developed for handling high-dimensional data and identifying biomarkers, which have been extensively applied in AD diagnostic research.10,11
Graph convolutional network (GCN), highly regarded for its excellent performance in processing non-Euclidean data and capturing effective sample embeddings, 12 has been widely applied in AD diagnostic studies. However, traditional GCNs face limitations due to lacked interpretability and ineffective graph structure updates during training. Therefore, it is necessary to propose new algorithms within the GCN framework to better learn and capture embedded features, providing more accurate and interpretable AD diagnostic results. Beyond image data, GCN is also suitable for genomic data. Chen et al. 13 introduced a GCN-based feature selection method named GRAph Convolutional nEtwork feature Selector (GRACES), which processed gene expression data to uncover the potential relationships among HDLSS data, outperforming existing HDLSS data feature selection algorithms in both synthetic and real gene datasets. Exploring the genetic mechanisms of AD can deepen our understanding of AD's pathogenesis and inspire new therapeutic strategies. Genetic association analysis of single nucleotide polymorphism (SNP) and DNA methylation data with AD-related risk gene expression profiles can reveal how genetic factors contribute to the progression of AD.
This study first extracted NK cell markers from scRNA-seq data of peripheral blood. A novel GCN-based feature selection method was then proposed to identify AD-related feature genes from these markers and then a diagnostic model was constructed for early diagnosis of AD patients. Finally, we delved into the potential biological mechanisms of feature genes in AD pathogenesis and explored the role of AD-related genetic variations and epigenetic regulatory sites through multi-omics joint analysis. The workflow of the entire study was depicted in Figure 1.
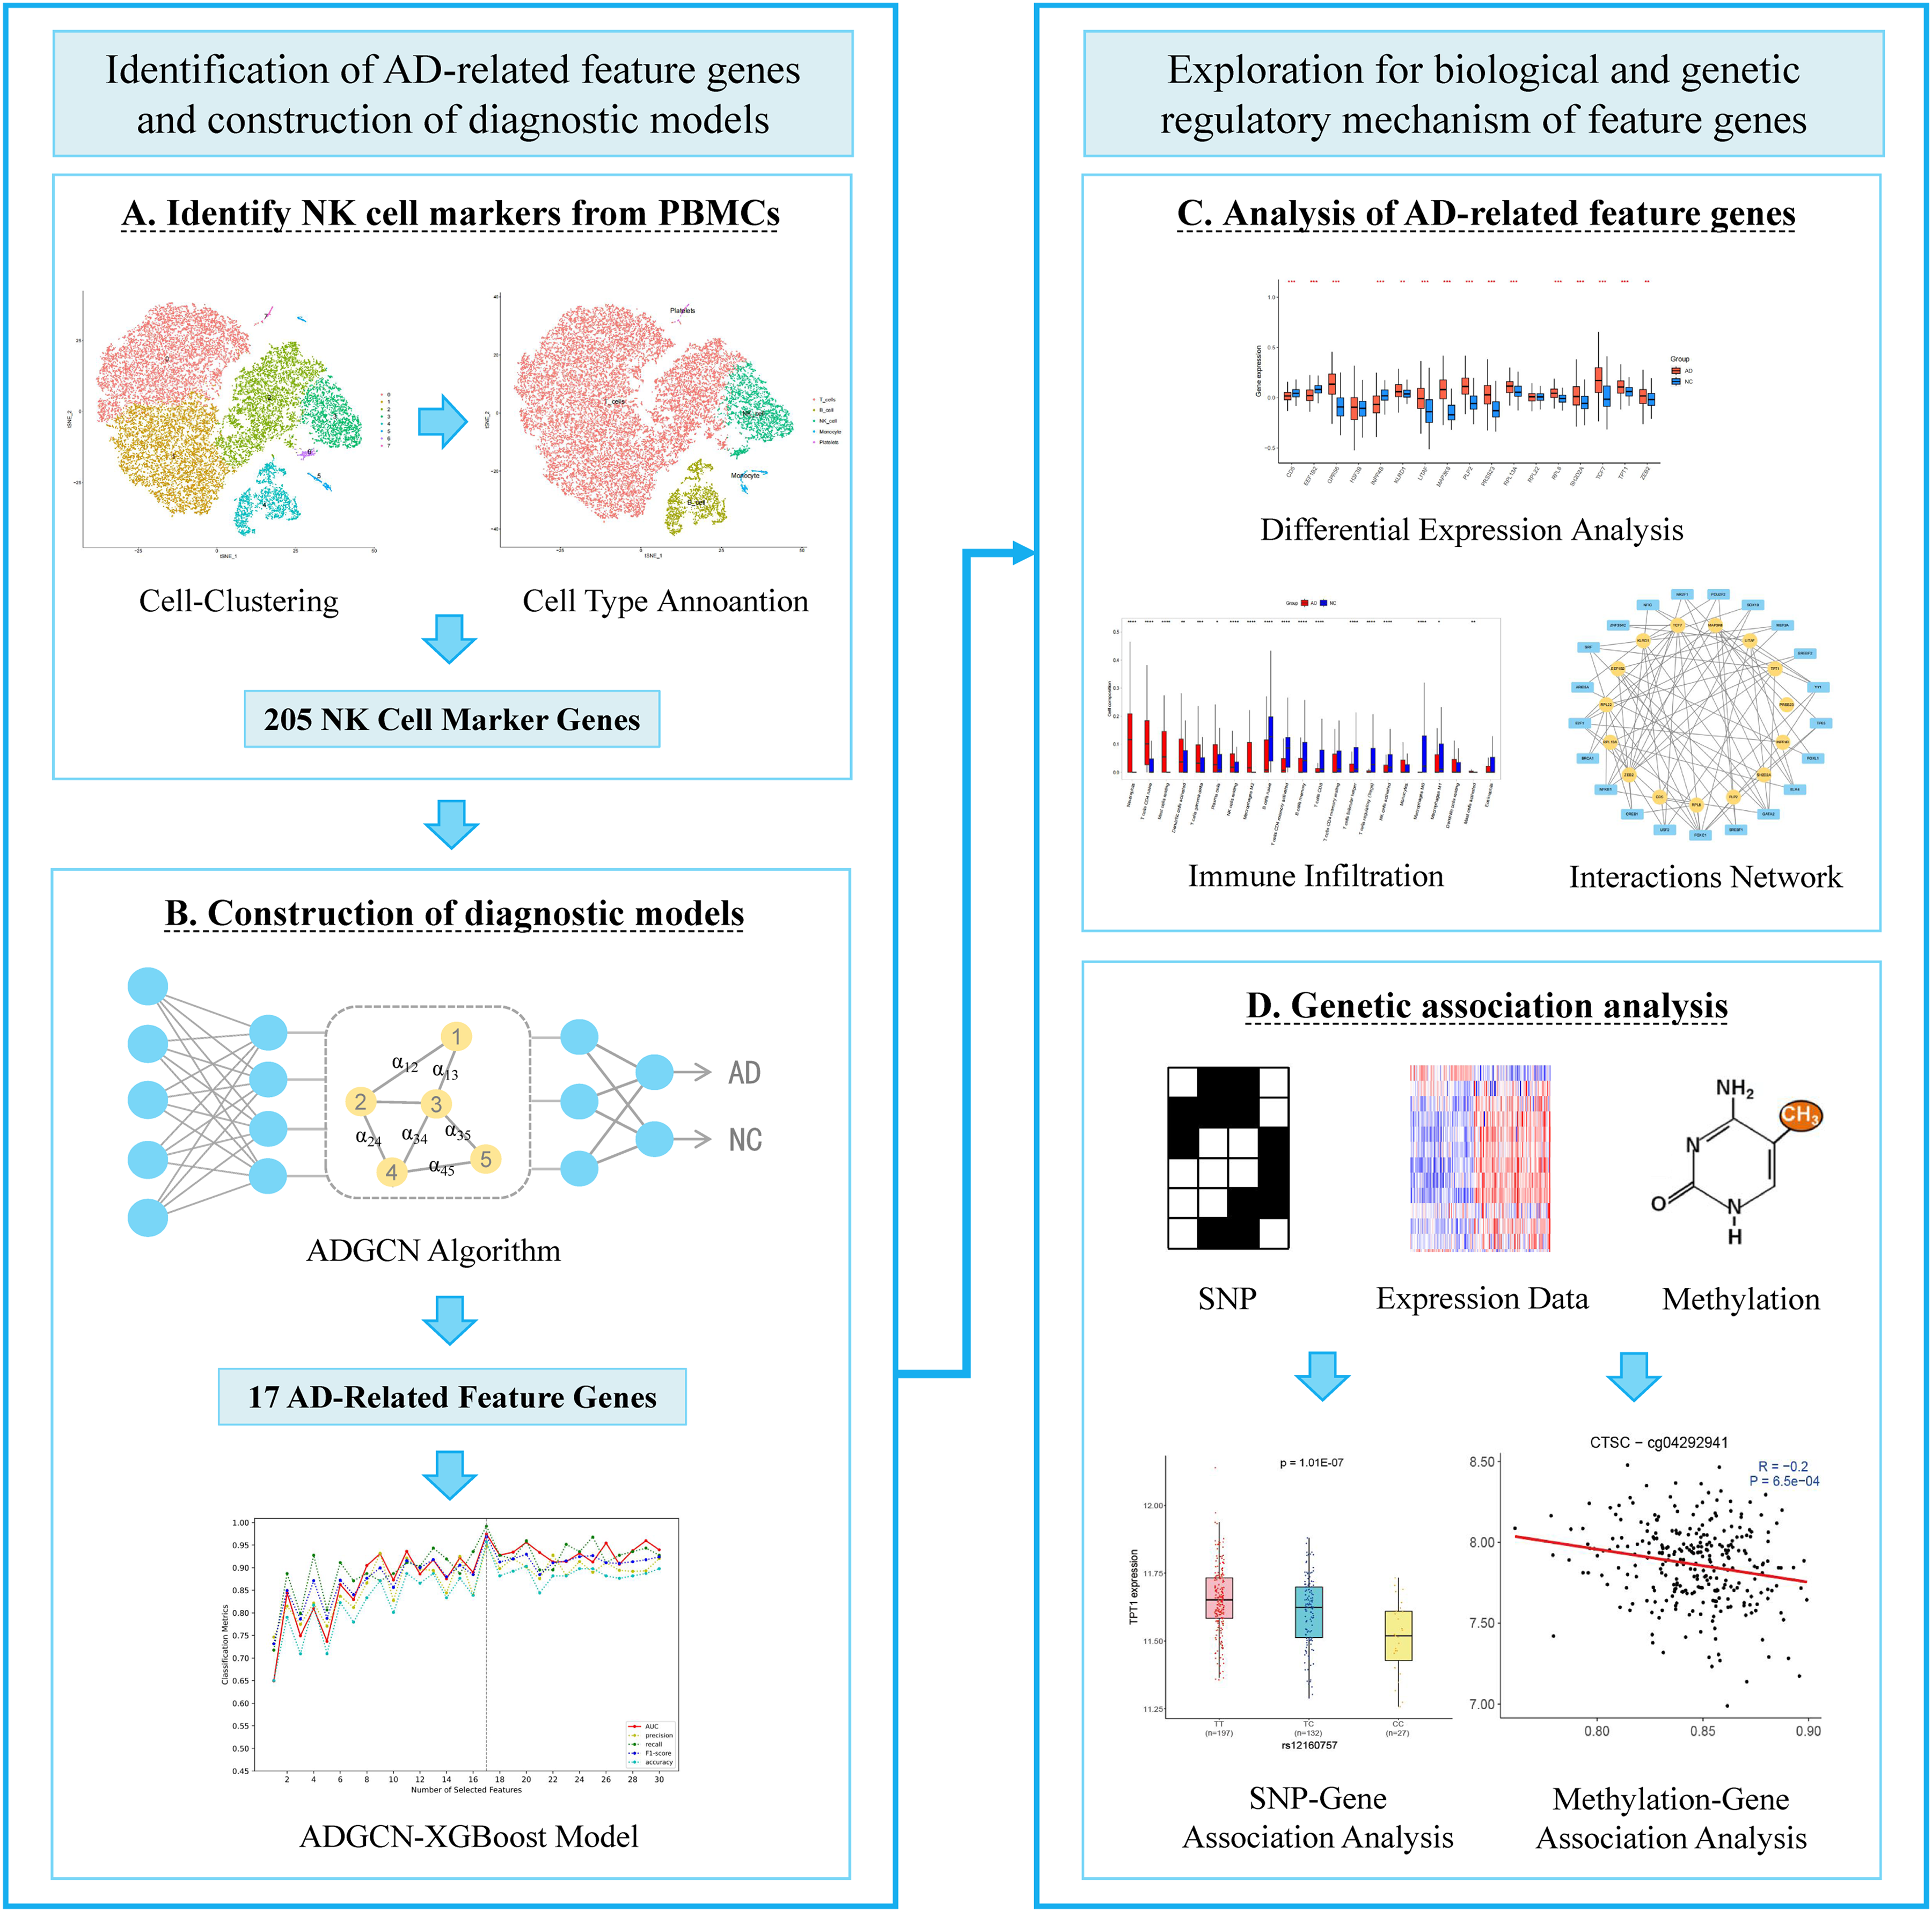
The workflow of the entire study.
Methods
Data collection and preprocessing
The scRNA-seq data (GSE181279) from the Gene Expression Omnibus (GEO) database (https://www.ncbi.nlm.nih.gov/geo/), composed of 36,849 peripheral blood mononuclear cells (PBMCs) from three AD samples and two healthy controls, was utilized to identify NK cell marker genes. Three microarray datasets were downloaded: GSE33000 with 310 AD patients and 157 non-demented controls (NC), GSE122063 with 56 AD and 44 controls, and GSE5281 with 87 AD patients and 74 controls. The GSE33000 dataset served as the training set. The GSE122063 and GSE5281 datasets were chosen as external validation datasets. The conversion of probe data was accomplished using an R script that mapped probe names to gene IDs based on GPL platform annotations.
Additionally, the gene expression, genotyping and DNA methylation data from the Alzheimer's Disease Neuroimaging Initiative (ADNI) database (http://adni.loni.usc.edu/) 14 were obtained. Gene expression profiles were taken from 811 ADNI participants. The ADNI study was approved by the institutional review board of all participating sites and written informed consent was obtained from all participants before inclusion in the study. After quality control, it was composed of 747 participants and 49,386 probes. 15 Gene expression data was handled by averaging probes corresponding to the same gene. Diagnosis statuses to participants was assigned based on the date of sample collection, focusing solely on participants labeled with normal (NC) and AD. The refined data of 360 participants (246 NC, 114 AD) were selected for further analysis. The genotyping data encompassed genotyping information for 1,561,372 SNP loci across 812 samples. Regarding the DNA methylation dataset (∼866,000 CpG signals), we calculated the average methylation signal beta value for each CpG site, deriving a signal matrix of 695,300 CpG probes across 571 samples.
Finally, we presented the following ethics statement: This study used publicly available datasets from the GEO and ADNI databases. Since these datasets have already undergone ethical review and are de-identified, additional ethics approval was not required for this study.
Single-cell RNA sequencing data processing
We utilized Seurat R package (version 5.0.1) to process scRNA-seq data. Cells with fewer than 200 or more than 2500 detected genes and those with mitochondrial gene proportions exceeding 5% were excluded. The top 2000 highly variable genes (HVGs) were identified from each sample for principal component analysis (PCA), using elbowplot to visualize the standard deviation of each PC for identification of significant principal components (PCs). The ‘Harmony’ package was applied to correct batch effects across samples. Subsequently, we used the ‘FindNeighbors’ function to calculate cellular adjacency distances and construct a k-nearest neighbor graph. Cells were partitioned into distinct clusters using the ‘FindClusters’ function, with a clustering resolution parameter set at 0.3. Marker genes for each cluster were identified using the ‘FindAllMarkers’ function, with cutoff thresholds set at min.pct = 0.25, logfc.threshold = 0.25, and adjusted p-value < 0.05. Cell types were automatically annotated for each cluster using the ‘SingleR’ package and manually adjusted based on cell type-specific markers expressed in peripheral blood mononuclear cells (PBMCs) according to the CellMarker website.
The construction of adaptive dynamic graph convolutional network feature selector
Adaptive Dynamic Graph Convolutional Network feature selector (ADGCN) was proposed to optimize feature selection by leveraging latent relations among samples to minimize optimization loss. The framework of ADGCN is depicted in Figure 2. (More details can be found in Supplemental Methods) In short, ADGCN has the following primary components.
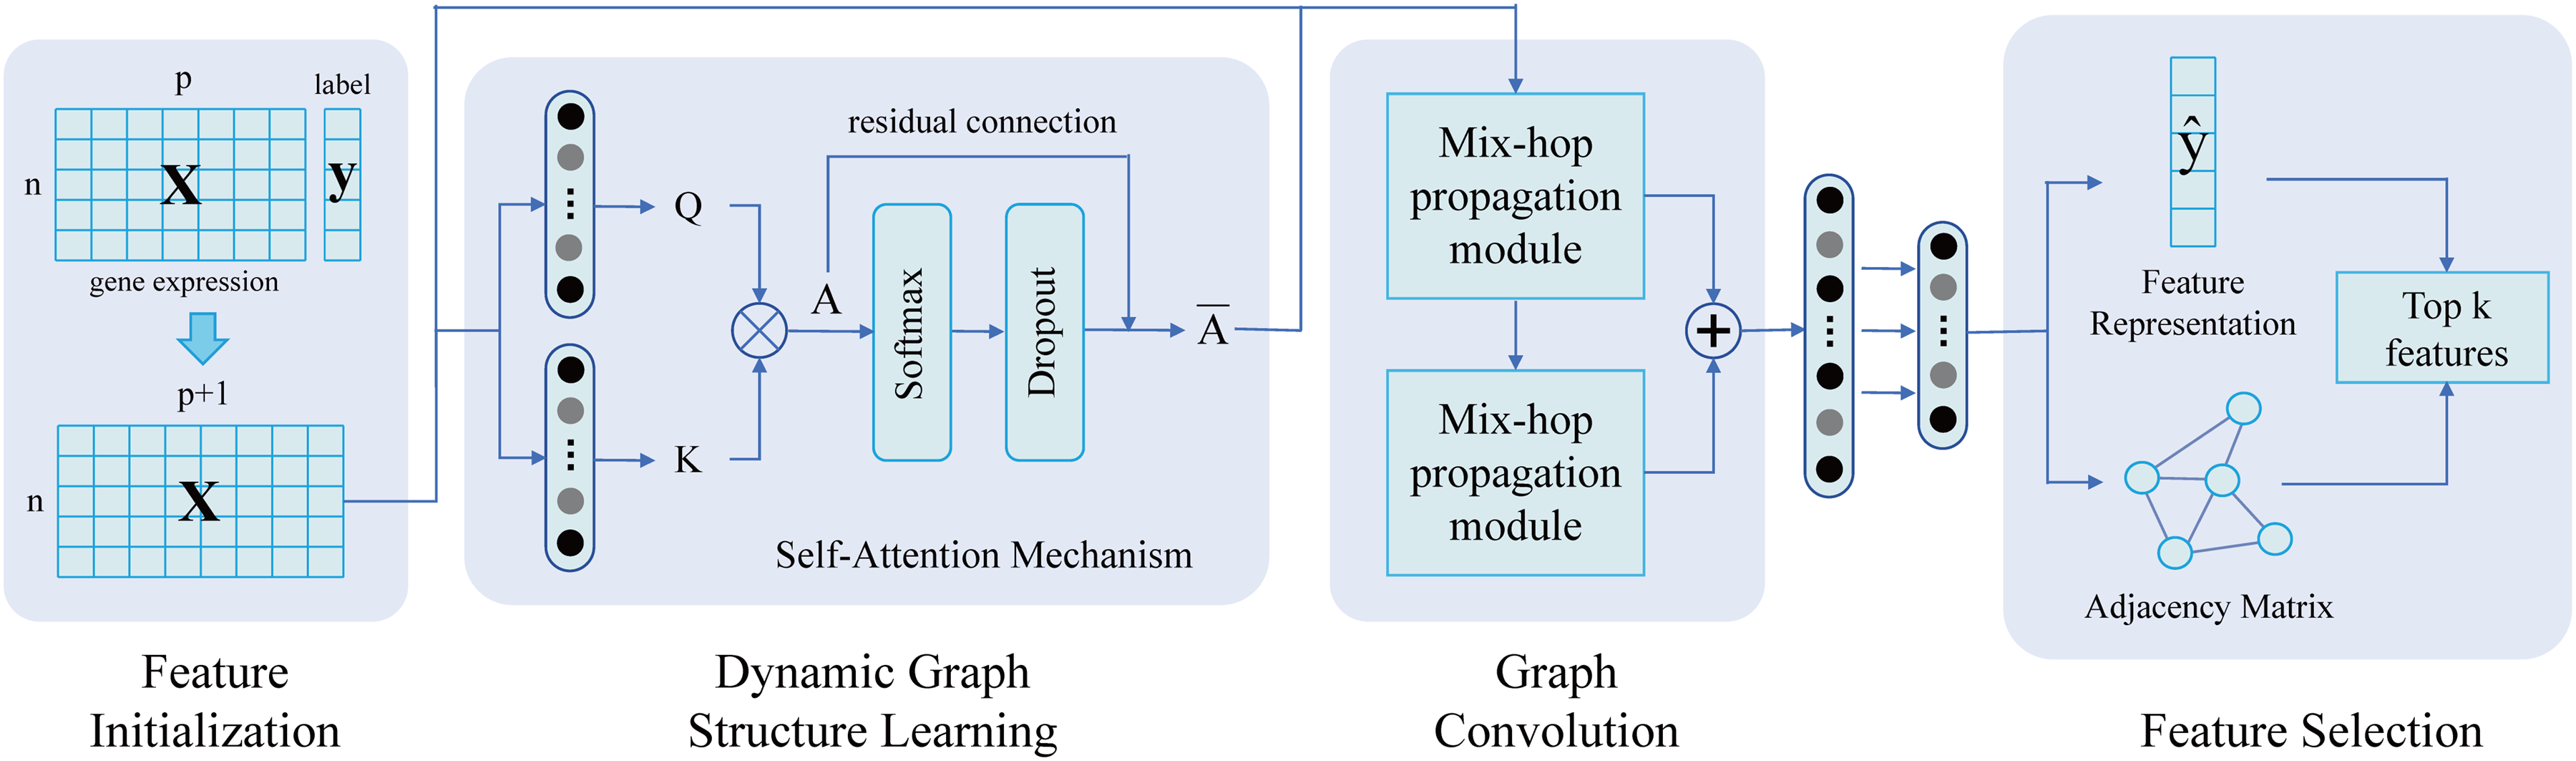
The framework of ADGCN algorithm, consisting of feature initialization, graph learning, graph convolution and feature selection.
Feature initialization
A feature matrix X is augmented with a bias feature to enhance the model's adaptability to data. The
Graph learning
Utilizing a self-attention mechanism, a Dynamic Graph Structure Learning (DynamicGL) module is introduced. This module constructs a dynamic graph structure using attention scores as edge weights, effectively quantifying the interactions between neighboring nodes based on feature associations. A custom pooling operation is applied to preserve key connections and discard less significant ones, reducing feature dimensionality and computational complexity.
Graph convolution
This part consists of two sequentially connected mix-hop propagation modules and several linear transformations to handle the information flow across nodes. The architecture of mix-hop propagation module is shown in Supplemental Figure 1. It initially leverages adjacency relationships and node features within the graph structure to propagate node information horizontally and then aggregate important feature information from various depths vertically, thereby updating the output feature representation and adjacency matrix, allowing for a dynamic adaptation to changing network structures and node importance.
Feature aelection
Combined with given classifier, ADGCN aims to continually minimize the cross-entropy loss
Identification of AD-related feature genes and construction of diagnostic models
Based on the NK cell marker genes extracted through single-cell analysis, several feature selection algorithms including GRACES, recursive feature elimination (RFE) and our purposed ADGCN were applied to identify feature genes with diagnostic value for AD, which were used to construct the diagnostic models. Our diagnostic model was a combination of feature selection algorithm and classifier, where the model first used the feature selection algorithm to extract important features and then inputted them into a classifier to perform the classification task. Based on classifiers including eXtreme gradient boosting (XGBoost), support vector machine (SVM), logistic regression (LR), gradient boosting machine (GBM), and random forest (RF), 15 diagnostic models were constructed (each model was named based on the combination of feature selection algorithm and classifier, such as ADGCN-XGBoost). Five classification metrics including AUC, F1-Score, Recall, Accuracy, and Precision were used to quantify and compare the diagnostic performance of these models and the model with the best classification performance was selected as the final risk diagnostic model. For each diagnostic model, the NK cell marker gene expression profiles from the GSE33000 dataset were inputted and divided into 60% training, 20% testing, and 20% validation sets. The trained model was evaluated on the validation set for optimal hyperparameter combinations that maximized AUC and minimized cross-entropy loss. The classification metrics were calculated on the testing set. The maximum number of features selected by the feature selection algorithms was set to 30 and the AUC values of the models under different feature numbers were outputted. The model with the highest AUC was chosen as the best-performing one to compare with other diagnostic models. To evaluate the generalizability of 15 diagnostic models, they were also tested on external gene expression datasets including GSE122063, GSE5281, and ADNI. The selected features from the best-performing model were utilized as AD-related feature genes for subsequent analyses.
Construction and validation of nomogram model
To enhance our assessment of the risk for progression from NC to AD, a nomogram model based on these feature genes was constructed. A multivariate logistic regression analysis was first conducted using the GSE33000 dataset and the selected feature genes. The nomogram model was then constructed based on the results of the analysis. The dependent variable was the 0–1 coding of the sample label, and the independent variables were the expression levels of feature genes. Subsequently, based on the contribution of each influencing factor to the dependent variable, each level of the influencing factors was assigned a score. These scores were then summed to obtain a total score, which was then converted into the probability of the occurrence of the outcome event for that individual using the Logistic Function. The predictive performance of the nomogram model was evaluated using ROC curves, calibration curves and decision curve analysis (DCA). To ensure the reliability of these feature genes in predicting individual's risk of AD, the same steps were applied to the external validation datasets (GSE122063 and GSE5281) to construct nomogram models and evaluate their predictive performance.
Differential expression analysis and enrichment analysis of AD-related feature genes
The Wilcoxon rank-sum test was applied to identify the differentially expressed genes between the AD and NC samples. To further understand the potential biological functions of AD-related feature genes, the Gene Ontology (GO) and Kyoto Encyclopedia of Genes and Genomes (KEGG) enrichment analysis were conducted and the adjusted p-values < 0.05 were considered statistically significant.
Construction of protein-protein interactions (PPI) network
To further explore the interaction mechanisms between feature genes, a PPI network was constructed using the STRING database version 12.0 (https://cn.string-db.org) and visualized using Cytoscape (version 3.10.1). A medium confidence level of 0.4 was utilized as the minimum interaction score and the disconnected nodes were concealed to obtain the final PPI network of the feature genes.
Immune cell infiltration analysis
To investigate the differences in the immune microenvironment between AD and NC samples, we quantified and compared the infiltration of 22 immune cell types in both two groups by the CIBERSORT algorithm. 16 Pearson correlation coefficients between them were computed to explore the relationships among the 22 immune cells in AD samples. Pearson correlation analysis was also conducted to explore the relationships between identified feature genes and immune cell infiltration in AD samples. A p-value < 0.05 was considered as statistically significant.
Gene-TF and gene-miRNA interactions analysis of AD-related feature genes
To assess the regulation of the transcription factors and microRNAs on the AD-related feature genes, based on the NetworkAnalyst platform (https://www.networkanalyst.ca), 17 the transcription factor targets collected from the JASPAR TF binding site profile database 18 were used for constructing a gene-transcription factor (gene-TF) regulatory network and the miRNA-gene interaction data derived from TarBase 19 were applied to construct a gene-microRNAs (gene-miRNA) interaction network. The networks were visualized by Cytoscape.
Expression quantitative trait loci (eQTL) analysis for AD-related feature genes
The MatrixEQTL R package were employed for eQTL analysis. 20 An additive linear regression model was applied to examine SNP-gene associations, with age and sex included as covariates to mitigate potential biases. We distinguished between cis-eQTLs (within 1Mb of a gene's transcription start site) and trans-eQTLs (further away), testing local and distant gene-SNP pairs separately. Benjamini-Hochberg method was applied to correct p-values with adjusted p-values < 0.05 representing significant associations.
Identification of AD-related differential methylation probes and significant CpG-gene associations
For the methylation signal matrix, the imputation of missing values, quality control and normalization of CpG signals were performed using the ‘ChAMP’ package. Besides, the CpGs signals of biological replicates were averaged. Furthermore, differential analysis was performed to identify Differential Methylation Probes (DMPs) between AD and NC groups. The one with Benjamini-Hochberg corrected p-value < 0.05 and | logFC | > 0 was considered as statistically significant DMP. Subsequently, the Pearson correlation between the expression of DMPs and NK cell marker genes were calculated to recognize significant CpG-gene pairs with absolute correlation coefficient ≥ 0.2 and p-value < 0.05. Finally, a list of AdaptAge and DamAge CpG sites indicating adaptive or detrimental effects on the aging process was obtained from a recent epigenome-wide Mendelian randomization study. 21 We intersected them with our findings to obtain AD-related functional CpG sites.
Results
Single-cell RNA analysis revealed the NK cell marker genes
After cell filtering of single-cell data, there were 24,429 cells (13,774 from AD patients and 10,655 from NC controls). PCA was conducted based on the top 2000 HVGs and the top 10 significant principal components were selected for downstream analysis. Batch effects were corrected and then eight clusters were identified by t-SNE (Figure 3A). Then cell types were annotated automatically based on the marker genes of each cluster, and were also manually checked against the CellMarker website, which resulted in five cell types and depicted in distinct colors in t-SNE projections (Figure 3B). Clusters 3 and 6 were identified as NK cell. We visualized the expression distribution of representative marker genes across cell types, highlighting their specificity (Figure 3C). Figure 3D showed the expression distribution of four NK cell marker genes across all PBMCs. A stacked bar graph (Figure 3E) was utilized for visualizing the proportion of different cell types across samples and t-SNE projections were established (Figure 3F) for all cells from AD and NC groups, stratified by cell types. Box plots (Figure 3G) highlighted the expression differences in the distribution of various cell types between the two groups. These visualization results revealed a significant reduction in NK cell cluster within the AD group. Therefore, we focused on NK cell to identify biomarkers with diagnostic value for AD. Finally, 205 NK cell marker genes with | log2FC | > 1 were identified as differentially expressed NK cell marker genes across distinct cell types.
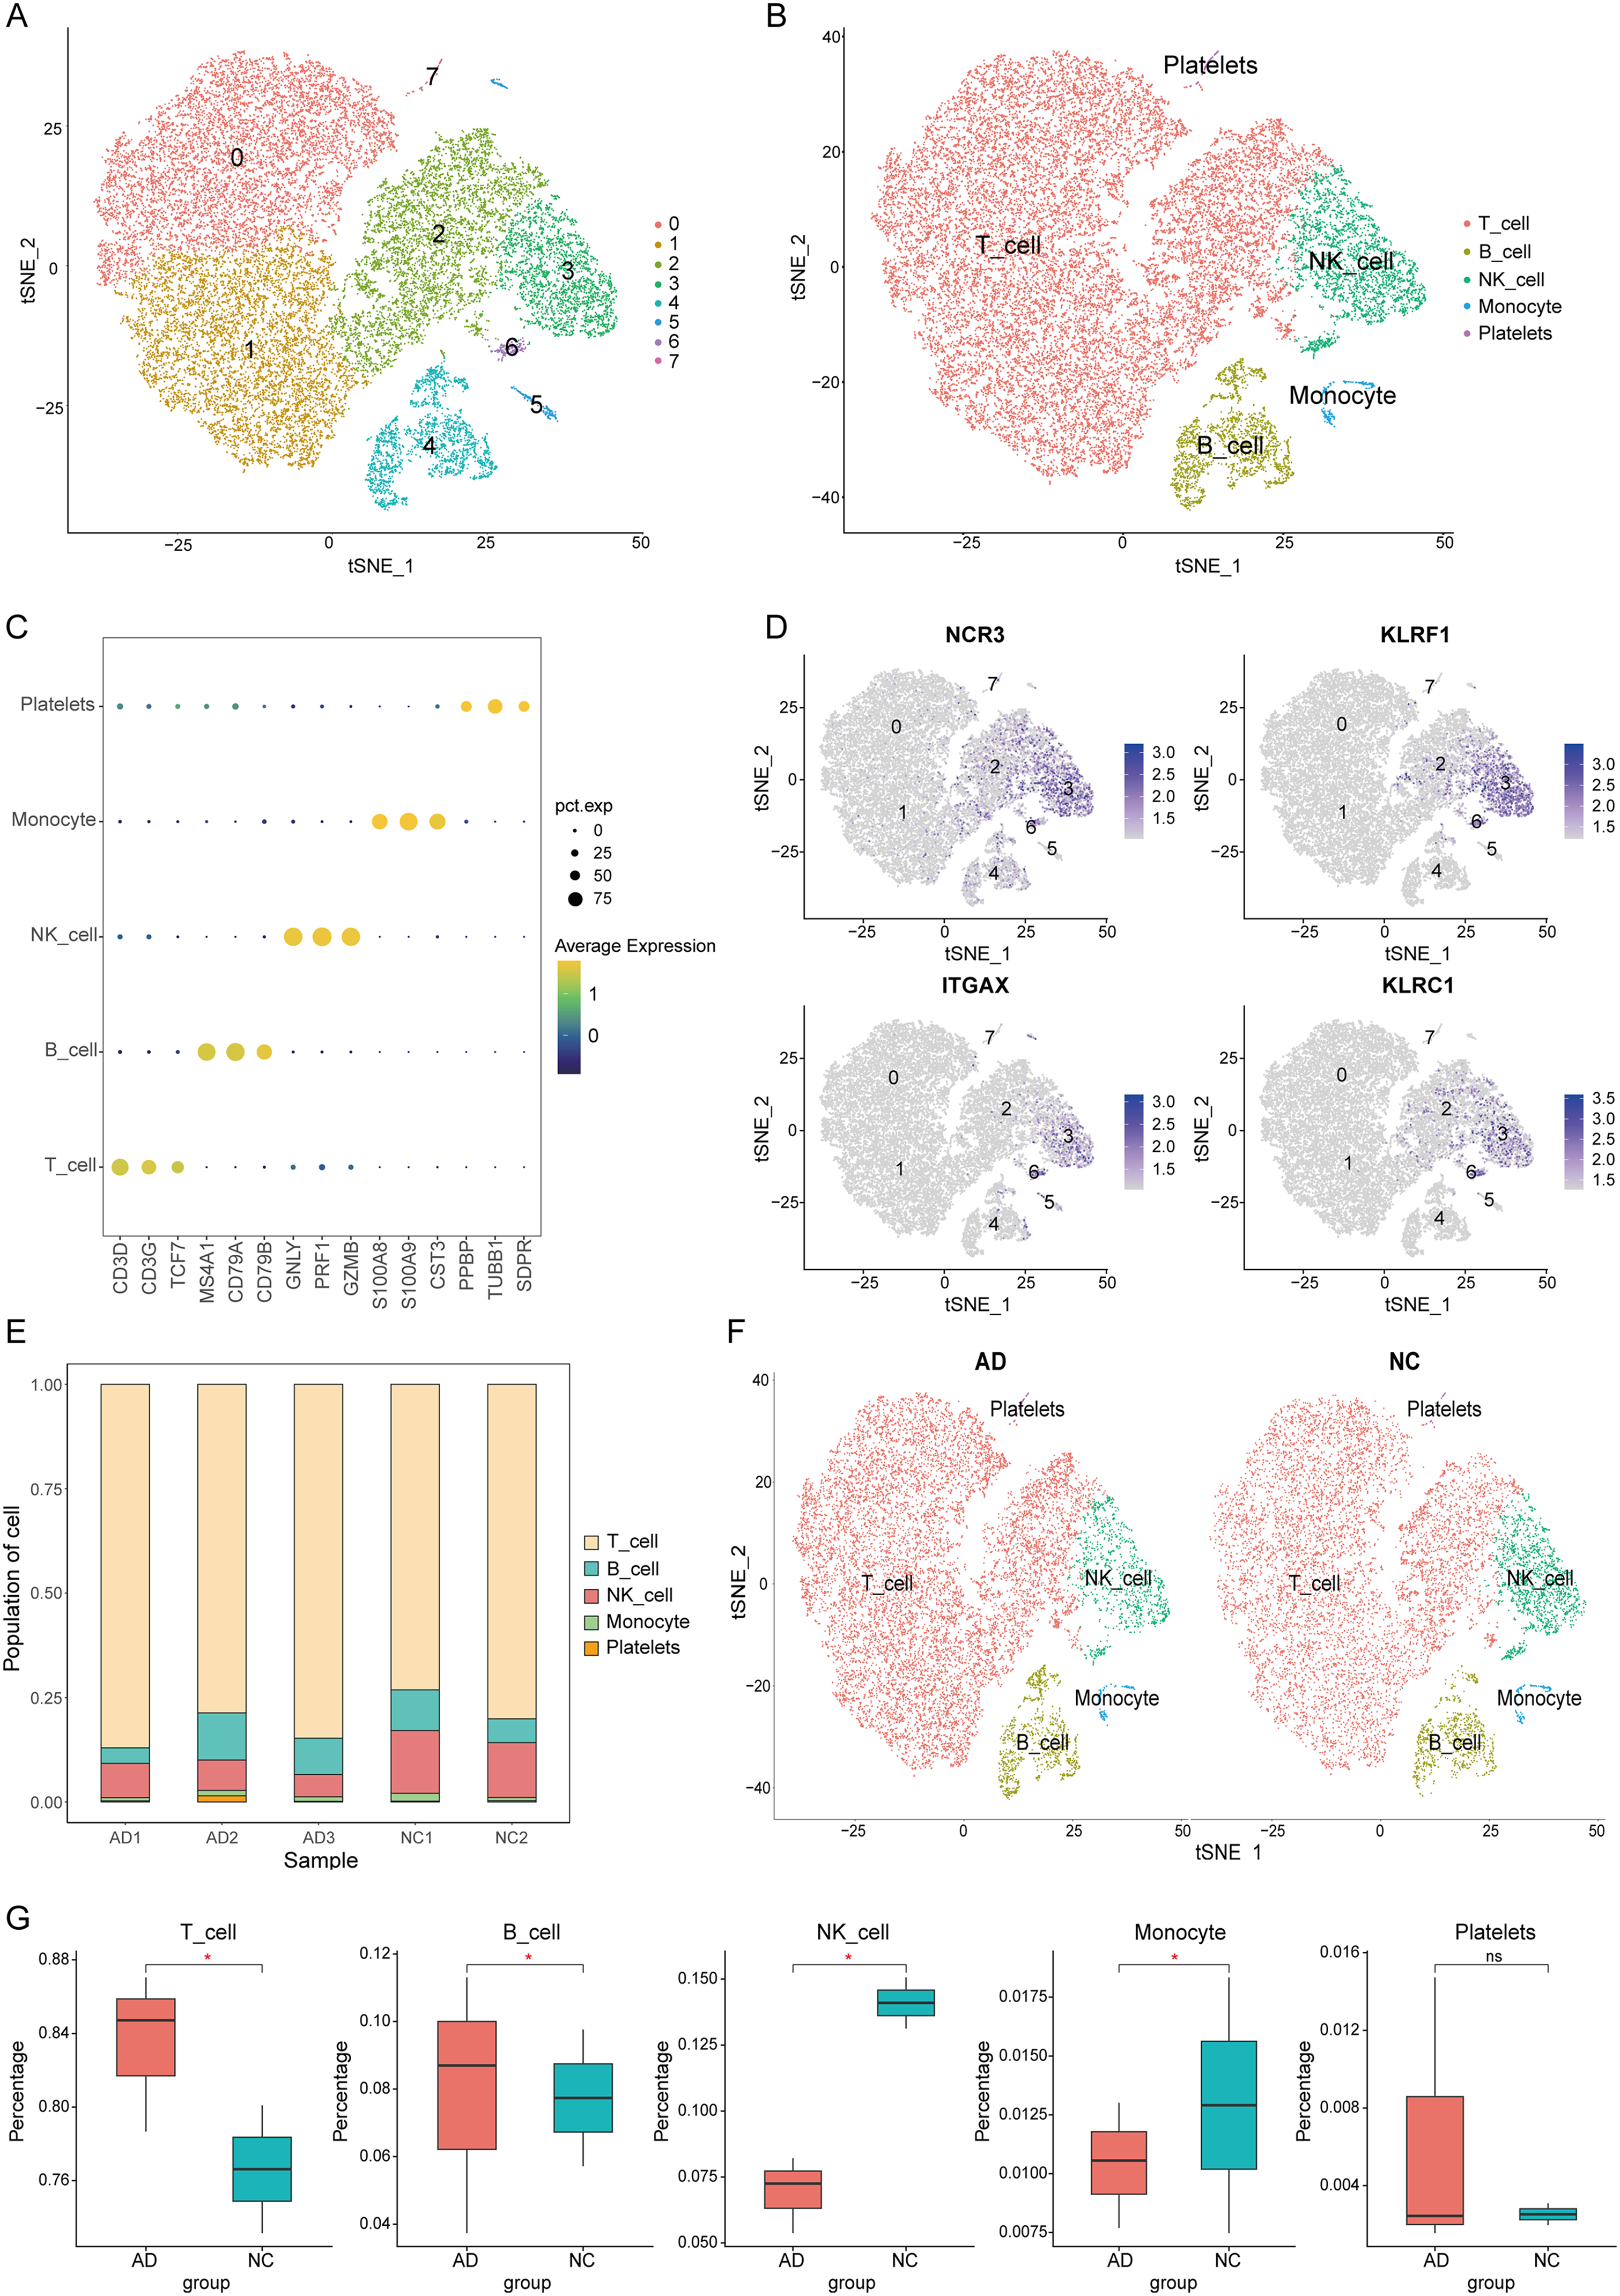
Single-cell RNA analysis of PBMCs to identify NK cell marker genes. (A) t-SNE plot of 24,429 cells from all PBMCs. Different cell clusters are colored with unique colors. (B) t-SNE plot colored by various cell types. (C) Dot plot of cell type marker genes. The color of dots represents average expression, and the size represents average percent of cells expressing selected gene. (D) Feature plots of several NK cell markers' expression. (E) Cluster distribution in each sample. (F) t-SNE plot of different cell types in AD and NC groups. (G) Cell type distribution in AD and NC groups. * means p-value < 0.05, ns means ‘no significance’.
Model comparison uncovered the best performance of the diagnostic model based on ADGCN-XGBoost
We implemented feature selection and classification tasks on the GSE33000 dataset, using combinations of three feature selection methods and five classifiers. We conducted grid search to identify the optimal hyperparameters for each diagnostic model and reported the best classification performance across different numbers of selected features (0∼30), considering those yielded the maximum AUC as the optimal features and calculating four other classification metrics based on these features. Table 1 showed the testing set classification outcomes of different diagnostic models based on the GSE33000 dataset. The results indicated that our ADGCN algorithm generally outperformed GRACES and RFE in diagnostic efficacy, particularly in combination with the XGBoost classifier, achieving optimal classification performance with 17 selected features (Figure 4A). The 17 optimal features (CD5, EEF1B2, GPR56, H3F3B, INPP4B, KLRD1, LITAF, MAP3K8, PLP2, PRSS23, RPL13A, RPL22, RPL8, SH2D2A, TCF7, TPT1, and ZEB2) were considered as AD-related feature genes for further analysis. We migrated the models and their corresponding optimal feature to external three datasets to assess their generalizability. Table 2 presented the testing set classification outcomes of different diagnostic models across three validation datasets, confirming the superior generalization performance of the ADGCN-XGBoost diagnostic model with 17 feature genes across diverse datasets. The ROC curves across the three validation datasets were visualized in Figure 4B.

Classification outcomes of ADGCN-XGBoost in different datasets. (A) Performance of the ADGCN-XGBoost model on the GSE33000 dataset under different numbers of selected features. (B) ROC curves of the ADGCN-XGBoost model on three external validation datasets.
Classification performance under different diagnostic models based on the GSE33000 dataset. Optimal features are those that enable the classifier to achieve the maximum AUC value.

The bold value indicates the maximum value of various classification metrics in GSE33000 dataset.
Classification performance of different diagnostic models across three external validation datasets.
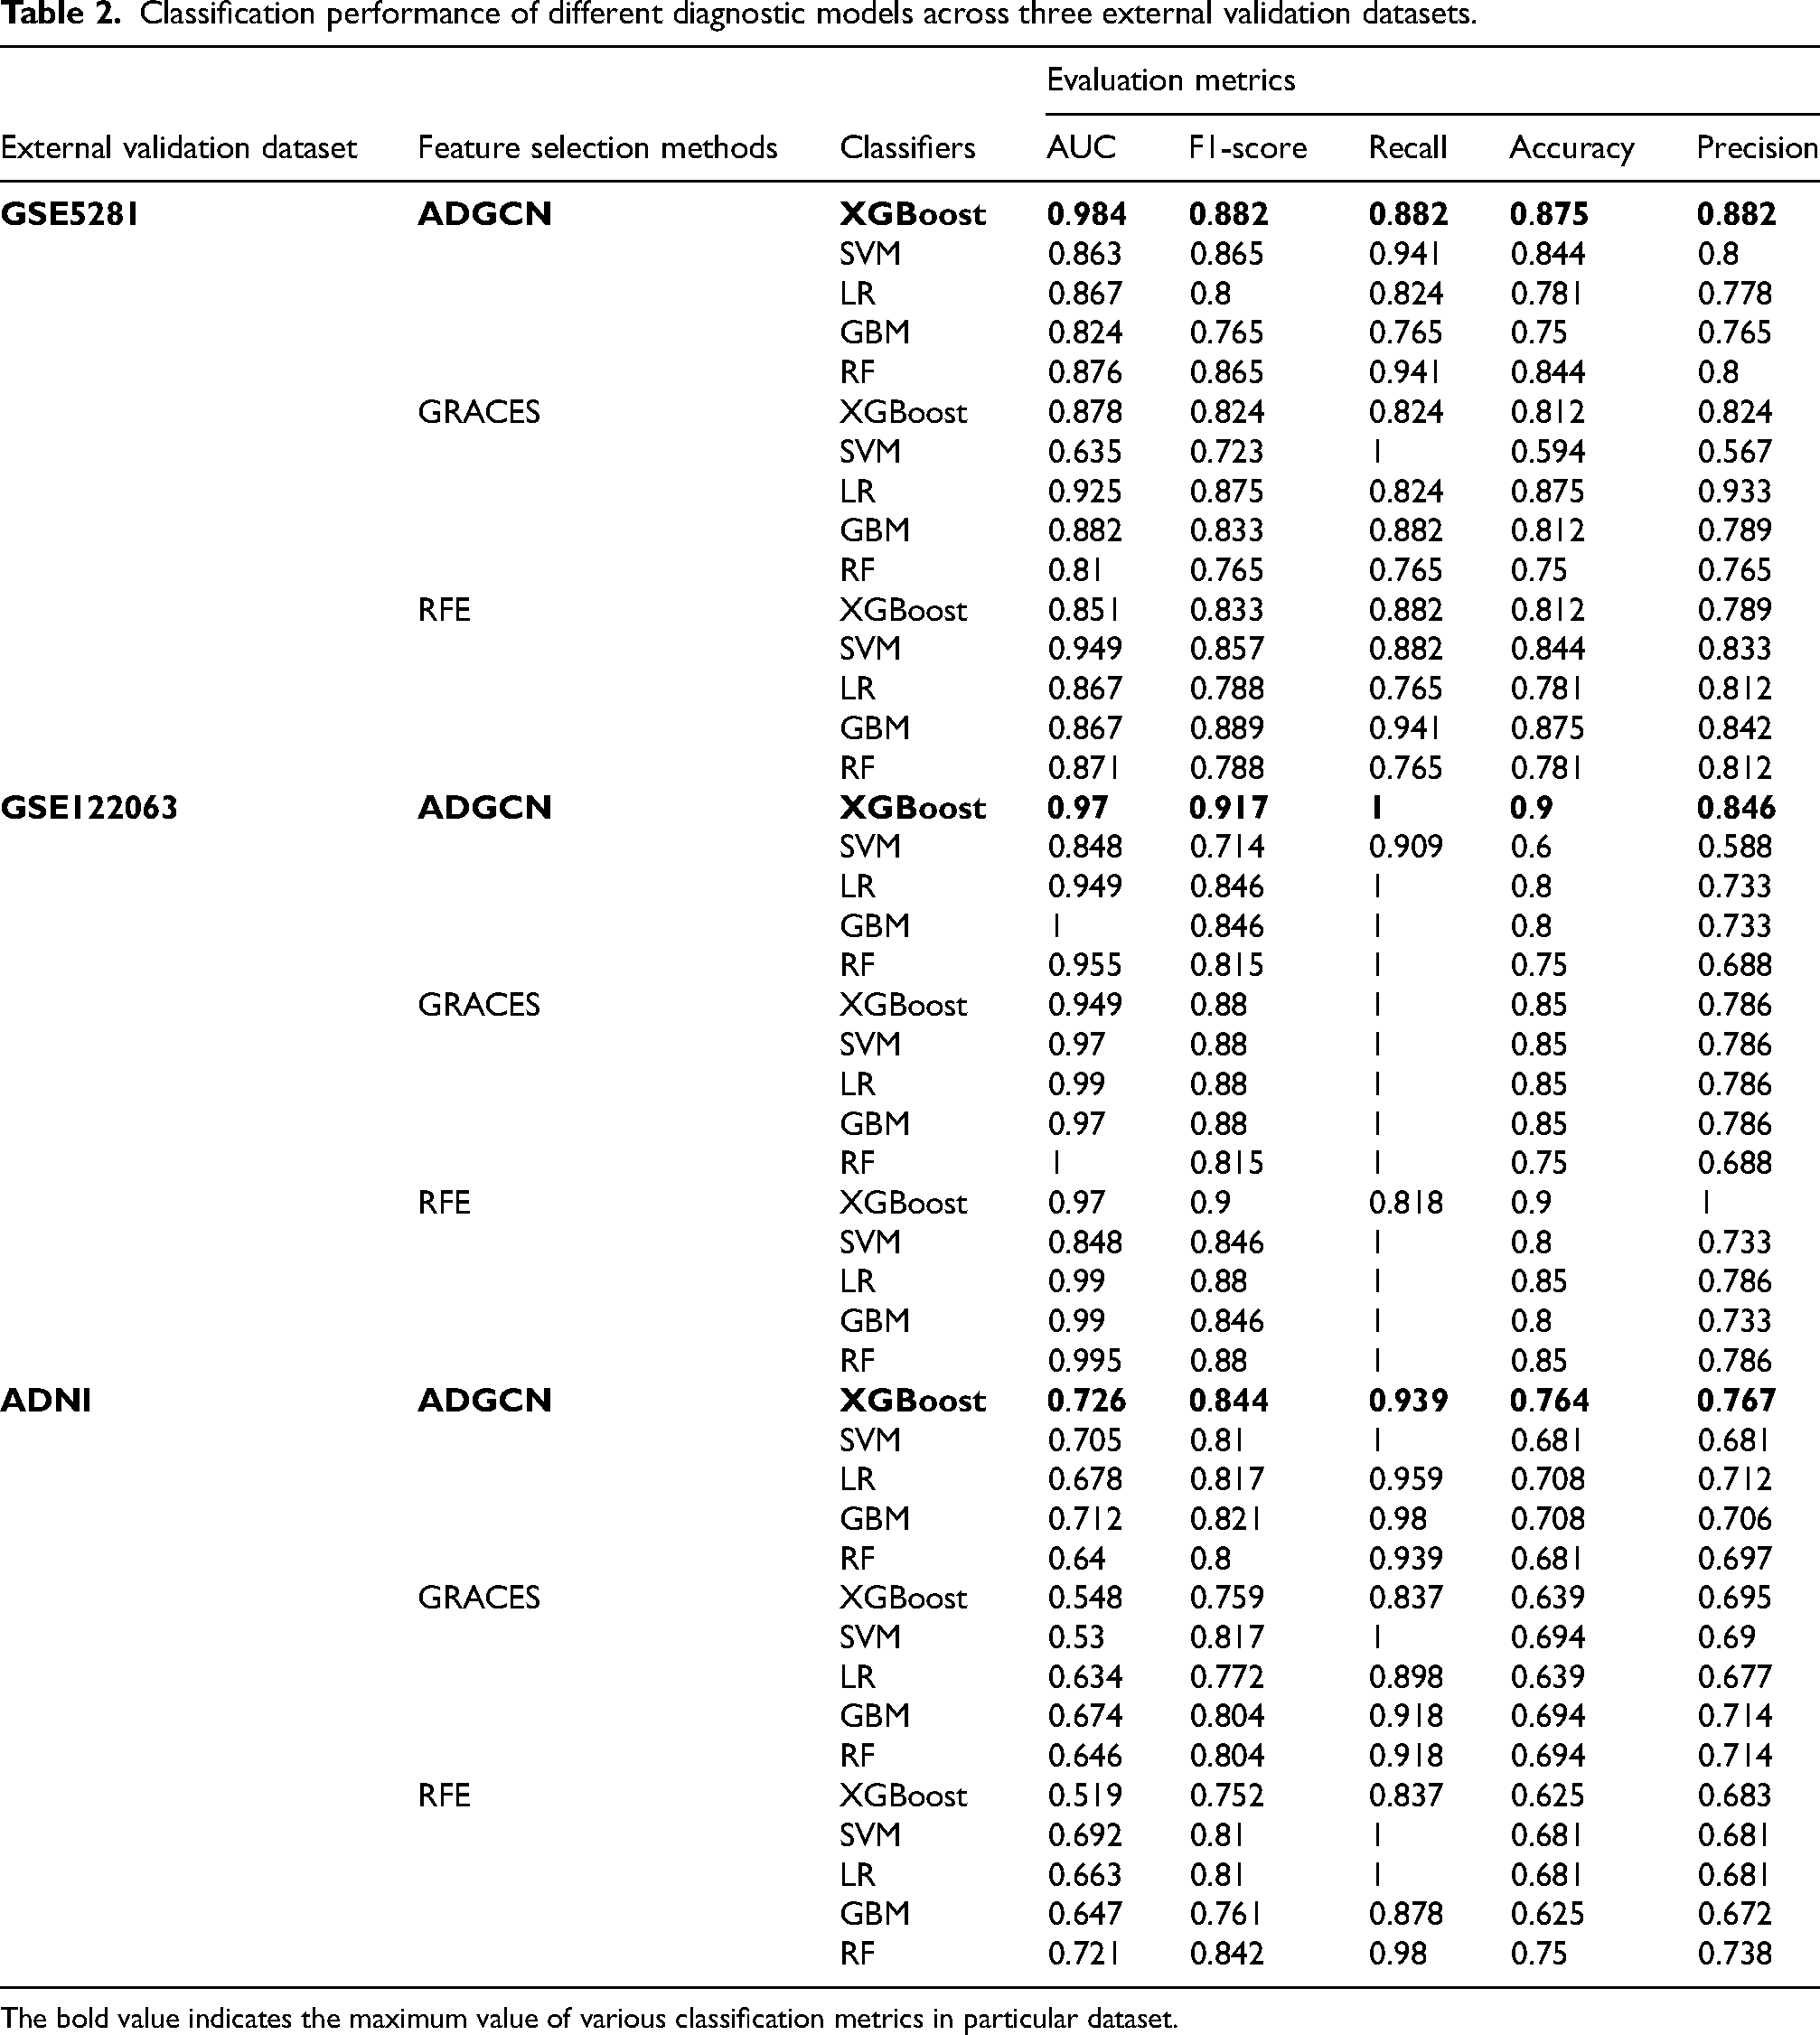
The bold value indicates the maximum value of various classification metrics in particular dataset.
Establishment and validation of nomogram model to predict the AD risk
To predict an individual's risk of developing AD, we constructed a nomogram model using the GSE33000 dataset with 17 identified feature genes (Figure 5A). Each predictive indicator within the nomogram was allocated a corresponding scoring scale, with the scores aggregated to forecast the AD risk based on the expression profile of each sample. The model demonstrated excellent predictive performance with an AUC of 0.93 (Figure 5B). The calibration curves showed a high degree of concordance between the Apparent and Bias-corrected curves, both closely aligning with the Ideal line, indicating a high consistency between the actual and predicted risk of AD (Figure 5C). Decision Curve Analysis (DCA) revealed that within a threshold range of 0–1, the model's decision curve lied above the reference strategies (All and None), suggesting its utility in clinical decision-making by effectively distinguishing between AD and NC individuals (Figure 5D). Further validation with external datasets GSE122063 and GSE5281 showed that the nomogram model based on the 17 feature genes had AUC values of 0.92 and 0.99, respectively (Figure 5E, H). Both the calibration curves (Figure 5F, I) and DCA (Figure 5G, J) confirmed the robust predictive performance of the nomogram model, validating that the 17 feature genes could reliably predict an individual's risk of developing AD.
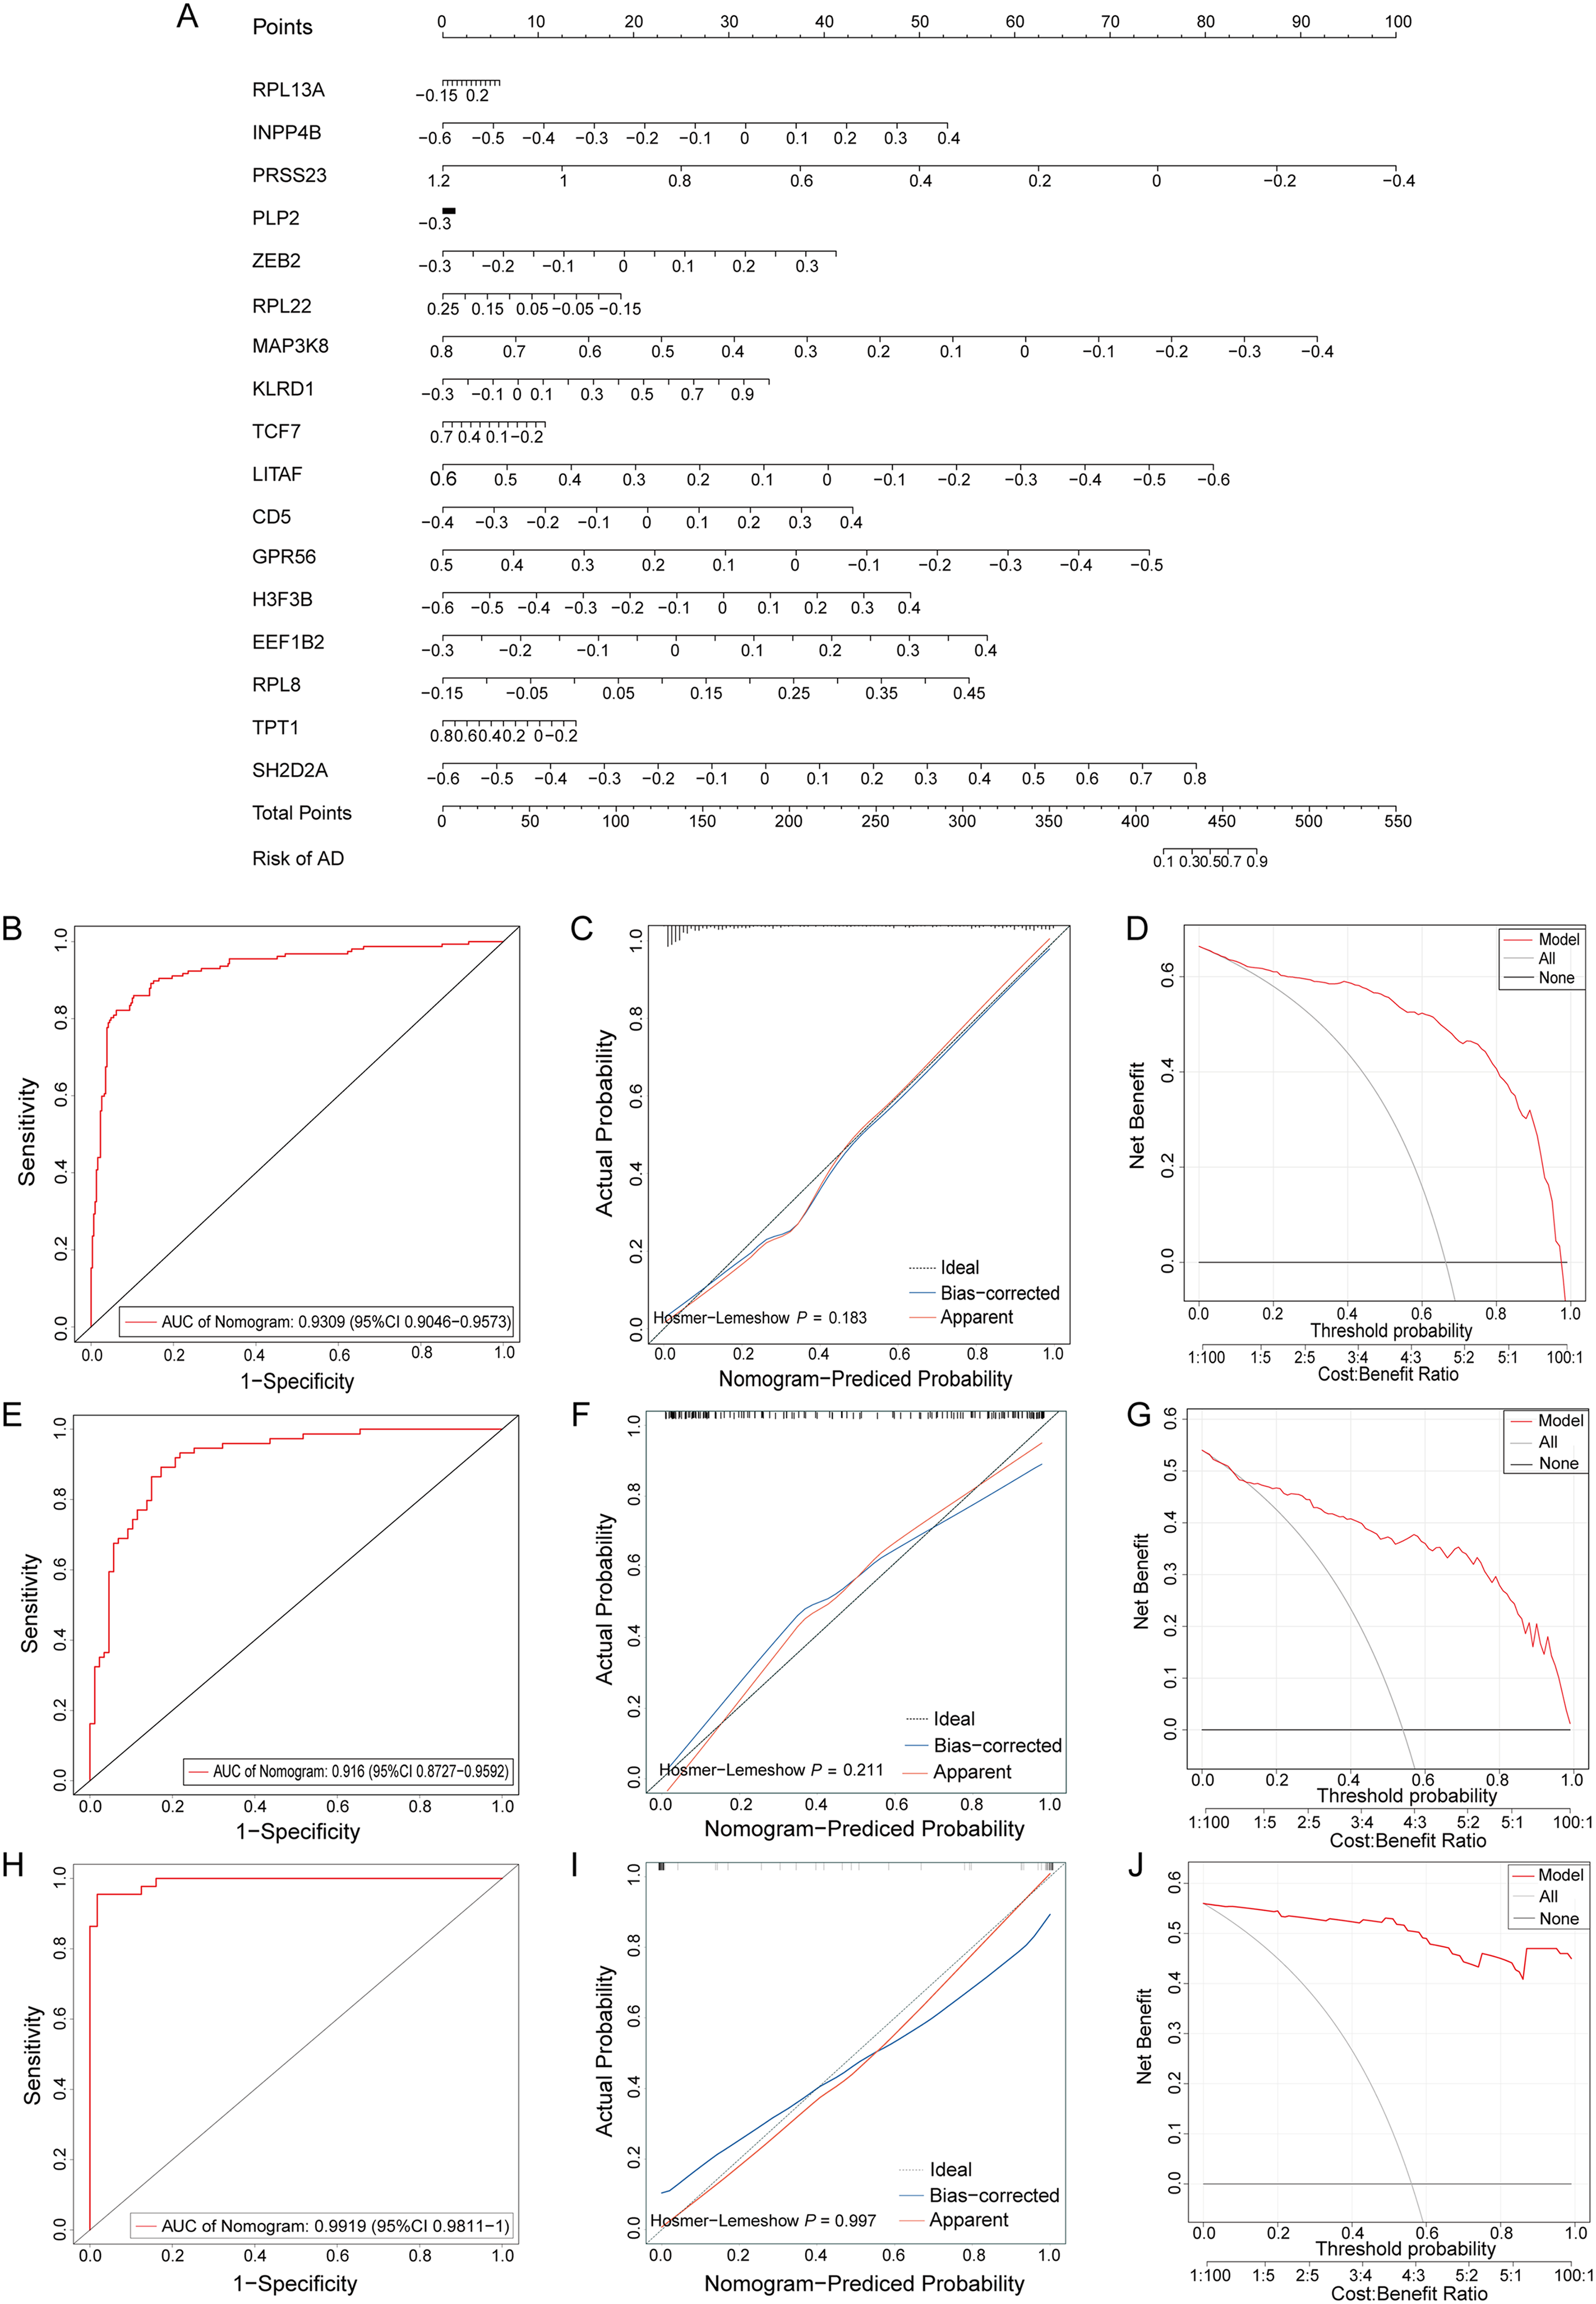
Validation of the diagnostic efficiency with 17 feature genes. (A) Construction of a nomogram for predicting the risk of AD patients based on the GSE33000 dataset and 17 feature genes, each element followed by a scoring scale. The total score is calculated by summing the individual scores of each element to predict the risk of AD. (B) The ROC curve of the nomogram model based on the GSE33000 dataset, reflecting the prediction performance. (C) Calibration curve for evaluating prediction performance of the nomogram. The higher the overlap between the Apparent and Bias-corrected curves and the closer the two curves are to the Ideal line, the better the performance. (D) Decision curve analysis for comparing the clinical benefit between the nomogram and other diagnostic indicators. (E, H) The ROC curves of nomogram model based on the external datasets GSE5281 and GSE122063. (F, G) The calibration curve and decision curve analysis for the nomogram model based on GSE5281 dataset. (I, J) The calibration curve and decision curve analysis for the nomogram model based on GSE122063 dataset.
Differential expression and functional enrichment analysis of AD-related feature genes and PPI network construction
Differential expression analysis of 17 feature genes between AD and NC groups revealed that, except for H3F3B and RPL22, all genes showed significant expression differences between the AD and NC groups (p < 0.05). Specifically, GPR56, KLRD1, LITAF, MAP3K8, PLP2, PRSS23, RPL13A, RPL8, SH2D2A, TCF7, TPT1, and ZEB2 exhibited significantly higher expression levels in AD samples, while CD5, EEF1B2, and INPP4B were downregulated (Figure 6A). Besides, the heatmap revealed significant expression correlations between most feature genes (Figure 6B). For example, MAP3K8 was correlated with all other 16 genes significantly. Additionally, most feature genes showed a positive correlation between them, with PLP2 and GPR56 displaying the most significant expression correlation. Conversely, INPP4B was negatively correlated with all other feature genes, particularly with RPL13A.

Differential expression, correlation, enrichment and regulatory network analysis of feature genes. (A) Box plots for differential expression of 17 feature genes in AD and NC groups. * means p < 0.05; ** means p < 0.01; *** means p < 0.001. (B) Heat map of Pearson correlation between the expression of 17 feature genes. Red indicates a positive correlation, while blue denotes a negative one. Larger circles with redder colors represent greater correlation. * means p < 0.05. (C) The results of GO and KEGG enrichment for 17 feature genes. (D) Heat map of correlation between expression of feature genes and 22 immune cell infiltrates in AD samples. Red indicates positive correlation, while blue indicates negative correlation. * means p < 0.05; ** means p < 0.01; *** means p < 0.001. E: The gene-TF regulatory network. The blue node is the predicted TFs, and the yellow node is the target gene regulated by TF. (F) The gene-miRNA interaction network. The blue node is the microRNAs regulating feature gene expression.
GO enrichment analysis found these feature genes significantly enriched in the regulation of biological processes such as macromolecule biosynthesis and cytoplasmic translation. They were also involved in cellular response to cytokine stimulus, peptide biosynthesis and positive regulation of sterol, cholesterol and secondary metabolite biosynthetic process. Furthermore, these genes were also enriched in the ribosome and Coronavirus disease pathways (Figure 6C).
A PPI network comprising 10 nodes and 14 edges (Supplemental Figure 2A) revealed significant interactions among feature genes, notably a central cluster of highly interconnected nodes including RPL22, RPL8, RPL13A, EEF1B2, and TPT1. Since the RPL series proteins were typically associated with the structure and function of ribosomes, playing a key role in protein synthesis, the strong connections among these proteins suggested a collective participation in ribosome biogenesis or protein translation, consistent with the findings of enrichment analysis.
Evaluation of immune cell infiltration in AD patients
We estimated the infiltration proportions of 22 immune cell types in AD and NC groups (Supplemental Figure 3A). Except for resting CD4 memory cells, monocytes, resting dendritic cells and eosinophils, significant differences were observed in the infiltration levels of most immune cells between the two groups. Specifically, neutrophils, naive CD4T cells, resting mast cells, activated dendritic cells, gamma delta T cells, plasma cells, resting NK cells, macrophages M2 and activated mast cells exhibited higher proportions in AD patients, while others were up-regulated in NC group, suggesting that alterations in the immune system may be a key factor leading to AD. Subsequently, a heatmap was plotted to visualize the correlations among the infiltration levels of these 22 immune cells in AD samples. Significant positive correlations were observed between resting mast cells and neutrophils (R = 0.54), resting dendritic cells (R = 0.43), as well as marked negative correlations with naive B cells (R =
Construction of transcription factor regulatory network and microRNA regulatory network
We utilized NetworkAnalyst platform to predict transcription factors and microRNAs regulating 17 AD-related feature genes. Ultimately, the gene-TF and gene-miRNA regulatory networks were constructed, with 27 target miRNAs and 21 TFs (Figure 6E, F; Supplemental Tables 1 and 2). TFs such as FOXC1, GATA2, E2F1, YY1, NFKB1, and miRNAs like hsa-mir-23b-3p, hsa-mir-124-3p, hsa-mir-1-3p, hsa-mir-186-5p, hsa-mir-17-3p, hsa-mir-155-5p, hsa-mir-16-5p, hsa-mir-129-2-3p, and hsa-mir-27a-3p played crucial roles in the regulation of feature genes. Notably, FOXC1, which regulated the most feature genes, may act as a core transcription factor in the transcriptional regulation of feature genes. No transcription factors or target microRNAs were predicted for the GPR56, H3F3B, and KLRD1. This analysis underscored the complex regulatory landscape influencing key pathological processes in AD.
Genetic association analysis between AD-related feature genes and SNPs
We conducted eQTL analyses to identify significant associations between 1,561,372 SNPs and 17 feature genes, resulting in 20,342 cis-associations and 26,522,982 trans-associations, with the distribution of p-values illustrated in Figure 7A. After Benjamini-Hochberg adjustment, 57 significant SNP-gene associations were identified, comprising nine feature genes and 56 trans-eQTL sites (Supplemental Table 3). Particularly, PLP2 was the common target gene of 41 SNPs, indicating that multiple genetic variations regulated the expression of PLP2. Box plots displayed the significant associations between nine feature genes and their representative eQTL sites (Figure 7B). The expression of RPL13A and RPL22 were significantly negatively regulated by SNP rs12010143, located on the X chromosome with alleles T and C, where the minor allele C was significantly associated with lower expressions of RPL13A and RPL22. Notably, rs17222919, located on chromosome 13 in the promoter region of ALOX5AP—a gene previously reported as a risk factor for AD, 22 was significantly associated with the expression level of SH2D2A (p = 8.68 × 10⁻⁸). The presence of minor allele G significantly reduced SH2D2A expression, further substantiating rs17222919 as a potential risk SNP site.

eQTL analysis for associations between SNPs and feature genes. (A) Q-Q plots of local and distal p-values. Theoretical (X-axis) p-values versus MatrixEQTL calculated p-values (Y-axis) in -log10 transformation are plotted. Red points represent cis-eQTLs, and blue points represent trans-eQTLs. The grey line represents null line. (B) Box plots for significant associations between the expression of nine identified feature genes and the SNPs. Different genotypes for SNP and their corresponding sample size are displayed on the X-axis and the expression levels of feature genes are displayed on the Y-axis. Each dot represents the expression of feature gene for one individual and the individuals are grouped per genotype. eQTL analysis is based on linear effect model and the p-value in box-plot refers to the significance of the linear regression.
Joint analysis of DNA methylation and gene expression profiles
Based on the DNA methylation signal matrix with 359,107 CpG probes from 286 samples (196 CN, 90 AD), differential methylation analysis identified 1305 DMPs with significant differences between AD and NC groups. Then, 435 significantly associated CpG-gene pairs were identified by Pearson correlation analysis, including 118 marker genes and 218 DMPs (Supplemental Table 4). A gene-centric approach was applied to annotate genomic functional regions of these CpG sites. About 5.5% of these CpG sites were in the first exon, 4.1% in 3′UTR, 7.3% in 5′UTR, 31.7% in gene body, 16.1% in TSS1500, 3.2% in TSS200, and 32.1% in IGR, annotating to 148 genes. Overlaying our identified associated CpG sites with the AdaptAge and DamAge CpG lists (Supplemental Table 5) obtained from recent Mendelian randomization research, we derived seven significantly related CpG-gene pairs (Table 3), including six marker genes, two DamAge CpG sites and three AdaptAge CpG sites. AdaptAge and DamAge CpG sites tracked beneficial or harmful methylation changes related to health, respectively. 21 AdaptAge CpG sites were the CpG sites that captured protective effects against aging, which may indicate healthy longevity, so they were potentially associated with combating the neurodegenerative processes of AD and improving overall health conditions. Conversely, DamAge CpG sites were the ones that exhibited damaging effects and correlated with adverse outcomes, including mortality, which may be considered as a biomarker of age-related damage. Therefore, analyzing DamAge can assess individual health risks and help identify methylation patterns linked to increased risk of AD, potentially aiding in early diagnosis and risk assessment. The five functional CpG sites have significantly reduced average methylation levels in AD group (Supplemental Table 6), mostly located in the promoter regions of annotated genes. The correlation scatter plots for each marker gene and its most significantly associated CpG site revealed the significant negative correlations of all CpG-gene pairs except for cg10599571-SASH3 (Figure 8). For example, cg08030082 (chr2: 25391072-25391875), located in the TSS1500-island region of POMC, showed a significant negative correlation with the expression of NCAM1 and PTGDS. cg02582963 (chr3: 153838787-153840380) in the Body-shore of SGEF displayed the strongest negative association with SH2D1B. cg27184585 (chr18: 21017671-21018011) in the TSS1500-shore of C18orf45 negatively correlated with SH2D1B and KLRF1. cg04292941 in the TSS200-opensea of DNHD1 on chromosome 11 also negatively influenced CTSC expression. In contrast, cg10599571 (chr21: 35445087-35446013) in the TSS1500-island of MRPS6 uniquely showed a significant positive correlation with SASH3. In a word, our multi-omics joint analysis unveiled the role of DNA methylation-mediated gene expression regulation in AD pathogenesis and identified epigenetic regulatory loci and genes associated with AD. However, the significantly associated genes identified did not overlap with the feature genes, indicating that these methylation sites did not directly regulate the expression of feature genes. Therefore, a PPI network analysis was conducted to further study the interactions between the significantly associated genes and the feature genes. The result revealed significant interactions between KLRF1, SH2D1B, NCAM1 and many feature genes (Supplemental Figure 2B), suggesting that the identified methylation sites may influence the expression of feature genes through the regulation of the methylation associated genes, thereby impacting the progression of AD.
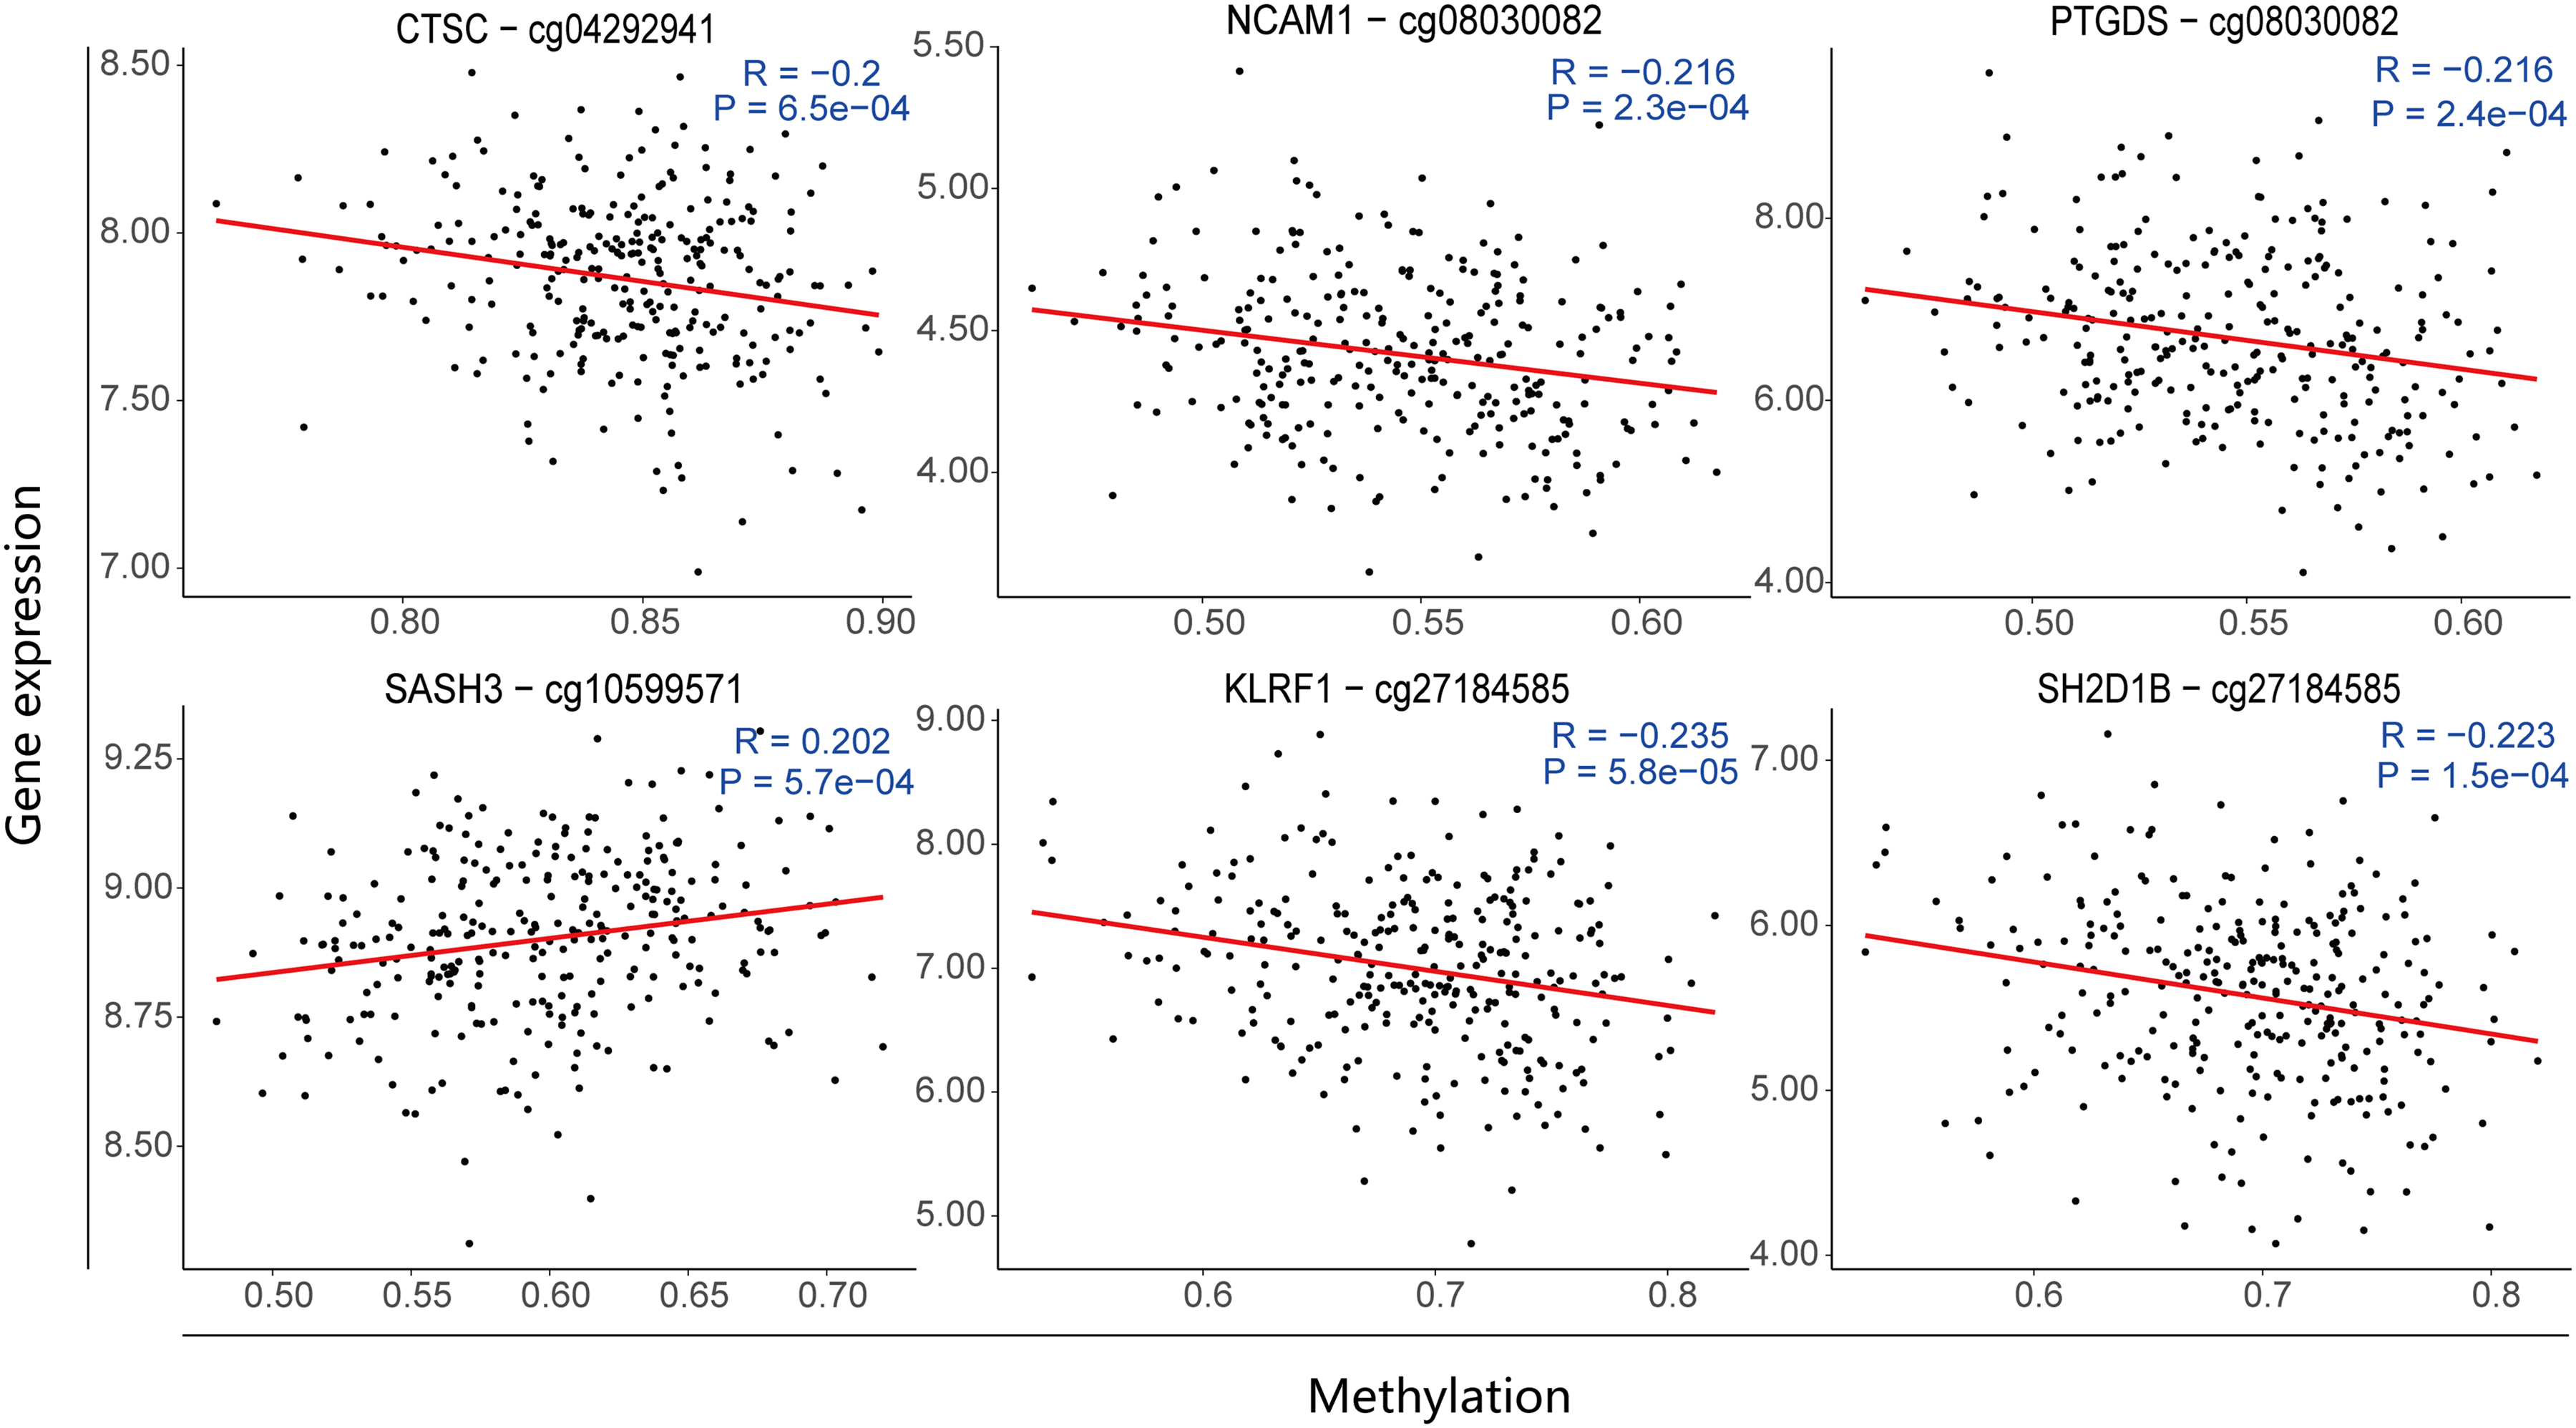
Examples of the most significantly correlated gene-methylation pairs. The X-axis represents the normalized DNA methylation levels. The Y-axis represents the normalized gene expression. R represents the Pearson correlation coefficient and P represents the significance of it. For each gene, only the most significantly associated CpG probe is plotted. Each point corresponds to a sample, and the line is the best fitted lines.
Overview of the top significant associations between gene expression and DNA methylation, sorted by the role of methylation CpG sites and ranked by the abs (Pearson correlation).

Discussion
Despite extensive studies aimed at understanding the pathophysiology of AD, the underlying mechanisms remained partially elusive. In this study, we focused on NK cell, aiming to extract biomarkers to construct a diagnostic model to distinguish between AD and NC. Therefore, we proposed a novel feature selection algorithm (ADGCN) based on deep learning technology. Previous studies have utilized GCNs to grasp the similarity relations among samples. However, most of them have relied on a fixed sample similarity network to learn sample embeddings, often leading to suboptimal outcomes. The advantage of our algorithm lied in its ability to achieve more efficient graph learning and information propagation, thereby enhancing feature selection tasks. Within the GCN framework, we incorporated a self-attention mechanism and a mix-hop propagation mechanism. The former adaptively learned the graph structure, efficiently capturing the potential interactions between samples and specific embedding information, and adaptively weighted these embeddings. The latter propagated and selected crucial node information based on the given graph structure, dynamically learning and updating the node's embedding representations and the adjacency matrix. The optimal graph structure reflected in the final output was used for selecting important features. Adaptive and dynamic graph learning ensured model's enhanced adaptability. Comparisons with existing feature selection algorithms highlighted the superior performance of our proposed algorithm. Consequently, 17 feature genes with clinical value were identified for the construction of AD diagnostic model.
Most of the 17 genes have been reported to be related to AD. EEF1B2 was identified as a potential biomarker for the pathogenesis of AD. 23 A deficiency in GPR56 would lead to neurological dysfunctions. 24 De novo mutations in H3-3B (also known as H3F3B) were linked to neurodevelopmental delays, dysmorphic traits, and structural brain abnormalities. 25 INPP4B was significantly co-expressed with RBFOX1, 26 whose downregulation led to destabilization of mRNAs encoding for synaptic transmission proteins, contributing to the loss of synaptic function in AD. 27 ZEB2 (also known as SIP1) influenced the development of neurological diseases such as AD by regulating the epithelial-mesenchymal transition (EMT) process. 28 Previous research had demonstrated that CD5 could serve as a biomarker for neuroinflammation to distinguish AD. 29 CD5 was also a key factor affecting cognitive function. 30 TCF7 promoted the differentiation of neural progenitor cells by enhancing the activity of the Wnt signaling pathway, thereby influencing the neural development. 31 It was reported that inhibiting TPL2 (MAP3K8) kinase activity could be a treatment option for neurodegenerative disorders. 32 TPT1 (also known as TCTP) was a critical protein for cell survival during early neuronal and glial differentiation and was essential for cortical neurogenesis. 33 LITAF exacerbated neuroinflammation by promoting the expression of tumor necrosis factor alpha (TNF-α). TNF-mediated neuroinflammation was linked to neuronal necroptosis in AD hippocampus. 34 PLP2 was closely related to processes such as immune cell migration and proteoglycans in tumors, suggesting that PLP2 may influence the infiltration of immune cells in the immune microenvironment of AD. 35 SH2D2A, a gene encoding the T cell-specific adapter protein (TSAd) involved in the regulation of T-cell activation, was associated with genetic susceptibility to multiple sclerosis. 36 Several ribosomal proteins (RPs) including RPL13A and RPL22 have been reported to play important regulatory functions in controlling inflammation. 37 RPL8 was associated with ferroptosis. 38 It was reported that ferroptosis played a role in the pathogenesis of AD. 39 Research indicated that PRSS23 was a potential biomarker for neurological disorders such as epilepsy and schizophrenia,40,41 while KLRD1 was a cytotoxic effector molecule of NK cells, significantly related to the immune-related signaling pathways such as the natural killer cell-mediated cytotoxicity pathway. 42 Their clinical association with AD required further study. In summary, these 17 feature genes could be potential biomarkers for AD.
Our enrichment analysis found these genes enriched in some biological processes and pathways associated with AD. For example, local cell translation in AD altered protein synthesis, affecting synaptic plasticity, neurotransmission and mitochondrial metabolic processes, ultimately resulting in cognitive decline and neurodegeneration. 43 Additionally, ribosome dysfunction played a critical role in AD by impairing the synthesis of proteins essential for neuronal function and survival. This led to damage in synaptic function and plasticity, ultimately affecting memory and cognitive functions. 44
Furthermore, gene-TF interactions analysis identified 21 transcription factors potentially regulating these genes. Among these 21 TFs, some of them played important roles in AD. For example, the overexpression of SRF in small cerebral arteries has been proved to contribute to AD pathogenesis. 45 ARID3B played a significant role in neuronal development and could be induced during neural injury. 46 E2F1, a key transcription factor regulating the cell cycle, was increasingly expressed in AD and contributed to the neuronal cell death. 47 The pathological accumulation of Aβ peptide depleted neuronal BRCA1, leading to cognitive deficits in AD. 48 NFKB1 was involved in the inflammatory process and accelerated neuronal apoptosis in AD patients. 49 Studies indicated a significant reduction of CREB1 in AD patients, leading to impaired memory functions. 50 USF2, which regulated genes involved in lysosome function, was identified as a key regulatory factor in the expression changes of neuronal cells in AD. 51 GATA2 played a vital role in the activation of neuroglobin, which has been proven to protect neuronal cells in AD. 52 Abnormalities in lipid metabolism were linked to pathological features in AD, and SREBF1 was a crucial transcription factor that controlled lipid metabolism, 53 indirectly influencing AD by affecting the balance of lipid metabolism in brain. Studies indicated that reduced transcription of ELK4 in AD decreased the permeability of the blood-brain barrier. 54 YY1 regulated the transcription of FE65 and BACE1 to indirectly modulate the level of Aβ, thereby affecting AD progression. 55 Studies have found that SREBF2 was increasingly expressed in LOAD (late-onset Alzheimer's disease), serving as a biomarker for AD at both pathological and gene expression levels. 56 MEF2A had anti-apoptotic effects on neurons, and its reduced transcriptional activation activity might be a risk factor for neuronal loss or cerebrovascular dysfunction, thereby increasing the risk of LOAD. 57 The absence of SOX10 might lead to decreased CD55 expression, followed by activation of the complement system, increased cell death, and thus affecting AD progression. 58 Changes in NR2F1 activity within neurons could affect mitochondrial function and consequently led to cognitive deficits. 59 Genome-wide association studies have shown that genetic variations in NFIC were associated with AD. 60 ZNF354C was identified as a regulatory factor of cell apoptosis in AD, showing significant therapeutic value. 61 Our results showed that these 17 signature genes were regulated by these important TFs, which may provide potential drug targets for drug research.
Besides, gene-miRNA interactions analysis identified 27 miRNAs and some of these miRNAs were also linked to AD. Hsa-miR-186-5p has been identified as a central regulatory biomolecule for AD, with upregulated expression observed in AD patients. 62 Hsa-miR-92a-3p, 63 Hsa-miR-27a-3p 64 and Hsa-let-7d-5p 65 acted as potential diagnostic biomarkers for AD, characterized by their downregulated expression in AD patients. Hsa-miR-26a-5p, 66 Hsa-miR-16-5p, 67 and Hsa-miR-155-5p 68 have been also identified as miRNA biomarkers to distinguish AD patients from healthy controls, with their significantly increased expression in AD. Hsa-miR-590-3p downregulated in AD, and its dysregulation might play a role in AD pathogenesis by affecting the maturation of amyloid precursor protein (APP) mRNA. 69 The downregulation of Hsa-miR-124-3p in AD led to elevated levels of BACE1, resulting in hyperphosphorylation of the tau protein and ultimately cell death. 70 The reduced expression of Hsa-miR-20a-5p in AD led to increased expression of APP, thereby further promoting the level of Aβ, which was a critical signal of AD. 71 The changes in Hsa-miR-494-3p 72 and Hsa-miR-16-5p 73 expression also played a key role in AD pathogenesis. All these important miRNAs can be used as targets for drug therapy.
Considering the significant regulatory roles of genetic variations and epigenetic modifications in AD pathogenesis, our study leveraged the multi-omics data from ADNI for genetic association analysis. Fifty-seven significant SNP-gene associations and seven significantly associated CpG-gene pairs were identified, where the latter included six marker genes, two DamAge and three AdaptAge CpG sites potentially influencing AD. Notably, AdaptAge and DamAge CpG sites were epigenetic clocks that tracked beneficial and detrimental methylation changes, respectively. AdaptAge specifically identified CpG sites that captured protective effects against aging. Consequently, in theory, the individual predicted to be older by AdaptAge might have accumulated more protective changes during aging. Conversely, DamAge contained CpG sites that exhibited damaging effects, serving as biomarkers of age-related damage. 74 Researches have demonstrated that the epigenetic clock was based on the fact that epigenetic age, estimated from DNA methylation levels using machine learning algorithms, was highly correlated with chronological age. Therefore, the discrepancy between epigenetic and chronological age has been linked to the severity of cognitive decline in AD patients. 75 Thus, AdaptAge and DamAge also held potential as biomarkers relevant to AD.
The findings enhanced our understanding of AD and may inform future therapeutic strategies, yet limitations exist. Our identified feature genes were derived from public datasets and constrained by the sample size available in the GEO database, requiring validation in large-scale, prospective clinical studies. Additionally, some potential mechanisms related to AD identified in our study lacked comprehensive explanation due to limited literature support. Moreover, our genetic association analysis produced a list of AD-related genetic variations and epigenetic regulatory sites without delving into how these genetic factors affect AD through gene expression regulation. Therefore, future research with larger sample sizes is needed to confirm our conclusions and further explore the underlying biological mechanisms, providing theoretical support for developing new treatment strategies.
Conclusions
This study focused on NK cells, employing single-cell sequencing analysis method to identify NK cell marker genes. A novel feature selection algorithm (ADGCN) was developed to extract 17 AD-related feature genes. An optimal risk diagnostic model (ADGCN-XGBoost) composed of these feature genes was constructed, demonstrating high diagnostic effectiveness across different datasets. Subsequently, a series of bioinformatics analyses revealed that these feature genes were mainly related to cell activation and translation, and potentially played key roles in regulating the immune infiltration status in AD patients. Twenty-seven miRNAs and 21 TFs potentially influencing these genes were predicted from two regulatory networks. Additionally, based on the multi-omics data from ADNI, 57 significant SNP-gene associations and seven significantly associated CpG-gene pairs were identified, which enhanced our understanding of the genetic regulatory mechanisms in AD pathogenesis.
Supplemental Material
sj-docx-2-alz-10.1177_13872877241295316 - Supplemental material for The study of Alzheimer's disease risk diagnosis based on natural killer cell marker genes in the multi-omics data
Supplemental material, sj-docx-2-alz-10.1177_13872877241295316 for The study of Alzheimer's disease risk diagnosis based on natural killer cell marker genes in the multi-omics data by Xiaorong Chen, Fuyan Hu, Qingjia Chi and Congjun Rao in Journal of Alzheimer's Disease
Supplemental Material
sj-xlsx-3-alz-10.1177_13872877241295316 - Supplemental material for The study of Alzheimer's disease risk diagnosis based on natural killer cell marker genes in the multi-omics data
Supplemental material, sj-xlsx-3-alz-10.1177_13872877241295316 for The study of Alzheimer's disease risk diagnosis based on natural killer cell marker genes in the multi-omics data by Xiaorong Chen, Fuyan Hu, Qingjia Chi and Congjun Rao in Journal of Alzheimer's Disease
Footnotes
Acknowledgements
The authors would like to thank the GEO and ADNI database for the data support of this article. Particularly, while the investigators involved in the ADNI contributed to the design and implementation of the study through their work for ADNI and/or by providing data, they did not engage in the analysis or writing of this report.
Author contribution(s)
Funding
The authors disclosed receipt of the following financial support for the research, authorship, and/or publication of this article: This work was supported by Shanghai Municipal Science and Technology Major Project (No.2018SHZDZX01), Key Laboratory of Computational Neuroscience and Brain-Inspired Intelligence (LCNBI) and ZJLab. This study was also supported by National Defense Foundation Strengthening Program (NO. 2022-JCJQ-ZD-224-12). Grants-in-Aid only financially supported this study and had no role in the design of the study and collection, analysis, and interpretation of data, or in writing the manuscript.
Declaration of conflicting interests
The authors declared no potential conflicts of interest with respect to the research, authorship, and/or publication of this article.
Data availability
The data supporting the findings of this study were openly available in public databases. The scRNA-seq data for single-cell analysis were derived from the Gene Expression Omnibus (GEO, https://www.ncbi.nlm.nih.gov/geo/) database under accession number GSE181279 (Available at the following URL: https://www.ncbi.nlm.nih.gov/geo/query/acc.cgi?acc = GSE181279), while the bulk RNA sequencing data for the construction and validation of diagnostic models were derived from the GEO database under accession numbers GEE33000, GSE122063 and GSE5281 (Available at the following URLs: https://www.ncbi.nlm.nih.gov/geo/query/acc.cgi?acc = GEE33000; https://www.ncbi.nlm.nih.gov/geo/query/acc.cgi?acc = GEE122063; https://www.ncbi.nlm.nih.gov/geo/query/acc.cgi?acc = GEE5281). Additionally, the multi-omics data for genetic association analysis can be accessed from the Alzheimer's Disease Neuroimaging Initiative (ADNI) database (![]() ) by applying for a data access permission.
) by applying for a data access permission.
Supplemental material
Supplemental material for this article is available online.
References
Supplementary Material
Please find the following supplemental material available below.
For Open Access articles published under a Creative Commons License, all supplemental material carries the same license as the article it is associated with.
For non-Open Access articles published, all supplemental material carries a non-exclusive license, and permission requests for re-use of supplemental material or any part of supplemental material shall be sent directly to the copyright owner as specified in the copyright notice associated with the article.