



Abstract
Background
Memory consolidation in sleep-dependent individuals involves the circuitry connections of cortex, thalamus and hippocampus, regulating via neural metabolites. However, the disruption of metabolic pattern in thalamus and hippocampus remains unclear.
Objective
We aim to explore the disruptive effects of insomnia on the metabolites during memory consolidation, particularly the underlying neurometabolic mechanisms in comorbidity of failed memory consolidation.
Methods
This study integrates clinical research with animal experiment. In clinical research, 49 participants were divided into four groups: healthy controls (HC, n = 11), insomnia with normal cognition (IS, n = 14), mild cognitive impairment without insomnia (MCI, n = 10), and insomnia with mild cognitive impairment (IS-MCI, n = 14). Magnetic resonance spectroscopy (MRS) was used to evaluate the neural γ-aminobutyric acid (GABA) and glutamate–glutamine (Glx) in bilateral thalamus. In experimental studies, the rat model of sleep deprivation combined with amyloid-β (Aβ) injection was established, after behavior testing, the levels of Glx, choline (Cho) and N-acetyl aspartate (NAA) in the bilateral hippocampus were evaluated with MRS.
Results
The patients in the IS-MCI group exhibited significantly lower GABA level than IS, MCI and HC groups. Results from rat studies showed that sleep deprivation exacerbated asymmetric alterations in Aβ-induced bilateral hippocampal metabolite abnormalities, which correlated with cognition. These neuro-metabolite disruption accompanied with synaptic loss and activation of astrocytes.
Conclusions
The lateralized decrease in GABA levels of thalamus and NAA, Cho, and Glx levels of hippocampus under conditions of sleep disturbance with cognitive decline may provide evidence for the neural metabolic mechanisms underlying the disruption of memory consolidation.
Keywords
Introduction
Sleep is a dynamic state that is vital for sustaining optimal cognitive performance, immune and metabolic functions. 1 The regulation of sleep is significantly influenced by the modulation of neurotransmitters and the normalization of synaptic strength, which are crucial for cognitive functioning notably memory consolidation. 2 It is worth noting that sleep disorders can inhibit nerve growth and neuronal survival, which may adversely affect brain resilience and induce alterations in brain function and structure. It is important that sleep disorders in clinical diagnoses is increasingly common, especially for insomnia.3–5 Alarmingly, over 50% of middle-aged and elderly individuals worldwide have reported experiencing sleep disturbances, with reports indicating that 60–70% of cognitive impairment patients suffer from sleep loss.6,7 Thus far, sleep disorders have been firmly recognized as a primary risk factor for the development of Alzheimer's disease (AD) and the exacerbation of cognitive impairment.8,9 However, the precise impact of these sleep disorders on memory consolidation and the distinctions between individuals with insomnia and those with comorbid cognition impairment warrant further investigation. 10
It has been observed that kinds of neuro-metabolite, especially the excitatory and inhibitory neurotransmitters responsible for sleep-wake rhythm, could be disrupted in the clinical patients with sleep disorders.11,12 Neurotransmitter plays an important role in synaptic plasticity and long-term potentiation, subsequently promoting information processing throughout the nervous system, which is essential for learning, memory, and cognition. 13 In previous magnetic resonance spectroscopy (MRS) studies, abnormal levels of choline (Cho), γ-aminobutyric acid (GABA), and glutamate (Glu) in cortex have been verified to affect information processing and form the basis of cognitive and executive function loss in mild cognitive impairment (MCI) patients. 14 Similarly, sleep disorder was associated with lower GABA levels as well and may mediate impaired working memory. 15 Therefore, cortical neurometabolism, as the part of chemoconnectomic link between the hippocampus, cortex, and thalamus, can significantly influence memory consolidation, which is contingent on neurotransmitter homeostasis. 16 Nevertheless, the effects of sleep disorders on subcortex area related to memory consolidation, along with the specific patterns of neurometabolism change within pertinent brain regions, such as the thalamus and hippocampus, remains poorly understood.
In term of memory consolidation, the subcortical thalamus assumes a central role in this process, facilitating sleep-dependent interactions between the hippocampus and the cortex. 17 This intricate neural circuit linking hippocampo-cortico-thalamic regions can be characterized by the region-specific metabolite and neurotransmitters of its component nuclei or their target neural pathways.18,19 For thalamus, it projects extensively to the cerebral cortex via glutamatergic, cholinergic, and monoaminergic neurons, finely regulating thalamocortical synchronization essential for cognitive processes and synaptic plasticity. 20 Moreover, this synchronization is also observed in the hippocampus during sleep, 21 where declarative memories are replayed through sharp-ripples waves, inducing plastic changes in downstream structures, often in couple with thalamic spindles waves, ultimately modifying synaptic connections in the cortex. 22 To be more specific, the anteromedial thalamus is functionally and physiologically positioned for its role in memory consolidation, as it receives direct inputs from the hippocampus, primarily mediated by excitatory neurotransmitter. 23
While research has mainly focused on mesoscopic circuitry and processes that support memory consolidation, particularly in how the electrophysiological oscillation coordinate within these regions, there remains a largely neglect of the neuro-metabolic connectivity and patterns involved in hippocampo-cortico-thalamic memory consolidation. Thus, for a deeper comprehension of the mechanisms of how sleep disturbances escalate the risk of dementia progression, especially in cases of comorbidity where memory consolidation failed, the concealed neurometabolic mechanisms necessitate further elucidation. 24 In this study, we employed MRS, the sole in vivo method for measuring metabolites, to investigate the disruptive effects of sleep disorder on the metabolites, such as glutamate-glutamine (Glx), GABA, Cho, etc. of the thalamus and hippocampus, both integral to the process of memory consolidation, in insomnia, MCI, and insomnia with MCI patients, as well as sleep deprivation combined with amyloid beta (Aβ)-injection rat model. 25 Furthermore, we explored the possible mechanisms of sleep deprivation aggravating Aβ-induced cognitive decline.
Methods
Clinical study design
This study is a cross-sectional case-control design that utilizes MRS to measure GABA and Glx levels in participants with insomnia and MCI (IS-MCI), insomnia and normal cognition (IS), MCI without insomnia (MCI), and healthy controls (HC). It has been approved by the Ethics Committee of Beijing Tiantan Hospital, Capital Medical University (No. KY202112402) in accordance with the principles of the Helsinki Declaration. Written informed consents have been obtained from participants.
Subjects
For this study, a prospective recruitment was conducted from February to August 2023, targeting middle-aged and elderly patients with chief complaints of insomnia combined with memory decline through internal posters, online platforms, outpatient clinics, and community outreach strategies at Beijing Tiantan Hospital.
Inclusion criteria
(1) Age ≥ 55 years old; (2) Right-handed; (3) Montreal Cognitive Assessment (MoCA) total score > 17, with self-sufficiency in daily activities and no dementia; (4) Education level of elementary school or above.
Exclusion criteria
(1) According to brain MRI and medical history excluded patients with other central nervous system diseases: cerebrovascular disease, Huntington's disease, brain trauma, hydrocephalus, and brain tumors, vascular dementia, Lewy body dementia, frontotemporal dementia, other dementia diseases and definite family history of dementia and nervous system degenerative diseases; (2) Patients with hearing, vision, language comprehension, and expression impairments that prevent them from cooperating with the assessment scale; (3) Patients with severe systemic diseases, such as severe liver, kidney, heart dysfunction, and tumors according to medical history; (4) Patients with psychiatric symptoms such as delirium and schizophrenia; (5) Patients with other sleep disorders were excluded according to scales: sleep apnea syndrome, rapid eye movement sleep behavior disorder, restless legs syndrome, narcolepsy; (6) Used sleep medications or psychotropic drugs in the past months.
Grouping
Diagnosis of insomnia disease according to the third edition of the International Classification of Sleep Disorders (ICIS-3), with a Pittsburgh Sleep Quality Index (PSQI) score > 5. Participants meet above criteria with MoCA scores of 26 or higher were defined as the IS group, while those with MoCA scores between 17 and 26 were defined as the IS-MCI group. Participants with MoCA scores between 17 and 26 who did not meet the above criteria for insomnia were defined as the MCI group (if education level < 12 years, MoCA total score plus 1 point). The HC group were matched by age and gender.
Clinical data collection
Clinical demographic information: age, gender, ethnicity, marital status, educational level, employment status, smoking history, drinking history, history of hypertension, diabetes, hyperlipidemia, heart disease, trauma and surgery, anxiety and depression.
The following scales of cognitive, sleep, and mood assessed by experienced physicians for enrolled patients:(1) PSQI is used to assess subjective sleep quality, with a total score ranging from 0 to 21. A higher score indicates poorer sleep quality. The total score > 5 is defined as poor sleep quality, while total score of 5 or lower is defined as good sleep quality. 26 (2) The Insomnia Severity Index (ISI) is used to assess the severity of insomnia, 27 with a total score ranging from 0 to 21. A higher score indicates more severe insomnia. (3) MoCA is a comprehensive cognitive assessment tool. The total score ranged from 0 to 30, normal was defined as ≥26 if the education level was ≥12 years, and normal was defined as > 25 if the education level was < 12 years.28,29 (4) The Alzheimer Disease Assessment Scale-Cognition (ADAS-cog) focuses on evaluating language and memory functions. The total score ranges from 0 to 70, with a higher score indicating more severe cognitive impairments. 29 (5) The Digital Span Test (DST) assesses verbal short-term memory and working memory. 30 It includes two forms: the Forward Digit Span (DST-F) and the Backwards Digit Span (DST-B). A lower score reflects poorer working memory. (6) The Digit Symbol Substitution Test (DSST) measures information processing speed and attention. 31 The total score ranges from 0 to 90, with a higher score indicating better cognitive function. (7) The Complex Figure Test (CFT) assesses visual-spatial construction and visual memory. 32 The total score ranges from 0 to 36. A higher score and shorter completion time reflect better cognitive function. (8) The Stroop Color-Word Test (Stroop) evaluates executive function and cognitive control including four parts: A, B, C1and C2. 33 Each part has a total score ranging from 0 to 50, with the time recorded. A higher score and shorter completion time reflect better cognitive function. (9) The Patient Health Questionnaire-9 (PHQ-9) is used to evaluate depressive symptoms. 34 The total score ranges from 0 to 27, with a higher score indicating more severe depression. (10) The Generalized Anxiety Disorder-7 (GAD-7) is used to evaluate anxiety symptoms. 35 The total score ranges from 0 to 21, with a higher score indicating more severe anxiety.
Experimental animals
This study involved adult male Sprague-Dawley rats obtained from the Animal Experiment Center of Capital Medical University, aged 6–8 weeks. The rats were housed in pathogen-free cages (4 rat/cage) and were randomly divided into three groups: control (Con), sleep deprivation (SD), amyloid-β oligomer (AβO)–induced rat model of AD (Aβ) and sleep deprivation with Aβ injection (SA). The experiments were approved by ethical guidelines of Capital Medical University (Permit Number: AEEI-2020–180). The rats were kept under controlled environmental conditions, including a temperature of 22 ± 2°C, a relative humidity of 55 ± 2%, and a 12-h light/dark cycle, with ad libitum access to water and food.
Animal study design
The study consisted of four main stages. After habituation, rats in both the SA and SD groups underwent sleep deprivation, with rats in the SA and Aβ group also receiving AβO injections on the 5th day. After stopping the sleep deprivation on the 8th day, cognitive assessments and MRS scanning was performed. Then, the brains were removed for morphological analysis and the relationship between behavioral performance and MRS results was examined. 36
Intracerebroventricular (ICV) injection of soluble Aβ1−42 oligomers
Soluble Aβ1−42 oligomers were prepared following previously established protocols. 37 For the drug preparation, the Aβ1−42 peptide from AnaSpec was dissolved in hexafluoroisopropanol (HFIP) and evaporated for 30 min. Then, it was diluted in 2 mM dimethyl sulfoxide (DMSO) to reach a concentration of 1 mM. For the pre-injection procedure, rats’ heads were securely fixed in a brain stereo positioning instrument (Alc-H Shanghai), and the area around the bregma was surgically prepared and disinfected with iodophor. An incision was made along the skull's midline, subcutaneous tissue was removed, and the wound was cleaned. A craniotomy was performed 0.8 mm caudal to the bregma and 1.2 mm along the right lateral midline using a dental drill (Rivard), reaching 4 mm depth beneath the brain surface. 38 Next, a 10-μl microsyringe (Goger Industries, Shanghai) was inserted vertically, and 2.2 μl of soluble Aβ1−42 oligomers were slowly administered over 5 min using an automated drug administration system (Harvard apparatus). A 10-min waiting period followed to ensure proper diffusion of the solution. 39
Sleep deprivation
The rats underwent seven days of sleep deprivation using a novel automatic apparatus (KW-BD, Nanjing Calvin Biotechnology Co. Ltd). This apparatus includes a cage with a built-in rotating bar designed to discourage sleep. The bar rotated at a speed of 2 circles per minute, changing direction every 30 min, followed by a 30-min rest period. Sleep deprivation took place from 8:30 am to 4:30 pm daily. To evaluate the effects, an initial rat's movements were recorded to ensure immobility did not exceed 30 s during the sleep-restricted period. Before the experiment, rats were familiarized with the apparatus for 48 h. Rats not undergoing sleep deprivation were housed in similar cages without the rotating bar. 9
Novel object recognition test
The Novel Object Recognition (NOR) test represents a widely employed behavioral assessment for investigating various facets of learning and memory processes. 40 During training, rats explore two identical objects, and during testing, one object is replaced with a new one. Rats naturally prefer novel objects, reflecting their memory of the familiar object. Retention intervals were set based on established parameters, and discrimination ratios were calculated using Smart recording software (version 3.0.06, Panlab Harvard Apparatus). A ratio of zero shows no preference, while a positive value indicates a preference for new objects. Between trials, the apparatus and objects were cleaned with a 75% ethanol solution and dried. 36
Magnetic resonance imaging (MRI)
Clinical MRI acquisition
MRI was performed using a 3 T MR scanner (Signa Premier, GE Healthcare). Participants were instructed to maintain stability of the head and neck, stay awake, close their eyes, and relax during the MRI scan. T1-weighted volumetric images with a resolution of 1 mm isotropic were acquired using the MP RAGE sequence (acquisition in the sagittal plane, field of view = 256 mm, acquisition matrix = 256, slices = 192, flip angle = 8°, preparation time = 880 ms, recovery time = 400 ms, acceleration factor = 2, acquisition time = 4:00). Two 20 × 20 × 20 mm3 voxels were placed in the bilateral thalamus. The MEGA-PRESS sequence was used to acquire 1H spectra for GABA detection, with the following parameters: echo time/repetition time = 68/2000 ms, data points = 2048, spectral width = 2000 Hz, and averages = 160 (each side scan time of 11 min 28 s).
Animal MRI acquisition
Four groups of rats underwent MRI on day eight after one week of sleep deprivation and behavioral tests (n = 11 per group). Prior to the scans, all rats completed behavioral tests the previous night. MRI was conducted using a 7.0 T magnetic scanner (Bruker, Bioclinscan 70/30, Germany) equipped with a high-performance 290 mT/m self-shielded gradient system (gradient coil, BGA20-S) with slew rates up to 1160 Tm-1s-1. The setup included a body coil for RF transmission (31cm RT aperture) and a four-channel surface coil for signal reception (2.3 cm × 1.5 cm). Anesthesia was induced via intraperitoneal injection of a combination of pentobarbital sodium, ethanol, chloral hydrate, magnesium sulfate, and propylene glycol (0.3 mL/kg). Each rat was positioned prone in an MRI-compatible cradle with the head fixed. Respiratory rate was monitored using a pressure pad (SA Instruments, Inc), and body temperature was maintained at 37°C (±2°C) using a feedback loop-controlled heated water bed with warm water tubing (Thermo Fisher Scientific, Inc).
The MRI sequence included T1-weighted localization sequences in three planes and high-resolution fat-saturated T2-weighted 2D turbo spin-echo (TSE) sequences in coronal and axial views. For the axial T2WI images, the parameters were: TR = 3300 ms, TE = 41 ms, FA = 90°, FOV = 40 × 40 mm2, matrix = 240 × 320, slice thickness = 0.8 mm, NS = 18, NA = 2, spatial resolution = 0.16 × 0.12 × 0.8 mm3, and TA = 7 min 36 s. For the coronal T2 TSE sequence, parameters were: TR = 2600 ms, TE = 41 ms, FA = 90°, FOV = 32 × 40 mm2, matrix = 192 × 320, slice thickness = 0.8 mm, NS = 16, NA = 1, spatial resolution = 0.16 × 0.12 × 0.8 mm3, and TA = 2 min 23 s.
Before the MRS scan, the magnetic field homogeneity was adjusted using a standard automatic local tuning procedure until reaching the desired half-band width (FWHM). Stability testing was conducted, followed by 1H-MRS data acquisition using CSI sequences to assess metabolite concentrations. The CSI grid was positioned on the volume of interest (VOI) covering the left and right hippocampus based on T2WI morphological images of axial slices. Parameters for the CSI sequence were set as follows: TR = 1500 ms, TE = 135 ms, FOV = 10 × 10 mm2, slice thickness = 4 mm, voxel matrix = 8 × 8, nominal voxel size = 1.25 × 1.25 × 4 mm3. Other settings included NA = 24, average = 4, and TA = 5 min 36 s (1 min 24 s × 4) with no interpolation. Voxels within the hippocampus were selected for metabolite analysis.
MRI data processing
For human, the GABA analysis toolbox GANNET3.3 (http://gabamrs.org) was used. 41 The processing steps included combining phased-array coil data, frequency and phase correction using spectral correction, exponential line broadening, fast Fourier transform, time averaging, frequency and phase correction based on water and creatine (Cr) signals, exclusion of data with fitted parameters greater than 3 standard deviations from the mean, and subtraction to generate edited difference spectra (and extract OFF spectra). The resulting GABA and Glx concentrations were expressed as ratios to water (GABA and Glx/water) and as integrated ratios to Cr (GABA/Cr and Glx/Cr). Voxel co-registration was performed for T1-weighted structural acquisition. Two experts visually inspected the spectra for artifacts. Data with obvious motion artifacts or insufficient water suppression were excluded. Finally, data that met quality criteria were included in the analysis.
For animal, using morphological T2WI images, voxels from both sides of the hippocampus were chosen to create spectral waves and concentration maps of metabolites in animals. The MRS spectral data were processed using the Syngo spectral post-processing package (software Numaris/4, version Syngo™ MR B17, Siemens Healthcare, Erlangen, Germany) as previously described. 42 The frequency range of interest was 4.3–0.1 ppm, with peaks of 3.02 ppm, 3.22 ppm, 2.02 ppm, and 2.35 ppm representing Cr, Cho, N-acetyl aspartate (NAA), and Glx, respectively. Since the Cr methyl resonance value at 3.02 ppm remains stable despite pathologies, it was used as an internal reference for calculating the relative levels of other metabolites. 43
Immunofluorescence and imaging analysis
The dissected rat brains were embedded in optimum cutting temperature (OCT) compound, frozen in liquid nitrogen, and stored at −80°C. They were then sectioned into 20 μm slices in the coronal plane using a cryostat (freezing microtome) for immunochemistry. The brain sections were mounted on glass slides, fixed with ice-cold 4% PFA (Sigma-Aldrich) for 15 min, washed three times with 10 mM phosphate buffered saline (PBS), and permeabilized with 0.3% Triton-X 100 for 30 min. Prior to overnight incubation with the primary antibody GFAP (rabbit monoclonal anti-GFAP, 1:2000, DAKO) at 4°C, the sections were blocked with normal horse serum (5%; Gibco) for 30 min at room temperature. The following day, the sections were washed three times with PBS to remove residual primary antibodies and then incubated with Alexa-Fluor 594-conjugated secondary antibodies (donkey anti-rabbit IgG, 1:500, A11058, Invitrogen, Paisley, UK) in a dark room at room temperature for 2 h. After counterstaining with Hoechst 33342 (1:1000, Sigma-Aldrich) for 15 min, the tissue sections were mounted with anti-fading mounting medium and cover-slipped. Negative control sections were treated with PBS instead of the primary antibody.
Fluorescent images of astrocytes were captured using a laser scanning confocal microscope (TCS SP8 STED LSCM, Leica) at 20× magnification and processed with LAS X software (Leica). The number and branches of GFAP+ cells were measured in the hippocampus DG and CA1 regions using NIH ImageJ software with the “Sholl Analysis” tool (National Institutes of Health, BetheISa, MD, USA). Red fluorescence represented GFAP signals, while blue fluorescence represented DAPI signals. All images were analyzed by an observer blinded to the experimental conditions.
Transmission electron microscopy (TEM)
Rats were first perfused with saline solution and then with 4% paraformaldehyde in 0.1 mol/L phosphate buffer. The brains were removed, and 1.0 mm3 tissues from the hippocampus and corpus callosum were dissected out. After post-fixation in 2.5% glutaraldehyde, the samples were dehydrated in graded acetone and embedded in Epon 812. Ultrathin sections of 70 nm thickness were stained with 4% uranyl acetate-lead citrate, collected on copper grids, and observed using transmission electron microscopy (TEM, HT7700, Hitachi). Synaptic ultrastructure alterations were identified, focusing on artifact-free synapses with clearly visible presynaptic terminals, synaptic clefts, postsynaptic membranes, and postsynaptic density (PSD). The thickness of PSD was measured using ImageJ software, and the distance of vesicle-active zones (within 200 nm distance of active zones) was measured using LoClust01 software. 38
Statistical analysis
All statistical analyses were carried out by using SPSS 20.0 software (SPSS, Chicago, IL, USA). Variables are expressed as means ± standard deviation (SD), or median (interquartile range), or frequency (percentage). Data were compared using the Fisher's exact test for categorical variables, the one-way analysis of variance (ANOVA) and Kruskal-Wallis test for continuous variable. Pairwise multiple comparisons of Kruskal-Wallis test and least significant difference multiple comparisons test of ANOVA were used for within-group comparisons. For bilateral cerebral hemisphere comparisons, the independent sample paired t-test was performed, and the interaction effects was analyzed by two-way ANOVA with Bonferroni's post hoc comparisons. Correlations were assessed between clinical scales, behavior performances and MRS results using general linear regression analysis. For MRS data, the analyzing method is mentioned in the section of DATA Processing. A significant difference was considered if the p-value was less than 0.05.
Results
Characteristics of clinical participants
The study process is shown in Figure 1. A total of 49 participants were included in this study and completed the clinical information collection and scale evaluation. According to sleep and cognition function, they were divided into four groups: healthy control group (HC), insomnia with normal cognition group (IS), mild cognitive impairment without insomnia group (MCI), insomnia with mild cognitive impairment group (IS-MCI). Subsequently, MRS scans of the bilateral thalamus were performed.
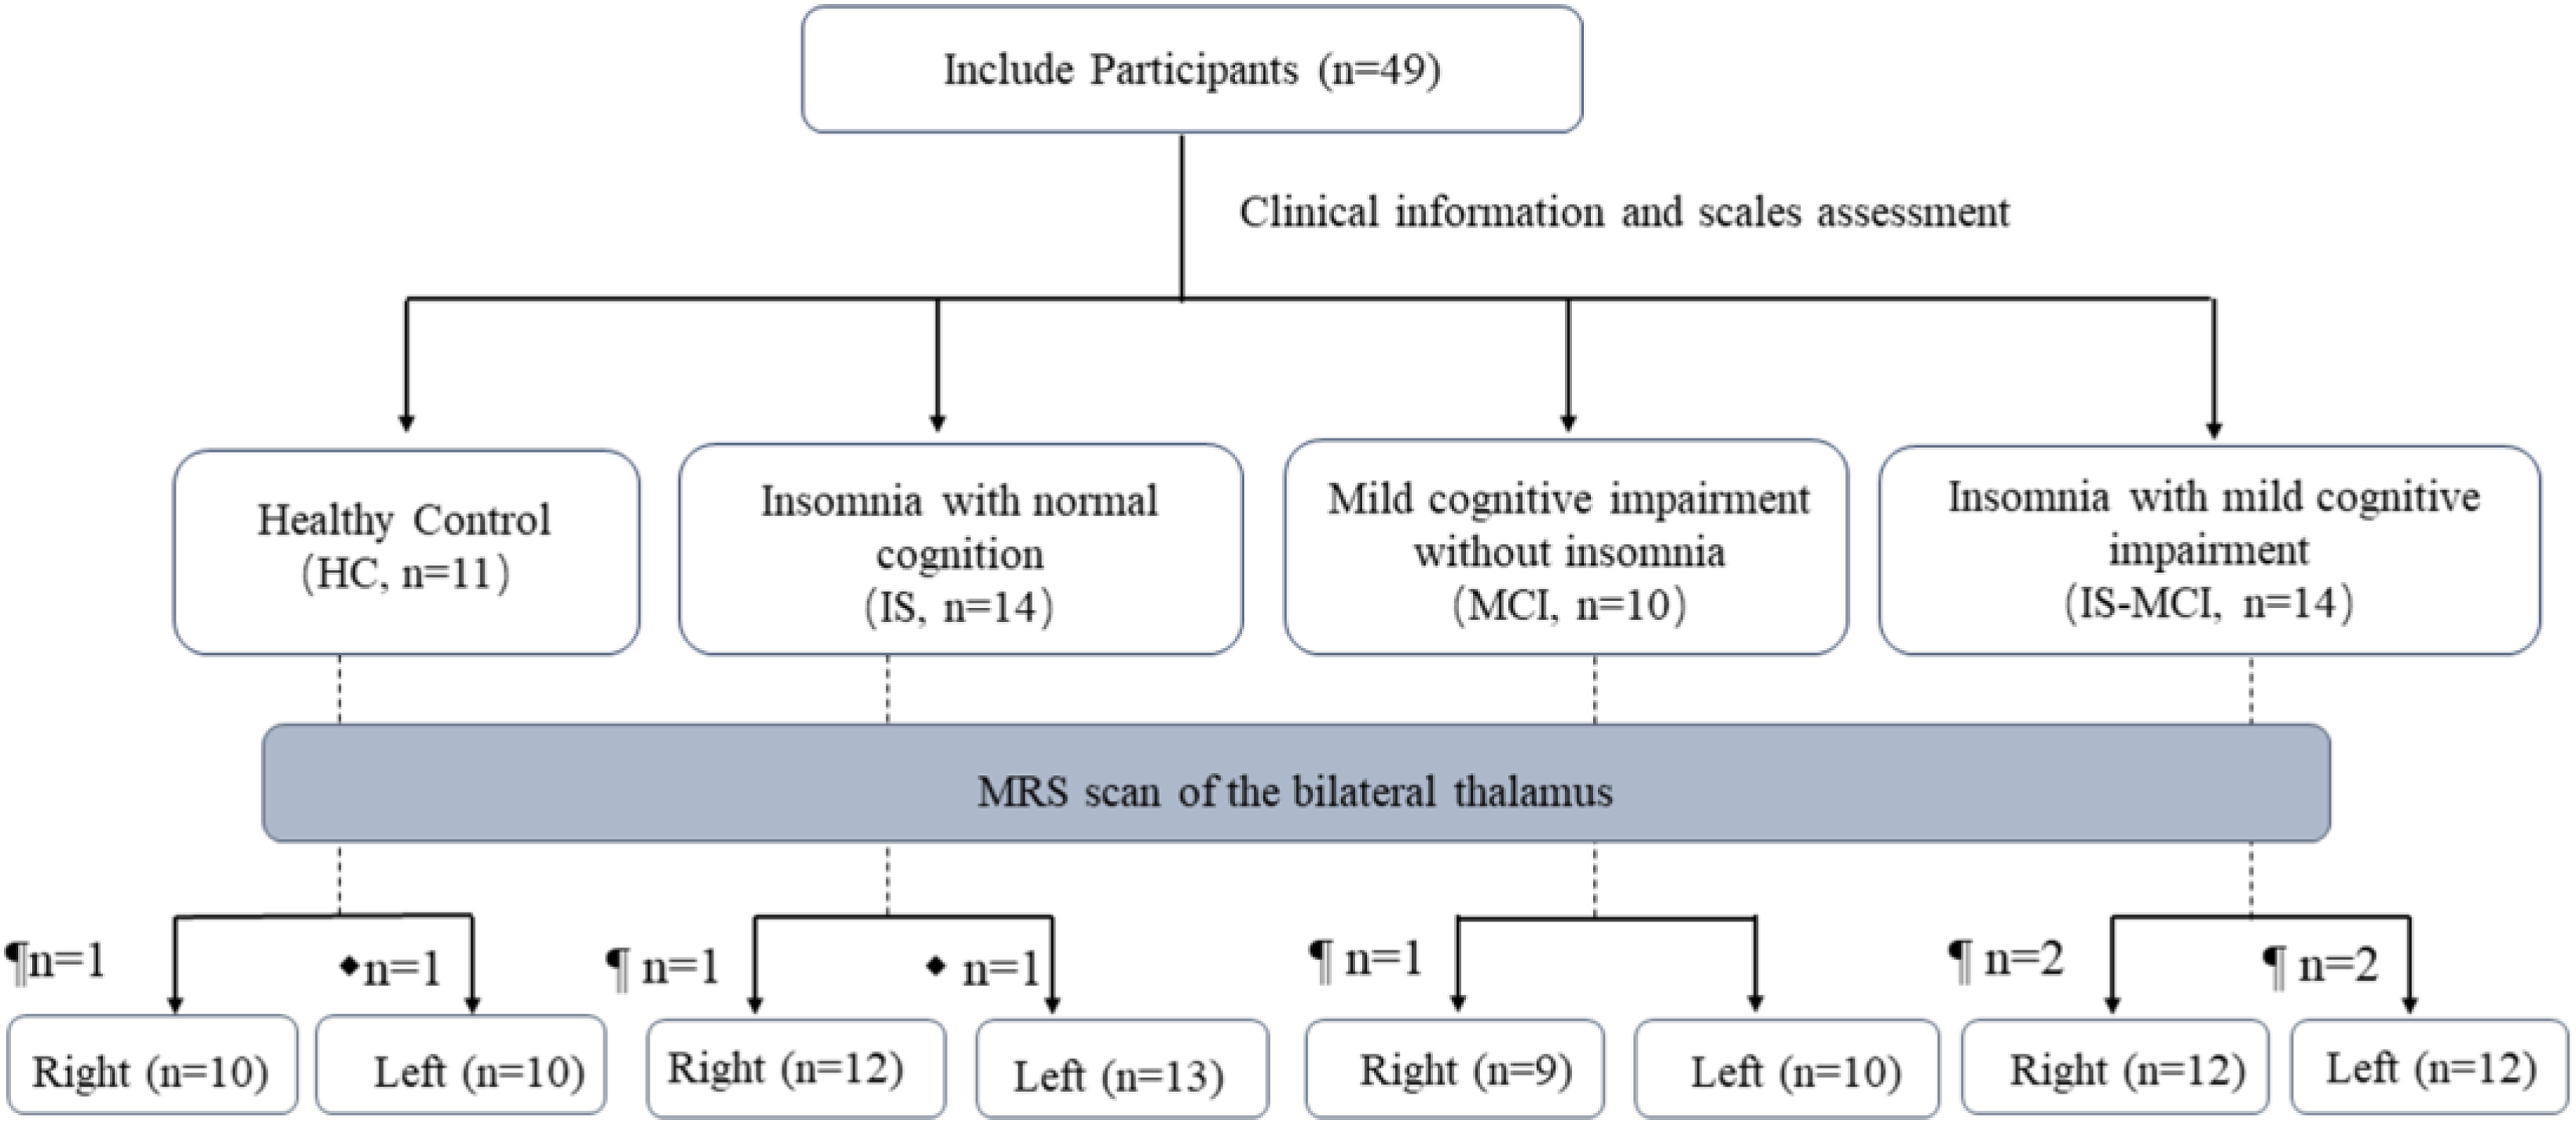
Flow of the participants during the study. ¶ indicates physical discomfort during the scan. ⧫ indicates poor data quality.
The analysis included 49 participants, with an average age of 62.08 ± 6.18 years. Among them, 25 participants (51.00%) were female, an average education of 12.55 ± 3.13 years. There were 11 participants in the HC group, 14 participants in the IS group, 10 participants in the MCI group, and 14 participants in the IS-MCI group. There were no significant differences in clinical characteristics among the four groups (Table 1).
Baseline characteristics.
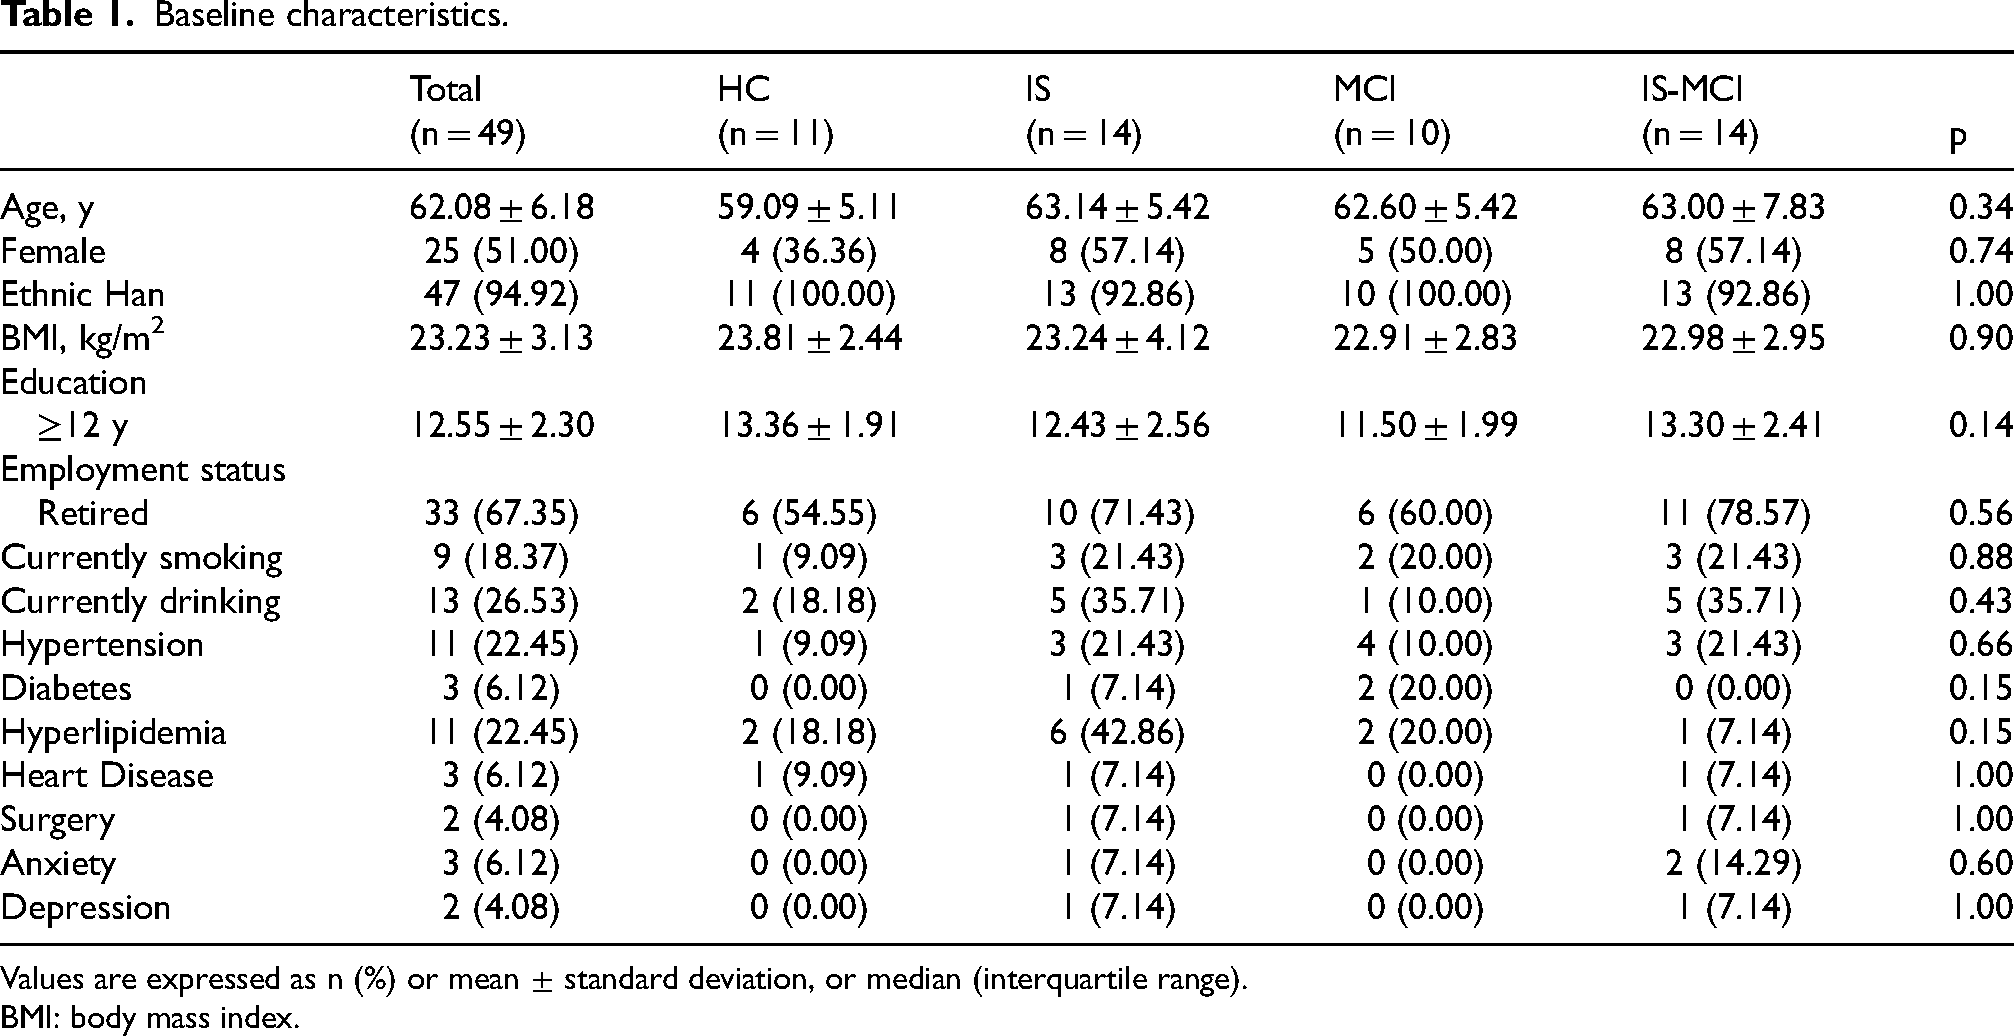
Values are expressed as n (%) or mean ± standard deviation, or median (interquartile range).
BMI: body mass index.
Clinical scale scores were compared among the four groups
The median MoCA score was 28 in HC, 26 in IS, 23.5 in MCI and 23.5 in IS-MCI. There were significant differences in the ADAS-cog (p < 0.001), DST-F (p < 0.001), DST-B (p = 0.001), DSST (p = 0.001), immediate recall scores of CFT (p = 0.004), and Stroop scores (Stroop A/time, p = 0.002, Stroop B/time, p = 0.003, Stroop C1/time, p = 0.015, Stroop C2/time, p = 0.016) among the four groups (Table 2).The results of the sleep-related scales showed that both the IS-MCI group and the IS group scored higher on the PSQI and ISI scales compared to the MCI and HC group (p < 0.001, Table 2). There were no statistically significant differences in the total scores of PHQ-9 and GAD-7 among the four groups (Table 2).
Questionnaire and scale scores in different groups.
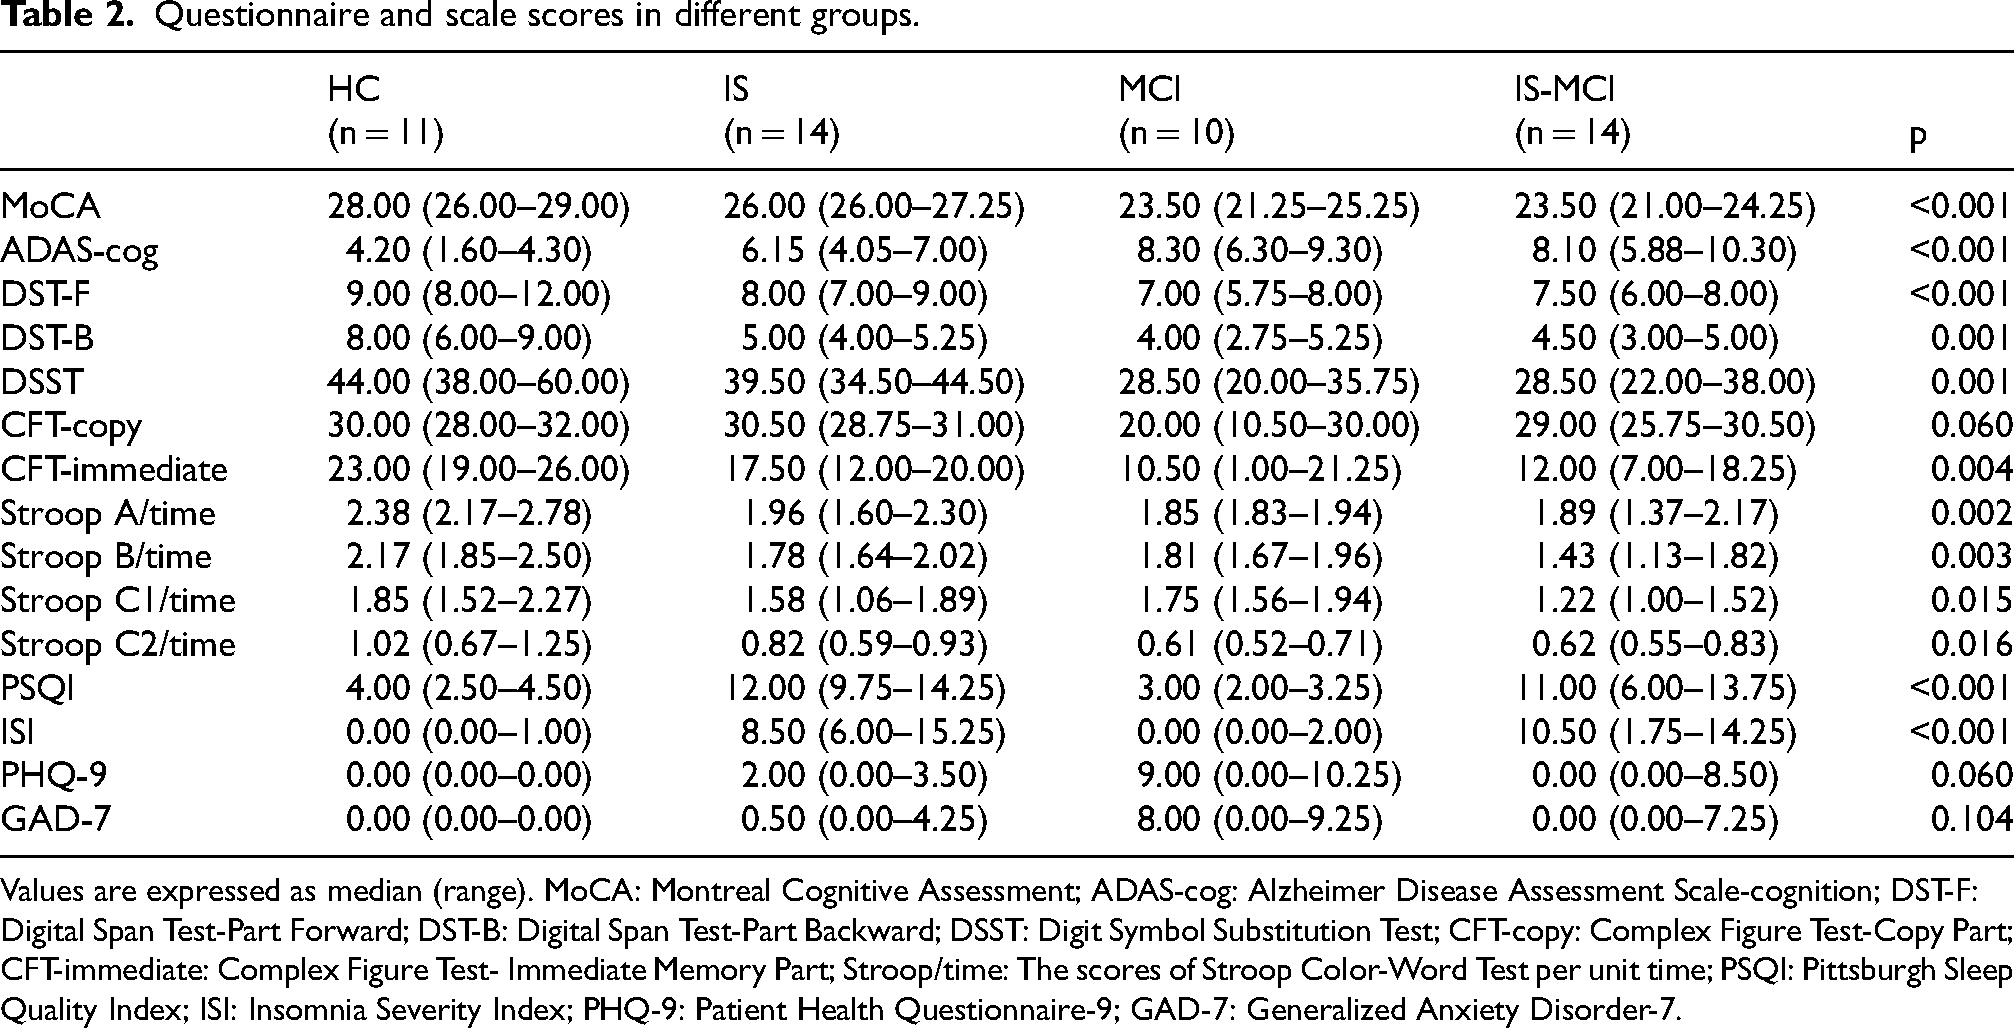
Values are expressed as median (range). MoCA: Montreal Cognitive Assessment; ADAS-cog: Alzheimer Disease Assessment Scale-cognition; DST-F: Digital Span Test-Part Forward; DST-B: Digital Span Test-Part Backward; DSST: Digit Symbol Substitution Test; CFT-copy: Complex Figure Test-Copy Part; CFT-immediate: Complex Figure Test- Immediate Memory Part; Stroop/time: The scores of Stroop Color-Word Test per unit time; PSQI: Pittsburgh Sleep Quality Index; ISI: Insomnia Severity Index; PHQ-9: Patient Health Questionnaire-9; GAD-7: Generalized Anxiety Disorder-7.
The GABA level of the right thalamus was significantly reduced in the IS-MCI patients
The positions of the bilateral thalamus voxel during 1H-MRS acquisition had been shown in Figure 2A and B. One-way analysis of variance revealed significant differences in GABA/water (p = 0.026) and GABA/Cr ratios (p = 0.046) among the four groups in the right thalamus. Further multiple comparisons analysis of least significant difference showed that the IS-MCI group had significantly lower GABA/water ratio (p = 0.009 versus HC, p = 0.019 versus IS, p = 0.017 versus MCI, Figure 2C) and GABA/Cr ratio (p = 0.015 versus HC, p = 0.027 versus IS, p = 0.033 versus MCI, Figure 2D). There were no significant differences in Glx level in the bilateral thalamus among the overall population and the different groups (Figure 2E, F). Neither GABA nor Glx levels were significantly different between the bilateral thalamus within each group.
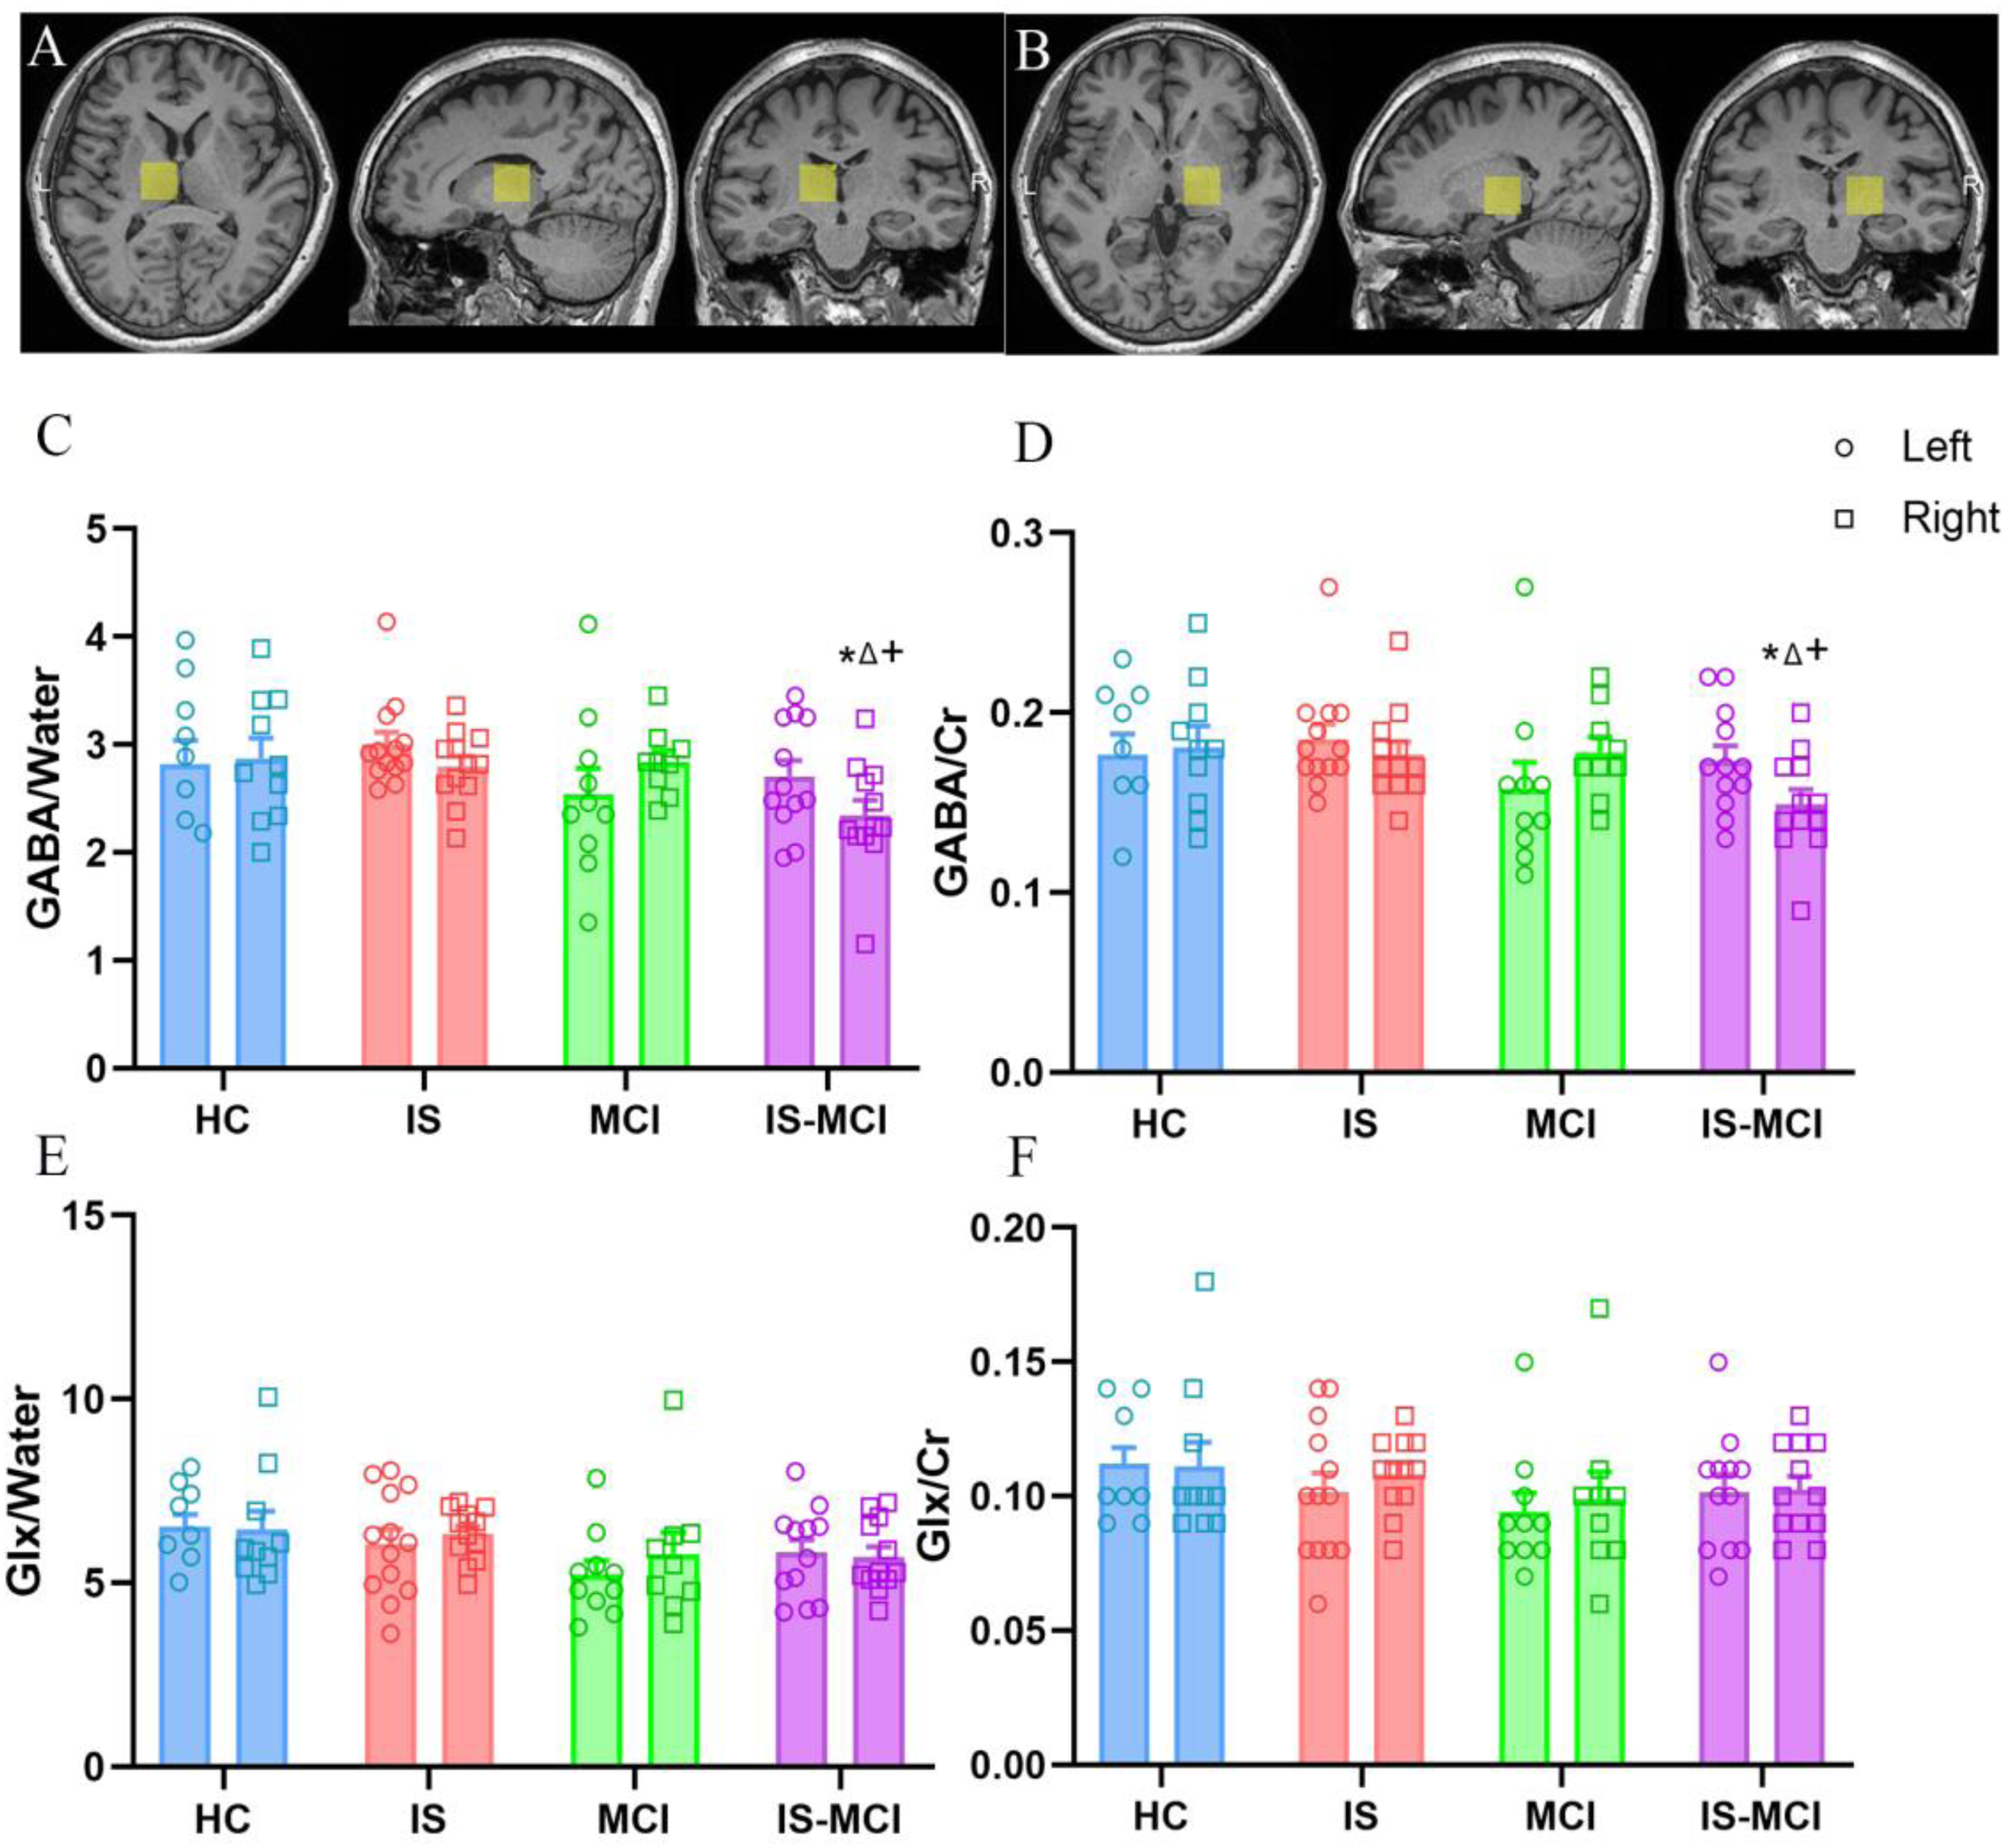
The GABA level of the right thalamus exhibited a significant decrease in the is-MCI patients. (A) and (B) demonstrates the voxel placement in the left and right thalamus. (C) Multiple comparisons analysis of least significant difference showed that GABA/water ratio in IS-MCI group was lower than that in HC, IS and MCI groups (* show p < 0.05, versus HC; △show p < 0.05, versus IS; + show p < 0.05, versus MCI). (D) Post hoc analysis showed that GABA/Cr ratio in IS-MCI group was lower than that in HC, IS and MCI groups (* show p < 0.05, versus HC; △show p < 0.05, versus IS-NC; + show p < 0.05, versus MCI). (E, F) Glx/water and Glx/Cr ratios were not significantly different among groups.
During this study, we compared the correlation between scores of scales and neurochemical levels of bilateral thalamus among all participants. After adjusting for confounding factors such as age, gender, education, sleep quality (PSQI), depression (PHQ-9), and anxiety (GAD-7), we found lower Glx/water and Glx/Cr ratios in the right thalamus were associated with lower score of the MoCA scale (r2 = 0.095, p = 0.043 for Glx/water, Figure 3A; r2 = 0.101, p = 0.038 for Glx/Cr, Figure 3B), while these associations were not signification. Working memory (DST-F) was weak associated with Glx/water (r2 = 0.202, p = 0.002, Figure 3C) and no correlation was found with Glx/Cr (r2 = 0.146, p = 0.011, Figure 3D) in the right thalamus after adjusting for above confounding factors. Similarly, the associations between information processing speed (DSST) and Glx levels in the right thalamus were no significant difference (r2 = 0.129, p = 0.017 for Glx/water, Figure 3E; r2 = 0.096, p = 0.042 for Glx/Cr, Figure 3F).
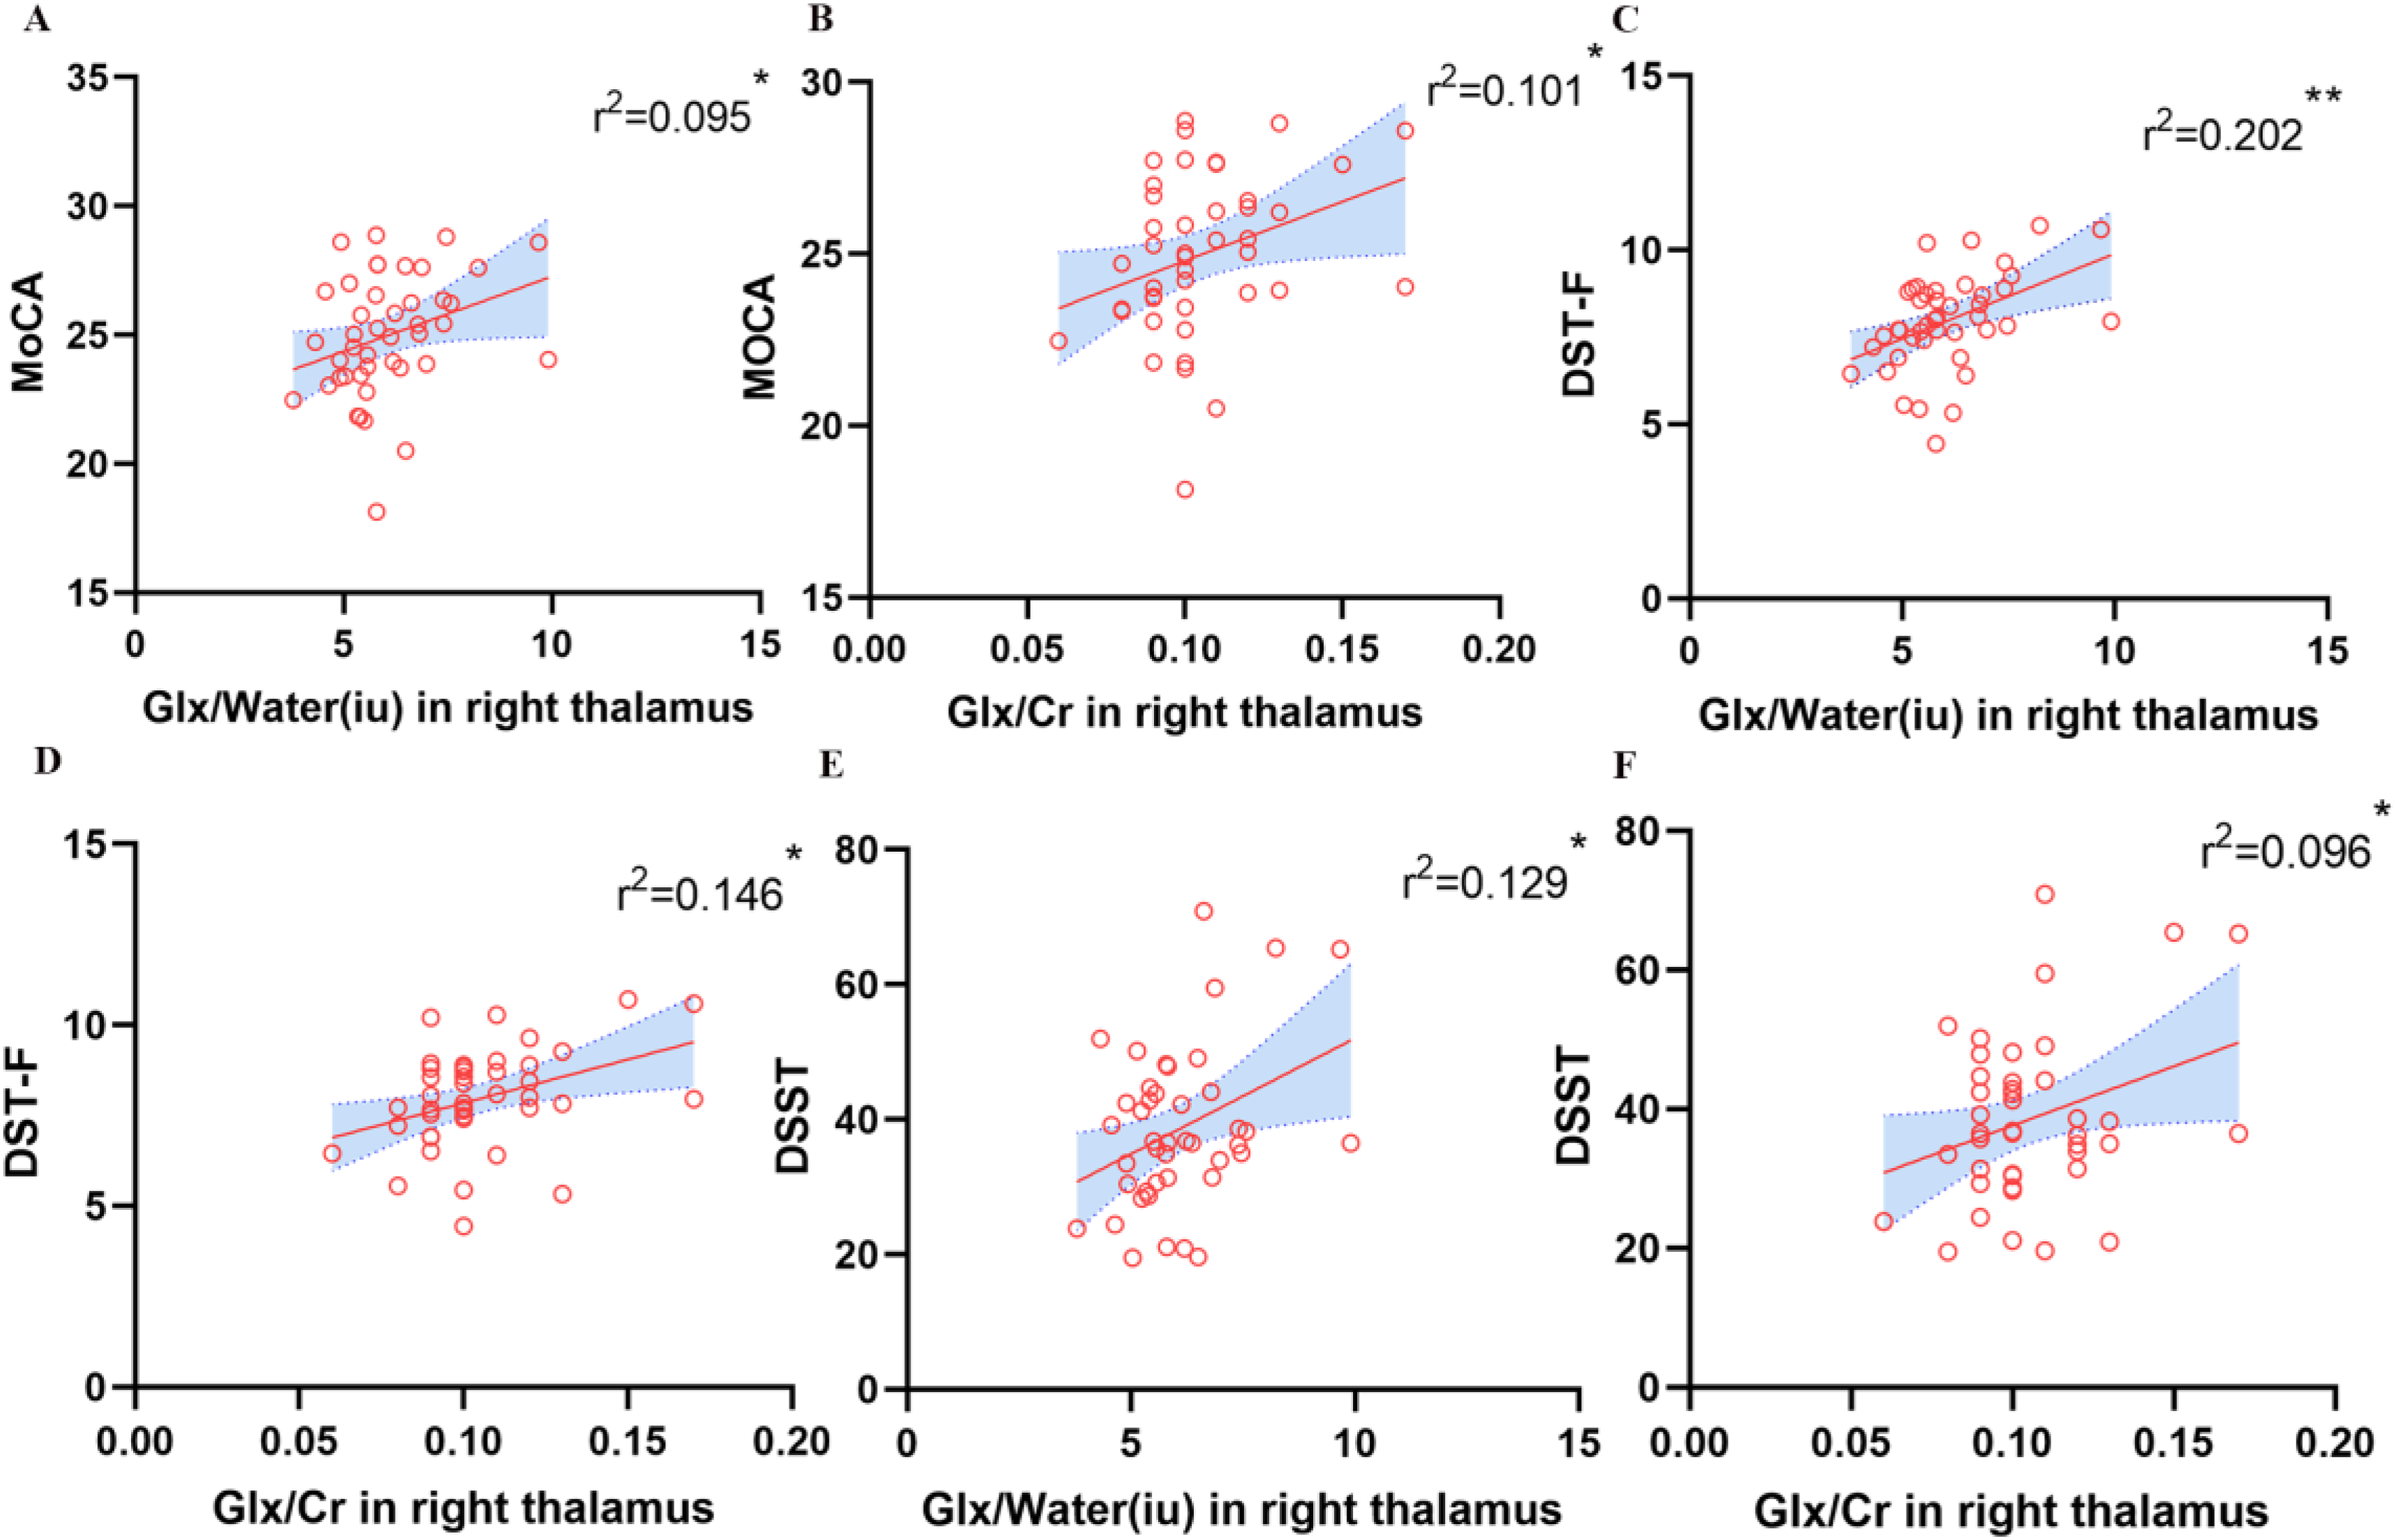
Correlation analysis revealed glx levels of the right thalamus were linked with cognition. (A, B) Lower Glx/water and Glx/Cr ratios in the right thalamus were associated with lower score of the MoCA scale after adjusting for confounding factors such as age, gender, education, sleep quality (PSQI), depression (PHQ-9) and anxiety (GAD-7), but these associations were not signification. (C, D) Working memory (DST-F) was weak associated with Glx levels in the right thalamus after adjusting for above confounding factors. (E, F) There is no significant association between information processing speed (DSST) and Glx levels in the right thalamus after adjusting for above confounding factors.
There is no significant correlation was found between the total score of the PSQI and the levels of GABA and Glx in the bilateral thalamus after adjusting for confounding factors such as age, gender, education, cognitive function (MoCA), depression (PHQ-9), anxiety (GAD-7).
These findings indicate that the Glx level in the right thalamus is associated with cognitive impairment, particularly in working memory. In IS-MCI patients, there may be potential lateralization changes in the metabolism of neurotransmitters in the thalamus.
Sleep deprivation exacerbates asymmetric alterations of Aβ-induced bilateral hippocampal metabolite abnormalities
In clinical patients with AD, there are observed alterations in NAA/Cr ratios, Cho/Cr ratios in hippocampus, but in preclinical AD with sleep disorders, the changes of metabolites are indistinct. 44 Hence, we aimed to elucidate the impact of sleep deprivation on the metabolic characteristics of an early AD rat model. Representative pictures of 1H-MRS in the hippocampus and the position of the CSI grid covering bilateral hippocampus were illustrated (Figure 4A, B). Via MRS-spectra of the selected voxel in the hippocampus from four groups (Figure 4C), the NAA mapping, a hallmark of neuronal integrity, was illustrated in Figure 4D. NAA decreased significantly in right hippocampus in Aβ group and more severely in SA group (p = 0.044 and p<0.001 for SA, versus Con; Figure 4G) and revealed a bilateral difference in SD and SA group (p = 0.050 for SD and p = 0.022 for SA, paired t-test; Figure 4G), indicating an asymmetry reduction. For Cho, as distribution mapping shown in Figure 4E, the decrease in Cho/Cr only witnessed in the right hippocampus of the SD group (p = 0.049 for right, versus Con, Figure 4H). Similarly, SA group exhibited a more pronounced reduction of Cho/Cr in bilateral hippocampi (p < 0.001 for both side of hippocampus, versus Con and versus Aβ; Figure 4H), with a further decrease in the left hippocampus (p = 0.013, versus SD; p = 0.001, paired t-test, Figure 5H). Like NAA and Cho, hippocampal Glx, revealed asymmetric distribution as well (Figure 4F). In the SA group, a significant drop seen in right hippocampus (p = 0.015 versus Con, p = 0.002 versus SD, Figure 4I) and a gap demonstrated between bilateral hippocampus (p < 0.0001, paired t-test), indicating an asymmetrical change and a lateralization effect under the conditions of sleep deprivation and Aβ (p = 0.003, Two-way ANOVA with Bonferroni's post hoc). What is more, via regression analysis, a weak positive correlation was demonstrated between NAA/Cr and Cho/Cr and the recognitive ability in NOR test for left hippocampus (r2 = 0.229, p = 0.018 for NAA; r2 = 0.344, p = 0.001 for Cho, Figure 4J); intriguingly, apart from NAA/Cr, Glx/Cr also showed a correlation in right hippocampus instead of Cho/Cr (r2 = 0.369, p = 0.003 for NAA/Cr, r2 = 0.169, p = 0.033 for Glx/Cr, Figure 4K). These findings suggest that sleep deprivation causes asymmetric change patterns of neuro-metabolite in the hippocampus, indicating different neurotransmitter disruption patterns and mechanisms affecting cognitive function.
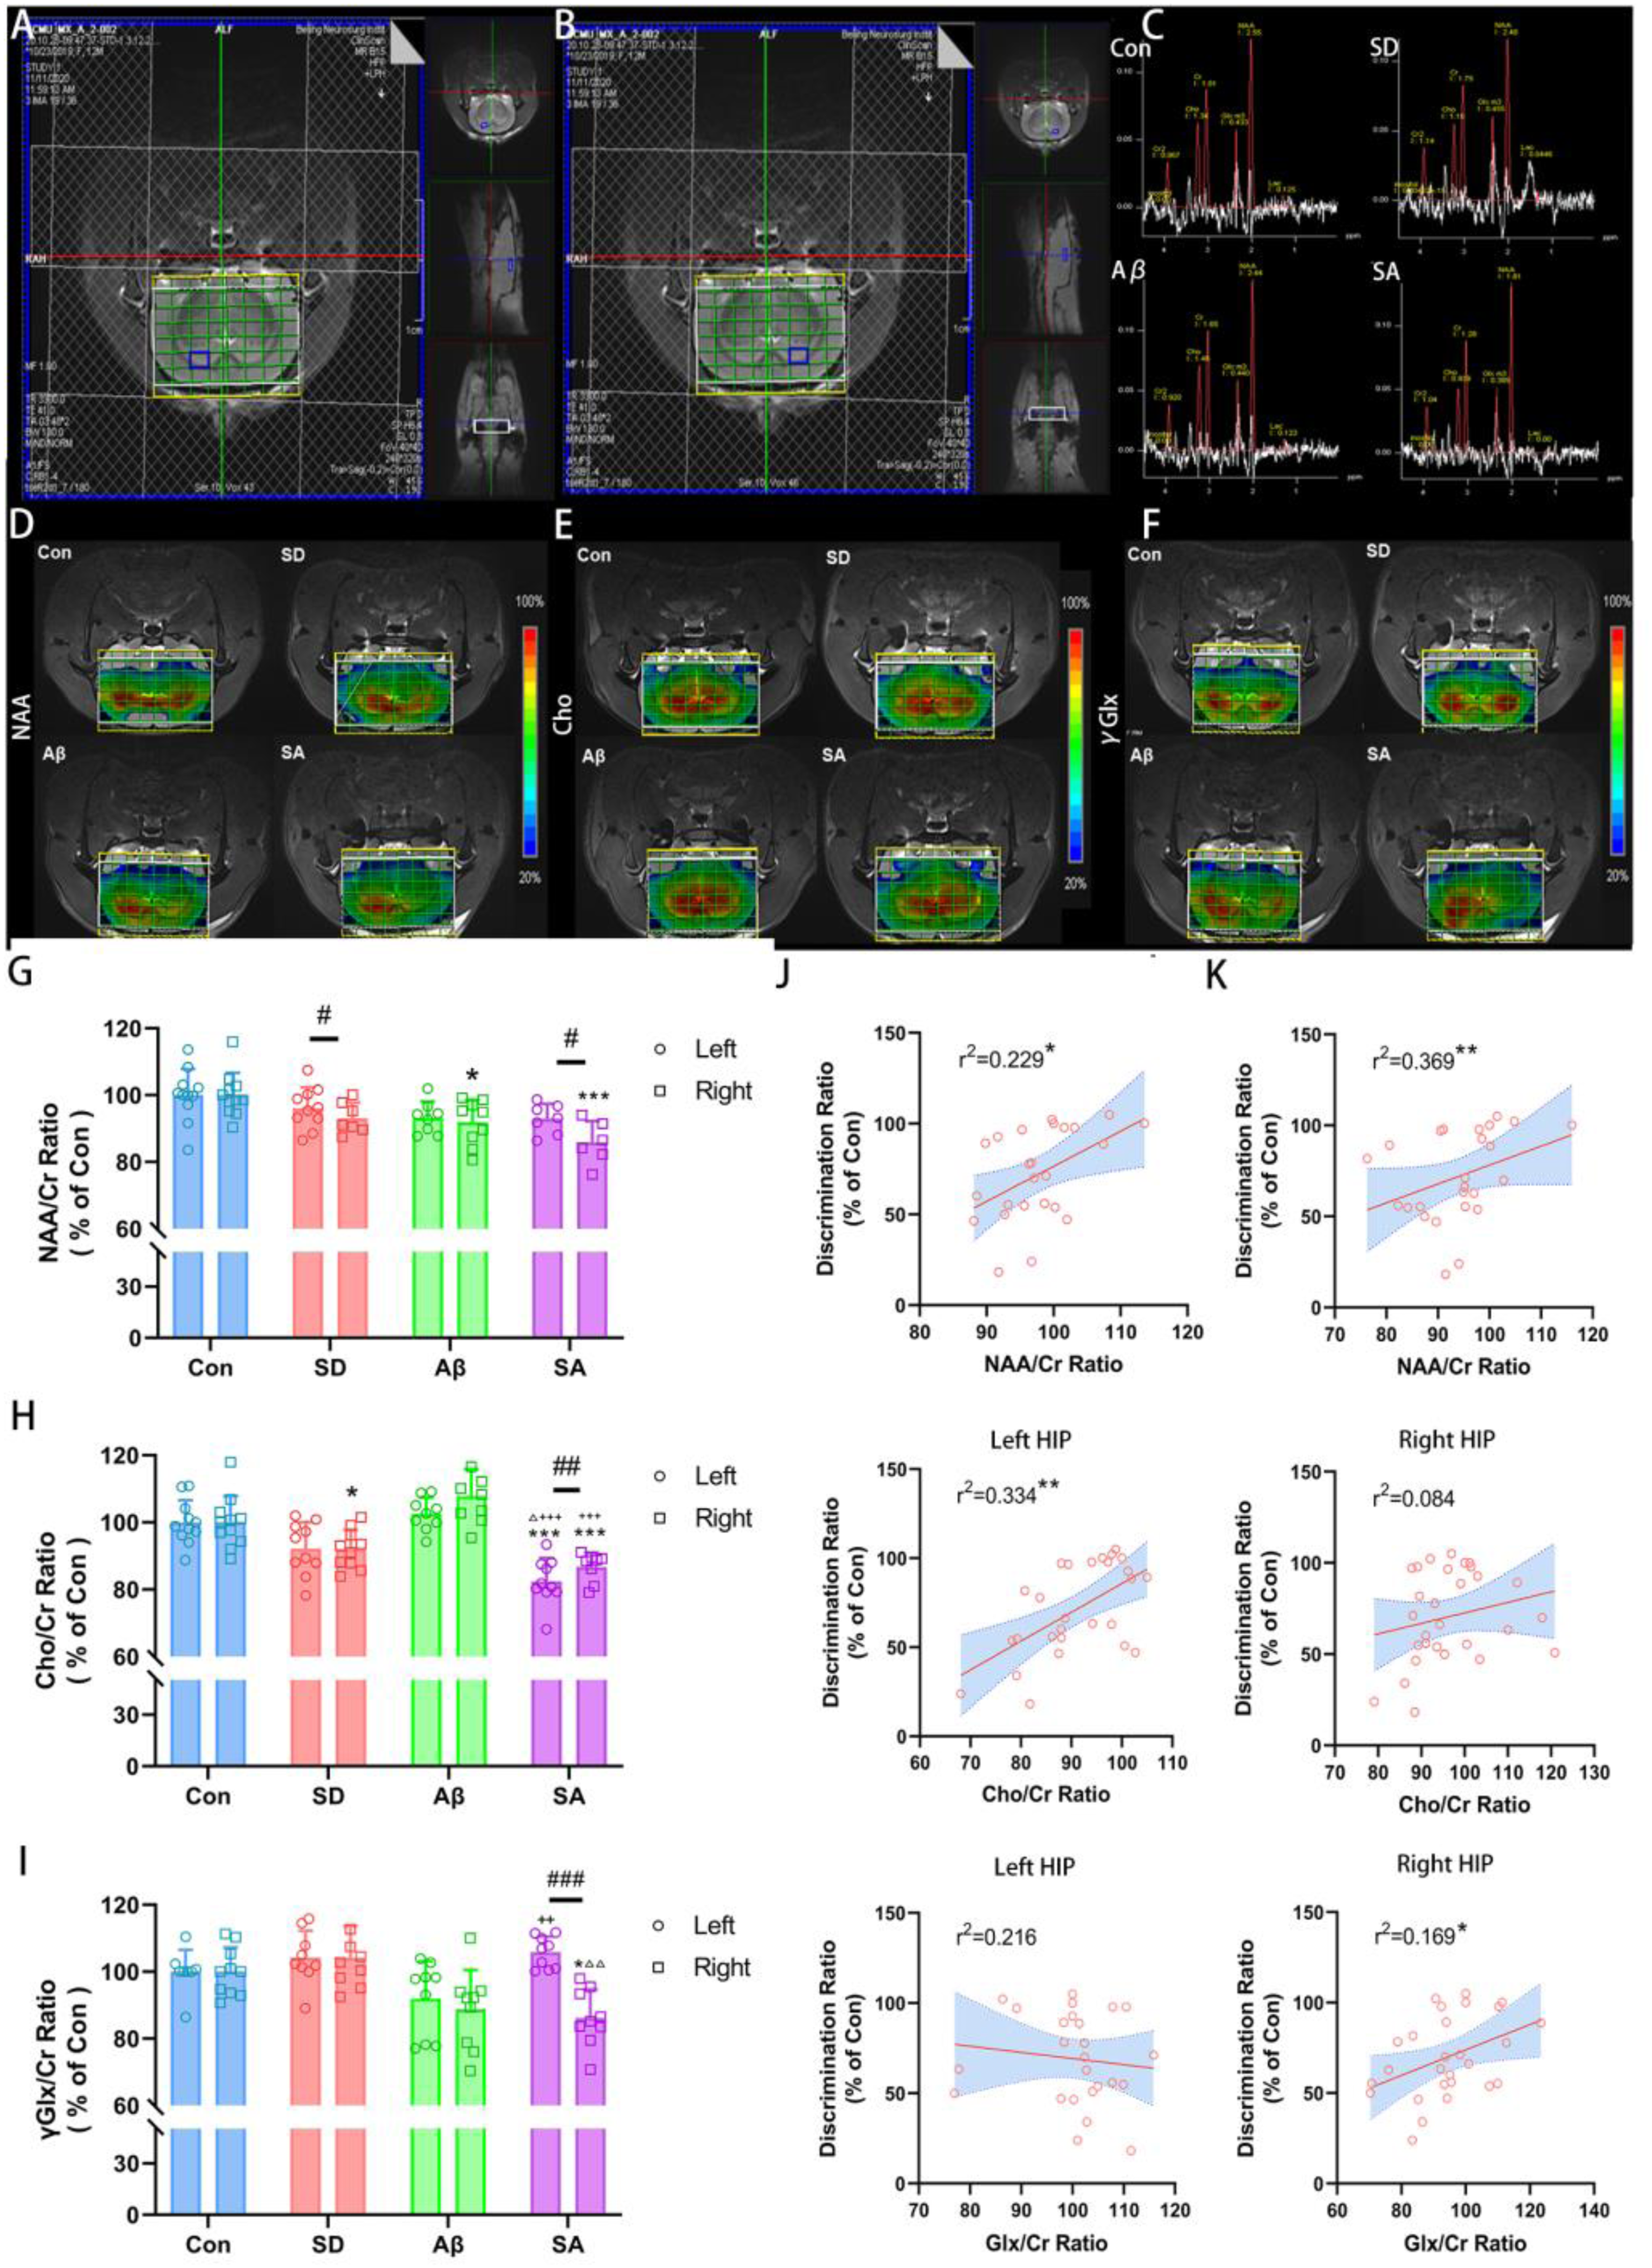
Proton magnetic resonance spectroscopy in hippocampi of rats revealed a change in relative metabolite ratios. (A, B) Representative pictures of 1H-MRS in the left and right hippocampus. The morphological T2-weight MR images illustrated the position of the CSI grid covering both lateral hippocampus (green grid and blue boxes on MRI). (C) There are displayed representative MRS-spectra of the selected voxel in hippocampus. (D-F) Concentration maps of NAA, Cho and Glx from a representative rat in Con, SD, Aβ and SA groups respectively. (G) The graph of NAA/Cr ratio (% of con) demonstrated a severe reduction in right side of hippocampus in SA group, whereas, there was no statistically difference in the left side. (H) The Cho/Cr ratio (% of Con) decreased in bilateral hippocampus of SA group. (I) The Glx/Cr ratio (% of Con) showed an opposite change tendency in SD group; revealed a difference between bilateral hippocampus in SA group. (J, K) The correlation analysis between metabolite concentration in left and right hippocampus and discrimination ratio (DI) of NOR. * versus Con, **p < 0.01, ***p < 0.001; △ versus SD, △△p < 0.01, △△△p < 0.001; + versus Aβ, +++p < 0.001; Paired samples t test between bilateral hippocampal betweenness centrality in four groups. ##p < 0.01.
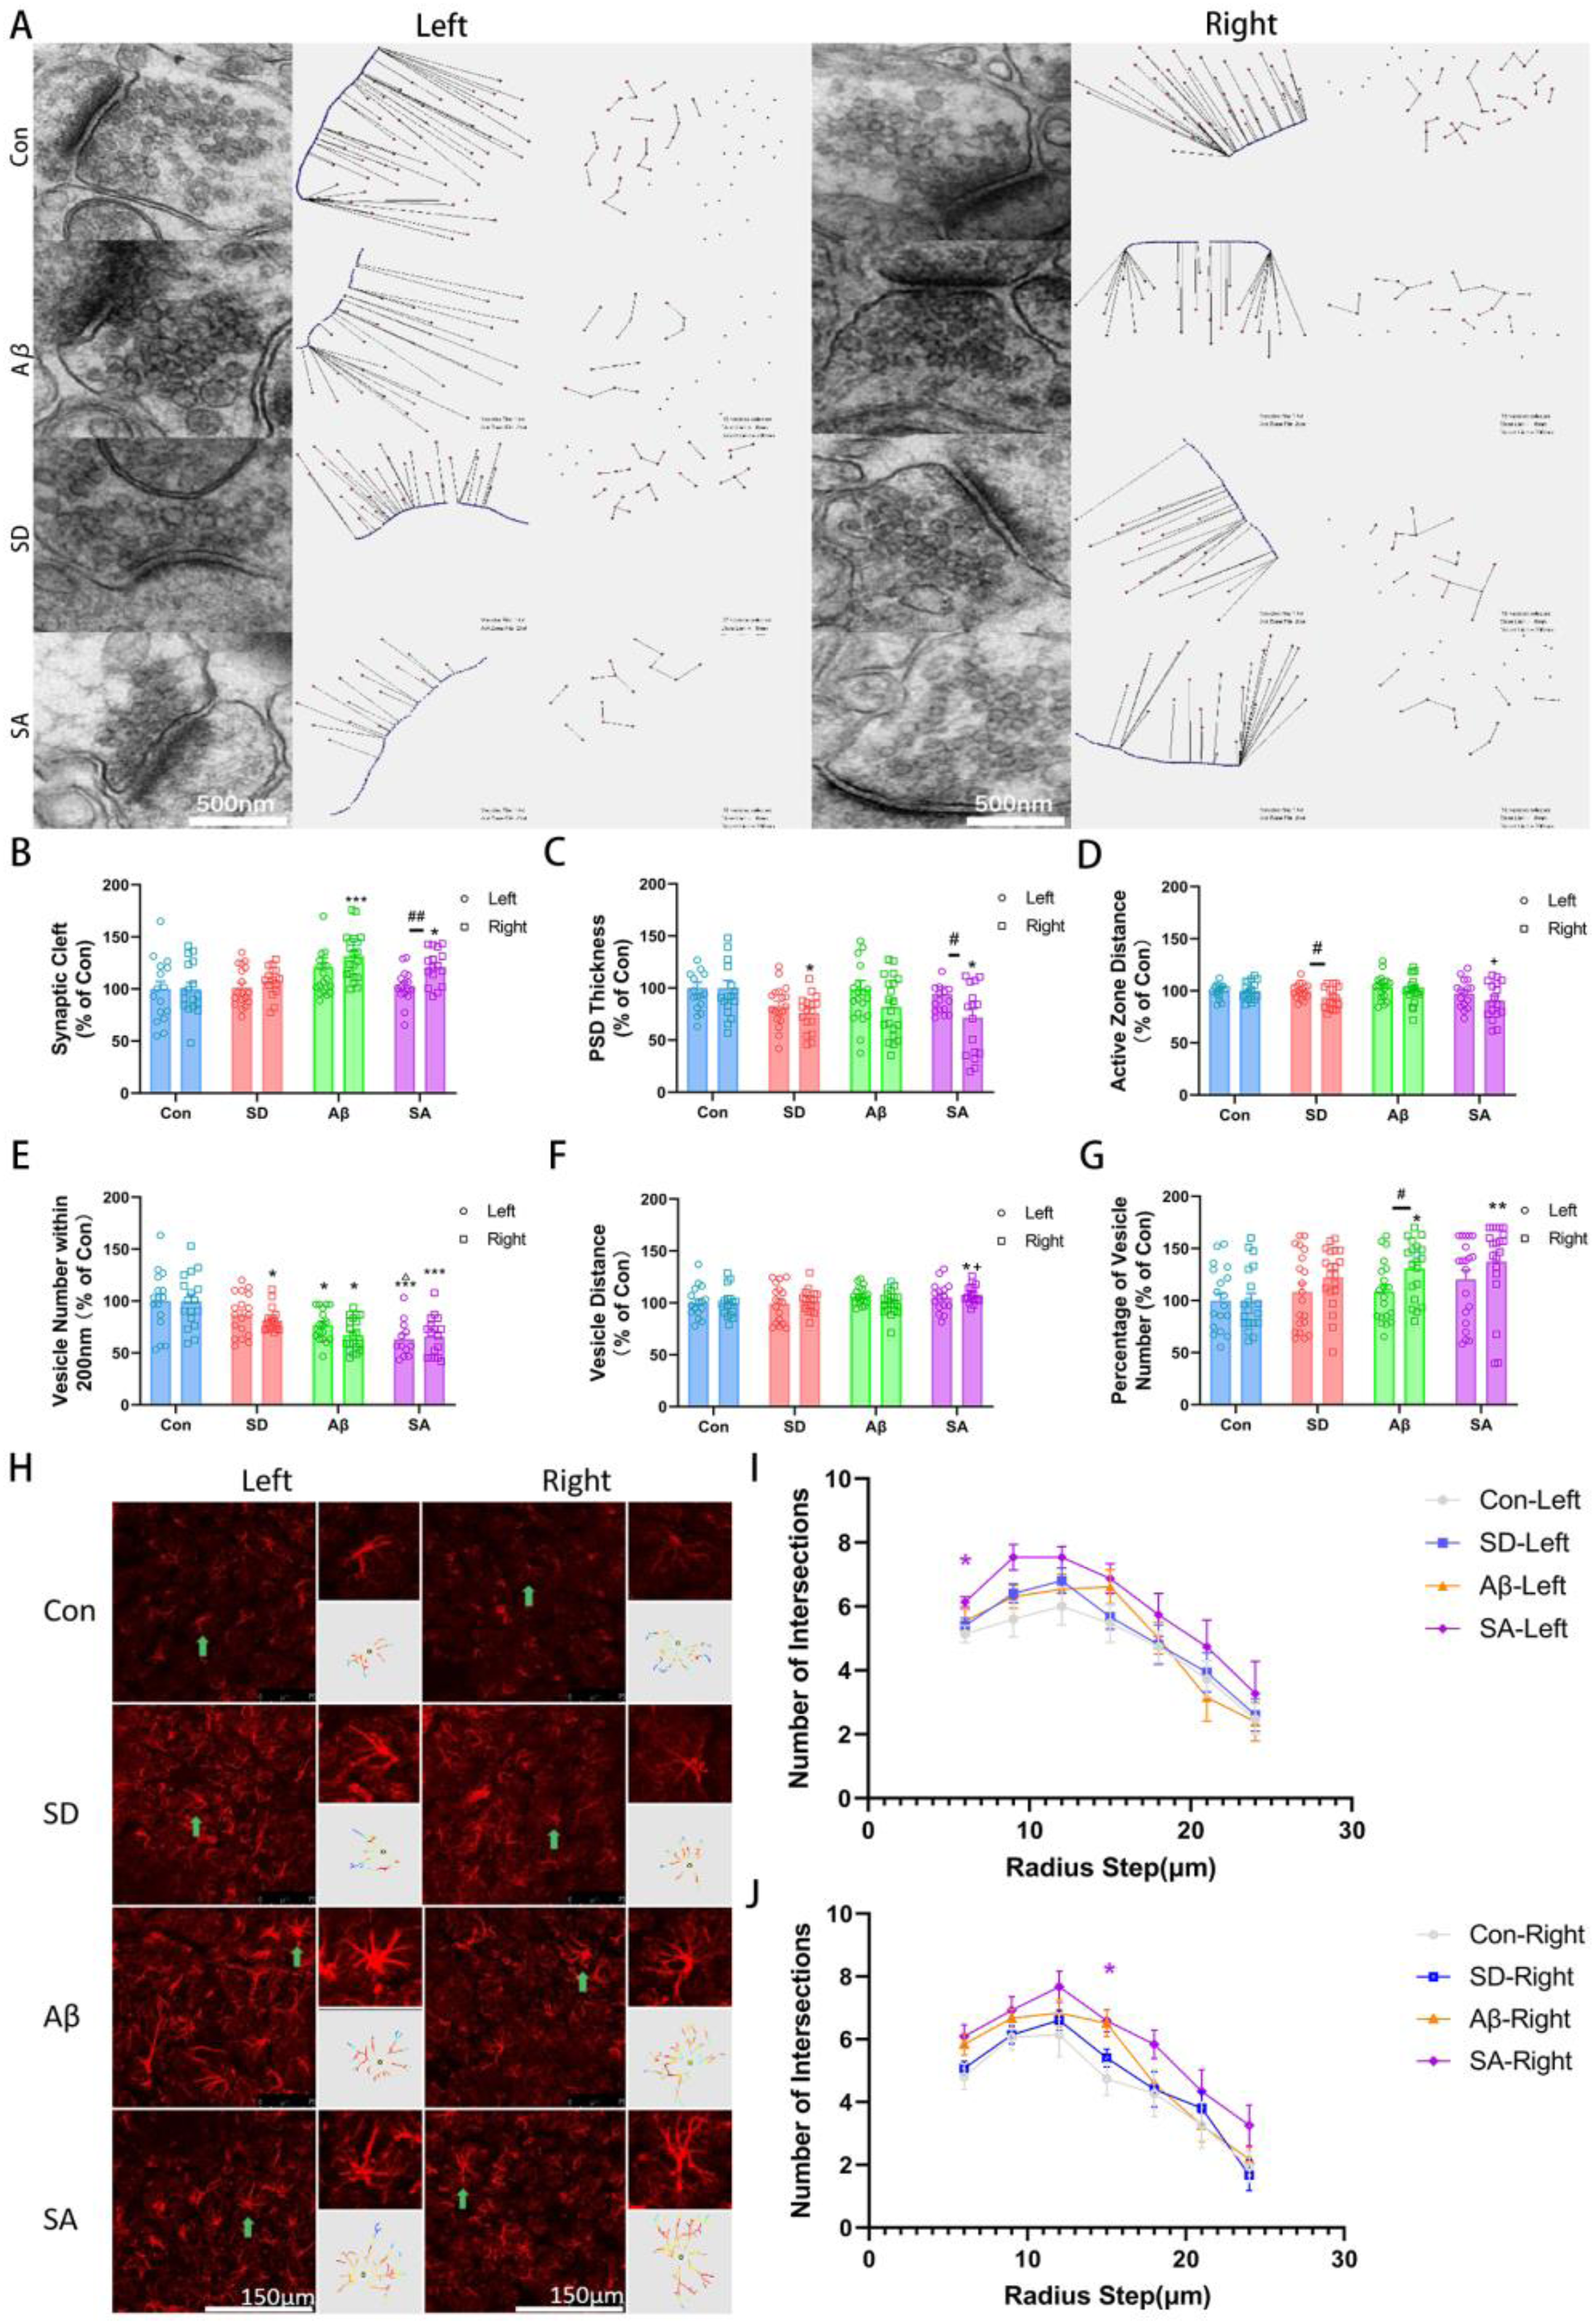
Sleep deprivation aggravates aβ-induced synaptic impairment and activation of astrocyte. (A) The representative electron microscopy images of bilateral hippocampus synapses in four groups; Scale bar = 500 nm. (B) Quantitative analysis of synaptic gap width (% of Con) showed that Aβ induced the increase of synaptic gap, especially on the right side. (C) Quantitative analysis of PSD thickness (% of Con) showed that sleep deprivation could induce a decrease in PSD thickness, which was more significant on the right side of SA group than on the left. (D) Quantitative analysis of vesicle spacing (% of Con) in the active region showed a significant decrease in the right side of SD group. (E) Quantitative analysis of the number of vesicles in the active zone (% of Con) showed that sleep deprivation and Aβ induced a decrease in the number of vesicles in the active zone. (F) Minimum vesicle adjacent distance (% of Con) quantitative analysis showed that sleep deprivation could induce the increase of minimum adjacent distance under the condition of Aβ. (G) Quantitative analysis of vesicle proportion of active region (% of Con) showed that Aβ could induce an increase in the proportion, especially in the right side. (H) Immunofluorescence staining of GFAP suggested that sleep deprivation aggravated astrocytic reactivation induced by Aβ; Scale bar = 150 μm. (I, J) Sholl analysis revealed an increased number of intersections of bilateral hippocampus astrocytes. * versus Con, **p < 0.01, ***p < 0.001; △ versus SD, △△p < 0.01, △△△p < 0.001; + versus Aβ, +++p < 0.001; Independent sample t test between bilateral hippocampal betweenness centrality in four groups. ##p < 0.01.
Sleep deprivation aggravates Aβ-induced synaptic impairment and activation of astrocytes
Although both Aβ-induced neurotoxicity and sleep deprivation could lead to the loss of synaptic proteins, the extent of synaptic dysfunction under the combined factors and contribution of synaptic vesicle transport to neuro-metabolite change is not clear yet. 45 To further verify the synaptic damage, we evaluated the ultrastructure of the hippocampus using TEM. Our results showed that, in SA group, an increasing synaptic cleft distance and reduced postsynaptic density (PSD) thickness were observed only in right hippocampus (p = 0.019 and p = 0.007, versus Con, Figure 5A-C), suggesting an impeding for vesicle docking and synaptic transmission. Plus, there are bilateral difference in SA group (p = 0.003 for synaptic cleft and p = 0.020 for PSD thickness). Besides, active zone distance showed a further decrease in right hippocampus of SA (p = 0.035, versus Aβ, Figure 5D) and the number of vesicles within the 200 nm active area significantly decreased in bilateral hippocampus of Aβ and SA group (p = 0.028 and p < 0.001 for left and right hippocampus of Aβ, p = 0.001 and p < 0.001 for left and right hippocampus of SA, versus Con, Figure 5E). On top of that, in SD group, there was a bilateral difference of active zone distance (p = 0.049, independent t test, Figure 5D) and a significant reduction of vesicle number within active zone (p = 0.016, versus Con, Figure 5E), indicating an asymmetrical impairment of presynaptic vesicle transport. Similarly, a lateralized change of vesicle spacing (p = 0.042, versus Con, p = 0.050, versus Aβ, Figure 5F) and unilateral increase of percentage of vesicles number in active zone (p = 0.004, versus Con, Figure 5G) were seen in the right hippocampus of SA group. This ultrastructural evidence indicated that sleep deprivation may lead to more severe synaptic impairment in the right hippocampus and impact neurotransmitter release, ultimately disturbing homeostasis of neuro-metabolite.
It is well-known that astrocytes cover approximately 50–60% of synapses in the central nervous system and play a vital regulatory role in synaptic vesicle transmission and recycle of neurotransmitter. In order to investigate the changes of astrocytes, using immunofluorescent staining of GFAP, confocal imaging and Sholl analysis, we found a noticeable increase in GFAP fluorescence expression and hypertrophy of astrocyte processes, indicating reactivation of astrocytes (Figure 5H). Plus, the quantitative analysis revealed an increased number of branches in SA group, especially in astrocytes of left hippocampus (p = 0.028 for left; p = 0.048 for right, versus Con, Figure 5I, J). These results suggest that both synaptic dysfunction of vesicle transport and reactive astrocytes maybe involve in lateralized change of neuro-metabolite under conditions of sleep deprivation and Aβ-induced neurotoxicity.
Discussion
To the best of our knowledge, our study represents the initial exploration of neural metabolic mechanisms in the context of comorbid sleep disorders and MCI. This investigation is underpinned by theoretical foundations drawn from animal models to clinical participants, revealing a lateralized reduction in the concentrations of GABA within the thalamus, alongside an asymmetrical alteration in the levels of Cho and Glx within the hippocampus. These disturbances are implicated in a subsequent cognitive decline. Moreover, the extent of the reduction in GABA within the right thalamus, the decrease in Cho within the left hippocampus, and the diminished levels of Glx within the right hippocampus exhibit strong correlations with cognitive function. These outcomes suggest that disruptions in neurotransmitter profiles following this specific pattern may promote the development of AD in elderly individuals who suffer from concurrent sleep disorders.
Sleep disorders have been associated with cognitive impairments and an elevated risk of developing AD, although the precise underlying mechanism remains unclear. 46 A multicenter cohort study reported that 60% of 431 consecutive patients diagnosed with MCI or dementia also met the criteria for a sleep disorder. 47 Given the critical role of sleep-dependent memory consolidation in cognition, it is conceivable that the failure of memory consolidation in individuals with sleep disorders may trigger cognitive impairment during the early stages of AD. 48 Furthermore, sleep disruption has been evidenced to induce an increased Aβ burden and reduced Aβ clearance. 49 But considering the importance of mesoscopic interactions in the memory consolidation process, as well as the connectome across multiple brain regions facilitated by neurotransmitters, it is reasonable that these factors collectively contribute to the early development of cognitive dysfunction in patients with both sleep disorders and cognitive impairments. 50
The thalamus, recognized for its pivotal role in memory consolidation, featured prominently in our study. We observed a significant reduction in GABA levels in the right thalamus among patients with comorbid sleep disorders and MCI. Notably, the Glx levels in the thalamus did not exhibit significant group differences, which may be ascribed to the intricate interplay of co-neurotransmitters involved in the regulation of sleep. 12 This outcome aligns with previous MRS studies in insomnia patients, reporting a reduced GABA levels in multiple brain regions. 14 , 51 Remarkably, our findings revealed a positive correlation between GABA levels in the right thalamus and cognitive outcomes, rather than sleep quality.52,53 Although Glx is deemed as a biomarker in predication of MCI to AD, the disrupted pattern of GABA neurotransmitters may serve as a shared pathophysiological basis for cognitive decline in individuals with comorbid insomnia.54,55 Provided the extensive connections of GABAergic interneurons from the thalamus to the medial prefrontal cortex and the anatomical underpinnings of memory consolidation, the lateralized disruption pattern of GABA in the thalamus may be attributed to disturbances in the memory consolidation process, potentially fostering the progression to dementia in comorbid individuals.56,57 Previous research has suggested that the infusion of a GABAAR agonist in the thalamus impairs fear extinction learning, indirectly supporting the notion that disrupted GABA in the thalamus could regulate cognitive functions through memory consolidation.58,59 Therefore, the disruption of neuro-metabolites in the thalamus underscores the urgency of directing heightened attention and instituting early interventions for individuals of middle age and the elderly afflicted by such comorbidities.
In addition to the thalamus, the hippocampus assumes a crucial role in the initial phases of memory consolidation. 2 In our study involving an animal model of sleep disorders with Aβ induced cognitive decline, a more pronounced reduction in Cho was observed in the left hippocampus and Glx in the right hippocampus, suggesting distinctive patterns of neurotransmitter disruptions within the bilateral hippocampus. The decreased Glx complex in the right hippocampus, comprising both glutamate and glutamine, may primarily signify the loss of glutamate neurons or diminished glutamate activity, 60 a trend consistent with observations in individuals with AD.61,62 It has been reported that the reduction in hippocampal Glx is associated with increased functional connectivity with the frontal cortex, 63 indicating a potential impairment in memory consolidation under conditions of sleep deprivation and early-stage dementia. Despite the potential of sleep deprivation to induce over-excitation and an increase in glutamate, 12 our results suggest that reactive astrocytes engage in the uptake of substantial amounts of Glu through the glutamate-glutamine cycle to mitigate excitotoxic effects.64,65 With sleep deprivation and Aβ-induced neurotoxicity, activated astrocytes may undermined the modulation of metabolic pathways through Glu-Gln circulation. 66 Additionally, a noticeable reduction in Cho levels was observed in both animal models of sleep loss and its comorbidity with cognitive dysfunction, in consistent with a clinical sleep deprivation study that reported a significant decrease in Cho/Cr values. 67 Therefore, we postulate that sleep deprivation may exacerbate acetylcholine neurotransmission, leading to a degradation of acetylcholine, ultimately resulting in a faster depletion of Cho precursors. 68 In addition to serving as a precursor of acetylcholine, Cho is also considered as a marker of cell membrane integrity, reflecting processes of phospholipid synthesis. 69 When combined with Aβ-induced dementia, an increased consumption of choline substances for membrane due to reactive astrocytosis may lead to an even greater reduction in choline.70,71 Morphological observations, including synaptic dysfunction with a decreased vesicle number, further support the potential depletion of choline, hindering phospholipid synthesis for synaptic vesicles and transmitter release.72,73 Because of neural circuits connecting the thalamus and hippocampus via the commissural fornix, 74 our hippocampal MRS study indicate an early failure in glutamatergic transmitter release and synaptic transmission through choline depletion in the cooccurrence of sleep disorders and MCI, thereby disrupting connectivity from the upstream region of memory consolidation to thalamus.
An intriguing observation in our study is that not only GABA, Cho, and Glx levels exhibit lateralized disruptions, but also NAA, a well-established biomarker of neural integrity, 75 revealed bilateral differences within the hippocampus. NAA unveiled a bilateral distinction within the hippocampus. A substantial decrease in relative NAA content was evident under the conditions of both sleep deprivation and Aβ-induced dementia, coinciding with lateralized synapse dysfunction. In adverse, synaptic dysfunction could be a catalyst to disrupt neurotransmitter release via synaptic vesicle transport, impaired sleep homeostasis and undermined sleep-dependent memory consolidation. 76 Correlation analyses further revealed that the NAA/Cr ratio in the right side exhibited a stronger correlation with cognition, imparting diagnostic significance for early-stage AD patients reporting sleep disorders.77,78 Considering the known rightward bias in hippocampus-dependent memory storage,79,80 the bilateral hippocampal decompensation with rightward damage may represent a critical pathogenic mechanism underlying the development of early-stage AD induced by sleep disorder. Furthermore, other studies using resting-state functional magnetic resonance imaging (fMRI) have reported abnormalities in functional connectivity between the bilateral cerebral hemispheres following sleep deprivation,81,82 indirectly suggesting potential compensatory mechanisms between cerebral hemispheres, which may manifest as metabolic differences between the bilateral thalamus and hippocampus. 83 On top of that, due to right-ward reduction of GABA and Glx in thalamus and hippocampus, respectively, sleep deprivation may induce lateral inhibition of neural circuits and disrupt crucial neuro-metabolites in critical regions of memory consolidation, ultimately serving as a catalyst in the development of dementia. 84 In recent years, non-invasive neuromodulation techniques, including transcranial magnetic stimulation and transcranial electrical stimulation, have garnered extensive attention as potential physical therapy methods. Studies indicated that non-invasive neuromodulation can modulate neuronal activity in target brain regions and related brain regions and neurotransmitter concentrations,85–87 which may affect the brain's plasticity, thus helps to improve sleep and cognitive function. In the future, neurotransmitters dependent on sleep homeostasis may be therapeutic targets and modulated by neuromodulation techniques.
Several limitations are noteworthy in the present study. Firstly, further in-depth research is required to elucidate the specific factors contributing to the distinct patterns of neurotransmitter disruptions and the lateralized damage observed in the study. Moreover, it should be noted that the current results do not establish precise causality. Additional mesoscopic investigations, encompassing the prefrontal cortex, thalamus, and hippocampus, are warranted to establish a more comprehensive understanding of the neuro-metabolic cellular mechanisms underlying the exacerbation of cognitive impairment by sleep deprivation.
Conclusions
In summary, the observed alterations in these metabolites appear to represent a neural metabolic mechanism that underlies the disruption of memory consolidation. Moreover, these disruptions in neurotransmitters, aligning with the identified pattern, may contribute to the progression of AD. The different neural metabolic profiles between the bilateral hemispheres also imply lateralized effects of sleep on brain regions involved in memory consolidation.
Footnotes
Acknowledgments
We gratefully acknowledge the clinicians and patients involved in this project for their help and support.

Author contributions
Xiaowei Fan (Conceptualization; Formal analysis; Investigation; Methodology; Software; Visualization; Writing – original draft; Writing – review & editing); Xin Mao (Conceptualization; Formal analysis; Investigation; Methodology; Software; Visualization; Writing – original draft; Writing – review & editing); Ping Yu (Conceptualization; Data curation); Ding Han (Data curation); Chuxin Chen (Data curation); Hongqi Wang (Data curation); Xinyi Zhang (Data curation); Siyu Liu (Data curation); Weijing Chen (Data curation); Ziyan Chen (Data curation); Xiaoqiang Du (Data curation); Liangyun Jin (Data curation); Yizhi Song (Data curation); Hui Li (Data curation); Ning Zhang (Conceptualization; Methodology; Project administration; Supervision; Writing – review & editing); Yan Wu (Conceptualization; Methodology; Project administration; Supervision; Writing – review & editing); Lirong Chang (Conceptualization; Methodology; Project administration; Supervision; Writing – review & editing); Chunxue Wang (Conceptualization; Funding acquisition; Methodology; Project administration; Supervision; Writing – review & editing).
Funding
The authors disclosed receipt of the following financial support for the research, authorship, and/or publication of this article: This work was supported by grants from the National Key Research and Development Program of China (2022YFC2503904), Beijing Key Clinical Specialty Program, the Scientific Research Key Program of the Beijing Municipal Commission of Education (KZ202110025032), the National Natural Science Foundation of China (81771370, 82071514), and the Scientific Research Common Program of Beijing Municipal Commission of Education (KM201810025004, KM202110025029).
Declaration of conflicting interests
The authors declared no potential conflicts of interest with respect to the research, authorship, and/or publication of this article.
Data availability
The datasets are available from the corresponding author on reasonable request.