
Abstract
Identification of biological changes underlying the early symptoms of Alzheimer’s disease (AD) will help to identify and stage individuals prior to symptom onset. The limbic system, which supports episodic memory and is impaired early in AD, is a primary target. In this study, brain metabolism and microstructure evaluated by high field (7 Tesla) proton magnetic resonance spectroscopy (1H-MRS) and diffusion tensor imaging (DTI) were evaluated in the limbic system of eight individuals with mild cognitive impairment (MCI), nine with AD, and sixteen normal elderly controls (NEC). Left hippocampal glutamate and posterior cingulate N-acetyl aspartate concentrations were reduced in MCI and AD compared to NEC. Differences in DTI metrics indicated volume and white matter loss along the cingulum in AD compared to NEC. Metabolic and microstructural changes were associated with episodic memory performance assessed using Craft Story 21 Recall and Benson Complex Figure Copy. The current study suggests that metabolite concentrations measured using 1H-MRS may provide insight into the underlying metabolic and microstructural processes of episodic memory impairment.
Keywords
INTRODUCTION
Alzheimer’s disease (AD), the most common form of dementia, is a neurodegenerative disorder of the brain that results in progressive impairments across cognitive domains such as memory, language, and executive function [1]. Although neurofibrillary tangles and amyloid plaques are hallmarks of AD pathology, the biological mechanisms underlying the development of AD are complex and heterogeneous. No clear cause [1] or chain of events have been identified that lead to the clinical presentation of AD [2].
Clinically, AD progression is considered a continuum, beginning with an asymptomatic phase that transitions into a symptomatic predementia phase called mild cognitive impairment (MCI) due to AD, followed by a symptomatic dementia phase called probable AD. However, identifying where an individual lies along the disease continuum requires subjective clinical judgment, with greater diagnostic uncertainty early in the disease continuum. Incorporating biomarkers of AD pathology, such as measures of amyloid-β (Aβ) load, could help reduce this uncertainty [3, 4]. Additionally, volumetric measures of brain structure derived from magnetic resonance imaging (MRI) [5], white matter microstructural integrity derived from diffusion tensor imaging (DTI) [6], functional connectivity derived from functional MRI (fMRI) [7], and glucose uptake measured by fluorodeoxyglucose positron emission tomography (FDG-PET) [8] provide complimentary information that can also aid in staging the disease. Despite the availability of these sophisticated measures, it remains difficult to predict when and who will progress from MCI to AD. Even though disease-modifying treatments for AD are being investigated [9], they are not yet clinically available. Nevertheless, improving the ability to place an individual along the AD continuum, especially during the predementia phases, will help patients receive timely care and symptomatic treatment that could improve their quality of life [10].
Both the hippocampus and the posterior cingulate cortex (PCC) are known to be involved early in the pathological progression of AD [11]. Interestingly, both the hippocampus and PCC are connected by white matter fibers that run through the cingulum and are components of the Papez brain circuit, also known as the medial limbic system [12–16]. Damage to the grey matter and white matter structures of the Papez circuit is associated with episodic memory impairment [17–19]. Episodic memory impairment is among the earliest and most severe cognitive changes in AD [20], and is considered the most clinically relevant for assessing AD patients [21]. Structural changes in both the hippocampus and posterior cingulate cortex [5, 22–25], as well as changes in white matter microstructural integrity within the cingulum [6, 26–30] have previously been shown in AD and MCI.
In addition to brain structure, measures of brain metabolism may provide insight into disease stage, particularly since there is evidence that metabolic changes may precede changes in cellular microstructure, neuronal density, and death [31–33]. This suggests that measurement of brain metabolism could aid in the prediction of cognitive decline prior to the detection of structural changes at early stages of the disease. Though FDG-PET is a common measure of in vivo brain metabolism in AD, a less expensive, more accessible, and non-invasive method is proton magnetic resonance spectroscopy (1H-MRS) [34]. Several metabolites relevant to neuronal function can be simultaneously measured by 1H-MRS in specific brain regions. Previous studies have shown decreased N-acetyl aspartate (NAA) to creatine (Cr) ratio [35–39], decreased NAA concentration [40–42], and decreased glutamate (Glu) [39, 43] in the hippocampus and PCC of individuals with AD.
Although previous studies have independently shown altered brain metabolite levels in the PCC and hippocampus as well as altered microstructure in the cingulum in people with MCI and AD, it is unclear whether these changes occur simultaneously in the same individuals. The purpose of the current study was to determine whether altered metabolism in the hippocampus and PCC was associated with altered white matter microstructure in the cingulum of individuals with MCI and AD. Measuring metabolism using 1H-MRS and white matter microstructure using DTI within regions of the Papez circuit that are associated with episodic memory could provide valuable information to help support a diagnosis of MCI or probable AD. Thus, the main objectives of this study were to: 1) correlate 1H-MRS measurements in the hippocampus and PCC with MRI-derived measures of microstructural integrity in the cingulum, and 2) correlate 1H-MRS measurements in the hippocampus and PCC with measurements of episodic memory performance. We hypothesized that glutamate and NAA concentrations as measured by 1H-MRS would be lower in the PCC and left hippocampus of individuals with AD, and significantly correlated with both MRI-derived measures of microstructural integrity in the cingulum and measurements of episodic memory performance.
MATERIALS AND METHODS
Subjects
In total, 33 subjects were recruited from the Aging Brain and Memory Clinic at Parkwood Institute and the Geriatric Clinic at the Mount Hope Centre for Long Term Care in London, Ontario, Canada. Of these, sixteen subjects were cognitively normal elderly controls (NEC), eight subjects had a clinical diagnosis of mild cognitive impairment (MCI), and nine subjects had a clinical diagnosis of probable AD. This study was approved by the Western University Health Sciences Research Ethics Board. Informed consent was acquired according to the Declaration of Helsinki.
MCI and AD subjects were diagnosed according to the most recent core clinical criteria put forward by the National Institute of Aging and Alzheimer’s Association (NIA-AA) working Groups [3, 4]. The MCI criteria were consistent with the previously published Petersen criteria [44–46]. The AD criteria were consistent with the National Institute of Neurological and Communicative Disorders and Stroke/Alzheimer’s Disease and Related Disorders Association (NINCDS/ADRDA) criteria [47]. Clinical head CTs and MRIs were also used to investigate non-AD causes of cognitive impairment such as white matter loss or lacunar infarcts. Any subject with a significant number of lacunar infarcts, a single strategically located lacunar infarct, or significant white matter loss (>25%) were not considered for this study.
Additional exclusion criteria for the study were: 1) uncontrolled mood or psychiatric symptoms in the 6 months prior to study enrolment; 2) use of anti-depressant with anti-cholinergic side effects; 3) use of psychoactive medication excluding anti-depressants, neuroleptics, chronic anxiolytics, opioid pain relievers, or sedative hypnotics within the four weeks prior to study enrolment; 4) enrolment in a clinical trial using an investigational medication; and 5) contraindications to ultra-high field MRI scanning. All subjects were aged between 55–90 years old and had a Geriatric Depression Score (GDS) less than 6. Subjects taking cholinesterase inhibitors and/or memantine were included if they were on a stable dose for at least 12 weeks prior to study enrolment. In general, the inclusion, exclusion, and diagnostic criteria used in this study were consistent with the criteria used by the Alzheimer’s Disease Neuroimaging Initiative 2 (ADNI2) study [48].
Data acquisition
Magnetic resonance imaging
All subjects were scanned on a 7 T/70 cm Siemens MAGNETOM (Siemens, Erlangen, Germany) head-only MRI system at the Centre for Functional and Metabolic Mapping, Robarts Research Institute with an 8-channel transmit, 32-channel receive whole head array [49]. The scanner is equipped with eight 1000 W radiofrequency amplifiers and a gradient system (80 mT/m maximum gradient strength, 350 mT/m/s slew rate) that includes second order, third order, and Z4 shims. Whole-brain, 3D T1-weighted anatomical images and T1 maps were acquired using the MP2RAGE pulse sequence [50] with 0.75 mm isotropic resolution, a repetition time (TR) of 6000 ms, and an echo-time (TE) of 2.83 ms.
Magnetic resonance spectroscopy
1H-MRS data were acquired from all subjects using an implementation of the semi-LASER (localization by adiabatic selective refocusing) sequence described in detail elsewhere [51–53]. Voxel positions were manually positioned within the high-resolution, 3D T1 weighted anatomical images using anatomical landmarks. Examples of the voxel placements are given in Fig. 1a and 1b. Water suppressed and unsuppressed 1H-MRS data were collected from a 23×12×12 mm3 voxel in the left hippocampus (Fig. 1a) and a 16×20×18 mm3 voxel in the PCC (Fig. 1b) with the following parameters: TR = 7500 ms, TE = 60 ms, number of points = 2048, bandwidth = 6024 Hz, averages = 64 for the water suppressed data, averages = 4 for the water unsuppressed data. Hippocampal spectroscopy data could not be acquired in two NEC subjects, one MCI subject, and three AD subjects. PCC spectroscopy data were successfully acquired from all subjects.
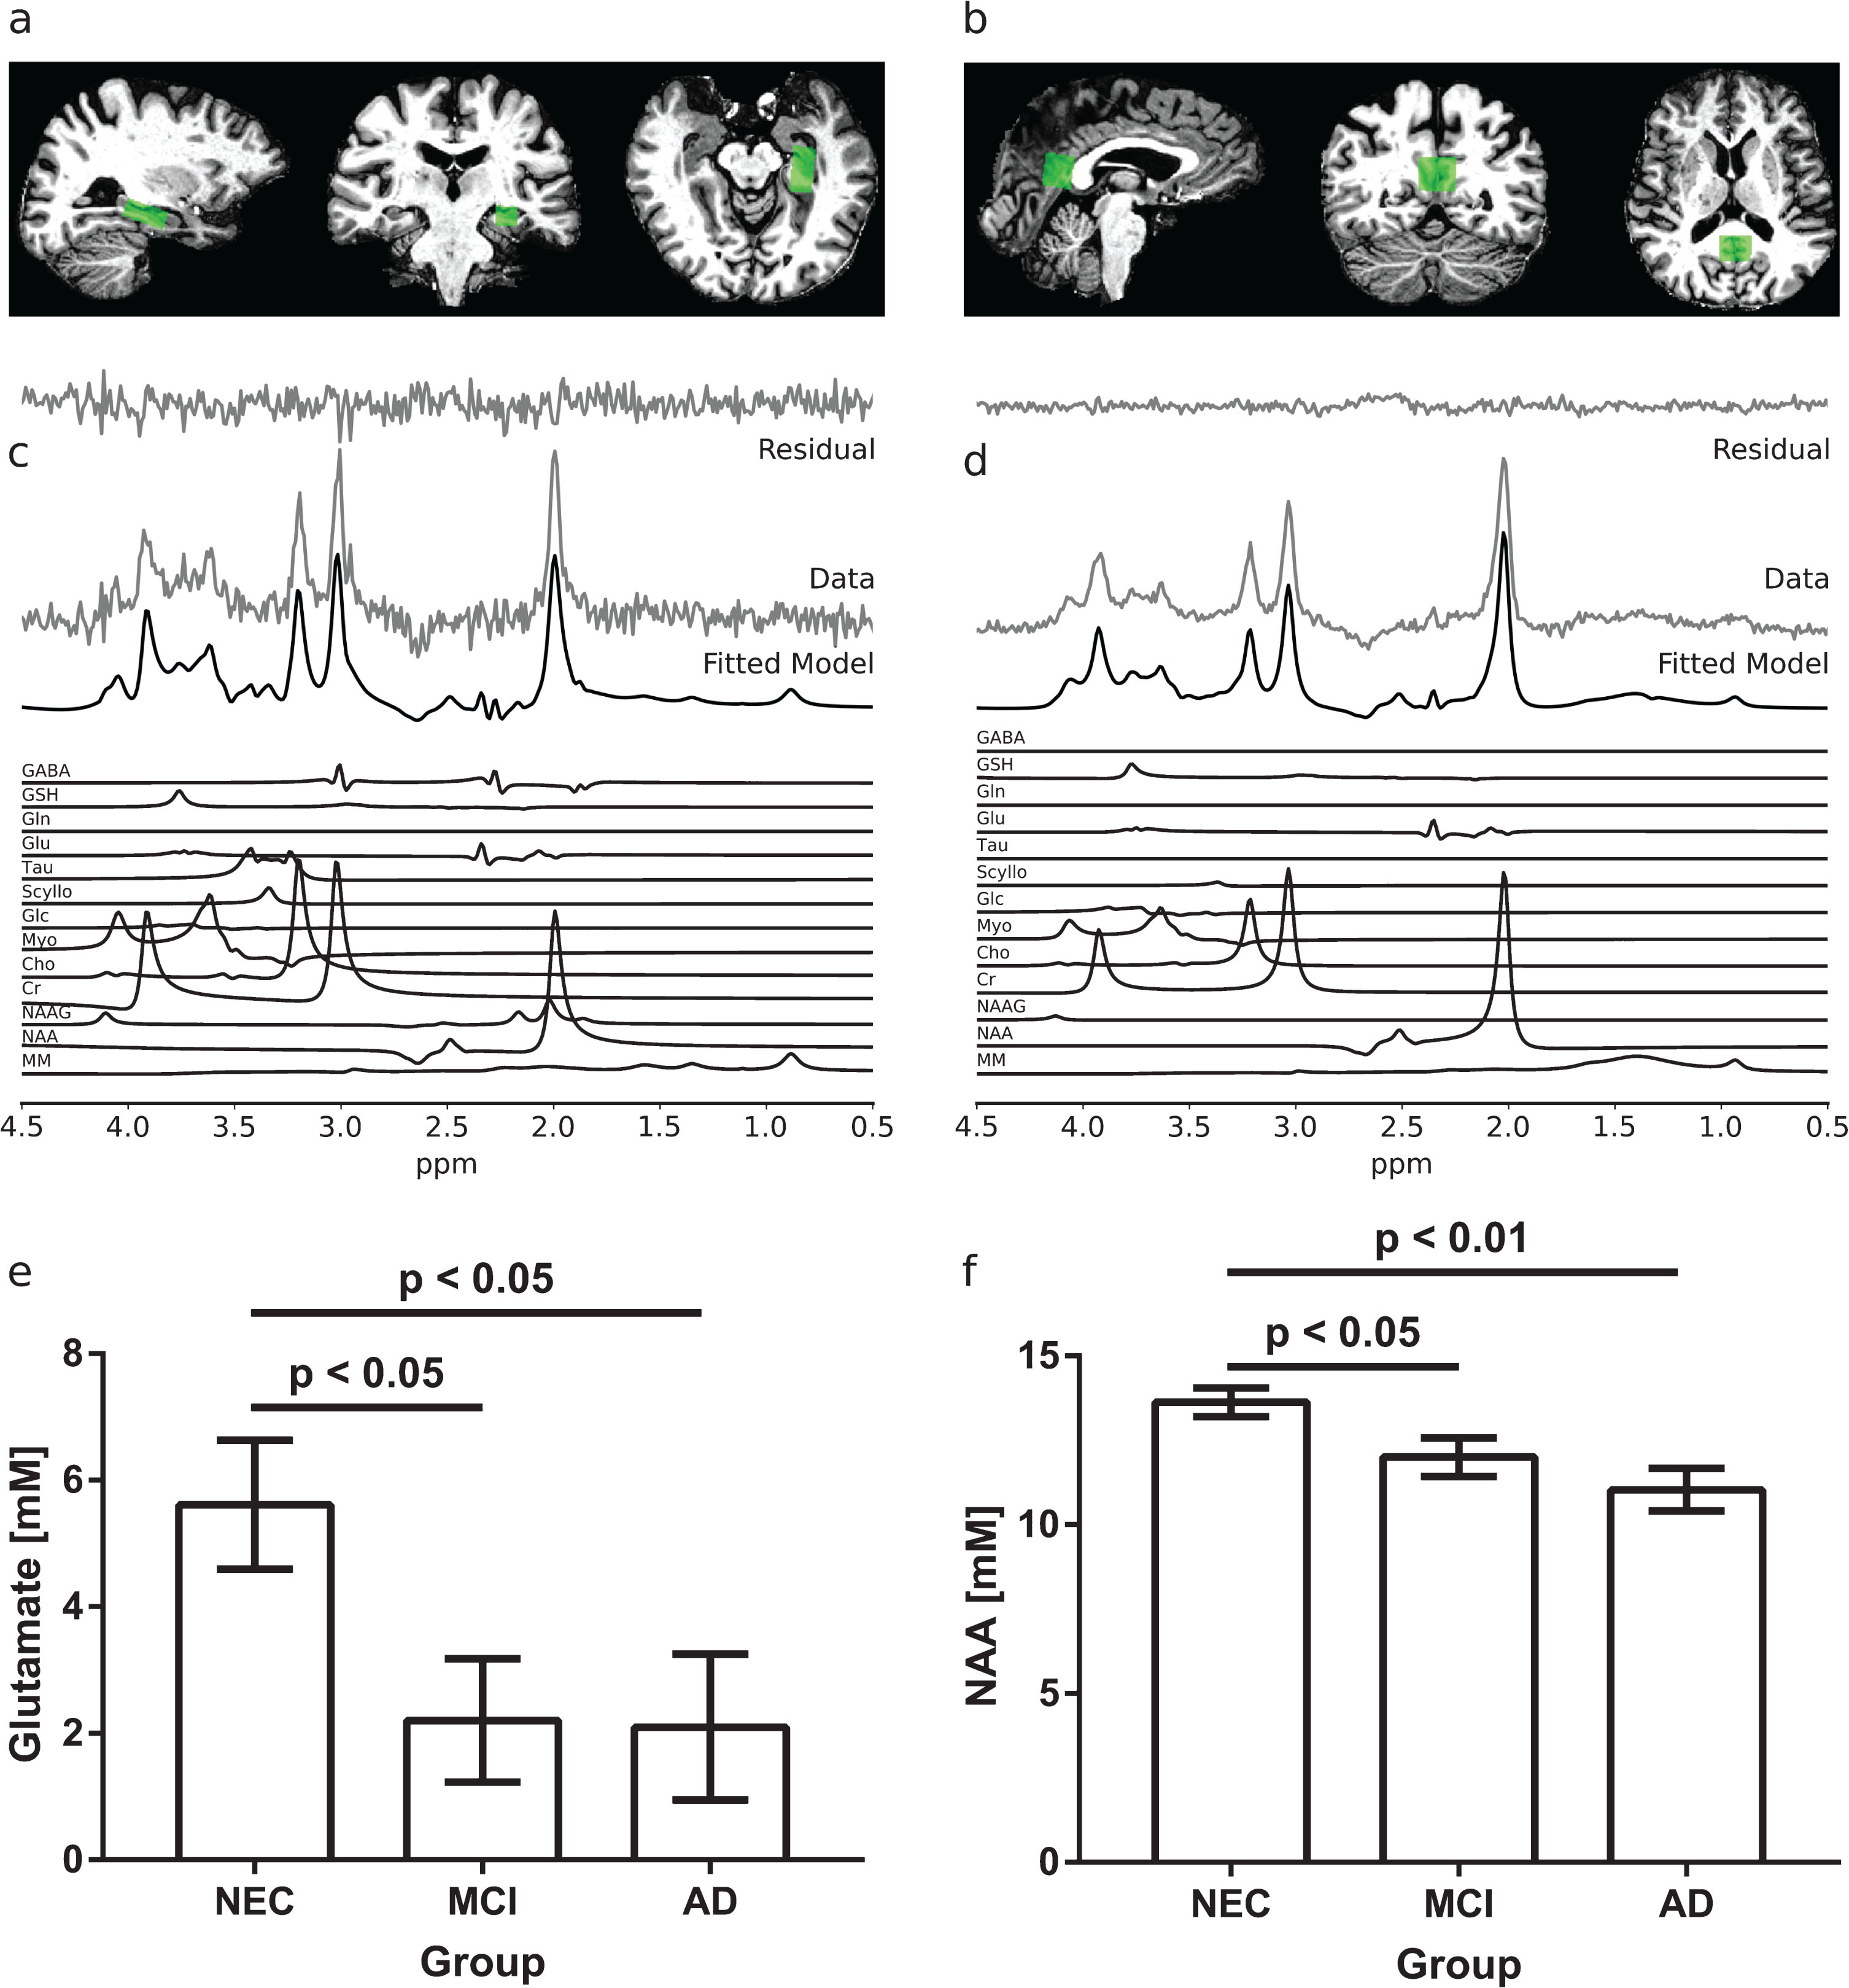
Examples of spectroscopy voxel placement and representative spectra in the left hippocampus (a, c) and PCC (b, d). The fitted model is shown in (c) and (d) along with the individual metabolite components. In the left hippocampus (e), MCI and AD subjects had significantly lower glutamate concentrations measured by 1H-MRS than NEC subjects (p < 0.05). In the PCC (f), the average N-acetyl aspartate (NAA) concentrations measured by 1H-MRS were lower in MCI and AD compared to NEC subjects (p < 0.05). Standard errors are shown in (e) and (f).
Diffusion weighted imaging
Diffusion weighted images covering the whole brain were also acquired from all subjects using a single-shell, multi-shot, diffusion-weighted, spin-echo, echo-planar imaging (EPI) sequence with b = 1000 s/mm3, 64 gradient directions, 2×2×2 mm3 resolution, TR = 5100 ms, and TE = 50.2 ms. To facilitate corrections of distortions induced by the EPI sequence, two b = 0 s/mm3 images were acquired with the same sequence—one with the phase encode direction in the anterior-to-posterior direction and the other with the phase encode direction in the posterior-to-anterior direction.
Cognitive testing
Subjects were first assessed using the Clinical Dementia Rating (CDR) scale and GDS to ensure that the inclusion criteria for the study were met. Since MCI and AD subjects were already assessed using the Mini-Mental State Examination (MMSE) and the Montreal Cognitive Assessment (MoCA) as part of standard clinical care, the episodic memory of study subjects was tested using neuropsychological tests not used in clinic to avoid learning effects. Specifically, the Craft Story 21 Recall (CSR) [54] and the Benson Complex Figure Copy (BCFC) [55] tests from the National Alzheimer’s Coordinating Centre Neuropsychological Battery Version 3.0 [56, 57] were used. Research staff administering the cognitive testing were trained by a licensed neuropsychologist in accordance with Washington University protocols. Raw test scores were converted into age, sex, and years of education adjusted z-scores based on published norms [56]. Test z-scores were used for all further analyses. One NEC subject did not agree to provide information about their years of education and was therefore excluded from all analyses involving their cognitive testing data.
Data processing
Post-processing of acquired images
Brain extraction was performed on the T1 weighted anatomical images, T1 maps, and diffusion weighted images using a registration-based method. First, a transformation between T1-space and standard MNI152-space was found by registering the T1 weighted anatomical image and the MNI152 T1 weighted template. The registration was performed by first using a 6 degree-of-freedom (DOF) linear registration, followed by a 12 DOF linear registration, and non-linear registration. Linear and non-linear registrations were performed using FMRIB’s linear image registration tool (FLIRT) [58, 59] and FMRIB’s non-linear imaging registration tool (FNIRT), respectively. These tools are part of FMRIB’s Software Library (FSL), version 5.0.10 [60–62]. Using the resulting transformation matrix, the MNI152 brain mask was then transformed in T1-space and applied to the anatomical images and T1-maps.
Since EPI sequences are prone to susceptibility distortions, the diffusion weighted images were distortion-corrected using an estimated susceptibility off-resonance field, derived from the two b = 0 s/mm3 images acquired with opposite phase encode directions. The topup tool from FSL [63] was used to apply this correction. Other distortions induced by eddy currents and subject motion were then corrected using the FSL eddy tool [64]. This processing also generated a distortion-corrected b = 0 s/mm3 image.
A transformation from T1-space to diffusion-space was found by linearly registering the T1 weighted anatomical image and the distortion-corrected b = 0 s/mm3 image using the FSL epi_reg script. Applying the previously found MNI152-space to T1-space transformation matrix and the T1-space to diffusion-space transformation matrices in series transformed the MNI152 brain mask into diffusion-space for brain extraction of the diffusion weighted images. Then, using the FSL dtifit command-line program, a diffusion tensor model was fitted to every voxel within the brain-extracted diffusion weighted images, and subject-specific fraction anisotropy (FA), radial diffusivity (RD), and axial diffusivity (AxD) maps were produced. An example of a subject-specific FA map generated from diffusion tensor fitting of brain-extracted diffusion weighted images is shown in Fig. 3a.
Quantification of metabolite concentrations
The 1H-MRS data were first lineshape and eddy current corrected using combined QUALITY deconvolution and eddy current correction (QUECC) [65] with 400 QUALITY (quantification improvement by converting lineshapes to the Lorentzian type) points [66]. Residual water in the water suppressed spectrum was removed by subtracting peaks between 4.2 ppm and 5.7 ppm identified by a Hankel singular value decomposition fitting routine that required no prior knowledge.
Simulated, 7T semi-LASER prior knowledge templates that included an empirically measured macromolecule model were fitted in the time-domain to the water suppressed data using in-house software called fitMAN [67], which uses a Levenberg-Marquardt algorithm [68] to minimize the difference between the data and the template. A detailed description of the simulations and macromolecule model were described previously [53]. Briefly, the following metabolites were included in the prior knowledge template used to fit the water suppressed data from the PCC: NAA, N-acetylaspartyl glutamate (NAAG), choline (Cho), creatine (Cr), myo-inositol (Myo), glutamate (Glu), glutamine (Gln), glutathione (GSH), phosphorylethanolamine (PEth), scyllo-inositol (Scyllo), taurine (Tau), alanine (Ala), glucose (Glc), GABA, glycine (Gly), and lactate (Lac). The multiplets of NAA were fitted independently, because they experience a different rate of T2 relaxation than the singlet at 2.01 ppm [69]. The prior knowledge template used to fit the water suppressed data from the left hippocampus did not include PEth and Gly, because the lower signal-to-noise ratio (SNR) of these data made it difficult to reliably fit these low amplitude signals.
To reduce the number of variables to be fitted, many parameters describing the lineshapes of the metabolites were constrained within the prior knowledge template (Table 1). Within metabolites, the peak amplitudes, shifts, and phases were fixed relative to one another. Relative peak amplitudes were not fixed between metabolites, since these are expected to vary across subjects. Relative peak positions and phases between some metabolites were fixed. For example, the positions and phases of low-amplitude metabolites (e.g., Ala, GABA, Lac) were linked to the positions and phases of higher-amplitude metabolites (e.g., NAA, myo-inositol, glutamate). A summary of the parameter constraints is given in Table 1.
A summary of relationships between metabolite parameters in the prior knowledge template [67]. Peak positions (shifts) and phases of low-amplitude metabolites were linked to the shifts and phases of higher-amplitude metabolites. Within metabolites, peak amplitudes, shifts, and phases were fixed relative to one another. The following metabolites were included in the prior knowledge template used to fit 1H-MRS data from the PCC: NAA, NAAG, Cho, Cr, Myo, Glu, Gln, GSH, PEth, Scyllo, Tau, Ala, Glc, GABA, Gly, and Lac. The prior knowledge template used to fit 1H-MRS data from the left hippocampus did not include PEth and Gly
Hippocampal and PCC metabolite concentrations ([M]) were obtained as previously described [70] by using the fitted and corrected amplitudes of the metabolite signals (
The corrected water signal amplitudes from the hippocampus and PCC were obtained by fitting the water unsuppressed data acquired from the respective regions with a prior knowledge template containing a single Lorentzian at 4.7 ppm. The fitted amplitude was first corrected for the number of averages used during data acquisition (
The fitted amplitudes of the metabolite signals were also corrected for the number of averages used during data acquisition (
A summary of the metabolite-specific T1 and T2 values used for relaxation correction of the fitted metabolite signals. T1 values were obtained directly from the literature, whereas T2 values were estimated using different reported values in literature (see text for details). The same T1 and T2 values were used for spectra acquired from both the hippocampus and the PCC
aT1 and T2 values of metabolites which could not be determined were assumed to be similar to that of Myo [69, 118]. bT2 values of NAAG were assumed to be similar to that of NAA [69]. cT2 values of Gln were assumed to be similar to that of Glu [69]. dT1 and T2 values of GABA were assumed to the same in both GM and WM, as [117] did not report separate values for GM and WM.
Tractography and diffusion metrics in the cingulum
To study the relationship between spectroscopy measurements to MRI-derived measures of neuronal injury in the cingulum, the left cingulum of each subject was reconstructed using diffusion-based tractography. Two separate segments, as defined by Wakana et al. [75], were identified: the cingulate gyrus portion that runs along the cingulate gyrus, and the hippocampal portion that runs along the ventral side of the hippocampus. As shown in Fig. 2, the cingulate gyrus portion passed through the spectroscopy voxel placed in the PCC, while the hippocampal portion passed through both spectroscopy voxels.

Three-dimensional transparent whole brain (grey) of a single subject in two different orientations showing the position of the spectroscopy (green shaded regions) in relation to the left cingulum fiber tracts reconstructed using diffusion-based probabilistic tractography. Two separate segments as defined by Wakana et al. [75] were identified (black labels): the cingulate gyrus portion that runs along the cingulate gyrus, and the hippocampal portion that runs along the ventral side of the hippocampus. The cingulate gyrus portion passed through the spectroscopy voxel (green shaded region) placed in the PCC, while the hippocampal portion passed through both spectroscopy voxels (green shaded regions). The colors on the fiber tracts represent the FA values along the cingulum.
The cingulate gyrus portion was identified using whole-brain tractography followed by an atlas-based technique to select only those tracts that belonged to the cingulum. First, the T1 weighted anatomical image was transformed into diffusion-space using the previously found transformation matrix. From this image, a WM mask was generated using FSL FAST. Then, Bayesian probabilistic tracking with a diffusion tensor model [76] was performed on the brain-extracted diffusion weighted images (Fig. 3a) using every voxel in the WM mask as a seed voxel. The produced tracts were refined using an exclusion region of interest (ROI) defined based on the left cingulum/cingulate gyrus mask (label #5) from the 2 mm probabilistic John’s Hopkins white matter tractography atlas thresholded at zero [77, 78]. This thresholded atlas was included with FSL. The mask was transformed from MNI152-space into the subject-specific diffusion-space using the previously found transformation matrices (Fig. 3b1). Only tracts that lay completely within this mask were retained. Any tracts that touched the edge of the mask were discarded. Tracts that were shorter than the mean tract length minus one standard deviation were also discarded. An example of the result is shown in Fig. 3c1.

Diffusion-based tractography of the left cingulum. For both the cingulate gyrus portion and hippocampal portion of the cingulum, Bayesian probabilistic tracking with a diffusion tensor model [76] was performed on the brain-extracted diffusion weighted images shown in (a). The produced tracts were refined using an atlas-based exclusion region of interest (b1) to identify the cingulate gyrus portion of the cingulum (c1). Using the spectroscopy voxels as seeds and waypoints and discarding those tracts that were not geometrically similar to the hippocampal portion of the cingulum (b2), the hippocampal portion of the cingulum was identified (c2). The identified tracts of the cingulum were modelled as B-splines, and diffusion metrics were assigned to each vertex of the B-spline, as shown in (c1) and (c2), where the colors represent the FA values along the cingulum. These metrics were averaged across corresponding vertices to obtain mean measures along the cingulum, as shown in (d1) and (d2).
The hippocampal portion of the cingulum was also identified using Bayesian tractography. However, instead of using an atlas, the tractography was constrained by the spectroscopy voxels. Every image voxel within the left hippocampal spectroscopy voxel was used to seed the tractography and every image voxel within the PCC spectroscopy voxel was used as a waypoint. With this approach, only tracts that began in the hippocampal spectroscopy voxel and passed through the PCC spectroscopy voxel were identified. Tracts were grouped based on geometric similarity using spectral clustering [79, 80] and only the cluster of tracts with a geometry that matched the hippocampal portion of the cingulum was retained (Fig. 3b2). Of those tracts, any that were shorter than the mean tract length of the cluster minus one standard deviation were also discarded. An example of the result is shown in Fig. 3c2.
The identified tracts were then modelled as cubic B-splines and re-parameterized to 33 vertices to facilitate between-group statistical analysis [81]. Diffusion metrics were assigned to each vertex of the B-spline by selecting the metric value from the corresponding image voxel in the previously generated FA, RD, and AxD maps. An example of this is shown in Fig. 2, Fig. 3c1, and Fig. 3c2, where the colors represent the FA measurement along the tracts. Tissue T1 values were also assigned to each vertex, by first transforming the T1 map to diffusion-space using the previously found transformation matrix, and then selecting the T1 value from the corresponding image voxel. The metrics were averaged across corresponding vertices to obtain mean measures of FA, RD, AxD, and T1 along the cingulum. An example of the mean FA plotted with respect to position along the cingulum for a single subject is shown in Fig. 3d1 and Fig. 3d2.
Statistical analyses
Statistical analyses for the spectroscopy data were performed using GraphPad Prism 7.00 for Windows (GraphPad Software, La Jolla, CA, USA). Before analysis, outliers were first identified using Grubbs’ method [82] with the significance level (α) set to 0.05. As a result, one AD subject was an outlier and removed from the analysis of the hippocampal spectroscopy data. A one-way analysis of variance (ANOVA) was performed for each measured metabolite to identify between-group differences at α= 0.05. If a significant difference among group means was found, a post-hoc between-group comparison using Fisher’s least significant differences (LSD) test was performed. For three groups at α= 0.05, Fisher’s LSD guarantees that the familywise error rate (FWER) does not exceed 0.05 [83].
Cognitive testing data were analyzed in a similar way. An ANOVA was performed for each of the scores obtained from the CSR and BCFC tests to identify between-group differences at α= 0.05. If the group effect was significant, a post-hoc LSD test with α= 0.05 was performed to identify statistically significant differences between groups.
To determine whether along-cingulum metrics changed between groups, a linear mixed effect regression as described in [81] was performed for each metric and for each pairwise comparison. The regression contains a vertex-by-group interaction that tests whether the effect of group on a metric varies based on position along the tract. If an ANOVA of the vertex-by-group interaction term was significant at α= 0.05, linear mixed effect regressions were performed at each vertex to test whether there was an effect of group on a metric. If the effect was significant at a level of α= 0.05, the metric was considered to be different between groups at that tract position. Statistical analyses of along-cingulum diffusion measures were performed in R [84].
For both the hippocampal and cingulate gyrus portions of the cingulum, the diffusion metric values in the largest continuous region of statistical difference between groups were averaged and used to examine association with the spectroscopy measurements that were significantly different between groups. The averaged diffusion metric values were also correlated with the CSR and BCFC scores. Finally, the spectroscopy measurements that differed between groups were correlated with the CSR and BCFC scores. All correlations were Pearson correlations performed at the one-tailed α of 0.05 using GraphPad Prism 7.00.
RESULTS
Magnetic resonance spectroscopy
Spectra acquired in the hippocampus (Fig. 1c) had an average (±SD) signal to noise ratio (SNR) of 28±10, defined as the height of the absolute signal at the position of the NAA CH3 peak divided by the standard deviation (SD) of the noise. The average (±SD) linewidth was 17.4±6.3 Hz. The voxel contained on average (±SD) 56±8% grey matter, 25±6% white matter, and 19±9% CSF. There was a significant group effect on glutamate concentration in the left hippocampus (F(2,24) = 3.61, p < 0.05). As shown in Fig. 1e, post-hoc analysis indicated that MCI and AD subjects had significantly lower left hippocampal glutamate levels than NECs (p < 0.05). Group differences were not detected in other metabolite concentrations in the left hippocampus.
Spectra acquired in the PCC (Fig. 1d) had an average (±SD) SNR of 94±24 and an average (±SD) linewidth of 14.0±3.5 Hz. The voxel contained on average (±SD) 52±7% grey matter, 29±6% white matter, and 19±8% CSF. In the PCC, a significant group effect on NAA concentration was found (F(2,30) = 6.91, p < 0.01). Post-hoc analysis indicated that AD subjects had significantly lower NAA levels in the PCC than NECs (p < 0.01, Fig. 1f). MCI subjects also had significantly lower NAA levels in the PCC than NECs (p < 0.05, Fig. 1f). Group differences were not detected in other metabolite concentrations in the PCC.
Diffusion in the cingulum
In the hippocampal portion of the cingulum, no significant vertex-by-group effect was found for the FA metric (Fig. 4b). No significant vertex-by-group effects were found for any metric when comparing NEC subjects to MCI subjects. However, when comparing NEC subjects to AD subjects, a significant vertex-by-group effect was found for the RD (F(32,640) = 1.68, p < 0.05), AxD (F(32,640) = 2.78, p < 1×10⁻⁶), and T1 (F (32, 640) = 1.935, p < 0.01) metrics. A significant vertex-by-group effect was also found for the RD (F (32, 352) = 1.78, p < 0.01), AxD (F (32, 352) = 1.95, p < 0.01), and T1 (F (32, 352) = 2.08, p < 0.001) metrics when comparing MCI subjects to AD subjects. Along-tract analyses showed that the AD group had significantly higher RD (p < 0.05, Fig. 4c), AxD (p < 0.05, Fig. 4d), and T1 (p < 0.05, Fig. 4e) in the first 25% of the hippocampal cingulum than the NEC and MCI groups. These differences are shown in the p-value plots provided in Fig. 4b-e, where p < 0.05 between groups is highlighted in green.
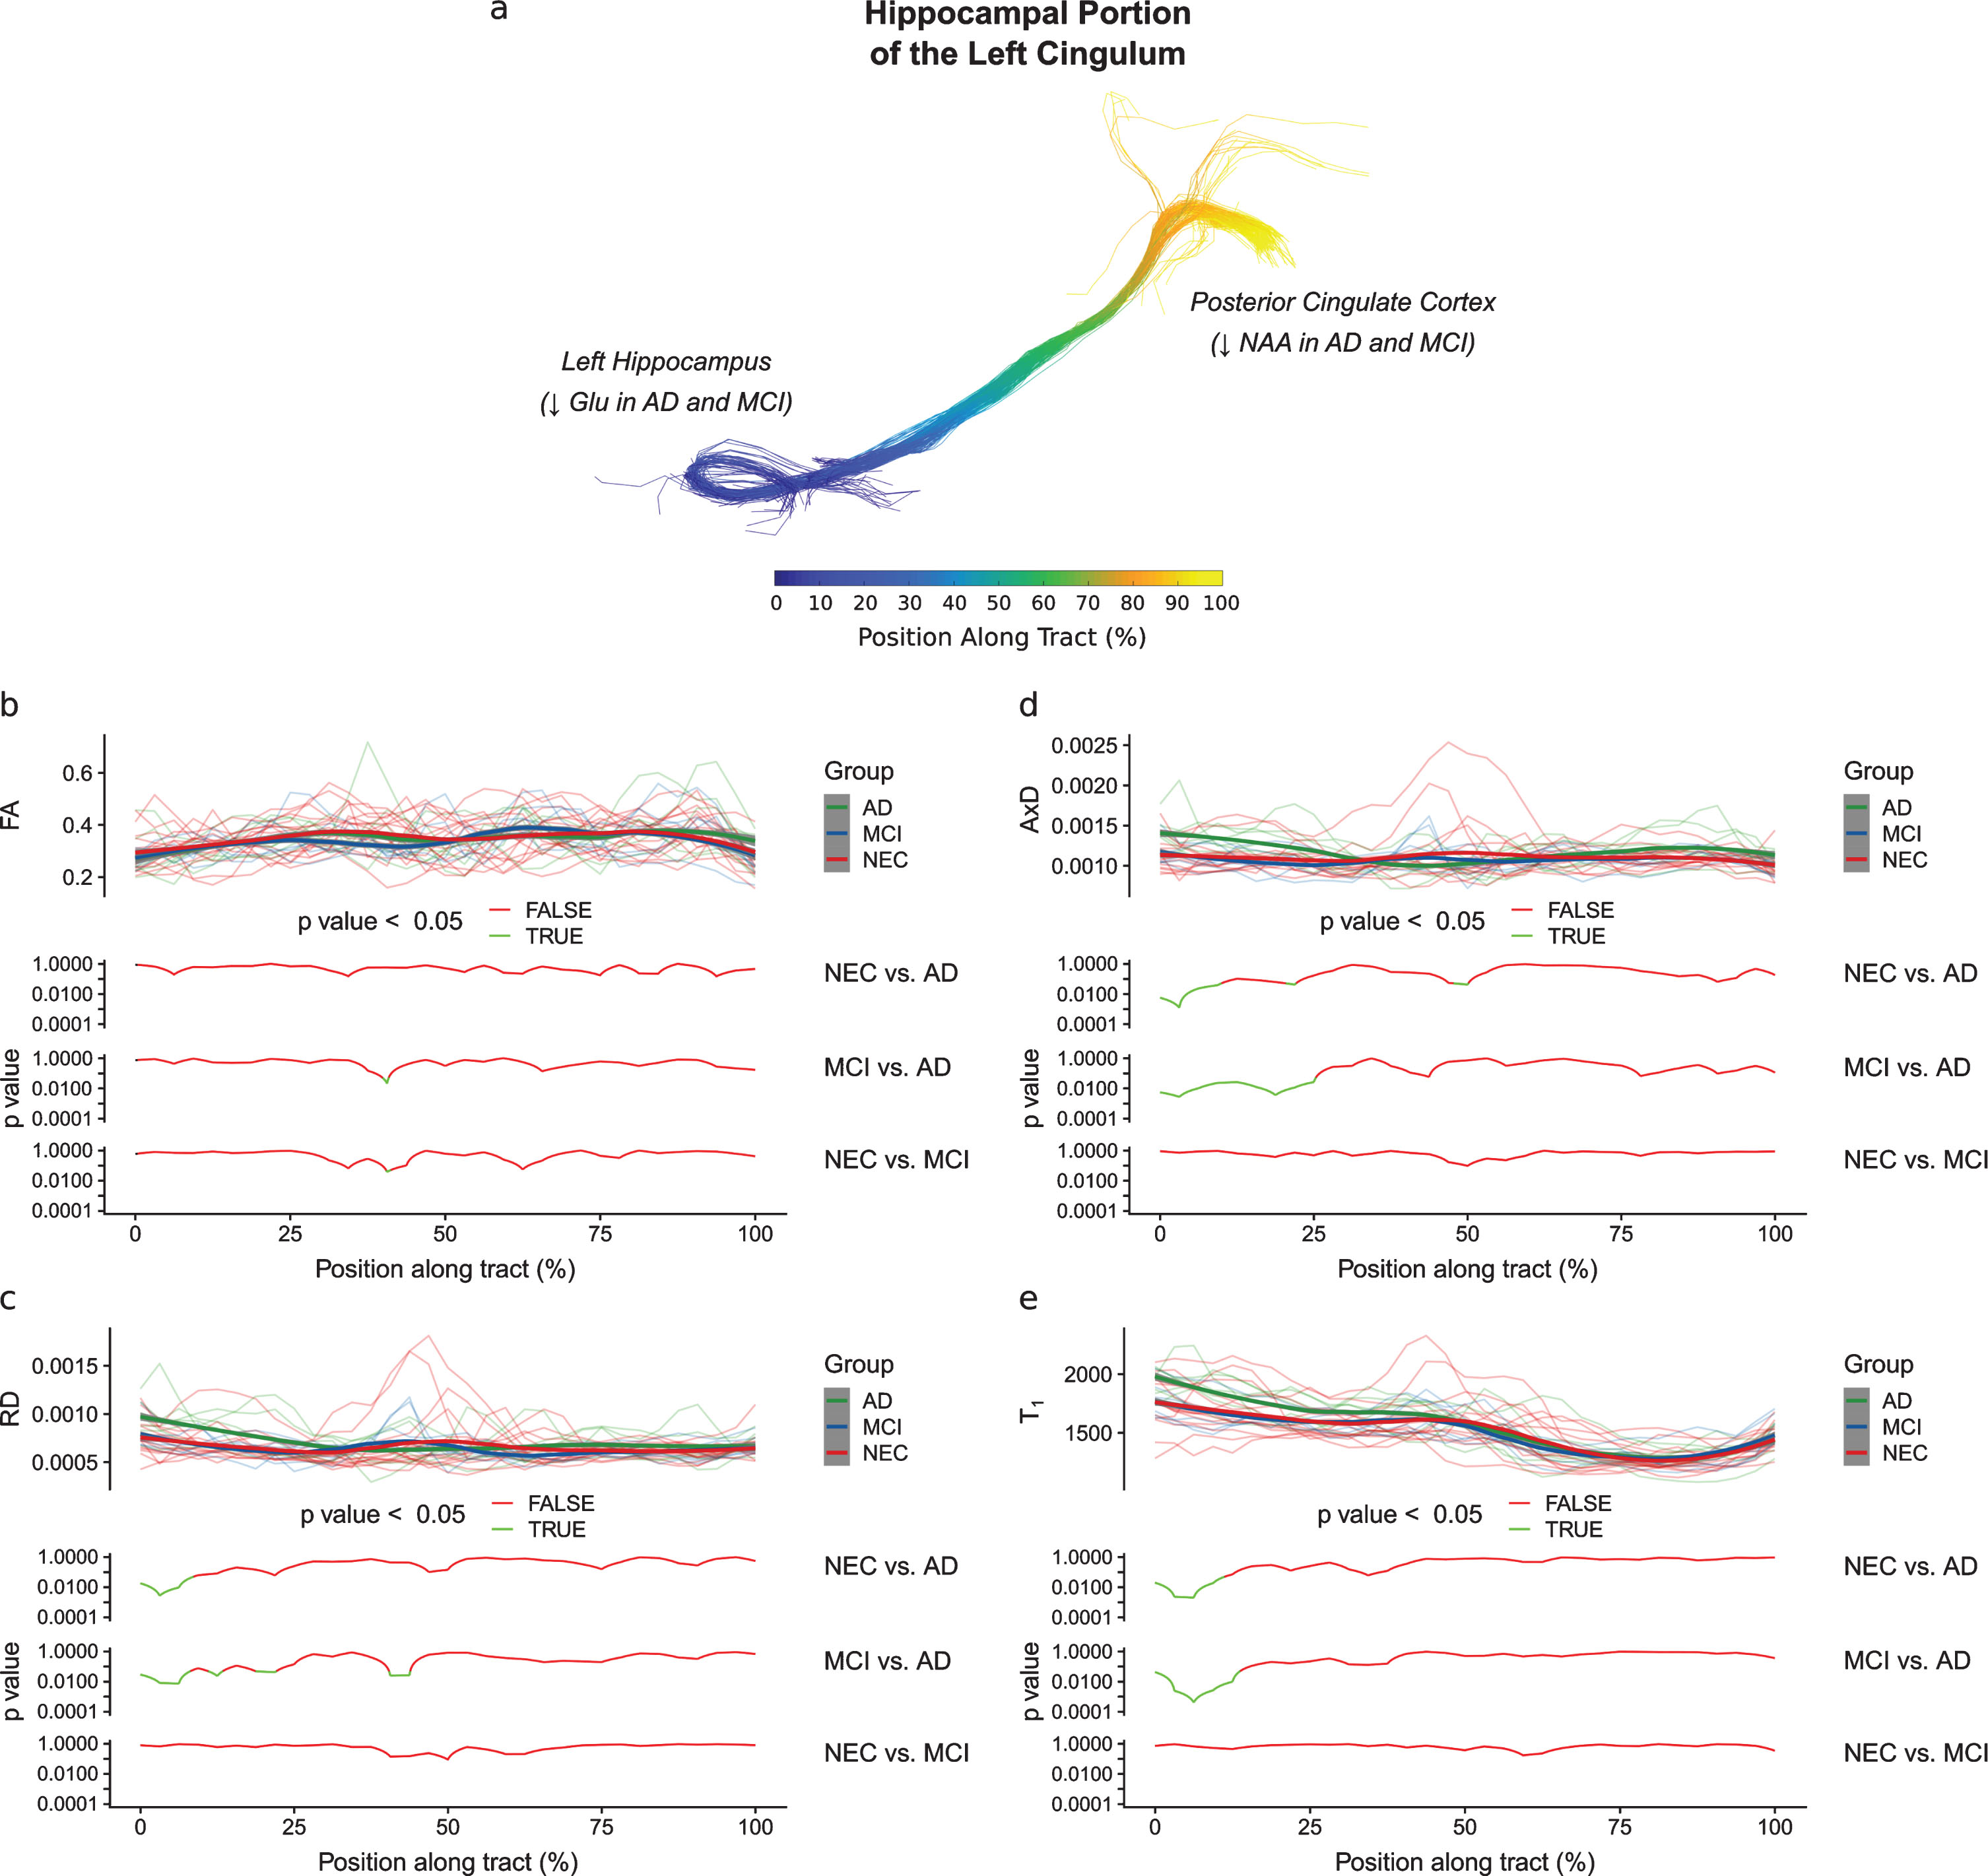
Diffusion metrics plotted as a function of the position along the hippocampal portion of the cingulum. The position along this tract is defined in (a), with the start of the tract in the left hippocampus and the end of the tract in the posterior cingulate cortex. In each of (b), (c), (d), and (e), the diffusion metric of individual subjects at each position along the tract are shown semi-transparently in the background of the top panels and are overlaid with the smoothed estimates of the group means (thick lines). The pointwise 95% confidence intervals are shown in grey. In the bottom panels, the results of between-group analyses are plotted with respect to position. No differences between groups were found along the tract for the FA metric (b). As shown in (c), (d), and (e), respectively, the AD group had significantly higher RD (p < 0.05), AxD (p < 0.05), and T1 (p < 0.05) in the first 25% of the hippocampal cingulum than the NEC and MCI groups. This pattern of changes in the AD group may be interpreted as the result of a loss of neurons in the hippocampus.
In the cingulate gyrus portion of the cingulum, no significant vertex-by-group effect was found for any metric when comparing NEC subjects to MCI subjects. A significant vertex-by-group effect was found for the FA (F (32, 704) = 1.82, p < 0.01) and RD (F (32, 704) = 1.46, p < 0.05) when comparing NEC subjects to AD subjects. When comparing MCI subjects to AD subjects, a significant vertex-by-group effect was also found for the FA (F (32, 448) = 1.52, p < 0.05) and RD (F (32, 448) = 1.95, p < 0.01) metrics. No other significant vertex-by-group effects were found. Along-tract analyses showed that the AD group had significantly lower FA (p < 0.05, Fig. 5b) and higher RD (p < 0.05, Fig. 5c) than the NEC and MCI groups in the last 60–90% of the cingulate gyrus portion of the cingulum.
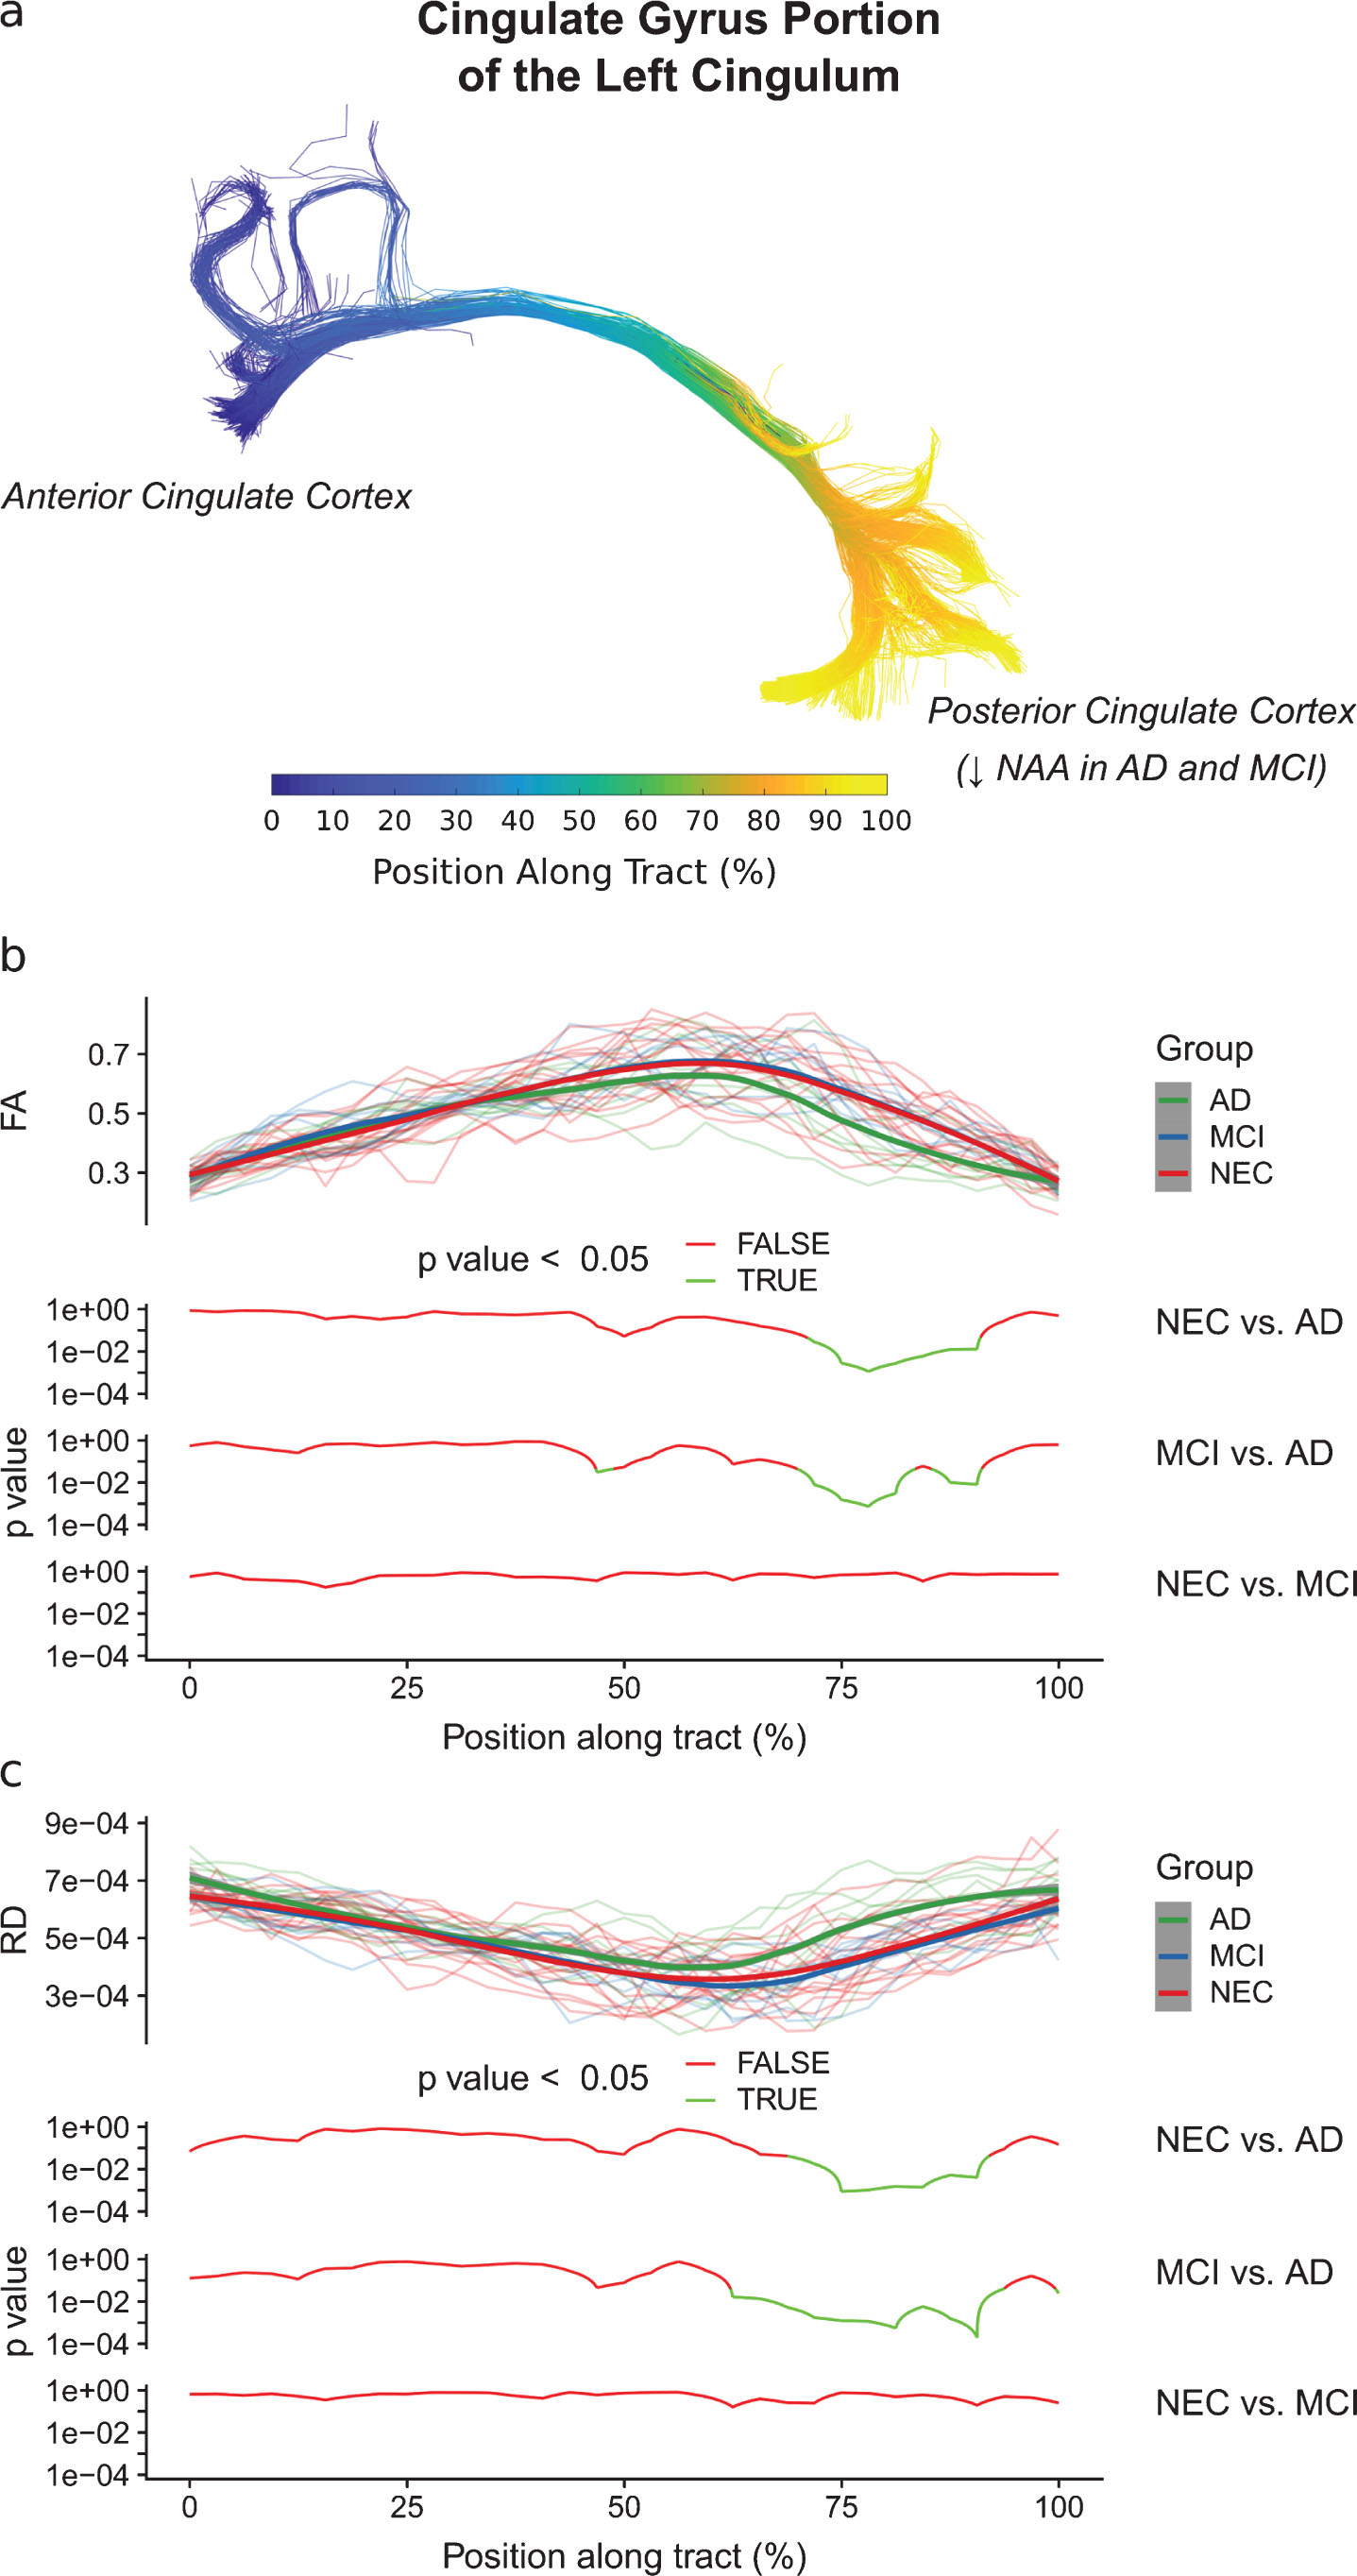
Diffusion metrics (FA and RD) as a function of the position along the cingulate gyrus portion of the cingulum. The position along this tract is defined in (a), with the start of the tract in the anterior cingulate cortex and the end of the tract in the posterior cingulate cortex. In (b) and (c), the diffusion metric of individual subjects at each position along the tract are shown semi-transparently in the background of the top panels and are overlaid with the smoothed estimates of the group means (thick lines). The pointwise 95% confidence intervals are shown in grey. In the bottom panels, the results of between-group analyses are plotted with respect to position. As shown in (b) and (c), respectively, the AD group had significantly lower FA (p < 0.05) and higher RD (p < 0.05) than the NEC and MCI groups in the last 60–90% of the cingulate gyrus portion of the cingulum. This pattern of changes in the AD group may be interpreted as a demyelination process.
Tests of episodic memory
Significant group effects were found for the CSR verbatim z-scores (immediate: F (2, 31) = 15.9, p < 0.0001; delayed: F (2, 31) = 20.92, p < 0.0001) and the CSR paraphrase z-scores (immediate: F (2, 31) = 16.44, p < 0.0001; delayed: F (2, 31) = 28.45, p < 0.0001). Post-hoc analysis showed that MCI and AD subjects had lower verbatim scores than NEC subjects (immediate: p < 0.001, delayed: p < 0.0001). MCI and AD subjects also had lower paraphrase scores (immediate: p < 0.001, delayed: p < 0.0001). For the BCFC test, a significant group effect was found for the BCFC delayed verbatim z-score (F (2, 31) = 17.9,p < 0.0001). Post-hoc analysis revealed that MCI and AD subjects had lower scores than NEC subjects (p < 0.0001). Means and standard deviations of the test scores are provided in Supplementary Table 1.
Correlations
Metabolite levels in the hippocampus and PCC shown to be different between groups were examined for associations with diffusion measures in the cingulum (Fig. 6). Specifically, left hippocampal glutamate level was inversely correlated with the average RD (r = -0.40, p < 0.05, Fig. 6a) and AxD (r = -0.51, p < 0.01, Fig. 6b) in the first 25% of the hippocampal cingulum. NAA levels in the PCC were also inversely correlated with the average RD (r = -0.46, p < 0.01, Supplementary Figure 1a) and AxD (r = -0.35, p < 0.05, Supplementary Figure 1b) in this portion of the cingulum. In the last 60–90% of the cingulate gyrus portion of the cingulum, NAA level in the PCC was inversely correlated with RD (r = -0.42, p < 0.05, Fig. 6c), T1 (r = -0.61, p < 0.001, Fig. 6d), and positively correlated with FA (r = 0.37, p < 0.05, Fig. 6e).
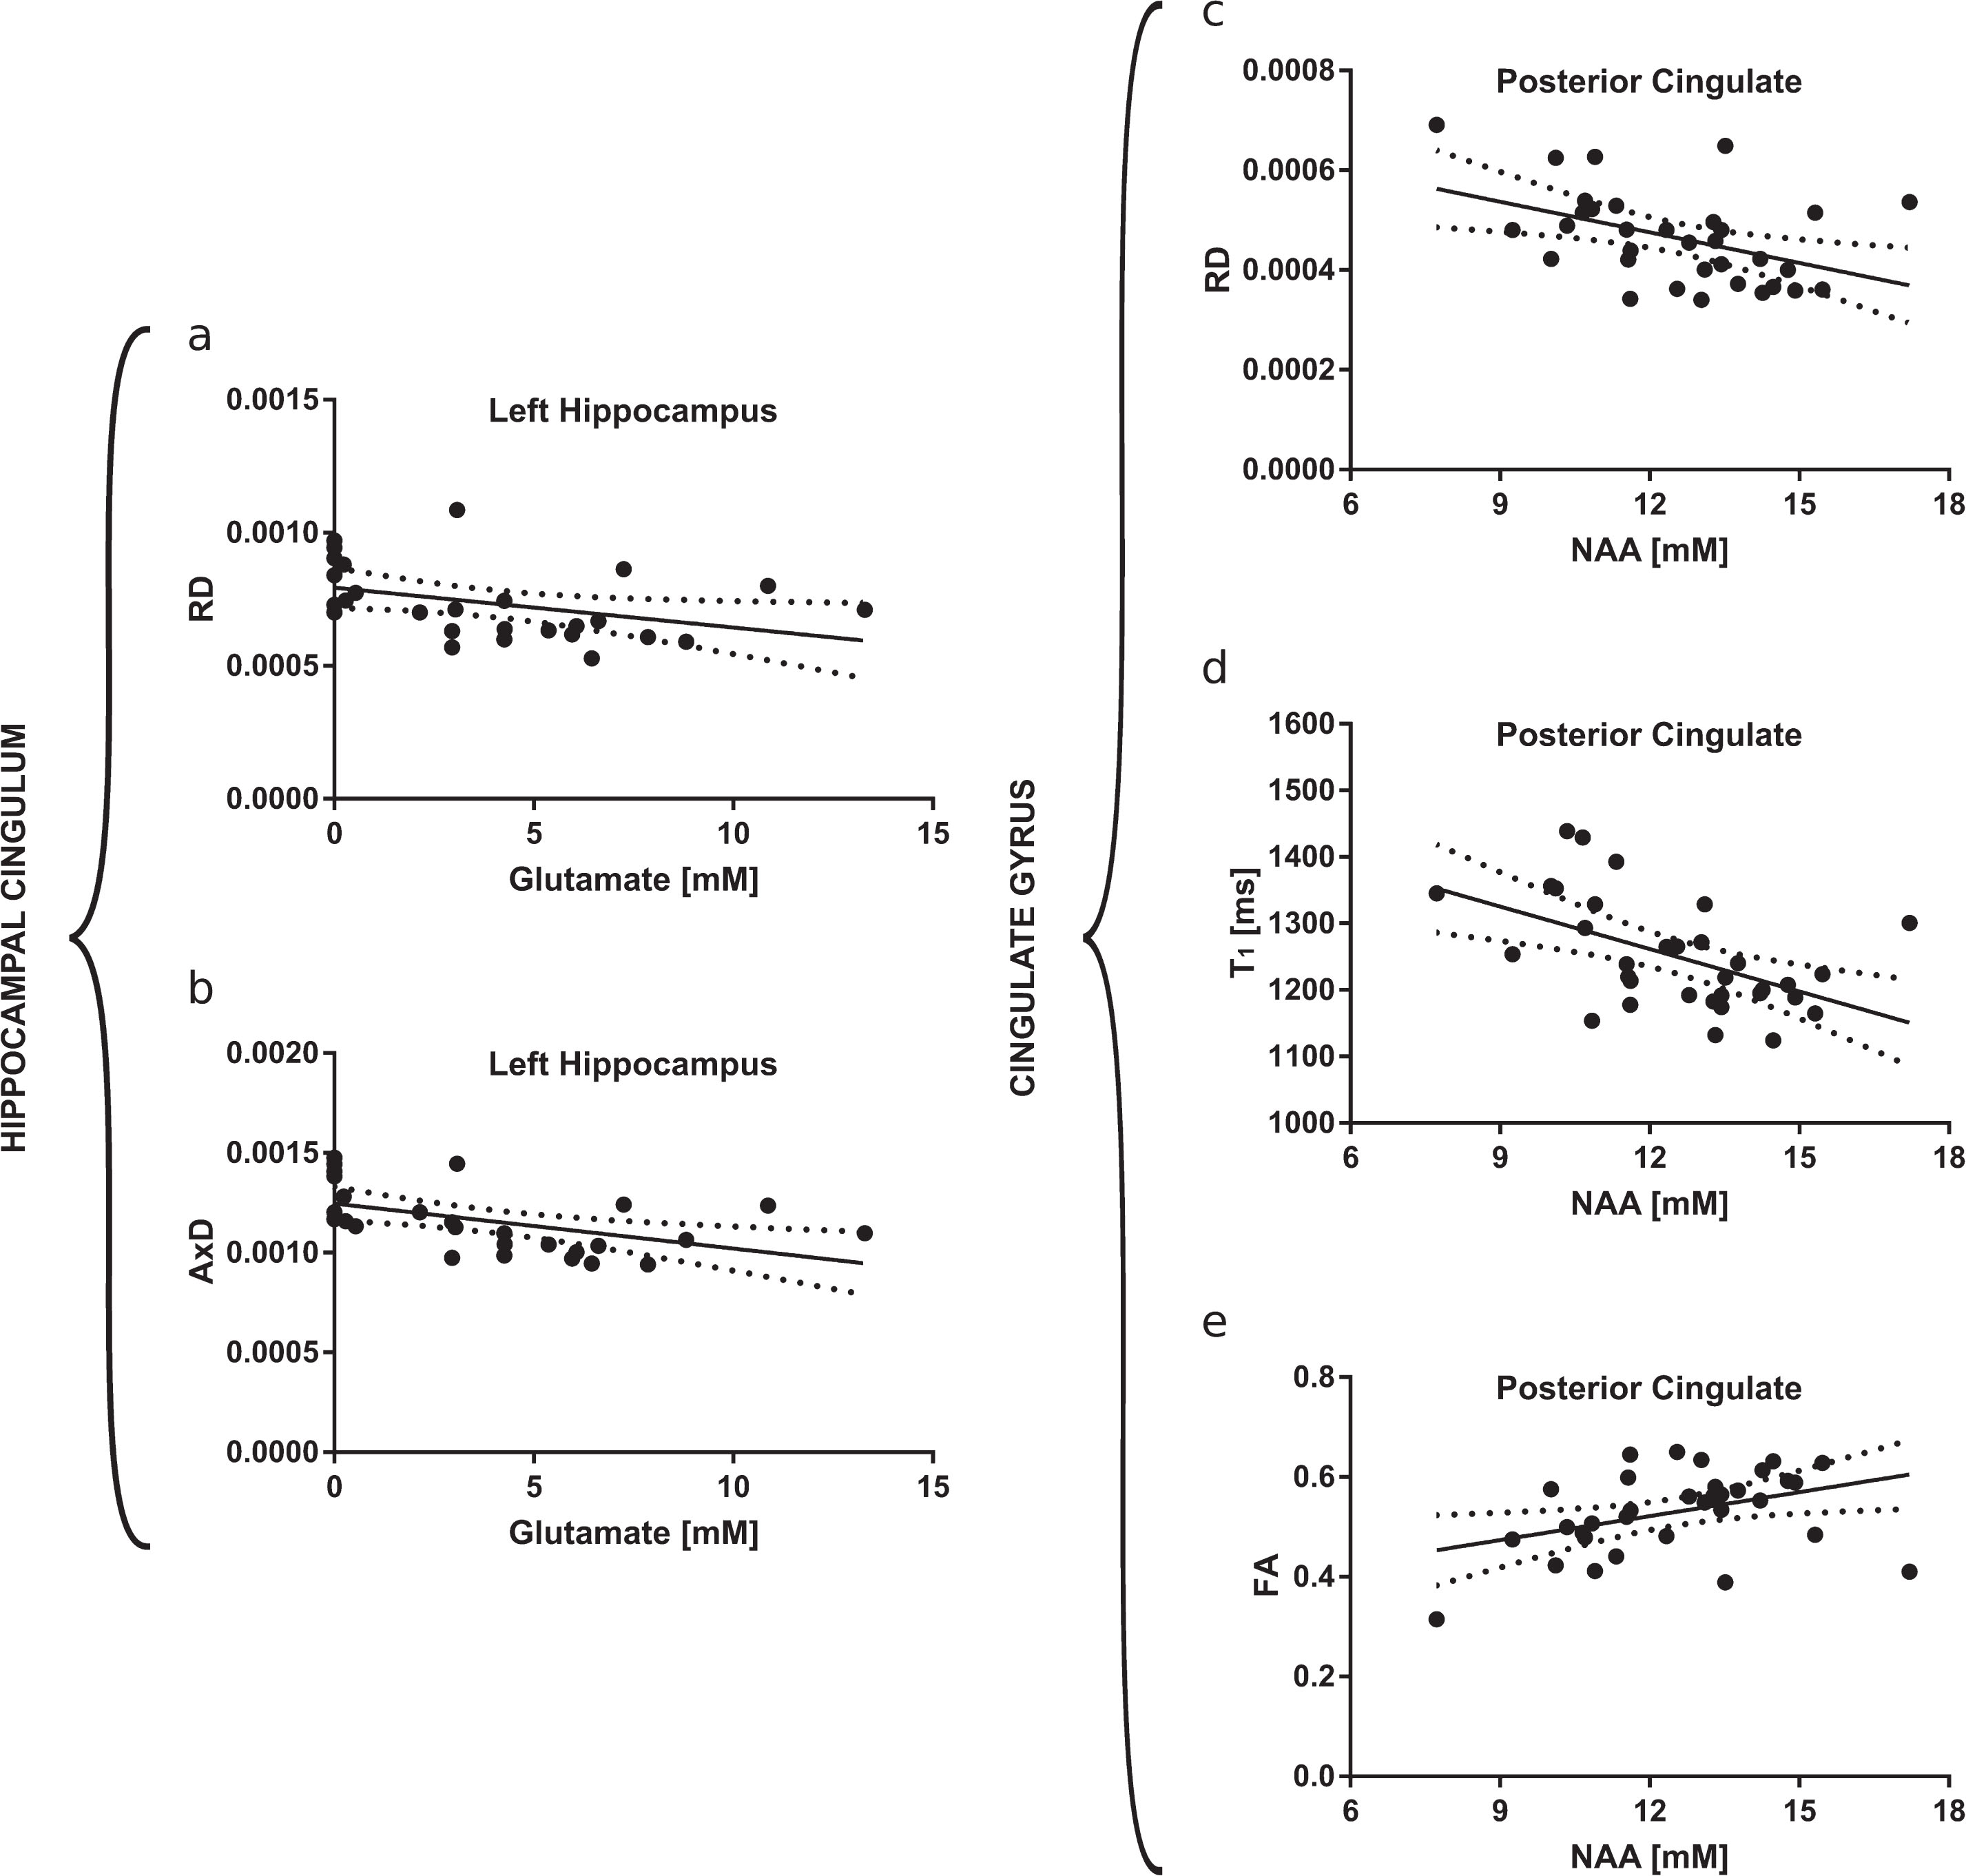
Significant correlations between the left hippocampal glutamate concentration and the average RD (r = –0.40, p < 0.05) and AxD (r = –0.51, p < 0.01) in the first 25% of the hippocampal portion of the cingulum are shown with 95% confidence bands in (a) and (b), respectively. Significant correlations between the NAA concentration in the PCC and the average RD (r = –0.42, p < 0.05), T1 (r = –0.61, p < 0.001), and the average FA (r = 0.37, p < 0.05) in the last 60–90% of the cingulate gyrus portion of the cingulum are shown with 95% confidence bands in (c), (d), and (e), respectively.
Metabolite levels in the hippocampus and PCC that were different between groups were also examined for associations with measures of episodic memory performance (Fig. 7). Left hippocampal glutamate levels were positively correlated with the delayed CSR paraphrase z-score (r = 0.40, p < 0.01, Fig. 7a), the delayed BCFC z-score (r = 0.40, p < 0.05, Fig. 7b), and the delayed CSR verbatim z-score (r = 0.39, p < 0.05, Supplementary Figure 2). NAA levels in the PCC were also positively correlated with CSR and BCFC z-scores. Specifically, NAA in the PCC was correlated with the delayed CSR paraphrase z-score (r = 0.43, p < 0.01, Fig. 7c), the delayed BCFC z-score (r = 0.46,p < 0.01, Fig. 7d), the immediate CSR verbatim z-score (r = 0.43,p < 0.01, Supplementary Fig. 3a), the immediate CSR paraphrase z-score (r = 0.47,p < 0.01, Supplementary Figure 3b), and the delayed CSR verbatim z-score (r = 0.39,p < 0.05, Supplementary Figure 3c).
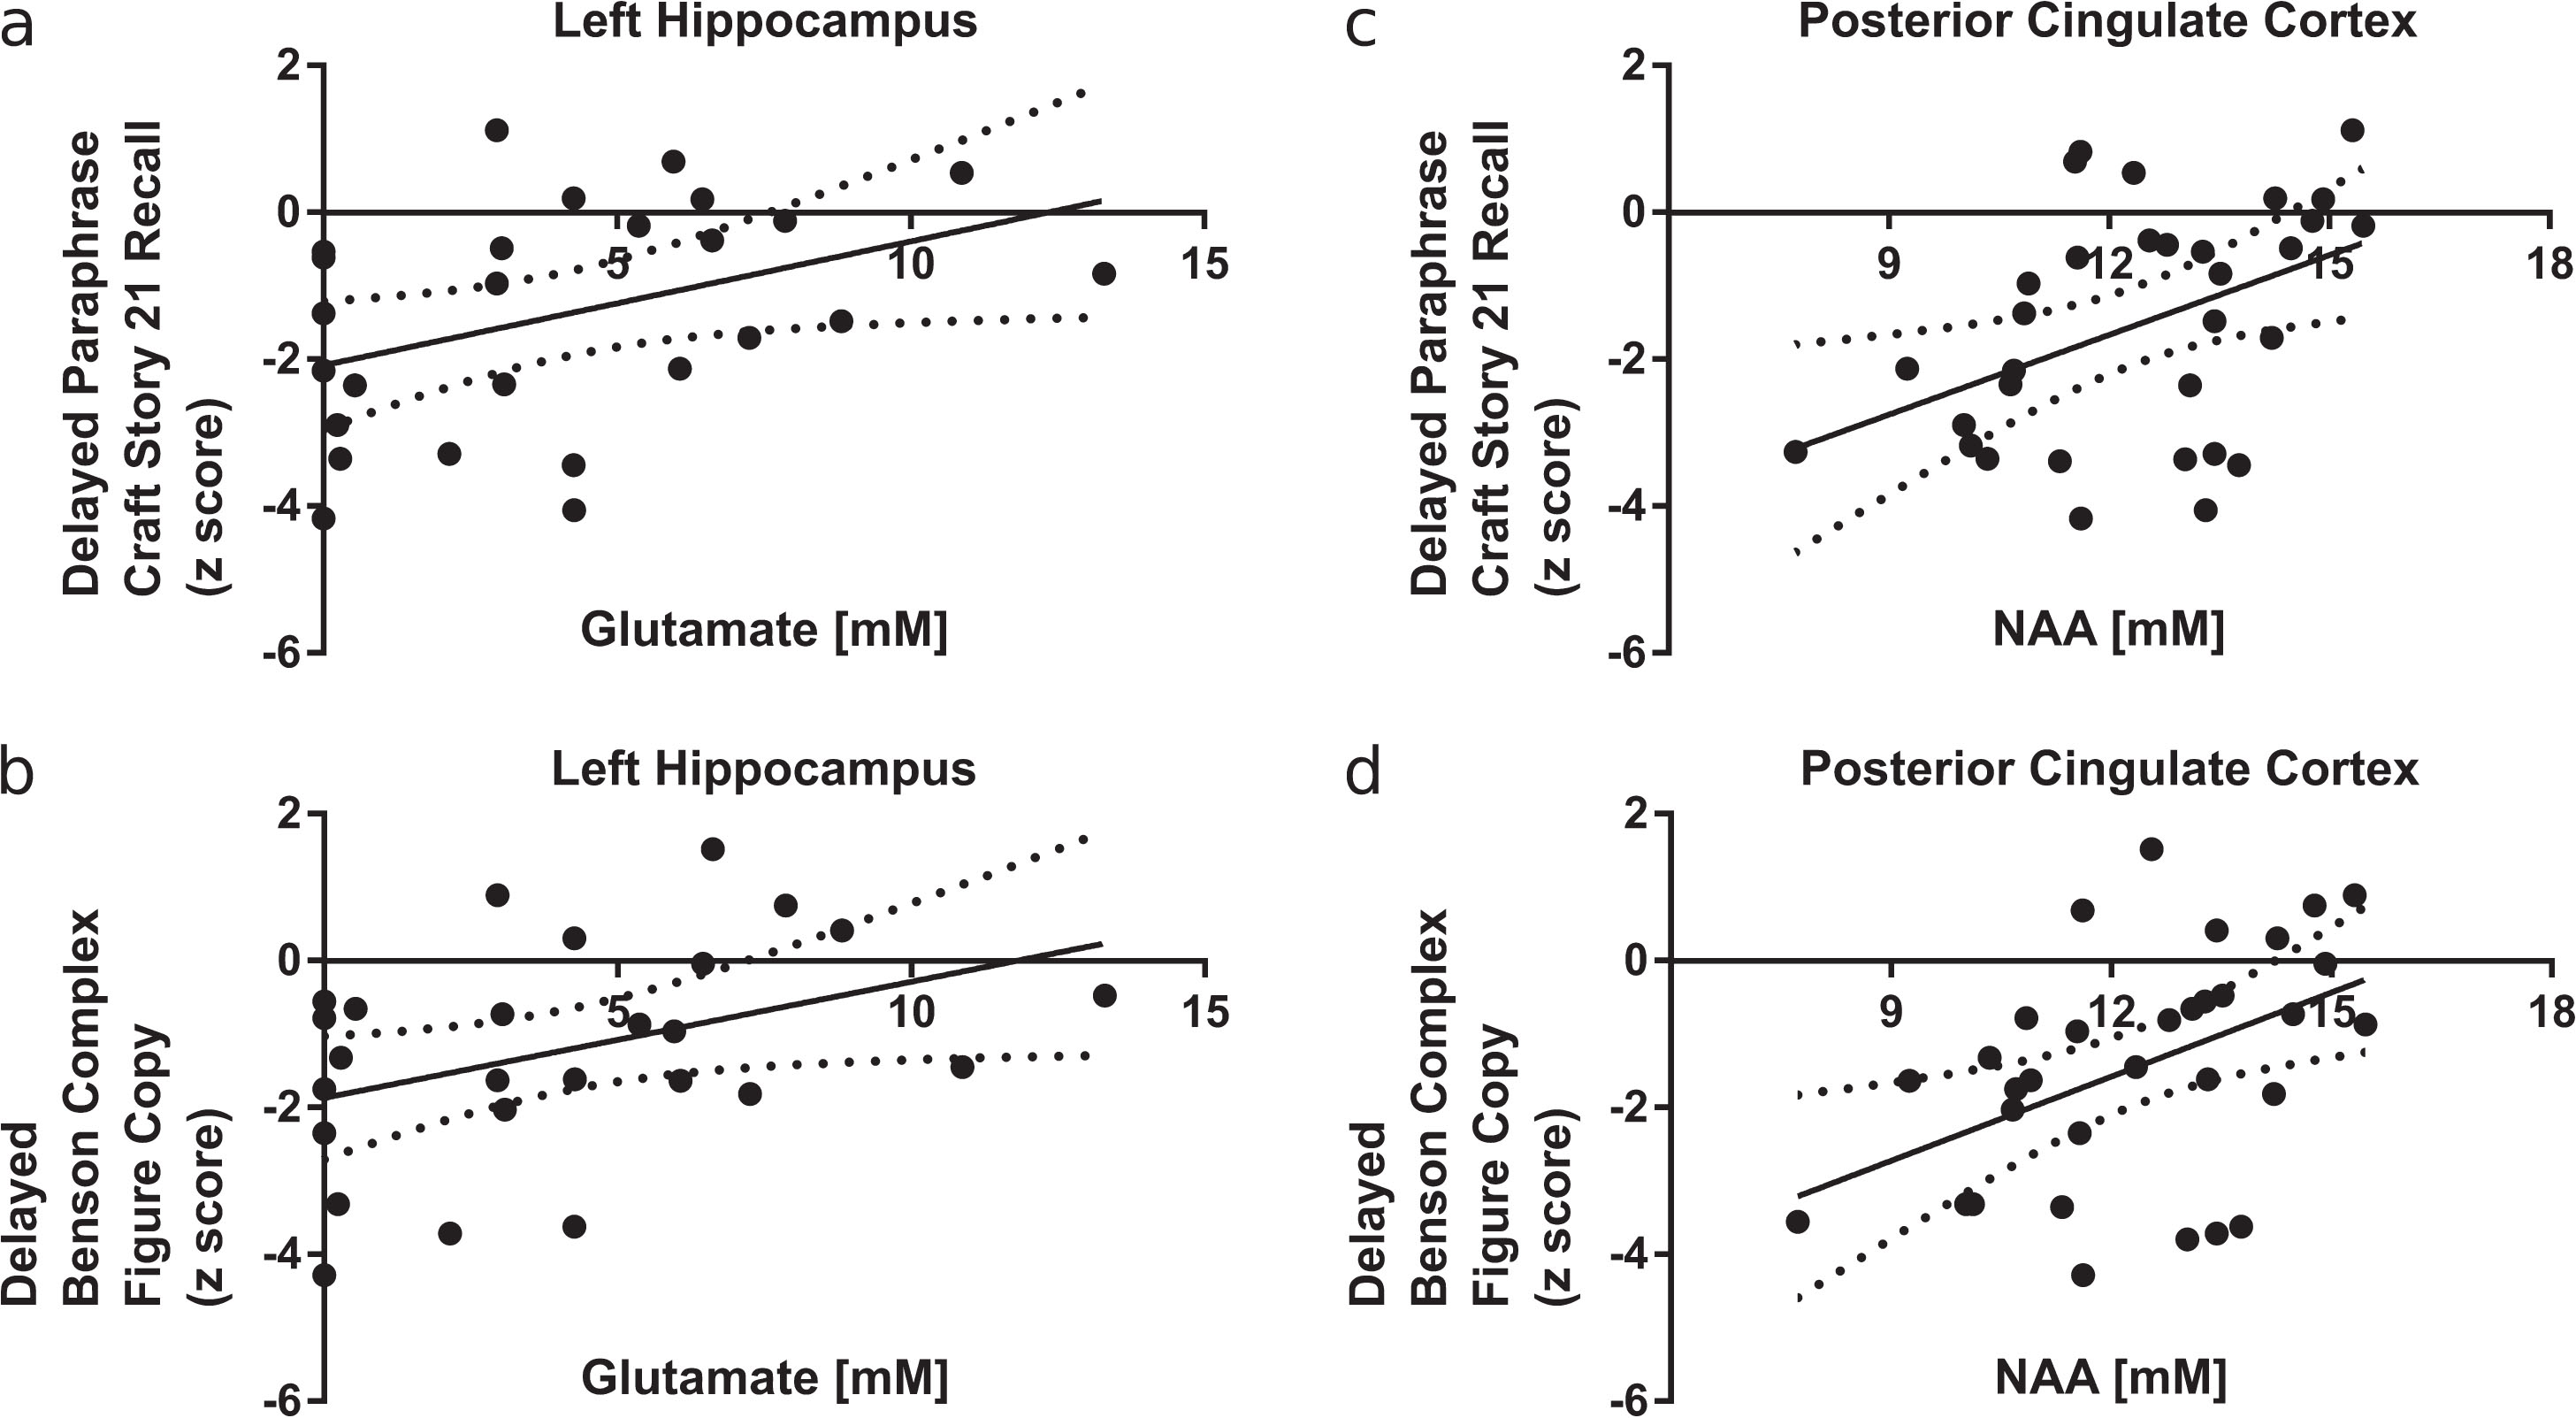
Significant correlations between left hippocampal glutamate concentration and the delayed Craft Story 21 Recall (CSR) paraphrase score (r = 0.40, p < 0.05) and the delayed Benson Complex Figure copy (BCFC) score (r = 0.39, p < 0.05) are shown with 95% confidence bands in (a) and (b), respectively. Significant correlations between posterior cingulate NAA concentration and the delayed CSR paraphrase score (r = 0.43, p < 0.05) and the delayed BCFC score (r = 0.46, p < 0.01) are shown with 95% confidence bands in (b) and (c), respectively.
DISCUSSION
Using 1H-MRS at 7T, this study measured concentrations of metabolites within the episodic memory system of people with normal cognition and of people with a clinical diagnosis of MCI and probable AD. Significant decreases in left hippocampal glutamate concentration and in posterior cingulate cortex NAA concentrations were found (Fig. 1) in the MCI and AD groups. Within the cingulum, diffusion-based indicators of white-matter microstructural integrity showed that the AD group had significant higher RD, AxD, and T1 in the first 25% of the hippocampal cingulum (Fig. 4) and significantly lower FA and higher RD in the last 60–90% of the cingulate gyrus portion of the cingulum (Fig. 5) compared to the NEC and MCI groups. Both hippocampal glutamate concentration and NAA concentration in the PCC were significantly associated with altered water diffusion and T1 relaxation within the cingulum (Fig. 6), as well as episodic memory performance measured by the CSR and BCFC neuropsychological tests (Fig. 7).
Posterior cingulate cortex
Compared to NEC subjects, both MCI and AD subjects had significantly lower NAA concentration in the PCC. This result is consistent with previous studies that have also reported lower NAA concentration in the PCC of AD and MCI subjects compared to NECs [41–43].
Since NAA synthesis in the brain requires acetyl-coenzyme A (acetyl CoA) levels that exceed neuronal metabolic requirements [85], a decrease in NAA concentration in the PCC likely indicates that energy reserves are low in this region. Indeed, studies using FDG-PET have consistently shown energy deficits in the PCC of people with AD [86–89]. This energy deficit would result in lower acetyl CoA levels and compromise NAA synthesis.
Impaired NAA synthesis could have detrimental downstream effects. NAA is synthesized in neurons, but the enzyme that catabolizes NAA into its component aspartate and acetate moieties is localized exclusively to oligodendrocytes [90–92]. The sequential action of this enzyme, aspartoacylase II (ASPA-II), along with acetyl CoA synthetase-1 (AceCS-1), will convert NAA-derived acetate into acetyl CoA, which could be used by oligodendrocytes for the synthesis of myelin-associated lipids [93]. Thus, impaired NAA synthesis could negatively affect myelin repair and remyelination processes.
MRI-derived measures of white matter microstructural integrity in the current study are consistent with this interpretation. Specifically, the last 60–90% of the cingulate gyrus portion of the cingulum, which corresponds anatomically to the posterior cingulate cortex (Fig. 2, Fig. 3c1), showed significant differences in MRI-derived measures of microstructural integrity between AD subjects and NEC subjects. AD subjects had lower FA, higher RD, but no difference in AxD. This pattern of changes in diffusion metrics is characteristic of an underlying demyelination process [94]. Further, NAA concentration in the PCC was significantly associated with this pattern of change—that is, lower NAA concentration was associated with lower FA and higher RD. These results, together with the finding that a lower NAA concentration in the PCC was significantly associated with worse CSR and BCFC scores, suggests that NAA deficit in the PCC of people with AD could indicate a demyelinating process in the region that manifests as poorer episodic memory performance.
Importantly, lower NAA concentrations were observed in both MCI and AD subjects compared to NEC subjects, whereas differences in diffusion metrics were only observed in AD subjects compared to NECs. This suggests that a decrease in the posterior cingulate NAA concentration may precede microstructural changes indicative of demyelination in the region, although a longitudinal study would be required to confirm this hypothesis.
Hippocampus
In the left hippocampus, lower glutamate levels in MCI and AD subjects were observed in the current study. Consistent with this result, a previous study by our group [39] at 4T in a different cohort also found significantly lower hippocampal glutamate concentration in AD subjects compared to NEC subjects, but no significant differences between MCI and NEC subjects. The lower glutamate levels observed in MCI subjects in the current study is likely due to the increased sensitivity of 7T MR spectroscopy or could be attributed to differences in the cohort studied. An important methodological difference to consider is that Rupsingh et al. positioned the spectroscopy voxel in the right hippocampus, while the left hippocampus was examined in the present study. Measurements in the left hippocampus may be sensitive to earlier changes exhibited at the MCI stage, as it is well-known that left hippocampal atrophy precedes right hippocampal atrophy in AD [23, 95].
The MRI-derived measures of microstructural integrity showed that compared to NEC subjects, AD subjects had significantly greater RD, AxD, and T1 in the first 25% of the left hippocampal cingulum, which corresponds anatomically to the left hippocampus (Fig. 2, Fig. 3c2). The pattern of RD and AxD changes is characteristic of increased CSF [96], which could result from overall tissue atrophy. The observed T1 differences also support this interpretation, as the T1 of CSF water is greater than the T1 of tissue bound water [72]. Thus, the reduced left hippocampal glutamate concentrations observed in AD subjects may be a result of a loss of neurons in the hippocampus, a region of the brain that is highly dependent on glutamate signaling [97, 98].
Interestingly, these microstructural changes were not observed in the MCI subjects, which suggests that the reduced glutamate concentration observed in the MCI subjects was not the result of the loss of glutamatergic neurons. Rather, it may be related to an energy deficit in the hippocampus. Reduced glucose metabolism will reduce citrate production in neurons, in turn reducing ATP production via the tricarboxylic acid (TCA) cycle. Indeed, reduced glucose metabolism in the hippocampus of individuals with MCI have been previously reported [31, 99]. To meet the energy demands of the neuron, glutamate and oxaloacetate can be used by aspartate aminotransferase (AAT) as alternative substrates for α-ketoglutarate production in a truncated TCA cycle [100]. Interestingly, excess acetate is produced in this process, which may be acetylated into NAA by L-aspartate N-acetyltransferase (Asp-NAT). Increased NAA production would facilitate the AAT reaction, by removing the product inhibition from acetate. In fact, there is evidence of an upregulated rate of NAA synthesis in AD [101]. Increased NAA production and increased glutamate consumption due to neuronal energy deficit could also explain why a significant reduction in left hippocampal glutamate concentration, but no difference in left hippocampal NAA concentration, was observed in the present study.
This result from the current study is consistent with results previously published by our group in the right hippocampus, in which no differences in right hippocampal NAA concentration were found [39]. However, others have reported NAA concentration differences in mean bilateral hippocampal NAA concentrations between AD and NEC subjects [40], as well as significant differences in left hippocampal NAA concentrations between NEC, MCI, and AD subjects [41]. Methodological differences with respect to the corrections for the relaxation rates of metabolite signal in each of the grey matter, white matter, and CSF compartments of the spectroscopy voxel could explain why lower NAA was not observed in either the current study or in Rupsingh et al.
Left hippocampal glutamate concentration was also observed to be significantly associated with better CSR and BCFC scores. This, together with the previously discussed results, suggests that lower glutamate concentration in the left hippocampus could indicate impaired neuro-energetics or a loss of glutamatergic neurons, ultimately manifesting as poorer episodic memory performance.
Study limitations
There are several limitations to the present study that should be considered. First, the generalizability of the results is limited by the small sample size. Nevertheless, significant differences in metabolite concentrations and diffusion metrics were observed, which may be due to the improved precision of both spectroscopy and diffusion tensor imaging at the high magnetic field (7T) used. In particular, the size of the group effect as measured using η2and Hays’ ω2 [102, 103] was large for both the hippocampal glutamate concentration (η2 = 0.231, ω2 = 0.162) and the posterior cingulate NAA concentration (η2 = 0.315, ω2 = 0.264), implying that the study was sufficiently powered. The results of the present study are also consistent with prior studies, providing further confidence in the results. Specifically, other studies have independently shown decreased glutamate in the hippocampus [39, 104], decreased NAA in the posterior cingulate cortex [42, 105], and microstructural changes in the limbic system [22, 107] in individuals with AD. Also, power was maximized for all correlational analyses as these were done using all study subjects with successfully acquired spectroscopy data (N = 27 for hippocampal data and N = 33 for PCC data), without consideration for group membership. Despite replicating previous work in different cohorts, the results should be considered preliminary in light of the small sample size and should be replicated in future studies. Utilizing the calculated effect sizes for NAA and glutamate, we estimate that a future study to replicate these results should include a minimum of 9 subjects per group for NAA, and 12 subjects per group for glutamate (3 groups, power = 0.8, p < 0.05, two-tailed one-way ANOVA, G*Power [108]).
Second, participants of this study with AD likely reflected a subset of the clinical population. In addition to changes in episodic memory, many individuals diagnosed with AD also present with neuropsychiatric symptoms such as apathy, anxiety, agitation, and depression which typically worsen as the disease progresses [109, 110]. However, the exclusion criteria used in the present study excluded potential participants with neuropsychiatric symptoms. All participants in the current study had GDS scores that were less than 6, indicating that none had depressive symptoms. Thus, MCI and AD participants of this study likely reflect a clinical population with mild disease that lies earlier along the AD continuum. Furthermore, the inclusion of only subjects without neuropsychiatric symptoms eliminates this variable as a cause of the metabolic and microstructural changes observed in the current study.
Third, the present study used single-voxel 1H-MRS to study metabolite concentrations in the left hippocampus and the posterior cingulate cortex. The metabolite concentration measured using single-voxel 1H-MRS is the average tissue concentration within the entire spectroscopy voxel. As a result, it is not possible to discern whether the observed differences in hippocampal glutamate concentrations arise from the metabolic pool or the neurotransmitter pool. In the PCC, it is also not possible to say whether the observed differences in the NAA concentration are localized to the neuronal compartment, the oligodendrocyte compartment, or both compartments. Another point of caution is that the method of metabolite quantification used in the present study incorporated T1 and T2 relaxation correction using values obtained from literature and assumed that metabolite T1 and T2 values in grey matter and white matter do not change with disease. This was done as it was not possible to measure subject-specific metabolite T1 and T2 values due to scan-time constraints. It also important to note here that a field strength of 7 Tesla was used in the present study. 1H-MRS at ultra-high magnetic fields (4 Tesla and above) benefits from increased signal-to-noise ratio (SNR) and greater spectral dispersion. This is especially important for glutamate detection, as there is better separation of glutamate from the overlapping resonances of glutamine and γ-aminobutyric acid (GABA). However, at clinical field strengths (3 Tesla and below), focused detection of glutamate changes may benefit from spectral editing techniques such as MEGA-sLASER or MEGA-PRESS [111–113].
Fourth, an atlas-based method of tractography was used, rather than the gold standard of guiding the tractography using manually drawn inclusion and exclusion ROIs. Although an atlas-based method does not suffer from problems such as operator experience, intra- and inter-operator reproducibility, and ROI placement feasibility [114], it is affected by the quality of the registration between the subject scan and the atlas. However, even with just a simple linear registration to the atlas, Zhang et al. has shown good agreement between manually-guided tractography and an atlas-based technique employing the same atlas as that used in the present study [115]. Despite the potential loss of precision with an atlas-based approach to tractography, we were still able to show statistically significant differences in diffusion metrics along the cingulum between groups.
CONCLUSION
This cross-sectional pilot study compared metabolite concentrations in the left hippocampus and in the PCC between small groups of people with MCI, people with AD, and NECs. NAA concentration in the PCC and glutamate concentration in the left hippocampus were significantly lower in both MCI and AD subjects and were significantly associated with both MRI-derived measures of microstructural changes in the cingulum and with episodic memory performance. The observed metabolite differences and associated microstructural differences are consistent with brain energy deficits caused by AD pathology. Thus, metabolite concentrations measured using 1H-MRS may provide valuable insight into the underlying metabolic and microstructural processes of episodic memory impairment.
Footnotes
ACKNOWLEDGMENTS
This study was funded by the Premier Research Grant from the Alzheimer Foundation of London and Middlesex, the Canada First Research Excellence Fund (CFREF), Brain Canada, and the Canadian Institutes of Health Research MD/PhD Studentship. Thanks to Charlene Bartha for assistance with subject recruitment, to Jason Kai for assistance with the tractography analyses, and to Trevor Szekeres and Joe Gati for help in acquiring the imaging and spectroscopy data.