
Abstract
Background
Alzheimer's disease (AD) is the most common neurodegenerative dementia, with diagnosis traditionally reliant on clinical criteria. Cerebrospinal fluid (CSF) biomarkers like pTau181 and Aβ42/Aβ40 ratio significantly improve diagnostic accuracy but are invasive. Plasma biomarkers measured by automated assays offer a non-invasive alternative.
Objective
To evaluate the diagnostic performance of plasma pTau181, Aβ42/Aβ40, and pTau181/Aβ42 ratios in predicting CSF amyloid status in a real-life clinical setting.
Methods
Data from consecutive patients whose plasma and CSF samples sent to our laboratory between March and October 2022, were retrospectively analyzed. Plasma and CSF pTau181, Aβ42, and Aβ40 levels were measured using the Lumipulse G600II platform. CSF amyloid status was classified as amyloid-positive (A+) or amyloid-negative (A-) based on the Aβ42/Aβ40 ratio. Statistical analyses included Spearman correlation, receiver operating characteristic (ROC) curves, and multivariate logistic regression to evaluate biomarker performance.
Results
Among 165 individuals (83 females), 29.1% were classified as A+. Significant correlations were found between plasma and CSF biomarkers, with the highest for the pTau181/Aβ42 ratio (ρ=0.620, p < 0.0001). ROC analysis showed the pTau181/Aβ42 ratio had the highest diagnostic performance (AUC 0.818), followed by pTau181 (AUC 0.794) and Aβ42/Aβ40 (AUC 0.775). Combining plasma biomarkers in age-adjusted models improved diagnostic accuracy (AUC up to 0.846).
Conclusions
Plasma biomarkers measured by the Lumipulse G600II platform show strong potential in predicting CSF amyloid status and possibly reduces the need for lumbar punctures. These findings support the potential use of plasma assays in the early diagnosis of AD. Anyway, further validations in larger multicenter cohorts are mandatory.
Introduction
Alzheimer's disease (AD) stands as the most prevalent neurodegenerative dementia, affecting millions of individuals worldwide.1,2 Although the diagnosis of AD currently relies on clinical criteria, biomarkers reflecting amyloid beta and tau pathology can significantly enhance diagnostic accuracy and reliability. 3 Among cerebrospinal fluid (CSF) biomarkers, tau phosphorylated at threonine 181 (pTau181) demonstrates high specificity for AD and correlates with the presence and severity of neurofibrillary tangles in the brain tissue.4,5 Similarly, the ratio of Aβ42 to Aβ40 peptide concentration proves highly predictive of amyloid deposition. 6 However, the invasive nature of lumbar puncture required for measuring CSF pTau181, Aβ42, and Aβ40 limits its widespread clinical use. Recent studies have highlighted the development of automated assays for detecting pTau181, Aβ42, and Aβ40 in plasma, offering a more convenient and accessible alternative to CSF biomarkers.7–13 This is becoming an essential need in view of disease modifying treatment that are expected to become available soon in clinical practice. Non-invasive and unexpensive screening tools for a biological diagnosis of AD and intervention monitoring are becoming more and more important.
This real-life single-laboratory retrospective study aims at evaluating the diagnostic performance of plasma pTau181, Aβ42/Aβ40 and pTau181/Aβ42 ratios in predicting CSF amyloid status in a consecutive, non-selected population.
Methods
Study population and laboratory procedures
We conducted a retrospective, real-life study involving all consecutive, unselected cases with cognitive dysfunction whose plasma and CSF samples were sent to our Neurobiology Lab for diagnostic purposes between March 2022 and October 2022. Our Neurobiology Lab serves as the reference center for the laboratory diagnosis of neurodegenerative and neuroinflammatory disorders in Piemonte and Valle d’Aosta (North West-Italy), receiving serum, plasma and CSF samples from the community hospitals within these regions.
Upon arrival at the laboratory, plasma and CSF samples (collected in EDTA and polypropylene tubes, respectively) were immediately centrifuged at 1800 g (10 min at 4 °C), aliquoted into polypropylene tubes, and stored at −80 °C until analysis. Plasma and CSF levels of pTau181, Aβ42, and Aβ40 as well as CSF total Tau were measured using the Lumipulse automated platform G600II and commercially available kits according to manufacturer's instructions (Fujirebio Europe, Ghent, Belgium).
For each case, we recorded demographic characteristics (age and gender), as well as plasma and CSF levels of individual biomarkers and their ratios. Within the ATN framework, 3 the CSF amyloid status of each individual was classified as amyloid-positive (A+) or amyloid-negative (A–) based on Aβ42/Aβ40 ratio values. An A + classification was assigned when the ratio was <0.068, while an A- classification was given for a ratio ≥0.068, according to established CSF biomarkers cut-off values. 14
Moreover, based the available clinical information and the CSF findings, all the patients were classified in four diagnostic subgroups: “dementia due to AD” (AD), “dementia due to other neurodegenerative diseases” (NON-AD), “neuroinflammatory diseases” (NIFD) and “other non-neurodegenerative/non-inflammatory diseases” (OTHER).
Statistical analysis
All statistical analyses were performed using the open-source statistical package “R”. 15 The significance level was set at two-tail p < 0.05. The Shapiro-Wilk test was utilized to assess the normality of distribution for each variable. Parametric continuous variables were expressed as mean ± standard deviation (SD) and analyzed using one-way ANOVA. Non-parametric continuous variables were presented as median and interquartile range (IQR) and analyzed using the Kruskal-Wallis rank-sum test. For pairwise comparison of diagnostic subgroups the post-hoc Dunn's test was employed. Categorical variables were expressed as proportions and analyzed using the Pearson's Chi-squared test. The Spearman's rank correlation coefficient (ρ) was used to explore associations between corresponding biomarker values in CSF and plasma. To establish the optimal cut-off values for plasma pTau181, Aβ42/Aβ40, and pTau181/Aβ42 in predicting the A + status, we performed an analysis of receiver operating characteristic (ROC) curves identifying the Youden's J point and calculating the area under the curve (AUC) with corresponding sensitivity and specificity values. Bootstrap resampling of 1000 samples was employed to calculate 95% confidence intervals (95%CI). Then, to evaluate the diagnostic accuracy of the combinations of single plasma biomarkers we employed multivariate binary logistic regression models dichotomizing the age covariate around its overall median value. The number of potentially avoidable lumbar punctures was estimated using cut-off values with 95% sensitivity (high-sensitivity) and 95% specificity (high-specificity) derived from ROC analysis of both individual plasma biomarkers and combined biomarkers in age-adjusted multivariate models. The percentage of avoidable lumbar punctures was calculated as the proportion of false negatives plus true negatives (for high-sensitivity cut-offs) or false positives plus true positives (for high-specificity cut-offs) relative to the total number of cases. The misclassification rate was defined as the proportion of false negatives among all negatives in the case of high-sensitivity cut-offs and as the proportion of false positives among all positives in the case of high-specificity cut-offs.
Sample size
The sample size was preliminary estimated starting from the prevalence of A + subjects from January 2019 to December 2021, obtained from our laboratory database. With an observed prevalence of 0.30 for A + cases, a two-tailed alpha error of 0.05, and a power of 0.80, the minimum number of individuals required to achieve an AUC of 0.80 in ROC analysis (assuming the null hypothesis of an AUC of 0.50) was 34, including 14 A+and 20 A- cases.
Ethical issues
The present study was approved by the competent ethical committee (Comitato Etico Interaziendale, AOU Città della Salute e della Scienza - AO Ordine Mauriziano – ASL Città di Torino; Protocol No. 0143957, December 20th, 2022) and performed according to current Italian law. The informed consent was obtained from study participants.
Results
Between March 2022 and October 2022, we conducted a retrospective analysis of 165 consecutive individuals (83 females) whose plasma and CSF samples were sent to our Neurobiology Laboratory for diagnostic purposes.
Table 1 presents demographic features (age and gender) and biomarker values for the entire study population. As all variables did not follow a normal distribution, we exclusively used non-parametric methods for subsequent analysis. Figure 1 visually illustrates the relationships between corresponding plasma and CSF biomarkers across the entire population. The highest correlation coefficient was observed for the pTau181/Aβ42 ratio (ρ = 0.620, p < 0.0001), followed by the Aβ42/Aβ40 ratio (ρ = 0.460, p < 0.0001), and pTau181 (ρ = 0.433, p < 0.0001). All the reciprocal correlations between continuous variables are detailed in Supplemental Table 1.
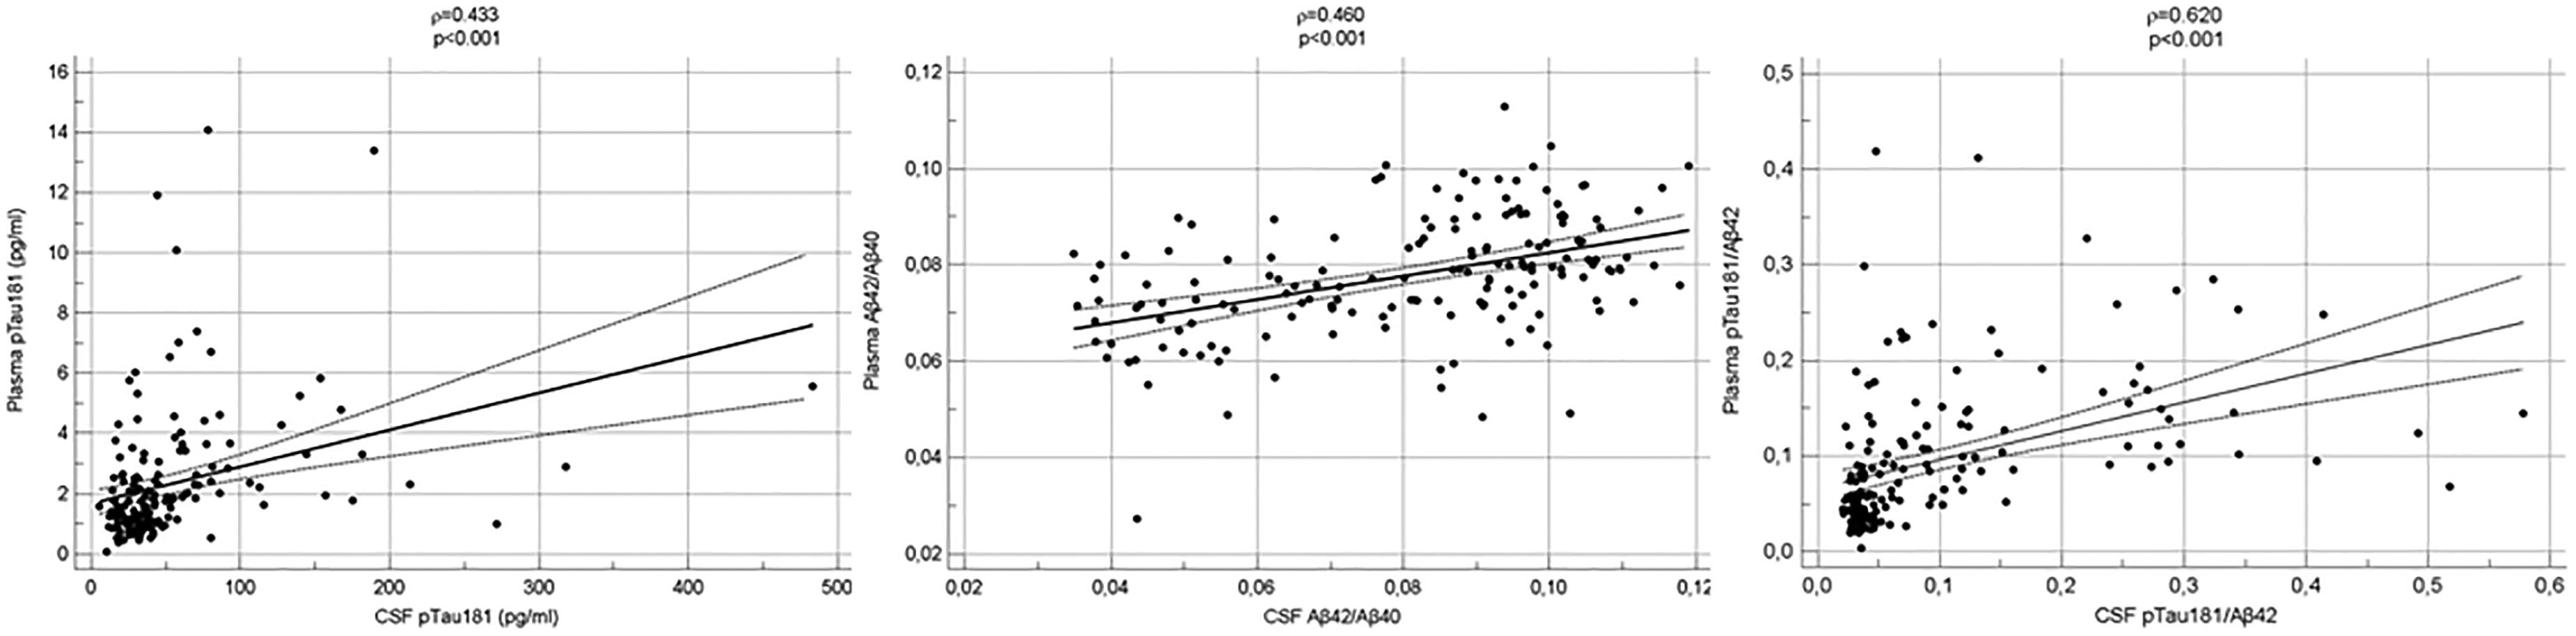
Correlations between corresponding plasma and CSF biomarkers in overall study population. Scatterplots with regression line, 95%CI, Spearman's ρ coefficient and p value are depicted.
Demographic features and biomarker values in overall study population.
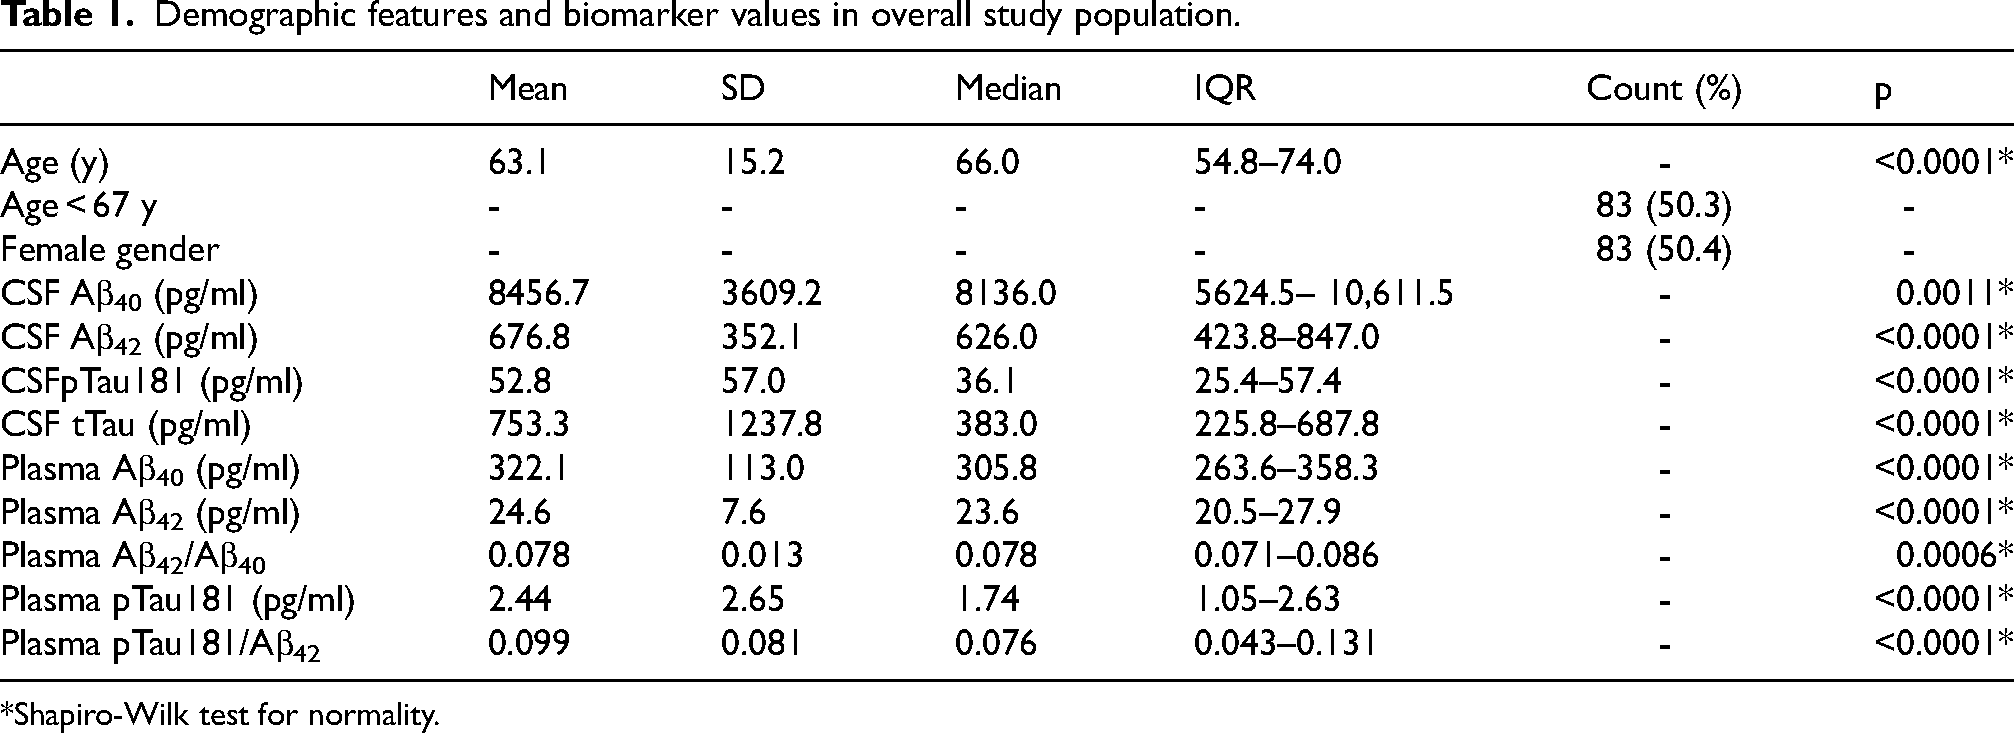
Shapiro-Wilk test for normality.
Based on the CSF profile, 48 out of 165 cases (29.1%) were classified as the A + group, while 117 out of 165 cases (70.9%) fell into the A- group. Table 2 provides detailed information on general features and biomarker findings in these two study groups. Notably, the A + cases were significantly older than the A- cases (p < 0.0001), with no significant difference in sex distribution (p = 0.864). Furthermore, the A + cases exhibited significantly higher CSF and plasma levels of pTau181 and pTau181/Aβ42 ratio, along with significantly higher levels of CSF total Tau and lower values of the plasma Aβ42/Aβ40 ratio compared to the A- group (Figure 2).
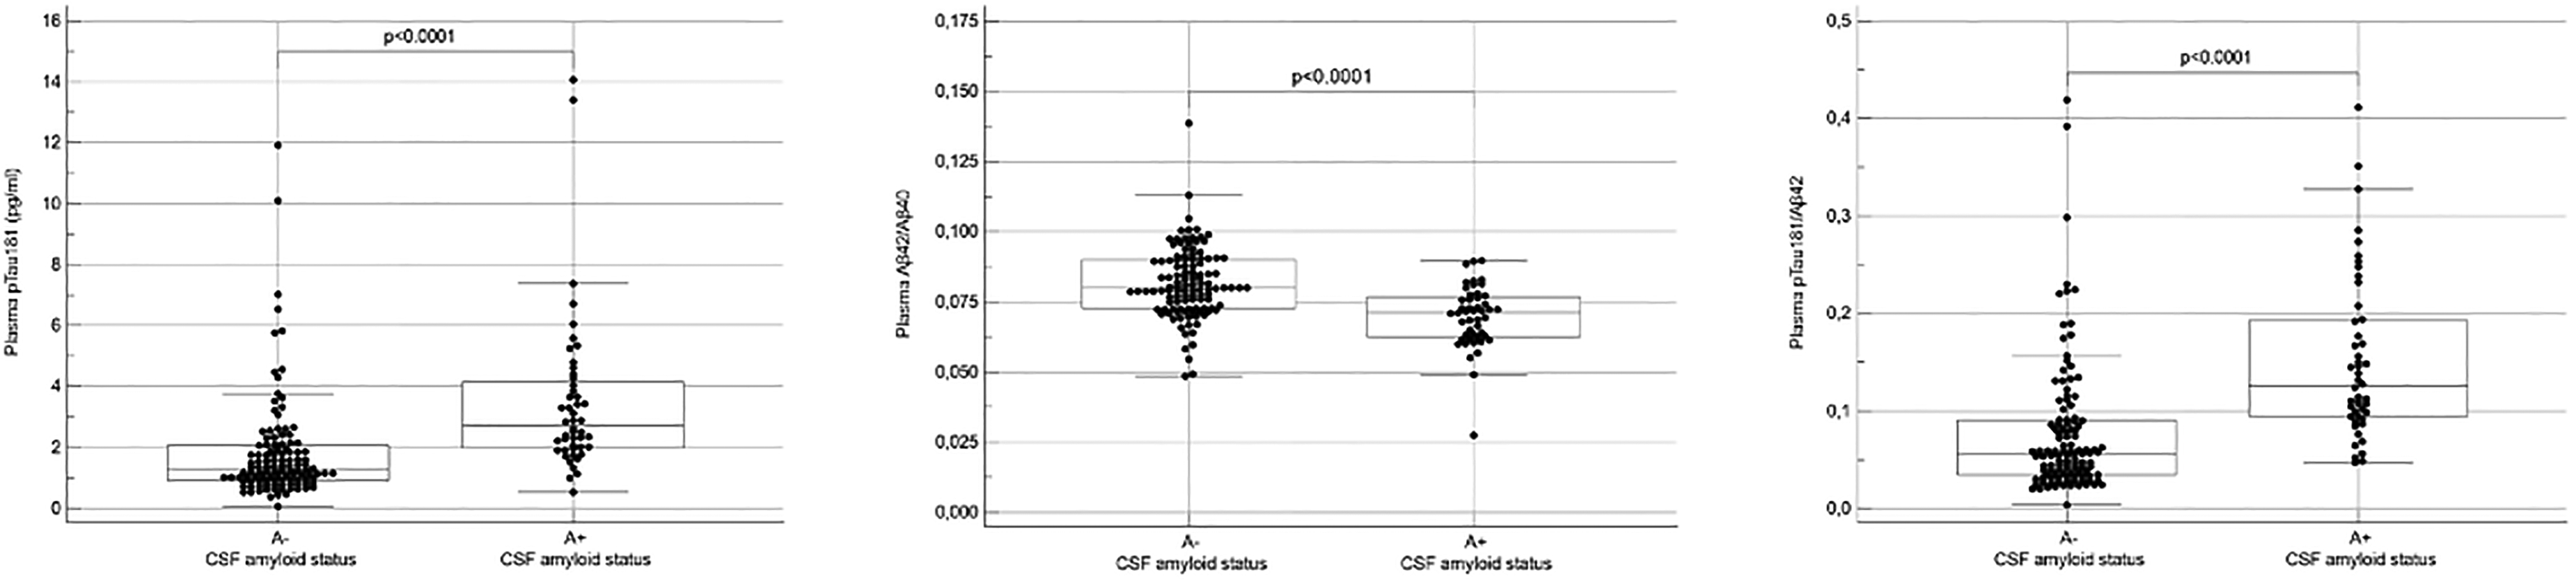
Plasma biomarker levels according to CSF amyloid status (A + and A-). Data are presented in points as individual values and the distributions values with quartiles and median are depicted as boxplots. Group comparison was performed by Kruskal-Wallis rank-sum test with a two-tail p level of <0.05.
Demographic features and biomarker values according to CSF amyloid status.
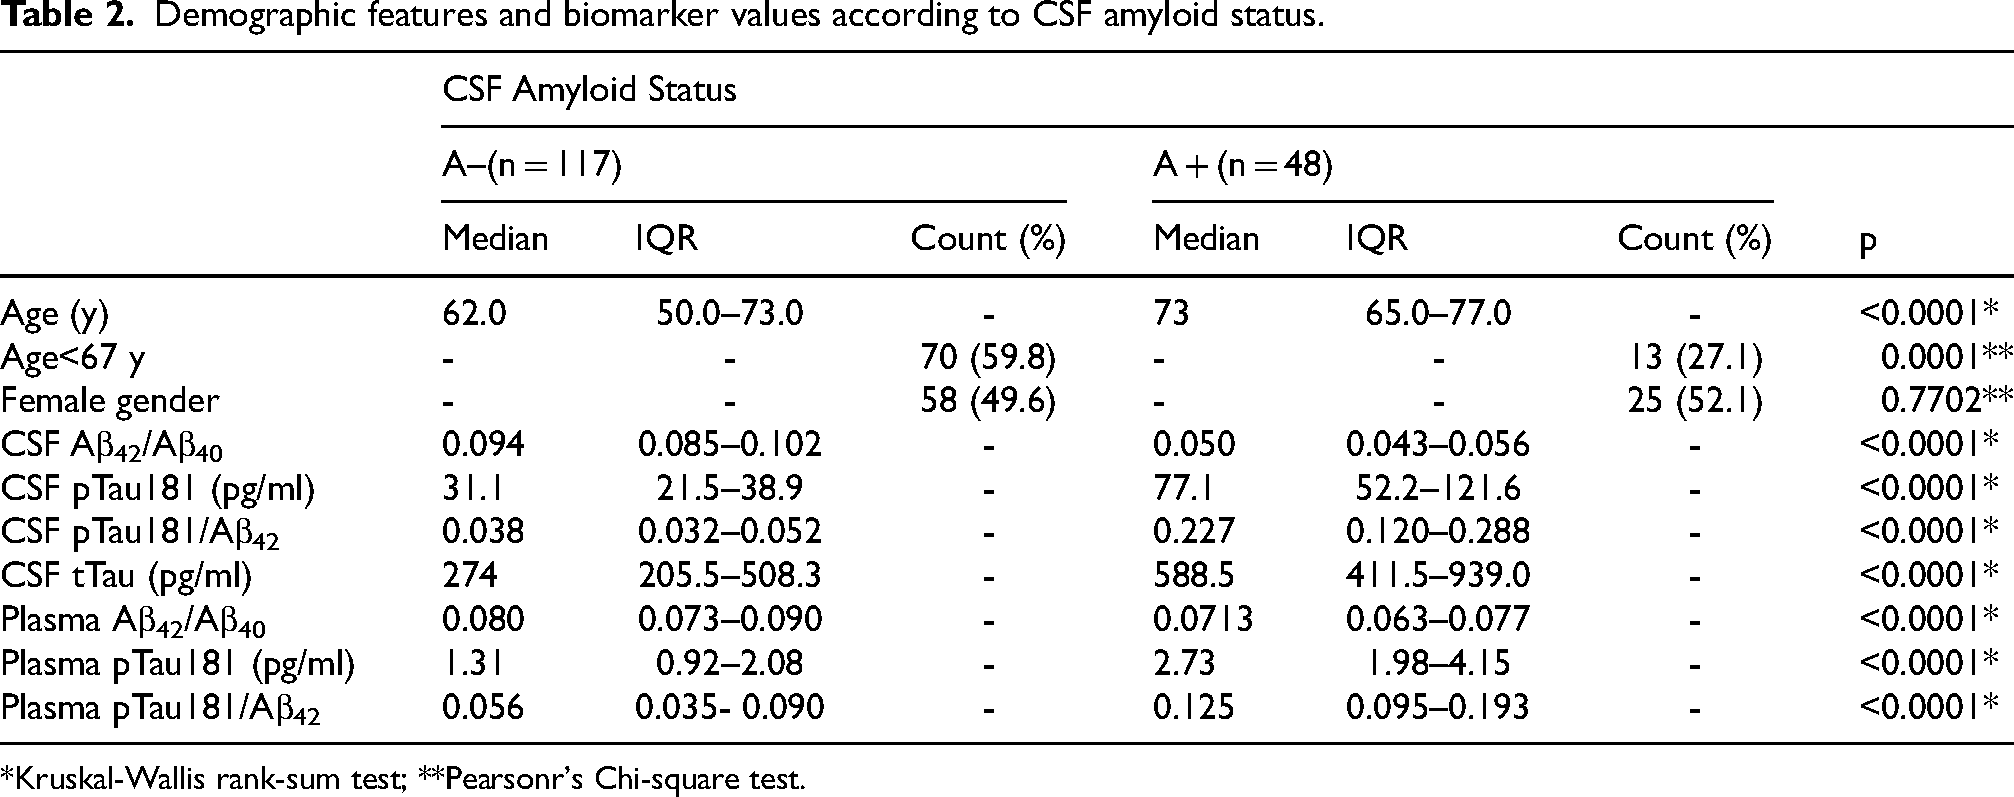
*Kruskal-Wallis rank-sum test; **Pearsonr's Chi-square test.
After stratifying by clinical and CSF diagnosis, 43 out of 165 cases (26.1%) were classified into the AD subgroup, 44 out of 165 (26.7%) into the NON-AD subgroup, 57 out of 165 (34.5%) into the NIFD subgroup, and 21 out of 165 (12.7%) into the OTHER subgroup. Table 3 presents the demographic characteristics and biomarker values for each diagnostic subgroup. Subjects in the AD and NON-AD subgroups were significantly older than those in the NIFD and OTHER ones. As expected, individuals in the AD subgroup exhibited significantly higher levels of CSF pTau181, CSF pTau181/Aβ42, and CSF total Tau, along with lower levels of CSF Aβ42/Aβ40, compared to the other subgroups. Additionally, the AD subgroup showed significantly higher levels of plasma pTau181 and pTau181/Aβ42, along with lower levels of plasma Aβ42/Aβ40, compared to the other subgroups (Figure 3).
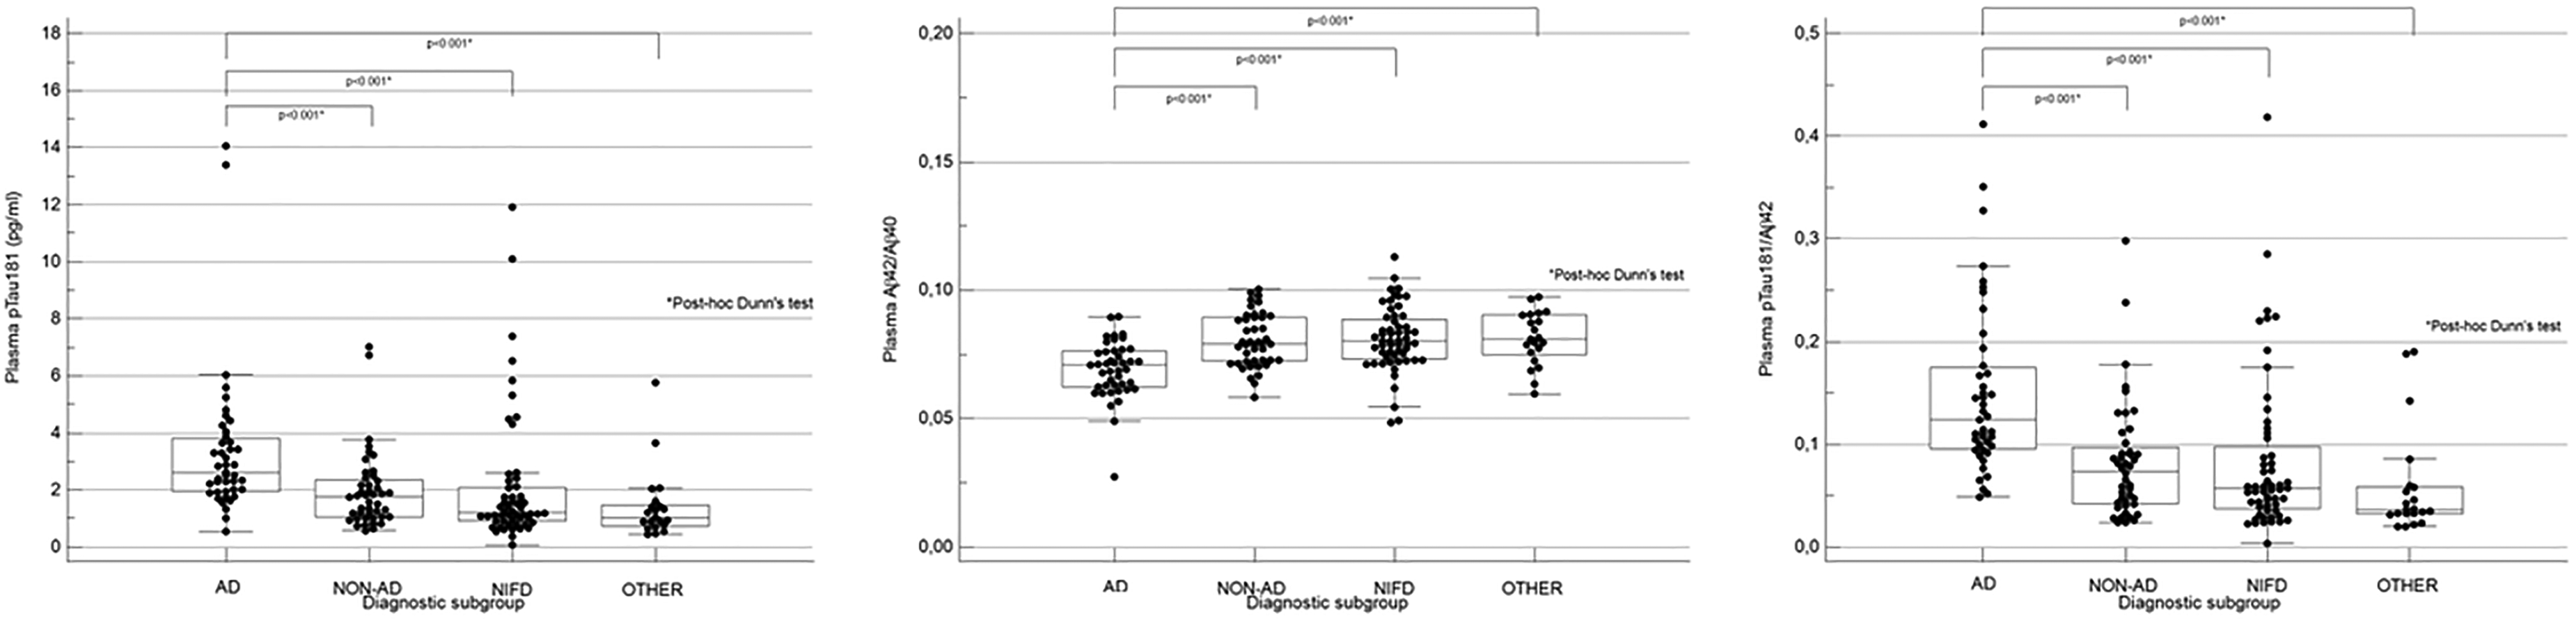
Plasma biomarker levels according to clinical and CSF stratification (AD, NON-AD, NFID, OTHER). Data are presented as individual values and the distributions with quartiles and median are depicted as boxplots. Subgroup comparison was performed by Kruskal-Wallis rank-sum test followed by post-hoc Dunn's test with a two tail p level of <0.05.
Demographic features and biomarker values after stratification by clinical and CSF findings.
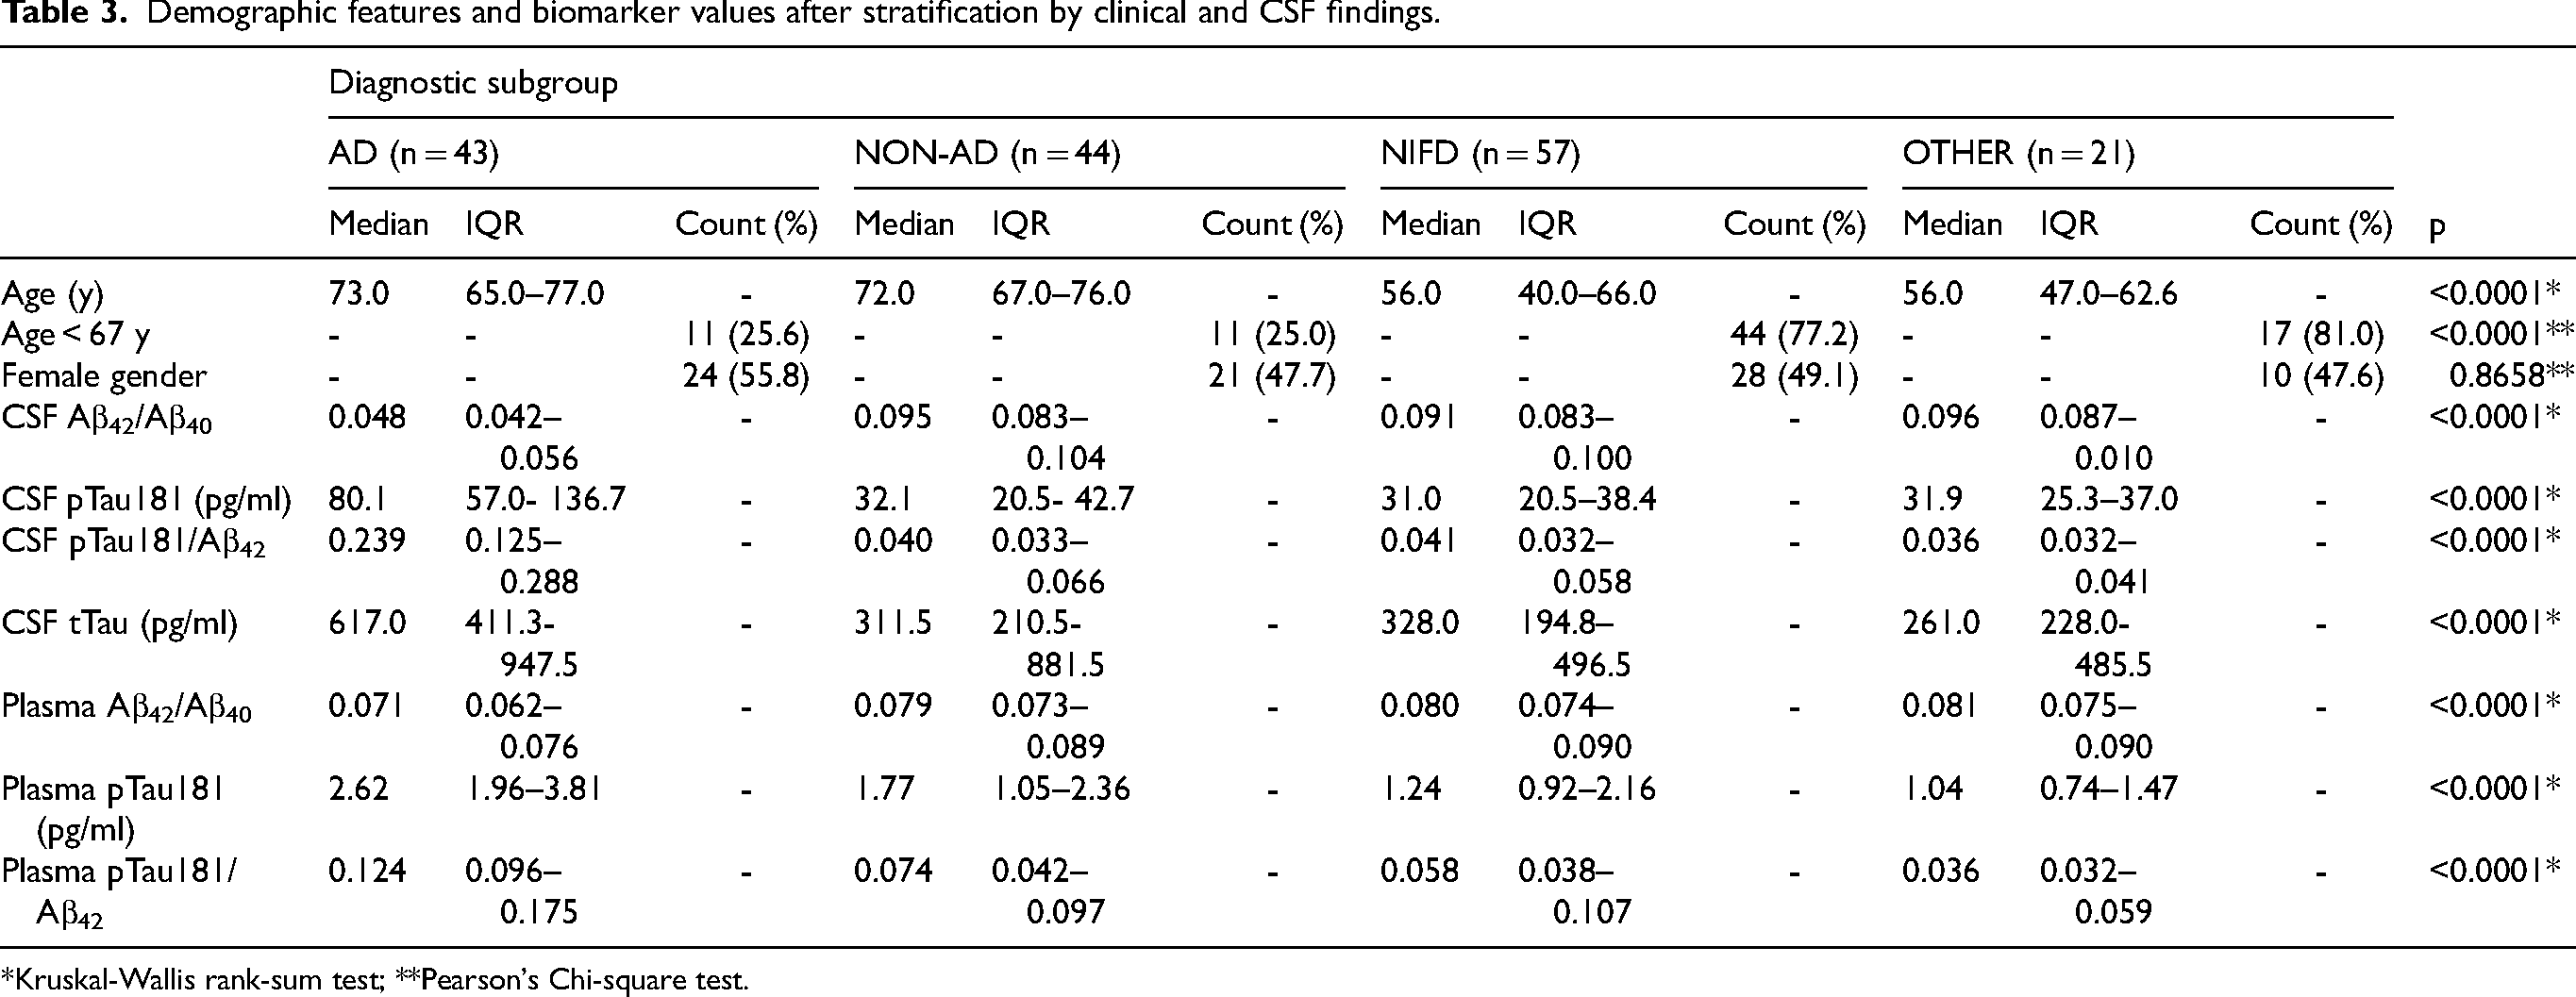
*Kruskal-Wallis rank-sum test; **Pearson's Chi-square test.
Univariate ROC curves for predicting the CSF A + status using single plasma biomarkers are illustrated in Figure 4. The highest diagnostic performance was observed for the pTau181/Aβ42 ratio (AUC 0.818; 95%CI 0.750–0.874), followed by pTau181 (AUC 0.794, 95%CI 0.724–0.853) and the Aβ42/Aβ40 ratio (AUC 0.775, 95%CI 0.704–0.836) (left panel). Pairwise comparison of ROC curves did not reveal any significant difference between the biomarkers (not shown). To explore the potential influence of age on the diagnostic performance of plasma biomarkers, the population was divided into two age groups using the median value as the cutoff. The overall accuracy of each biomarker increased when considering only cases aged <67 years (right panel). Additionally, there was a trend towards significant differences in the AUC values of individual biomarkers between age groups for pTau181 and pTau181/Aβ42 (p = 0.0583 and p = 0.0574, respectively), but not for Aβ42/Aβ40 (p = 0.2233).
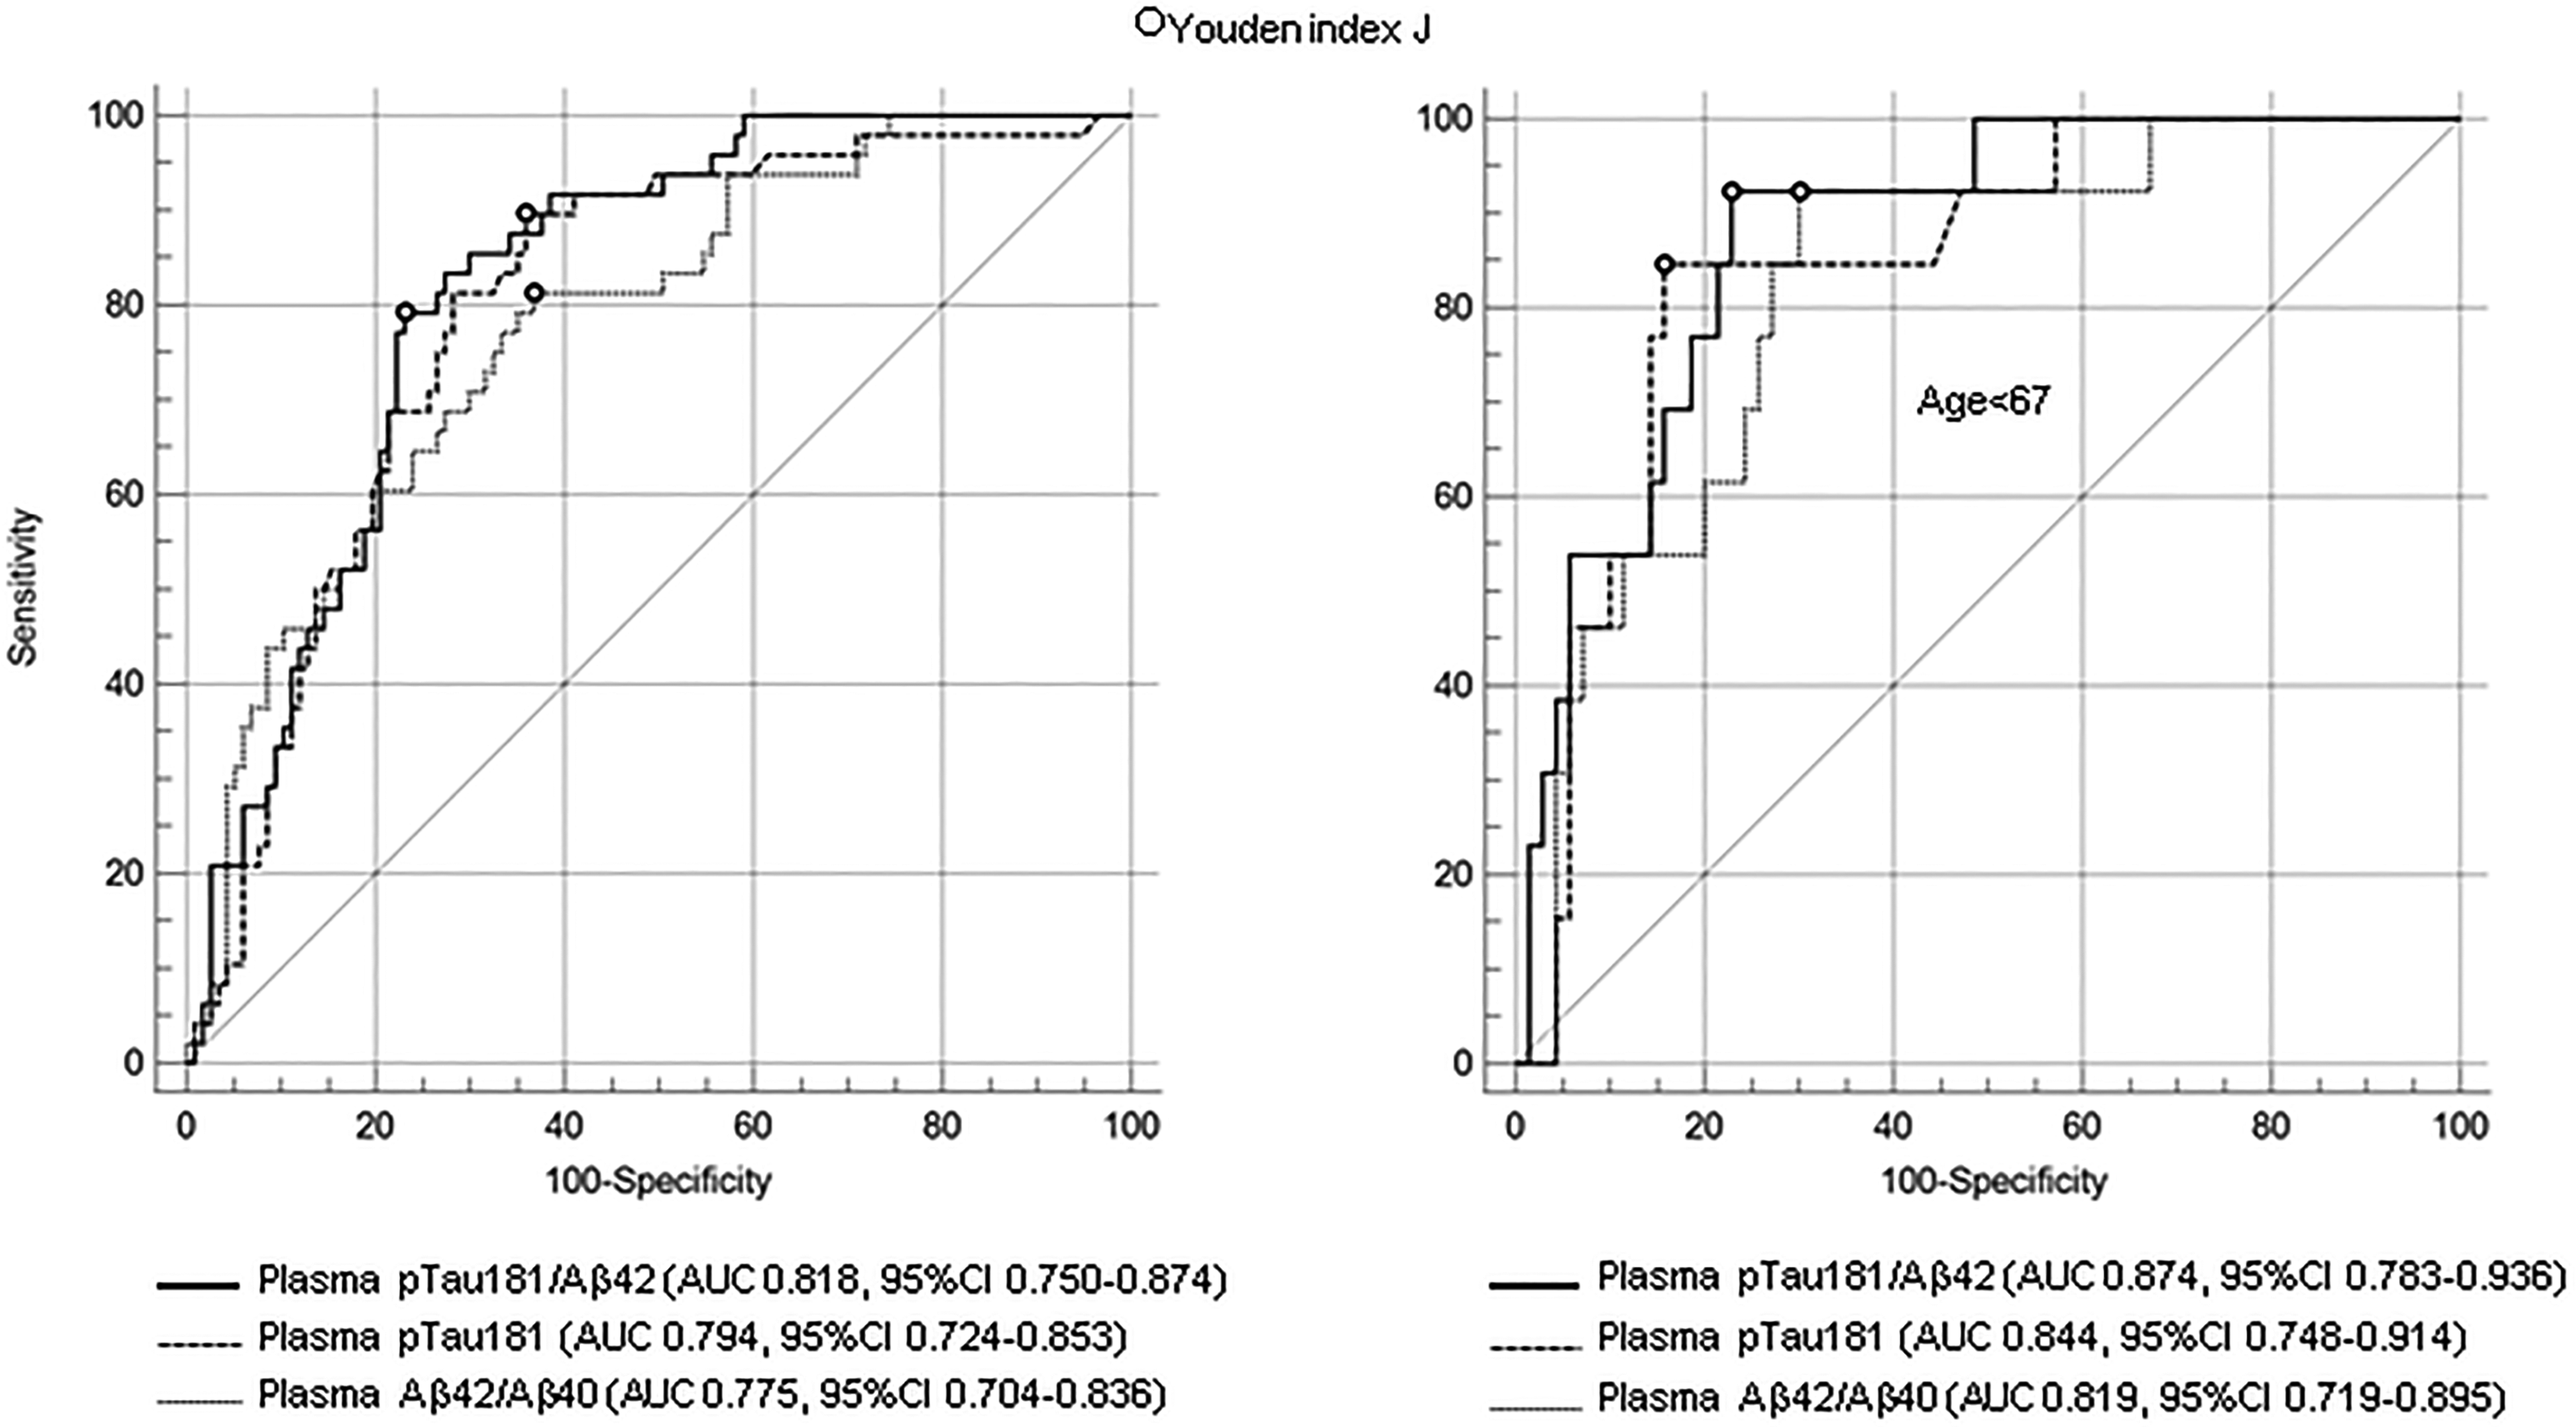
Univariate ROC analysis. Diagnostic accuracy of single plasma biomarkers for detection of A + CSF amyloid status in overall population (left) and in individuals aged <67 years (right).
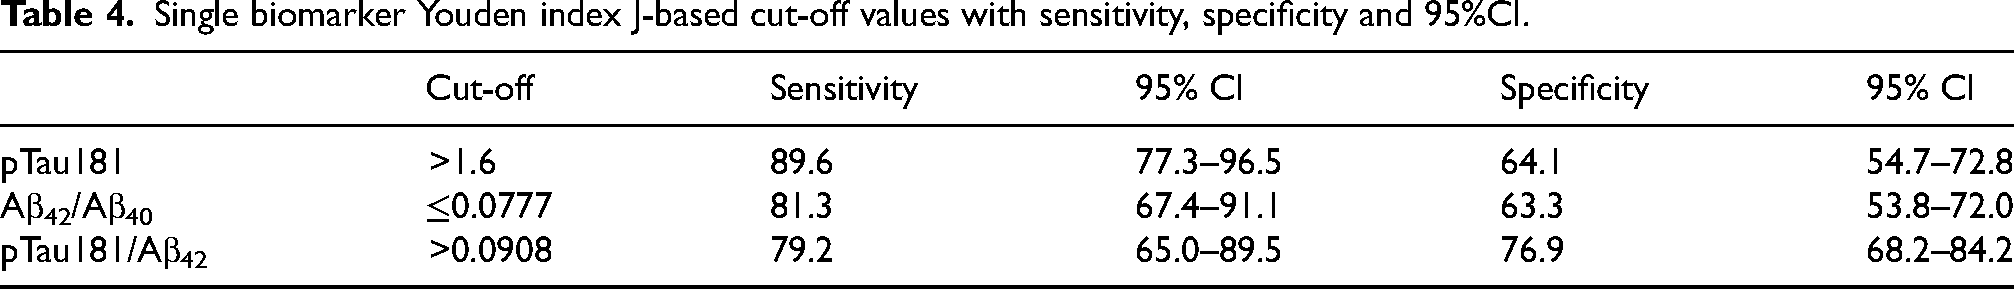
The Youden index J-based cut-off values of each plasma biomarker, along with corresponding sensitivity and specificity are reported in Table 4. The highest sensitivity was observed for pTau181 (sensitivity 89.6, 95%CI 77.3–96.5%), followed by the Aβ42/Aβ40 ratio (sensitivity 81.3, 95%CI 67.4–91.1), and the pTau181/Aβ42 ratio (sensitivity 79.2, 95%CI 65.0–89.5). Regarding specificity, the highest value was recorded for the pTau181/Aβ42 ratio (specificity 76.9, 95%CI 68.2–84.2), followed by pTau181 (specificity 64.1, 95%CI 54.7–72.8), and the Aβ42/Aβ40 ratio (specificity 63.3, 95%CI 53.8–72.0).
Single biomarker Youden index J-based cut-off values with sensitivity, specificity and 95%CI.
ROC curves of single plasma biomarkers with AUC values and 95%CI to distinguish diagnostic subgroups are reported in Supplemental Figure 1.
The combination of plasma biomarkers in age-adjusted multivariate binary logistic regression models for predicting CSF A + status resulted in superior diagnostic accuracy compared to their individual counterparts. Specifically, pTau181 plus Aβ42/Aβ40 and pTau181/Aβ42 plus Aβ42/Aβ40 combinations yielded, respectively, an AUC of 0.818 (95%CI 0.751–0.874) and of 0.846 (95%CI 0.779–0.897) (Figure 5).
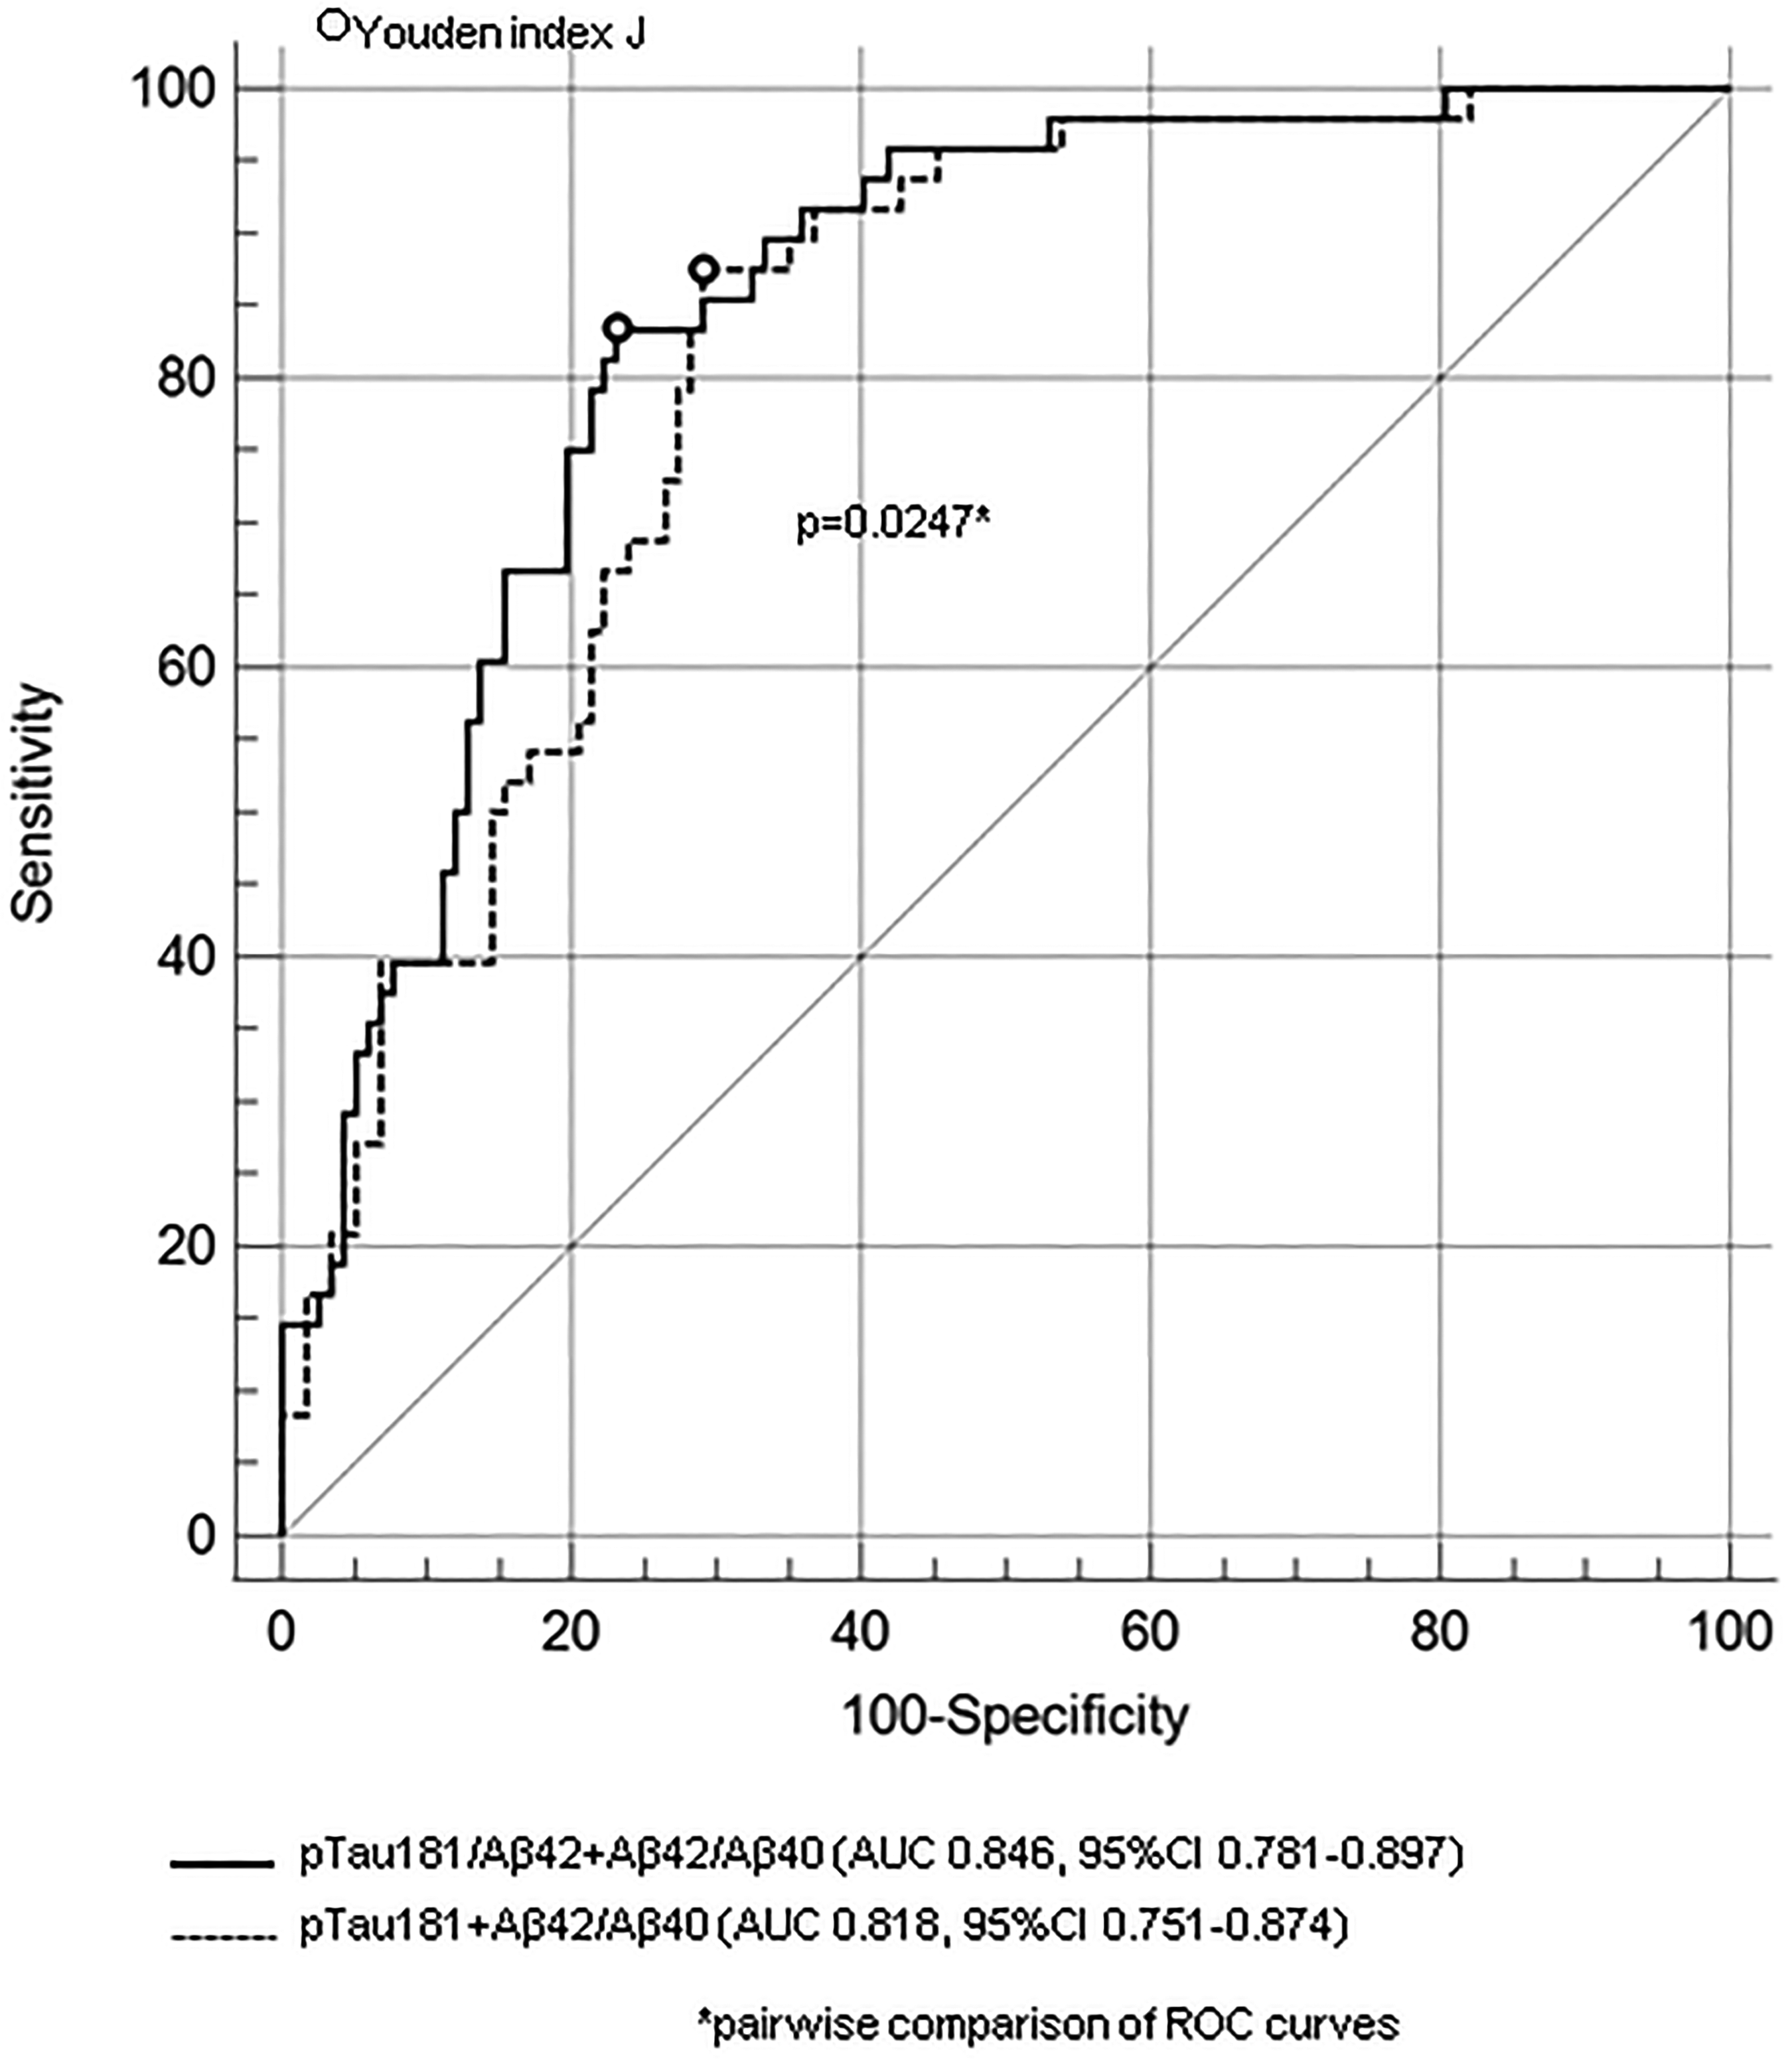
Multivariate ROC analysis. Diagnostic accuracy of age-adjusted logistic regression models combining single plasma biomarkers for detection of A + CSF amyloid status.
Supplemental Table 2 provides the 80–90–95% sensitivity and 80–90–95% sensitivity values with corresponding cut-off points for individual plasma biomarkers, as well as for age-adjusted multivariate logistic models. Figure 6 illustrates the distribution of individual plasma biomarkers in both A + and A- individuals, alongside high-sensitivity (95%) and-high specificity (95%) cut-off values. Figure 7 presents the predicted probabilities of CSF A + status derived from age-adjusted logistic models combining single biomarkers, along with the corresponding high-sensitivity and high-specificity thresholds. A visual comparison indicated that using high-specificity cut-off values to identify A + individuals without CSF analysis was considerably less effective than using high-sensitivity thresholds to identify A- individuals without the need for CSF analysis.
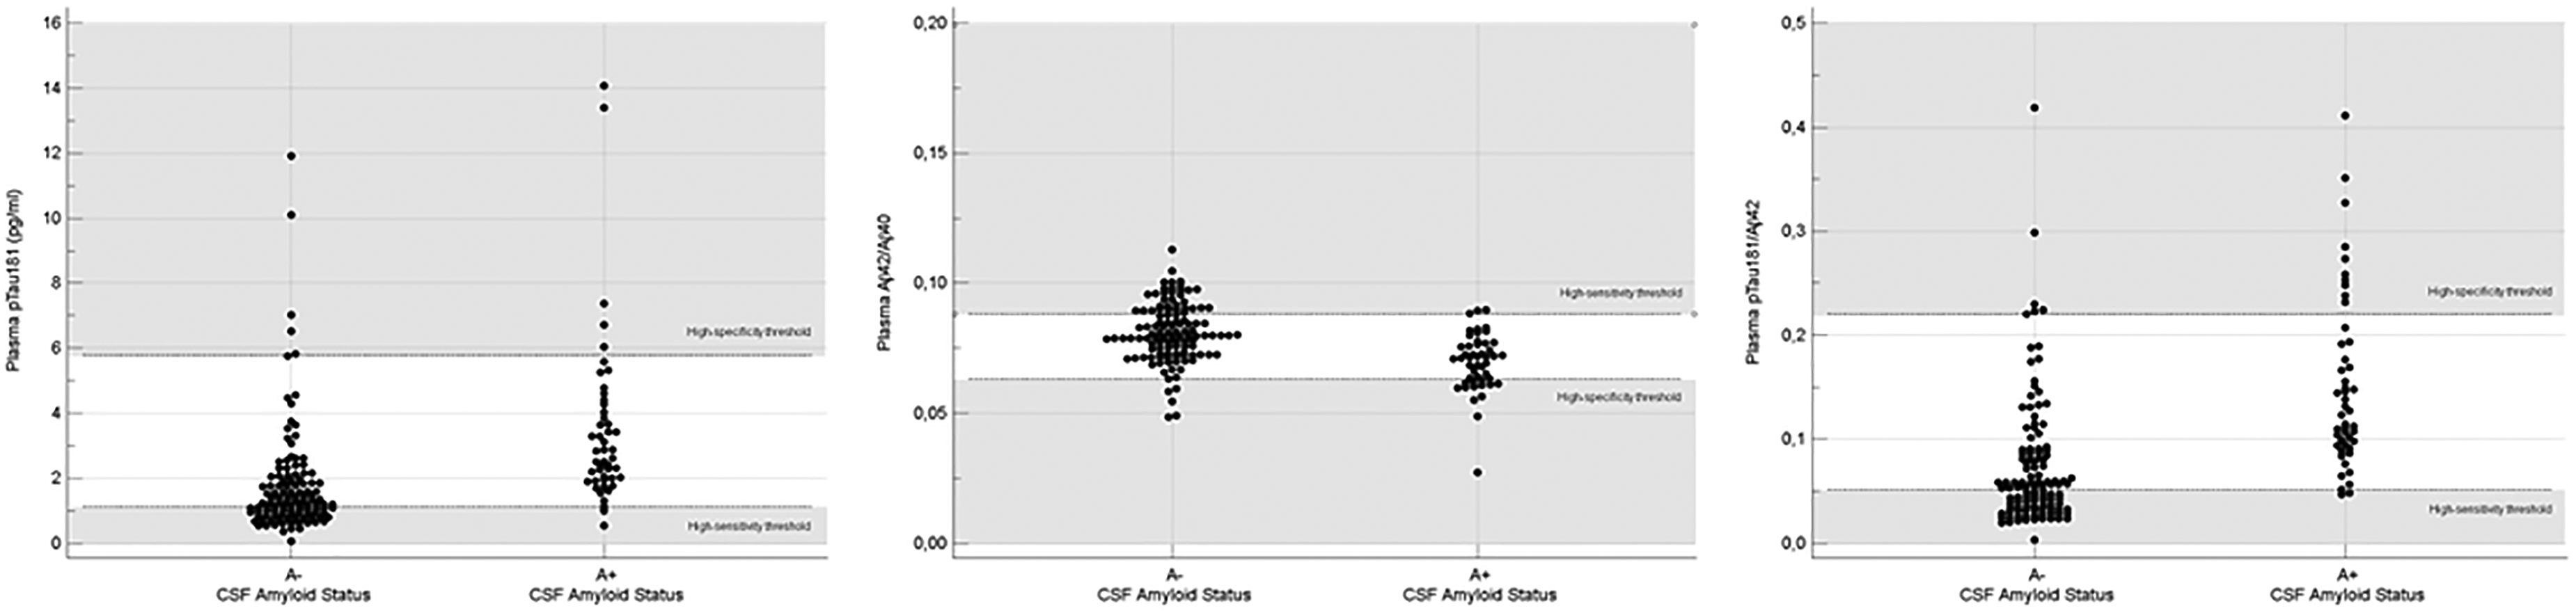
Distribution of single plasma biomarker values across A + and A groups. High-specificity (95%) and high-sensitivity (95%) thresholds are depicted as horizontal reference lines.
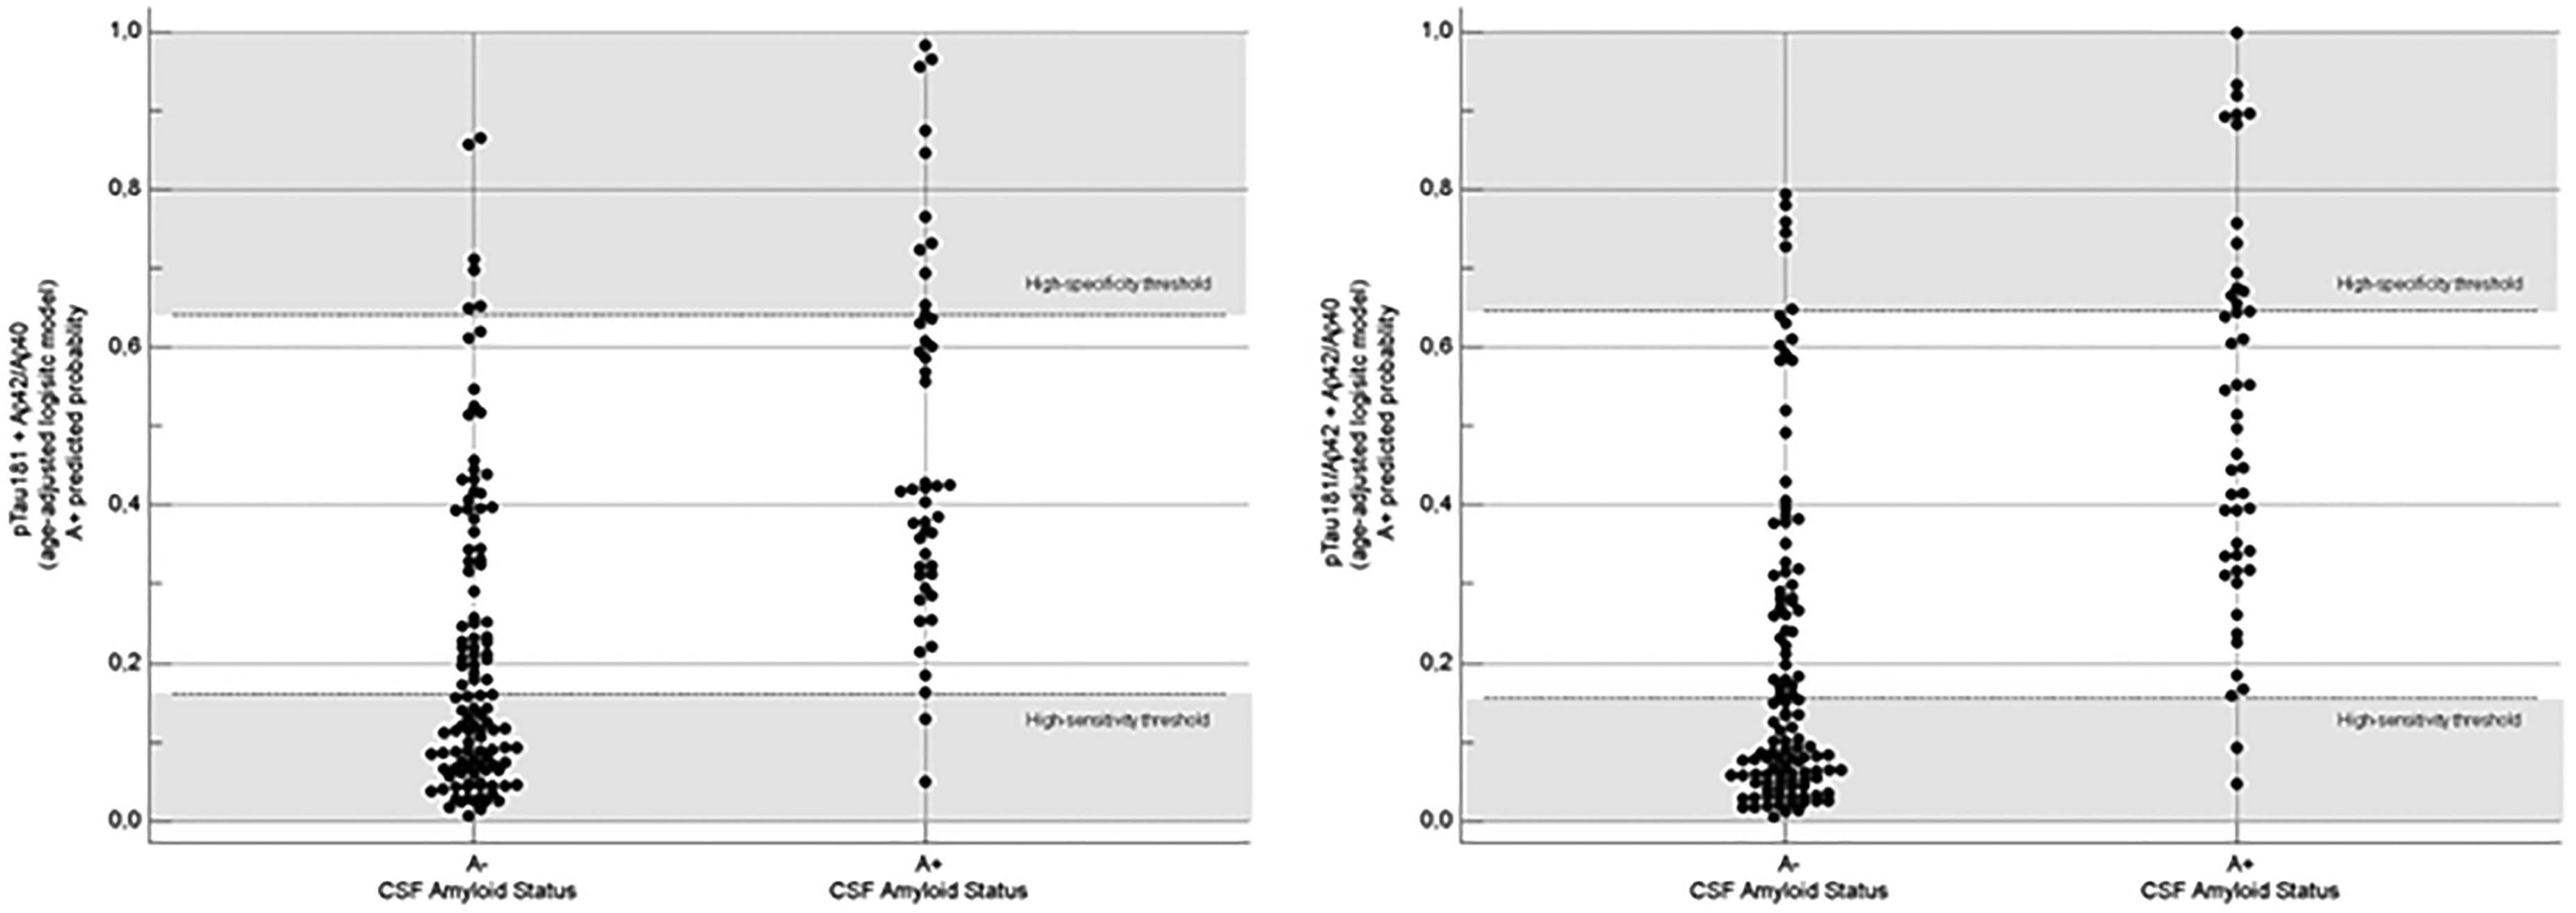
Distribution of A + predicted probabilities based on an age-adjusted logistic regression model across A + and A groups. High-specificity (95%) and high-sensitivity (95%) thresholds are depicted ad horizontal reference lines.
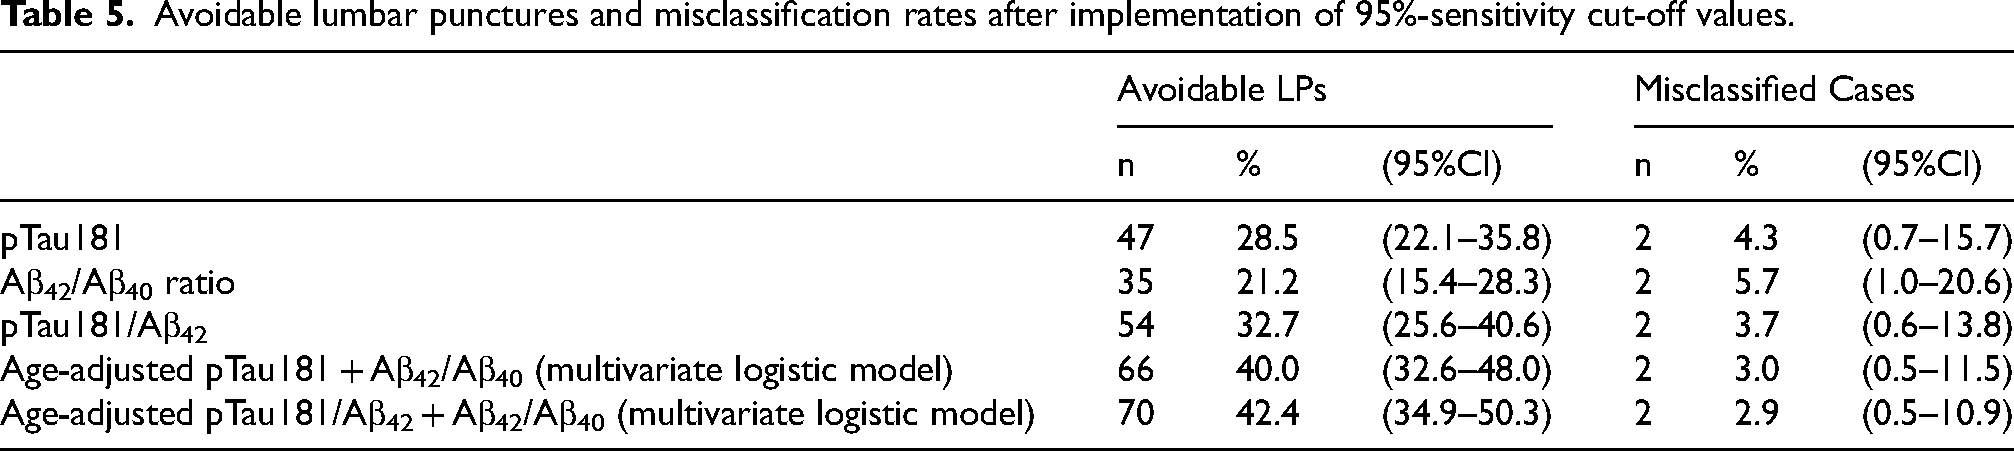
Assuming plasma biomarkers could be used as a screening test in real-world settings to identify candidates for CSF amyloid status analysis, we estimated the number of potentially avoidable lumbar punctures and misclassification rates using plasma biomarker cut-off values with 95% sensitivity. Notably, in our study population, a significant proportion of lumbar punctures could have been avoided if plasma biomarkers had been hypothetically used as rule-out tools in clinical practice (Table 5). Regarding individual plasma biomarkers, the highest number of avoidable lumbar punctures could be achieved by implementing the pTau181/Aβ42 ratio (54 out of 165 procedures; misclassification rate: 3.7%), followed by pTau181 alone (47 out of 165; misclassification rate: 4.3%), and the Aβ42/Aβ40 ratio (35 out of 165; misclassification rate: 5.7%). Age-adjusted multivariate logistic models performed better than individual biomarkers. Specifically, combining pTau181/Aβ42 with the Aβ42/Aβ40 ratio, as well as combining pTau181 with the Aβ42/Aβ40 ratio, could potentially avoid 70 out of 165 procedures (misclassification rate: 2.9%) and 66 out of 165 procedures (misclassification rate: 3.0%), respectively.
Avoidable lumbar punctures and misclassification rates after implementation of 95%-sensitivity cut-off values.
Discussion
The findings of our study contribute valuable insights into the potential of plasma biomarkers for predicting CSF amyloid status and aiding in the diagnosis of AD. By evaluating the diagnostic performance of the fully automated Lumipulse G600II platform in the determination of plasma pTau181, Aβ42, and Aβ40 levels in a real-life setting, we provide evidence supporting the feasibility of using plasma biomarkers as non-invasive alternatives to CSF examination.
Our results highlight the robust correlation between plasma and CSF biomarkers, emphasizing the potential of plasma assays to reflect underlying AD pathology. This aligns with previous research demonstrating significant associations between plasma and CSF levels of tau and amyloid biomarkers. The strong correlation between plasma pTau181 and CSF pTau181 suggests that plasma biomarkers may serve as reliable proxies for CSF measurements. 6 Similarly, the high concordance found between plasma and CSF Aβ42 levels supports the utility of plasma Aβ42 as a marker of amyloid pathology. 3 Besides, the good diagnostic accuracy of plasma biomarkers in predicting amyloid PET imaging status was confirmed in recent papers, so further validating the potential of plasma biomarkers as surrogate measures for amyloid deposition.16,17 This is a remarkable point not only for the diagnosis of AD, but also for the monitoring of patients eligible for future anti-amyloid treatments.
In our study, age emerged as a significant factor influencing the diagnostic accuracy of plasma biomarkers, consistent with previous research highlighting age-related variations in biomarker performance. In fact, an inverse correlation between age and plasma Aβ42/Aβ40 values have been described in both normal and cognitively impaired subjects, thus emphasizing the importance of age stratification in predictive models of in vivo amyloid status.18–20 Moreover, age-related differences have also been reported for plasma pTau181 levels, underscoring the need for age-specific reference ranges to optimize diagnostic algorithms. 21
The main findings of the present study are consistent with other recent studies that also employed the Lumipulse platform for measuring AD plasma biomarker levels.
Martínez-Dubarbie et al. described the good diagnostic performance of plasma biomarkers (Aβ42, pTau181, Aβ42/Aβ40 and pTau181/Aβ42 ratios) in detecting AD pathology in cognitively unimpaired subjects. 9 Bellomo et al. described the high diagnostic accuracy of Lumipulse plasma pTau181 and Aβ42/Aβ40 assays in distinguishing AD from other neurodegenerative disorders in two independent cohorts, providing cross-validated cutoff values and probability-based models, thereby supporting the utility of these biomarkers in clinical practice. 10 Arranz et al. demonstrated the high diagnostic accuracy of pTau217, pTau181 and Aβ42/Aβ40 in predicting CSF amyloid status in a consecutive real-life memory-clinic population. 12 Giuffrè et al. showed that plasma biomarkers (Aβ42, pTau181, Aβ42/Aβ40, and pTau181/Aβ42 ratios) may be also useful in distinguishing the CSF amyloid status in subjects with amnestic mild cognitive impairment. 13
In light of the potential implementation of plasma biomarkers in clinical practice, several authors have recently proposed a dual cut-off approach that utilizes both high-sensitivity and high-specificity thresholds. This method aims to identify individuals with either a lower or higher likelihood of amyloid pathology, thereby reducing the need for unnecessary invasive procedures, minimizing patient discomfort, and lowering healthcare costs.12,22–24
In our study, we found that adopting a high-sensitivity approach to avoid lumbar punctures in patients with a low risk of CSF amyloid positivity (CSF A+) was more efficient than using a high-specificity approach to identify cases where CSF examination was unnecessary due to a high risk of a CSF A + profile. This outcome may be influenced by the composition of the diagnostic subgroups in our real-life population. Specifically, we observed a significant overlap of elevated pTau181 and pTau181/Aβ42 values between the AD and NIFD diagnostic subgroups, which may be attributed to inflammation-related blood-brain barrier dysfunction. 25 This overlap reduces the discriminative capacity of these biomarkers when their concentrations are high.
Our study highlights that the real-life application of plasma biomarker cut-off values with 95% sensitivity to identify “futile” subsequent analyses of CSF amyloid status could potentially eliminate a significant number of lumbar punctures in clinical practice - approximately 30% to 40% of all procedures in our population - while maintaining very acceptable misclassification rates (ranging from 2.9% to 5.7%). Similar results were reported by Silva-Spinola et al., who found that the proportion of lumbar punctures avoided was 37% with the pTau181/Aβ42 ratio, 38% with pTau181, and 15% with the Aβ42/Aβ40 ratio. 11
Given the specific characteristics of our real-life series, which were consecutive and unselected except for the presence of cognitive dysfunction, we believe that the use of plasma biomarkers, particularly pTau181 and pTau181/Aβ42, could be a simple and valuable tool for identifying patients at very low risk of amyloid pathology in both inpatient and outpatient settings.
While the present study offers valuable insights into the diagnostic potential of plasma biomarkers, several limitations should be acknowledged. The primary limitation lies in the study design, which focused on predicting CSF amyloid status using plasma biomarker values derived from a reference laboratory database with limited clinical data. Additionally, the retrospective nature of our analysis and the reliance on a single-center cohort may restrict the generalizability of our findings. Furthermore, a significant limitation is related to the plasma biomarkers (pTau181, Aβ42, and Aβ40) available for measurement using the Lumipulse automated platform during our retrospective study period (from March 2022 to October 2022). In fact, our study lacks data on plasma pTau217, which only became commercially available in 2023 and is now regarded as one of the most promising peripheral biomarkers of amyloid pathology.22–24,26
Therefore, future research should aim to include validate our results in larger, multicenter cohorts, also including other molecules as pTau217, and evaluate the longitudinal utility of plasma biomarkers in tracking disease progression.
In conclusion, plasma biomarkers offer a promising avenue for improving the early diagnosis and management of AD. Further research is needed to validate our findings, optimize assay protocols, and establish standardized reference ranges for plasma biomarkers. With ongoing advancements in biomarker technologies and growing interest in precision medicine approaches, plasma biomarkers hold significant potential for transforming the landscape of AD diagnosis and management.
Supplemental Material
sj-docx-1-alz-10.1177_13872877241300315 - Supplemental material for Real-life reliability of plasma pTau181, Aβ42/Aβ40, and pTau181/Aβ42 measured by Lumipulse G600II in predicting cerebrospinal fluid amyloid status
Supplemental material, sj-docx-1-alz-10.1177_13872877241300315 for Real-life reliability of plasma pTau181, Aβ42/Aβ40, and pTau181/Aβ42 measured by Lumipulse G600II in predicting cerebrospinal fluid amyloid status by Daniele Imperiale, Cristiana Atzori, Daniele Pio Angeloro, Amelia Murgioni, Alessia Bagatin, Valentina Secci, Andrea Calcagno, Marco Capobianco, Mario Coletti Moja, Eugenia Rota, Maria Roberta Bongioanni, Mara Rosso, Laura Godi, Massimo Barra, Marco De Mattei, Massimo Bonzanino, Delfina Ferrandi, Innocenzo Rainero, Leonardo Lopiano and Marco Bozzali in Journal of Alzheimer's Disease
Footnotes
Acknowledgments
The authors acknowledge Fujirebio Italia for support in providing the plasma kits free of charge.
Author contributions
Daniele Imperiale (Conceptualization; Formal analysis; Methodology; Software; Validation; Writing – original draft); Cristiana Atzori (Conceptualization; Investigation; Methodology; Software; Writing – original draft); Daniele Pio Angeloro (Data curation; Investigation; Resources); Amelia Murgioni (Data curation; Investigation; Resources); Alessia Bagatin (Data curation; Investigation; Resources); Valentina Secci (Data curation; Investigation; Resources); Andrea Calcagno (Supervision; Visualization; Writing – review & editing); Marco Capobianco (Data curation; Resources); Mario Coletti Moja (Data curation; Resources); Eugenia Rota (Data curation; Resources); Maria Roberta Bongioanni (Data curation; Resources); Mara Rosso (Data curation; Resources); Laura Godi (Data curation; Resources); Massimo Barra (Data curation; Resources); Marco De Mattei (Data curation; Resources); Massimo Bonzanino (Data curation; Resources); Delfina Ferrandi (Data curation; Resources); Innocenzo Rainero (Supervision; Validation; Writing – review & editing); Leonardo Lopiano (Supervision; Validation; Writing – review & editing); Marco Bozzali (Supervision; Validation; Writing – review & editing).
Funding
The authors received no financial support for the research, authorship, and/or publication of this article.
Declaration of conflicting interests
The authors declared the following potential conflicts of interest with respect to the research, authorship, and/or publication of this article: Marco Bozzali is an Editorial Board Member of this journal but was not involved in the peer-review process of this article nor had access to any information regarding its peer-review.
The remaining authors declared no potential conflicts of interest with respect to the research, authorship, and/or publication of this article.
Data availability
The data supporting the findings of this study are available upon reasonable request from the corresponding author.
Supplemental material
Supplemental material for this article is available online.
References
Supplementary Material
Please find the following supplemental material available below.
For Open Access articles published under a Creative Commons License, all supplemental material carries the same license as the article it is associated with.
For non-Open Access articles published, all supplemental material carries a non-exclusive license, and permission requests for re-use of supplemental material or any part of supplemental material shall be sent directly to the copyright owner as specified in the copyright notice associated with the article.