



Abstract
Background
MicroRNAs (miRNAs) have emerged as key regulators in Alzheimer's disease (AD), yet their function as biomarkers remains uncertain due to inconsistent findings in blood and cerebrospinal fluid (CSF).
Objective
We aimed to identify miRNAs that track disease progression, providing valuable insights into AD pathophysiology.
Methods
This study focused on analyzing alterations in miRNA expression levels in CSF and plasma samples, and their association with cognitive decline and hippocampal volume changes in AD patients using data from the Alzheimer's Disease Neuroimaging Initiative (ADNI) database.
Results
Integrative analyses identified a consistent set of miRNA alterations associated with AD. While a t-test showed a selective decrease of CSF miR-185-5p in AD versus healthy controls, logistic regression identified broader signatures in plasma (hsa-miR-125b-5p, hsa-miR-26a-5p, hsa-miR-376a-3p) and CSF (hsa-miR-499a-3p, alongside CSF hsa-miR-146a-5p, hsa-miR-16-5p, and hsa-miR-185-5p). LASSO regression further refined these to a reproducible decrease in plasma hsa-miR-125b-5p and CSF hsa-miR-185-5p, alongside an increase in plasma hsa-miR-26a-5p in AD. Together, these approaches reveal convergent miRNA dysregulation in plasma and CSF, suggesting their relevance to AD pathophysiology. Further analysis showed that lower plasma hsa-miR-125b-5p and hsa-miR-26a-5p, as well as lower CSF hsa-miR-185-5p, were associated with accelerated cognitive decline measured by ADAS13 scores. Reduced CSF hsa-miR-185-5p was significantly linked to hippocampal atrophy, with similar trends for the plasma miRNAs. Furthermore, CSF hsa-miR-185-5p levels correlated with amyloid pathology, suggesting a potential role in AD pathology.
Conclusions
These results highlight the role of CSF and plasma miRNA biomarkers in predicting cognitive and clinical decline in patients with AD.
Introduction
Alzheimer's disease (AD) remains a devastating neurodegenerative disorder, and identifying reliable biomarkers is essential both for unraveling its underlying mechanisms and for guiding the development of new treatments. 1 The ATN framework, which focuses on Aβ accumulation (A), abnormal tau (T), and neurodegeneration (N), plays a central role in diagnosing AD. 2 In addition, other less specific biomarkers, such as glial fibrillary acidic protein and neurofilament light chain, which are related to neuroinflammation and neural damage, 3 have also shown diagnostic value. However, there is not yet strong enough evidence to suggest these outperform more established biomarkers. Emerging blood-based metabolic biomarkers, potentially influenced by the gut-brain axis, may also play a key role in the onset and progression of AD and are being investigated as part of a more biology-based diagnostic approach. 4 Still, current protein biomarkers face challenges, including limited sensitivity and specificity, significant individual variability, and high testing costs. Therefore, identifying a broader range of biomarkers could offer a more complete picture of AD's underlying pathology and improve the accuracy of diagnosis.
microRNAs (miRNAs) have gained increasing prominence in AD research as minimally invasive molecular indicators measurable in blood and cerebrospinal fluid (CSF). 5 These short non-coding RNAs modulate gene expression post-transcriptionally by binding to target messenger RNAs (mRNAs), leading to degradation or translational repression and thereby attenuating protein synthesis. Through this mechanism, miRNAs regulate pathways central to AD pathophysiology, including synaptic plasticity, neuroinflammatory signaling and neuronal viability.6,7 Their stability in biofluids and direct connection to disease biology underscore their potential as clinically informative biomarkers. Despite this promise, investigations of circulating miRNAs in AD have produced inconsistent results. Reported signatures frequently lack reproducibility owing to variability in sample collection, processing, profiling platforms and analytical pipelines. 7 Moreover, relatively few studies have validated candidate miRNAs across independent cohorts, leaving their robustness and generalizability unresolved. Advancing the field will require methodological standardization and rigorous validation strategies capable of distinguishing genuine disease-related signals from technical artefacts. Establishing reproducible miRNA profiles will be essential to define their diagnostic and monitoring utility in AD and to integrate them into biomarker frameworks alongside established protein and imaging measures.8,9
In AD, miRNAs target key disease genes, showing either neurodegenerative or neuroprotective effects. 10 Several miRNAs have been identified as key regulators in AD-related gene expression and exert regulatory control over pathophysiological mechanisms of AD by binding to target.11,12 For instance, miRNA-125b and miRNA-124 have been recognized for their pivotal roles in neuroinflammation and synaptic plasticity in AD.13,14 Additionally, miRNA-146a has been implicated in the regulation of neuroinflammation, and its increased expression in AD may be linked to inflammatory processes in the disease.15,16 Moreover, a substantial elevation of miR-34a, mir-29, and other miRNA expressions in the blood of patients with AD correlated with results from clinical cognitive assessments.17,18 These findings provide crucial insights into the etiology and pathogenesis of AD, with miRNAs serving as potential biomarkers.
By assessing the expression levels of specific miRNAs, it may be possible to predict an individual's heightened risk of AD development and enable the monitoring of disease progression. With significant implications for early intervention and treatment strategies. Consequently, in this study, we conducted an in-depth examination of miRNAs in plasma and compared their expression levels between patients with AD and healthy individuals using plasma miRNA assays from the Alzheimer's Disease Neuroimaging Initiative (ADNI) database. We aimed to identify plasma miRNAs that may serve as predictive markers for AD development, advancing our understanding of the role of miRNAs in AD and their potential clinical applications.
Methods
Study design and population
This study included 80 healthy controls (HCs) and 80 individuals diagnosed with AD, all of whom were obtained from the ADNI database. AD diagnosis adhered to the criteria outlined in the National Institute of Neurological Disorders and Stroke-Alzheimer Disease and Related Disorders guidelines (Figure 1). 19 An essential demographic characteristic analysis was conducted for all participants, which included assessments of the Mini-Mental State Examination (MMSE), Montreal Cognitive Assessment (MoCA), Functional Activities Questionnaire (FAQ) scores, and APOE4 allele carrier status. Moreover, the Alzheimer's Disease Assessment Scale Cognition 13-item scale (ADAS13) was used to assess global cognition. 20 Furthermore, miRNA levels in the peripheral blood and CSF were evaluated in all participants in the current study. Additionally, the levels of soluble amyloid were assessed in CSF by quantification of amyloid-β (Aβ)1−42, and the fibrillar amyloid levels were evaluated using AV45 imaging.1,21 Analyses of total tau (T-tau), phosphorylated tau (P-tau), and the P-tau/T-tau ratio in the CSF were conducted in HCs and individuals with AD. We examined our conjecture in individuals categorized as having AD based on the recently introduced AT/N framework by the National Institute on Aging and Alzheimer's Association. 22
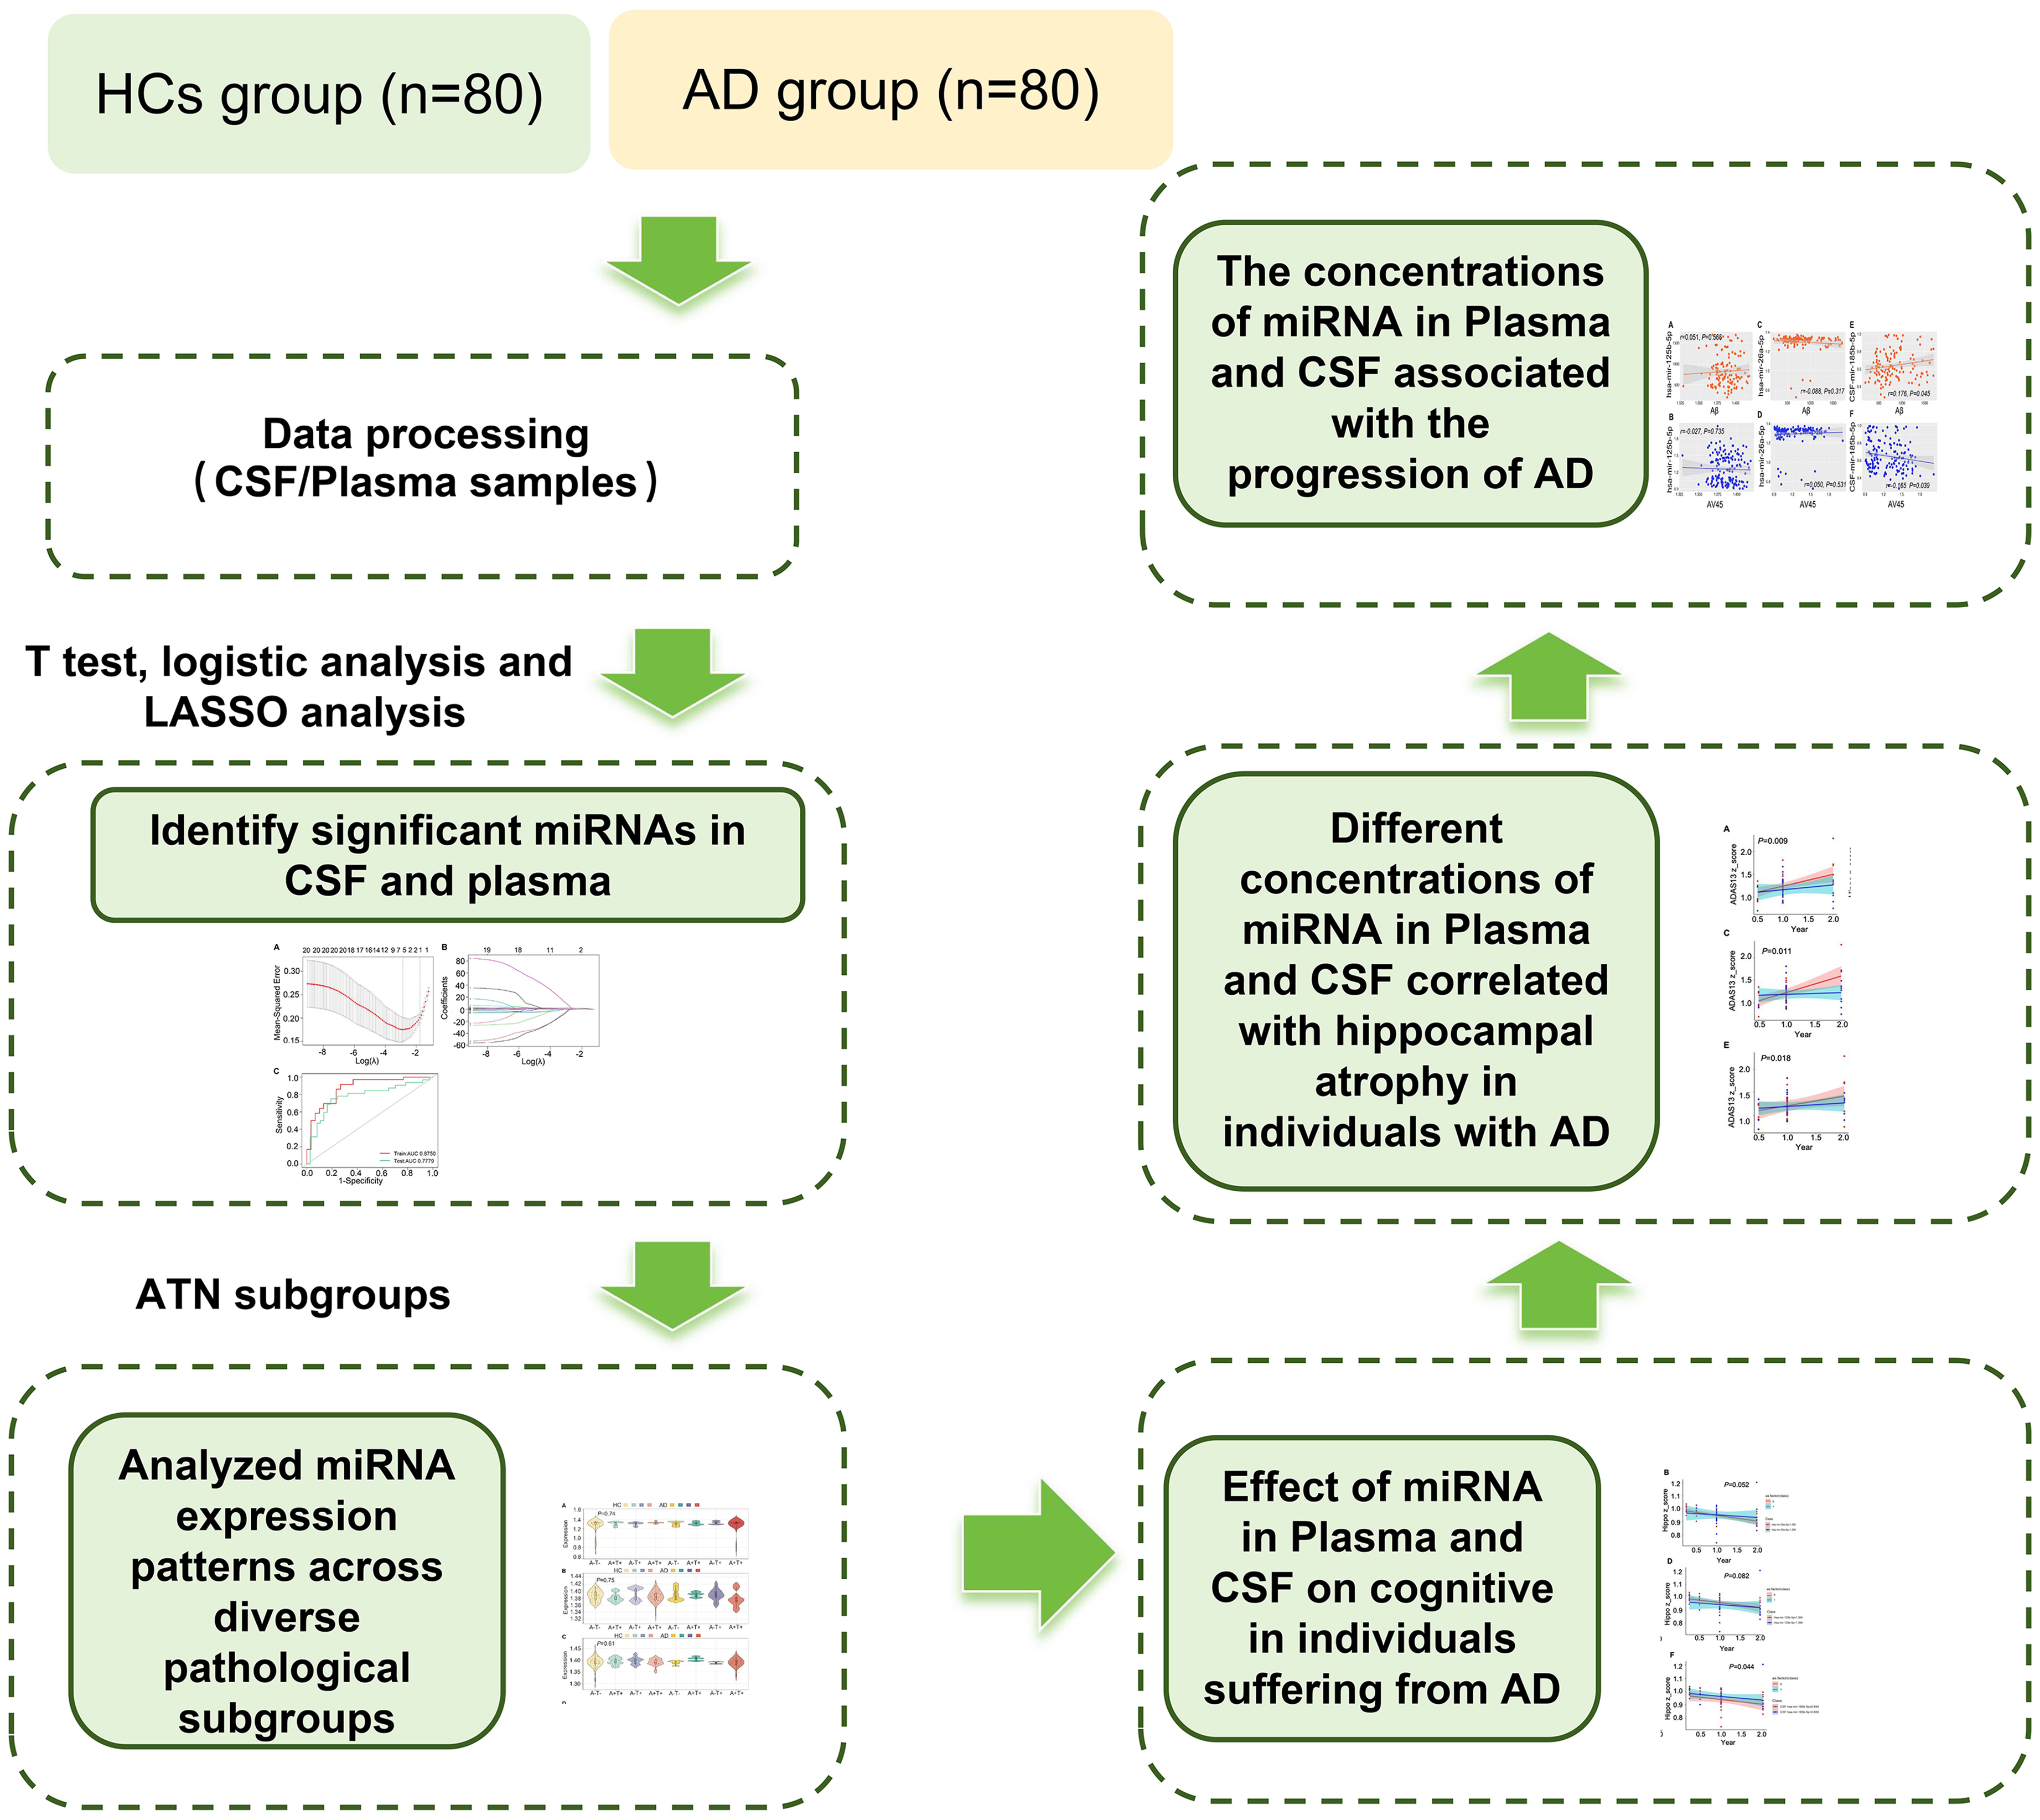
Study design.
Assessment of amyloid fibrils using AV45 by positron emission tomography
Details regarding the synthesis of florbetapir and image acquisition are available in the ADNI database (https://ida.loni.usc.edu).21 Florbetapir images were obtained in 4 × 5-min frames at 50–70 min after injection. Subsequently, these images underwent realignment, averaging, reslicing to a standardized voxel size (1.5 mm³), and smoothing to achieve a standard resolution of 8 mm³ at full width at half maximum. Cortical and reference regions of interest were delineated with the concurrent acquisition of structural T1 data serving as a structural template using FreeSurfer software (version 4.5.0; surfer.nmr.mgh.harvard.edu). Baseline florbetapir scans were used to derive standardized uptake value ratios (SUVRs) within four major cortical regions of interest: the frontal, cingulate, parietal, and temporal cortices. The individual SUVRs were subsequently averaged to create a comprehensive SUVR assessment.
Assessment of neurodegeneration using hippocampal volume by magnetic resonance imaging (MRI)
Hippocampal volume assessments were conducted using FreeSurfer. version 5.1 on 3 T MPRAGE MRI scans. These scans were processed using the ADNI imaging core at UCSF and obtained from the ADNI database (http://adni.loni.usc.edu/) for our current study. 23 A specialized framework based on FreeSurfer was employed for longitudinal hippocampal volume measurements. In summary, a median image was generated for each participant through the robust registration of their images across all longitudinal time points, resulting in an unbiased participant-specific template. This template was then used to initialize subsequent algorithms, including surface reconstruction, nonlinear spatial normalization to an atlas space, and parcellation, ensuring the uniform treatment of images from all time points and avoiding potential bias due to temporal order. Before the hippocampal volume extraction, all images underwent a series of preprocessing steps, including intensity normalization, removal of non-brain voxels, affine registration to the Talairach space, and segmentation of the subcortical white matter and nuclei, followed by a second intensity normalization. Subsequently, surface reconstruction was performed for all images through a series of steps that included nonlinear registration of individual surface models to a spherical atlas and automated parcellation of brain regions. Detailed descriptions of the longitudinal FreeSurfer-based imaging pipelines applied to the ADNI data can be found online (http://adni.loni.usc.edu/) and in previous publications.24,25
Isolation and quantification of miRNAs
Total RNA was isolated from 250 μL aliquots of CSF and plasma using the Norgen Urine miRNA Purification Kit, with spiking of cel-miR-39-3p exogenous control (Thermo Fisher) at a final concentration of 3 pM. Elution was performed with 30 μL (CSF) and 50 μL (plasma) of nuclease-free water, respectively. RNA concentration was quantified using the Qubit miRNA Assay Kit with a Qubit 4.0 Fluorometer (Thermo Fisher). miRNA was reverse-transcribed using the TaqMan Advanced miRNA cDNA Synthesis Kit (Cat# A28007, Thermo Fisher), involving 3’ polyadenylation, 5’ adapter ligation, and reverse transcription, followed by 14-cycle universal miRNA amplification (miR-amp). Amplified cDNA was diluted 1:10 and combined with TaqMan Fast Advanced Master Mix (Cat# 4444556, Thermo Fisher) for qPCR on custom-configured TaqMan Array MicroRNA Cards (384-well format). Each card interrogated 64 miRNAs in triplicate for two participant samples per run. Arrays were processed on a QuantStudio 7 Flex Real-Time PCR System (Thermo Fisher) with automated sample loading via an Orbitor RS Microplate Mover to ensure same-day analysis of matched CSF-plasma pairs. Quantification cycle (Cq) values were exported from QuantStudio Software and subjected to rigorous quality control, including normalization to exogenous cel-miR-39-3p and endogenous hsa-miR-16-5p controls. An exogenous spike-in control, cel-miR-39, was used as an internal reference for normalization of plasma and CSF miRNA quantification, following standard protocols. For measurements with Cq >34, Bayesian interval-censored regression models adjusted for age and sex were implemented to assess group differences. Inter-assay concordance was evaluated using Welch's t-test and visualized via Bland-Altman plots.
Assessment of Aβ1−42, T-tau, and P-tau concentrations
A comprehensive dataset containing detailed information on miRNAs, Aβ1−42, T-tau, and P-tau measurements, along with the original findings, was available for download from the LONI Image and Data Archive (https://ida.loni.usc.edu). The Aβ1−42, T-tau, and P-tau measurements were conducted by the ADNI Biomarker Core team at the University of Pennsylvania, employing Elecsys immunoassays and fully automated Elecsys Cobase 601 instruments, provided in the form of the UPENNBIOMK9.csv file via the ADNI databank. After categorizing the HC and AD groups into subgroups based on ATN subtyping, further comparisons of expression levels were conducted among these distinct subgroups. Additionally, statistical correlation analyses were performed to evaluate the significance of the selected miRNAs concerning Aβ1−42, AV45, T-tau, P-tau, hippocampal volume, and FDG scans. 26
Prediction of miRNA-mRNA target gene
To predict the potential target genes for hsa-miR-125b-5p, hsa-miR-26a-5p, and hsa-miR-185-5p, we used three independent miRNA target prediction databases: TargetScan, miRDB, and miRWalk. Each database provided a list of predicted target genes for each miRNA. We then performed a Venn diagram analysis to identify the using DAVID (Database for Annotation, Visualization, and Integrated Discovery) to identify enriched biological processes and pathways. The Gene Ontology (GO) analysis highlighted the biological functions associated with the identified target genes, including apoptosis, synaptic transmission, and neuronal signaling, all of which are directly relevant to AD pathology.
Statistical analysis
The AV45 SUVR was assigned a cutoff value of 1.11, referencing the whole cerebellum. To discern differences between the HC and AD groups and their respective subgroups, chi-square and split chi-square tests were used to analyze dichotomous variables, such as sex and APOE ε4 carrier status. Student's t-test or one-way analysis of variance was used to perform group comparisons (data are normally distributed), complemented by the least significant difference post hoc test. miRNA inclusion was determined based on logistic regression analysis, considering P-values. LASSO algorithm was used to select pertinent biomarker features and construct a predictive model for AD biomarker profiles. 27 All biomarker variables were included alongside variables from the reference model, including age, sex, years of education, and APOE ε4 carrier status, each independently assessed. The model performance was evaluated using area under the curve (AUC) estimation. The cutoff values were determined using ROC analysis, considering AUC, sensitivity, and specificity. The optimal cutoff point was the value that minimized the sum of absolute differences between the AUC and sensitivity or specificity, ensuring minimal disparity between sensitivity and specificity. Pearson's correlation test was applied to establish associations between AV45 SUVR and miRNAs and Aβ1−42 in the CSF and plasma while accounting for other covariates. Multivariable analyses, adjusted for APOE ε4, age, education, and sex, were performed using the Cox proportional hazards model to gauge the risk of AD progression. A significance level of p < 0.05 was the threshold for all statistical tests. Statistical analyses were conducted using SPSS, version 20 (IBM Corp., Armonk, NY, USA) and R, version 4.2.1 (R Development Core Team, Vienna, Austria).
Results
Demographic and clinical characteristics of participants from the ADNI database at baseline
The demographic and clinical characteristics of HCs and individuals with AD are presented in Table 1. Although there were no significant differences in age (p = 0.078) or sex (p = 0.202) between the groups, there was a notable difference in the educational background duration. Patients with AD had a shorter duration of education than HCs (p = 0.005). Moreover, individuals with AD displayed lower MMSE (p < 0.001) and MoCA scores (p < 0.001) than HCs. There was evidence of reduced functional capacity in patients with AD when evaluated using the FAQ, in contrast to that in HCs (p < 0.001). Individuals with AD showed lower Aβ1–42, T-tau, and P-tau levels in CSF than HCs (p < 0.001, p < 0.001, and p < 0.001, respectively). Furthermore, we analyzed the SUV of AV45 to determine amyloid positivity. Notably, there was a higher prevalence of individuals with elevated AV45 values in the AD group than in the HC group (p < 0.001). Subsequently, the participants were categorized into two groups based on their APOE ε4 status, revealing a significantly greater number of APOE ε4 carriers in the AD group compared with the HC group (p < 0.001).
Demographic and clinical features of the participants from ADNI database in baseline.
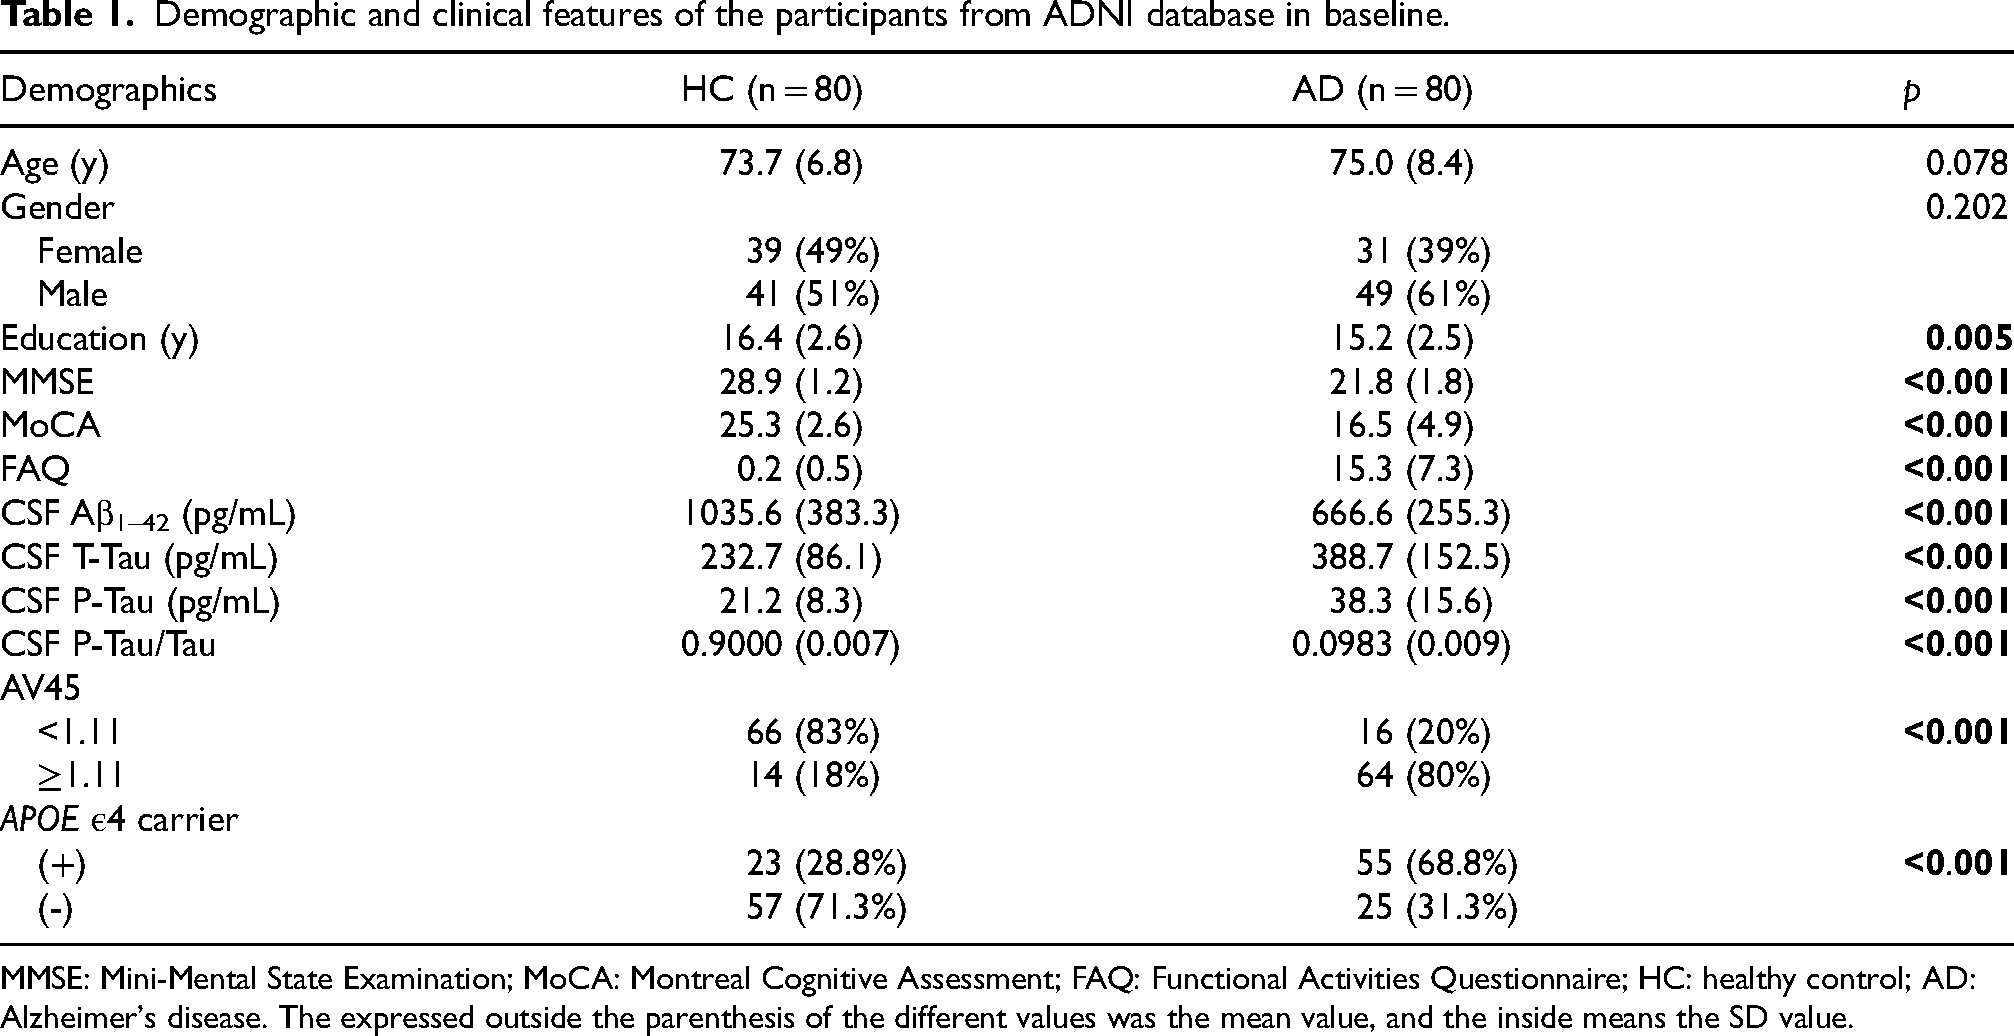
MMSE: Mini-Mental State Examination; MoCA: Montreal Cognitive Assessment; FAQ: Functional Activities Questionnaire; HC: healthy control; AD: Alzheimer's disease. The expressed outside the parenthesis of the different values was the mean value, and the inside means the SD value.
Plasma and CSF miRNA concentrations are associated with the development of AD
The miRNA levels in the plasma or CSF between the HC and AD groups were firstly tested using Student's t-test, respectively. As shown in Supplemental Table 1, the miRNA levels in plasma showed no significant differences between the HC and AD groups, whereas the mir-185-5p concentrations in CSF displayed lower levels in individuals with AD (0.62 ± 0.17) than in HCs (0.68 ± 0.16, p = 0.041). The logistic regression model was further applied to determine the significant variations in miRNA levels in the plasma or CSF between different groups, considering sex and APOE4 carrier status as confounding effects (Supplemental Table 2). The hsa-mir-125b-5p, hsa-mir-26a-5p, hsa-mir-376a-3p, hsa-mir-499a-3p levels in the plasma, as well as hsa-mir-146a-5p, hsa-mir-16-5p and hsa-mir-185-5p levels in the CSF were significantly different between the HC and AD groups (Supplemental Table 2). Next, we performed LASSO analysis to identify the significant miRNAs (Figure 2). In individuals with AD, we observed a significant decrease in plasma hsa-mir-125b-5p levels (p = 0.018) and CSF hsa-mir-185-5p levels (p = 0.017), along with a significant increase in plasma hsa-mir-26a-5p levels (p = 0.017, Figure 2A, B). ROC curves were used to indicate the performance of the training and validation sets. As shown in Figure 2C, the AUC value of the training set was 0.875 and that of the test set was 0.778. These findings suggest that a combination of plasma and CSF miRNAs may help distinguish AD patients from healthy individuals with acceptable accuracy.
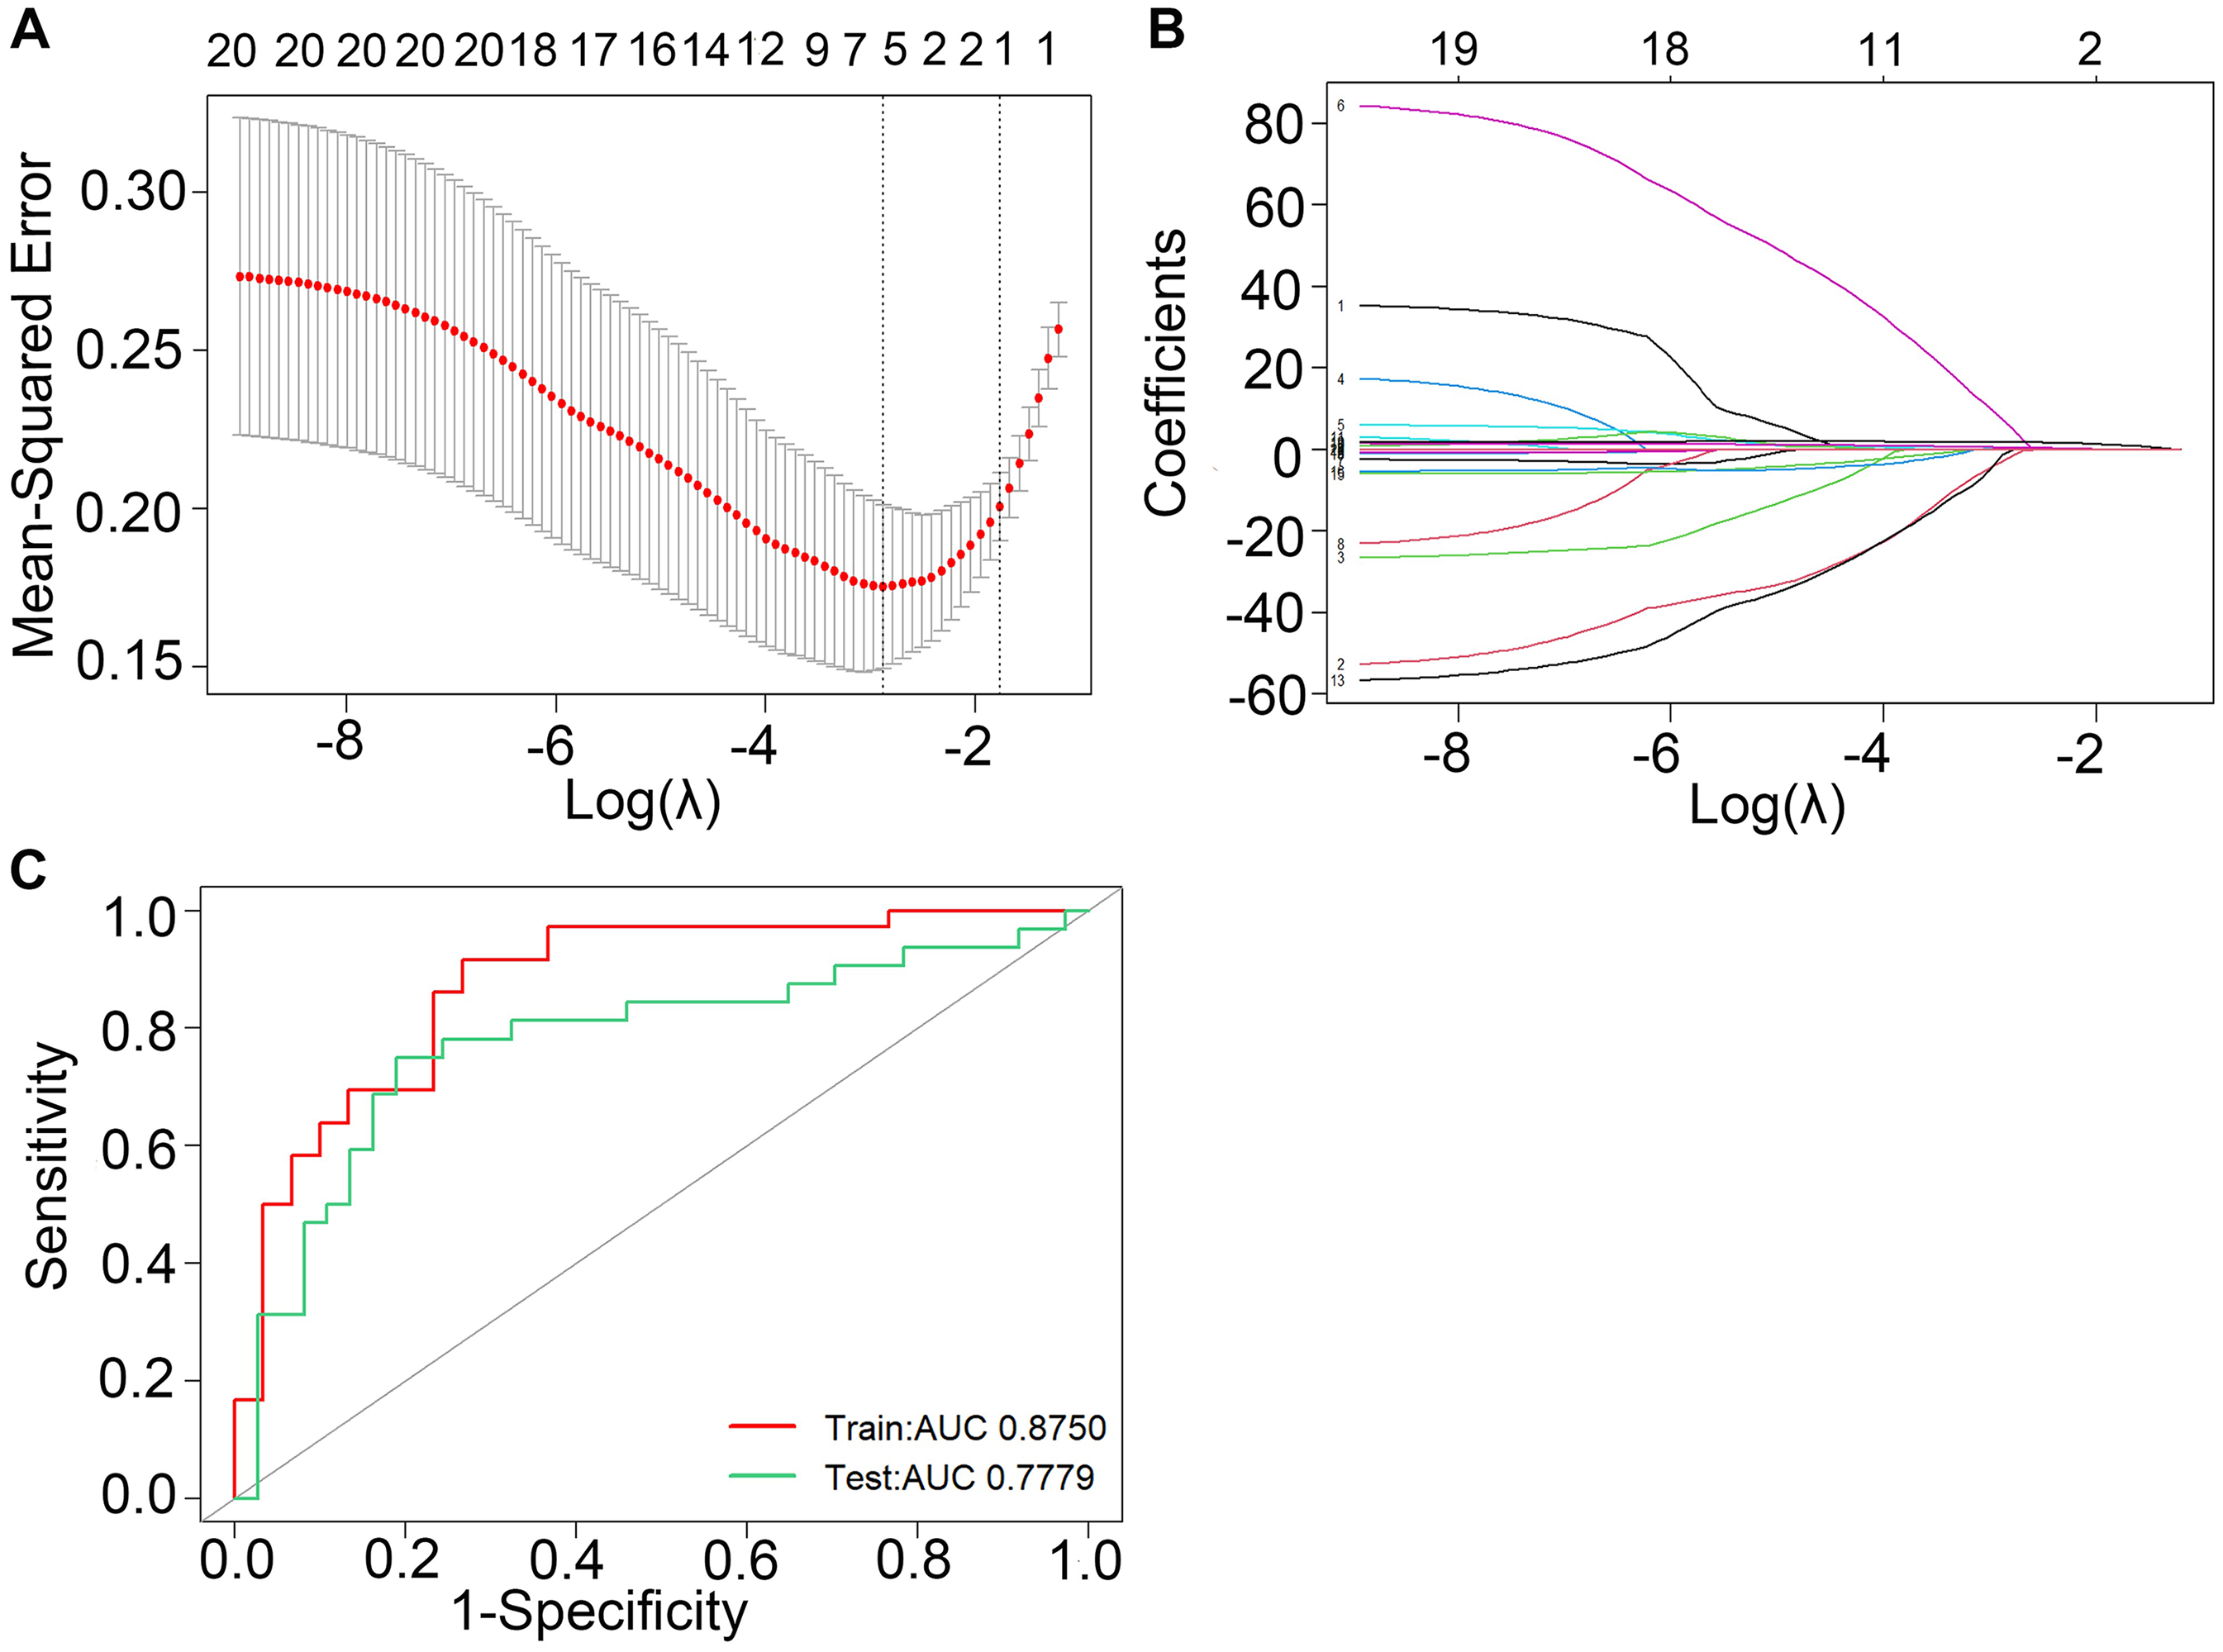
Identify miRNAs of statistically significant based on LASSO regression. (A, B). Aβ deposition, APOE4 carriers, and three statistically significant microRNAs were identified statistically significant between HCs and AD individuals including hsa-mir-125b-5p, hsa-mir-26a-5p, CSF_mir-185b-5p based on the cut-off value respectively. (C) The ROC curves were conducted to indicate the performance of the train set and the validation set. As shown in Figure 2C, the AUC value of the train set was 0.761 and the test set was 0.681.
Analyzed miRNA expression patterns across diverse pathological subgroups
Next, we analyzed the expression of hsa-mir-125b-5p and hsa-mir-26a-5p in plasma and hsa-mir-185-5p in CSF across diverse pathological subgroups. This study follows the updated biomarker staging principles from the 2024 Revised Criteria for the Diagnosis and Staging of Alzheimer's Disease. Since our dataset does not include markers of neurodegeneration like plasma neurofilament light chain or FDG-PET scans, and because structural MRI data such as hippocampal volume and cortical thickness did not show meaningful differences between groups, we were not able to assess the neurodegeneration aspect in full. Therefore, according to the ATN framework, participants with AD were classified into Aβ positive (A+) and Aβ negative (A-) or tau positive (T+) and tau negative (T-) categories on the basis of the neuropathological findings in the current study. Differences in the miRNA levels across these subgroups were tested and the results showed that hsa-mir-125b-5p (Figure 3A, p = 0.74), hsa-mir-26a-5p (Figure 3B, p = 0.75), and hsa-mir-185b-5p (Figure 3C, p = 0.61) showed no statistically significant variations, suggesting that while these miRNAs differ between clinical AD and controls, they may not vary across biomarker-defined subtypes at baseline.

Analysis of microRNAs levels in plasma and CSF between different groups based on the ATN framework. The significant microRNAs from Lasso including (A) hsa-mir-125b-5p, (B) hsa-mir-26a-5p, and (C) CSF_mir-185b-5p were analyzed and no statistically significant were observation between different ATN subgroups.
The concentrations of miRNA in the plasma and CSF are associated with the Aβ pathology levels of AD
To further clarify the link between miRNAs and AD pathology, we examined their associations with amyloid 213 burden using both CSF Aβ42 levels and AV45 PET SUVR. CSF hsa-mir-185-5p levels showed a notable correlation with both amyloid deposition and fibrillar amyloid levels. There was a positive association between CSF hsa-mir-185-5p concentrations and amyloid deposition (r = 0.176, p = 0.045, Figure 4A) and a negative association with fibrillar amyloid levels (r = −0.165, p = 0.039, Figure 4B), suggesting their potential relevance to the underlying AD pathology and progression. However, in plasma, hsa-mir-125b-5p showed no significant correlation with Aβ42 levels (r = 0.051, p = 0.566, Figure 4C) or AV45 values (r = −0.027, p = 0.735, Figure 4D). Similarly, plasma hsa-mir-26a-5p did not significantly correlate with Aβ42 levels (r = −0.088, p = 0.317, Figure 4E) or AV45 values (r = 0.050, p = 0.531, Figure 4F), indicating that their involvement in AD might be more related to downstream processes rather than direct amyloid deposition.

The association of miRNA in plasma and CSF with the aβ pathology of ad. (A) A notable positive correlation were investigated between mir-185b-5p levels in CSF and Aβ levels (r = 0.176, p = 0.045). (B) The negative association were founded between mir-185b-5p level in CSF with AV45 levels (r = −0.165, p = 0.039). (C) In plasma, hsa-mir-125b-5p exhibited no discernible correlation with Aβ levels (r = 0.051, p = 0.566). (D) The hsa-mir-125b-5p in blood displayed no significant correlation with AV45 levels (r = −0.027, p = 0.735). (E) The hsa-mir-26a-5p in plasma displayed no significant correlation with Aβ levels (r = −0.088, p = 0.317). (F) No significant association was found between hsa-mir-26a-5p concentrations with AV45 values (r = 0.050, p = 0.531).
Effect of miRNA in the plasma and CSF on cognition decline in individuals with AD
Then we investigated the impact of varying miRNA levels on cognitive decline in the follow-up of AD groups. Cognitive changes in AD patients were assessed using the ADAS13 score, adjusting for sex, age, education, and APOE ε4 carrier status. MiRNA levels were categorized as below the cut-off value or above the cut-off value. The cut-off values were determined by using ROC curve with Youden's index. The determined cut-off values for hsa-mir-125b-5p and hsa-mir-26a-5p in the plasma were 1.384 and 1.299, respectively. As shown in Figure 5A and 5C, lower concentrations of hsa-mir-125b-5p and hsa-mir-26a-5p in the plasma were associated with a faster increase in ADAS13 scores (p = 0.011 and p = 0.009, respectively). The cut-off value for mir-185b-5p in the CSF was set at 0.650, and higher concentrations of mir-185b-5p in the CSF were associated with a slower increase in ADAS13 scores (Figure 5E, p = 0.018). These associations suggest that miRNA levels may serve as useful prognostic indicators in AD.
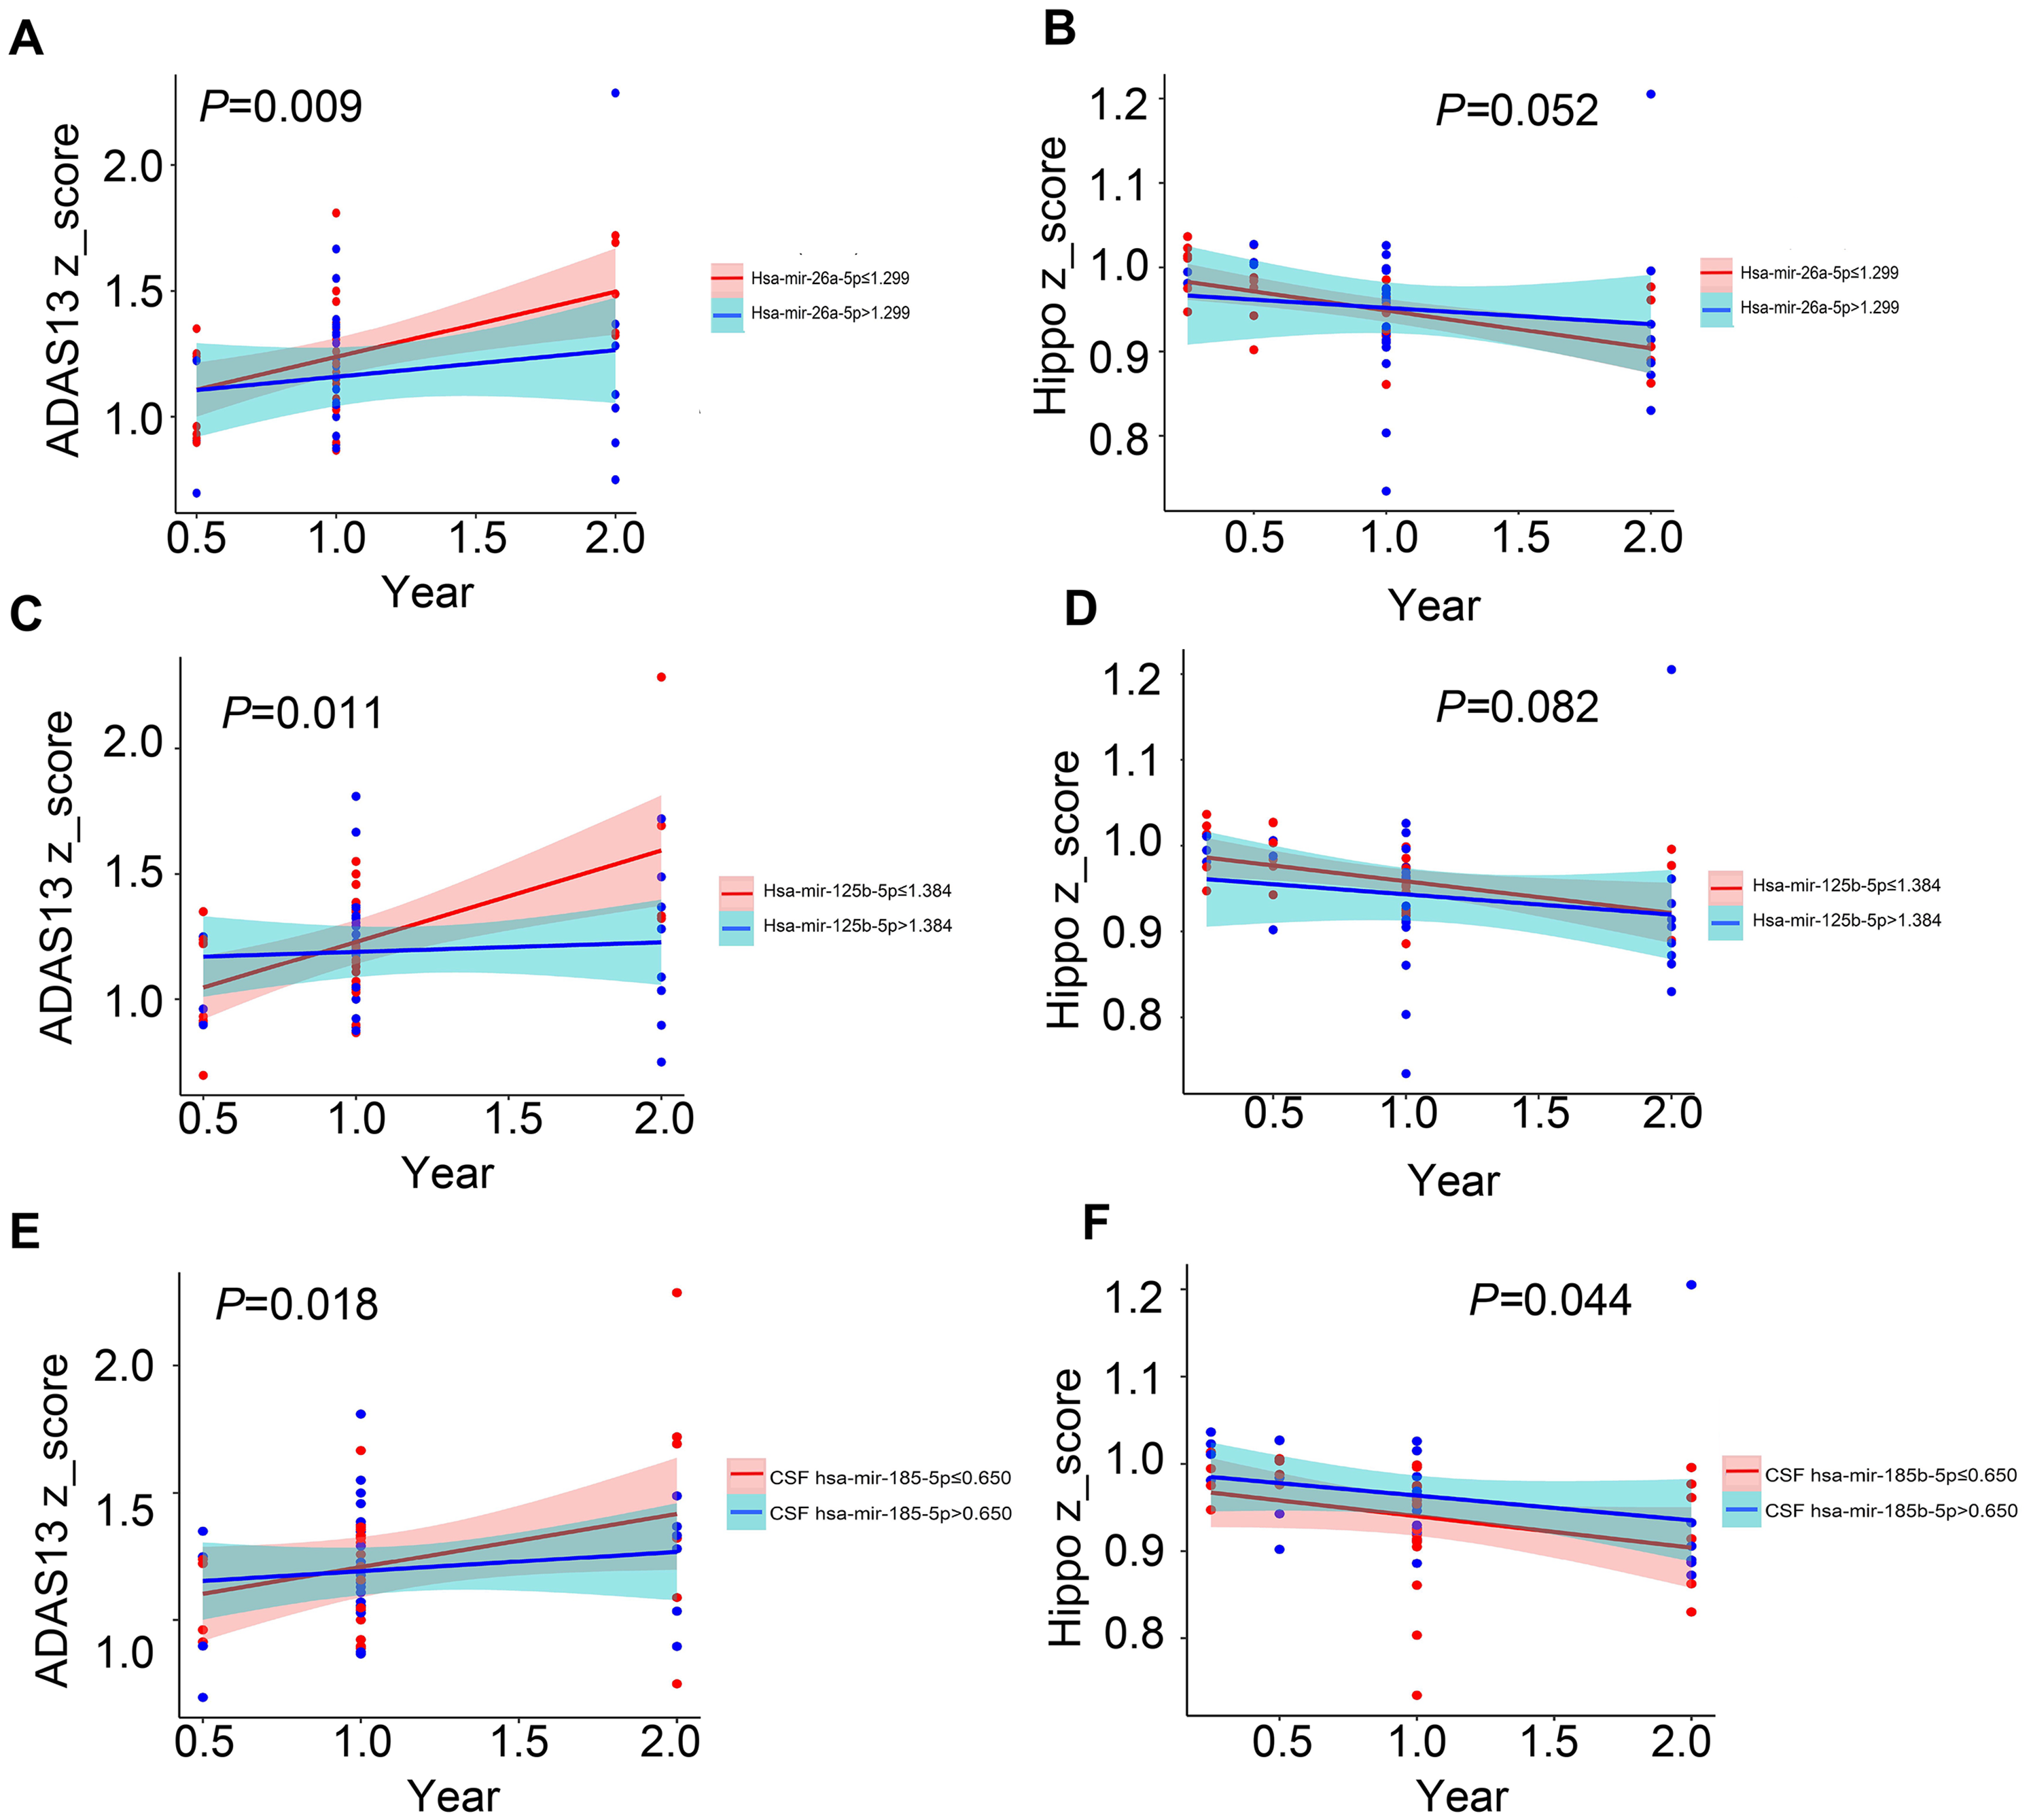
Selected miRNAs associated with cognitive decline and hippocampal volume changes in individuals suffering from AD. (A, C) Lower concentrations of hsa-mir-26a-5p and hsa-mir-125b-5p in plasma were associated with a faster increase in ADAS13 scores (p = 0.009 and p = 0.011, respectively). (E) Higher concentrations of mir-185b-5p in CSF were linked to a slower increase in ADAS13 scores (p = 0.018). Reduced concentrations of hsa-mir-26a-5p (B) and hsa-mir-125p-5p (D) in plasma, as well as diminished mir-185b-5p concentrations in CSF (F), were associated with hippocampal volume decline in AD patients (p = 0.052, p = 0.082, p = 0.044, respectively).
Different concentrations of miRNA in the plasma and CSF are correlated with hippocampal volume changes in individuals with AD
To assess the impact of miRNA levels on the progression of cognition decline, we analyzed the correlation between specific miRNA levels and changes in hippocampal volume in follow-up visits of the AD group. All results were adjusted for sex, age, education, and APOE ε4 carrier status. miRNA levels were dichotomized into high and low groups based on the median expression as a cutoff value. As shown in Figure 5B and 5D, reduced concentrations of hsa-mir-125b-5p and hsa-mir-26a-5p in the plasma, as well as diminished mir-185b-5p concentrations in the CSF (Figure 5F), were associated with a faster decline in hippocampal volume (p = 0.082, p = 0.052, p = 0.044, respectively). Although not all results reached conventional statistical significance, the trend suggests that these miRNAs may be indicative of structural brain changes relevant to AD progression.
Prediction of different target gene of miRNA and asset of gene function
To further explore the potential biological roles of our candidate miRNAs in AD, we performed target gene prediction using three widely used databases—TargetScan, miRDB, and miRWalk—and identified overlapping genes through Venn diagram analysis (Figure 6A–C). For hsa-miR-185-5p, we found 28 common target genes across all three platforms, including well-known AD-related genes like SORL1, along with SOX13, NFIX, and BSN. SORL1 has been repeatedly identified as a genetic risk factor for AD, supporting the relevance of miR-185-5p to disease mechanisms. Similarly, for hsa-miR-125b-5p, the intersection revealed 593 common genes such as SORL1, AKT3, BCL2, and KCNK10, many of which are involved in key neuronal survival and signaling pathways. For hsa-miR-26a-5p, 42 overlapping targets were found, including DYRK1A, CLASP2, and again, SORL1—reinforcing its connection to AD pathophysiology. We then conducted functional enrichment analysis on these intersecting targets and found strong associations with biological processes crucial to AD (Figure 6D-F), synaptic formation and regulation, neuronal signaling, apoptosis, kinase activity, post-translational modifications, and protein degradation. These processes are central to the progression of AD and align with known disease mechanisms like synaptic loss, neuronal death, and impaired protein clearance.
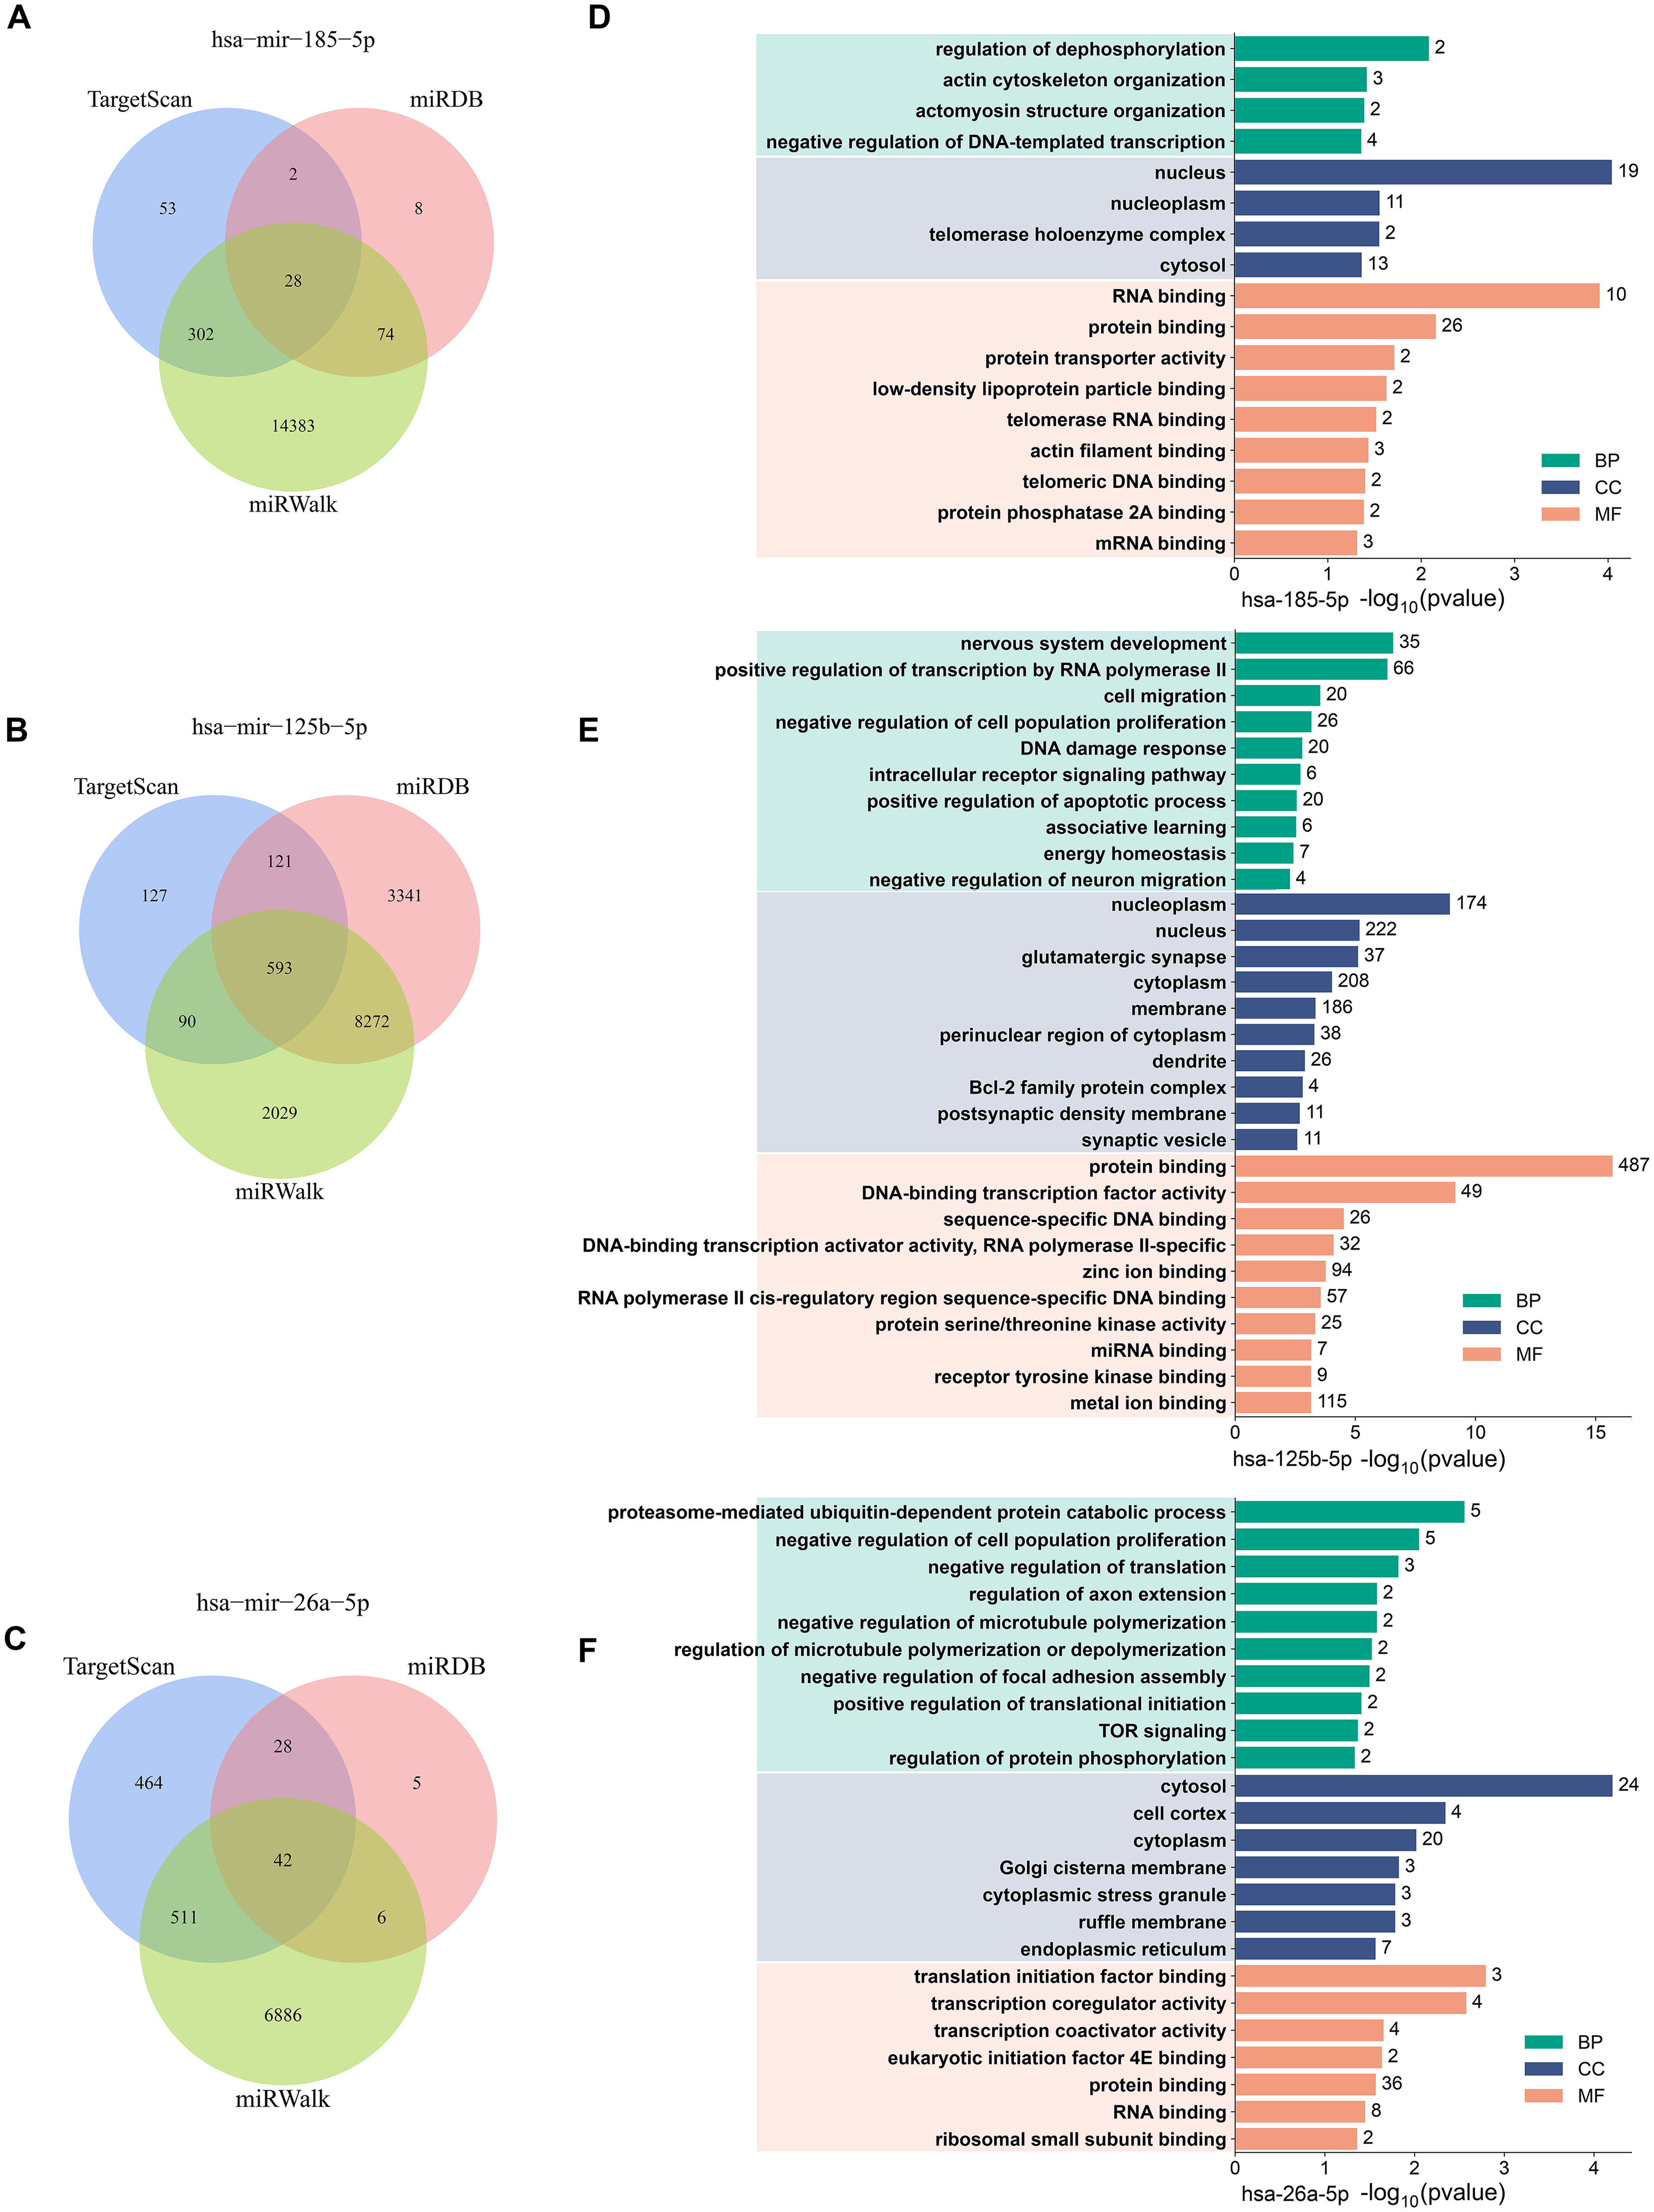
Target gene prediction and functional analysis of miR-125b-5p, miR-26a-5p, and miR-185-5p. (A, C) Venn diagrams illustrating the intersection of target genes predicted by three different databases (TargetScan, miRDB, and miRWalk) for hsa-miR-125b-5p, hsa-miR-26a-5p, and hsa-miR-185-5p. (D, F) Gene Ontology (GO) analysis results for the common target genes, showing functional enrichment related to apoptosis, synaptic transmission, and neuronal signaling pathways for miR-185-5p. These findings suggest a mechanistic link between miR-185-5p and key AD-related processes such as neuronal injury and synaptic dysfunction.
Discussion
In the present study, we analyzed the changes in miRNA expression levels in both CSF and plasma samples and their association with concurrent cognitive decline and hippocampal atrophy in patients with AD from the ADNI database. In individuals with AD, we observed a significant decrease in plasma hsa-mir-125b-5p levels, significant increase in plasma hsa-mir-26a-5p levels, and significant decrease in mir-185b-5p levels in CSF. However, these miRNAs showed no significant differences between the control and AD groups across various ATN subtypes. Lower concentrations of hsa-mir-125b-5p and hsa-mir-26a-5p in the plasma and mir-185b-5p concentrations in the CSF were associated with a faster increase in ADAS13 scores and a decline in hippocampal volume in AD group, suggesting a potentially detrimental influence on cognitive and memory impairment. Moreover, mir-185b-5p concentrations in the CSF were positive for amyloid deposition and negative for fibrillar amyloid levels, indicating their potential relevance in AD pathology and development. The results of the present study highlight the usefulness of CSF and plasma miRNA biomarkers for predicting cognitive and clinical decline in patients with AD.
Assessing specific miRNA expression levels can help identify individuals at risk for developing AD. 28 Compared to methods that require CSF collection or imaging studies, blood-based miRNA testing is a convenient, noninvasive, and cost-effective diagnostic approach. 29 This method provides insights into the patient's pathological status, facilitating the development of personalized treatment plans. 30 However, research on the diagnostic use of peripheral blood miRNAs is still limited. While bioinformatics analyses have previously associated hsa-miR-125b-5p with AD onset, 31 we found that plasma hsa-miR-125b-5p and hsa-miR-26a-5p, along with CSF hsa-miR-185-5p, were linked to accelerated cognitive decline and hippocampal atrophy in AD patients. Notably, their levels did not differ significantly from healthy controls, indicating that these miRNAs reflect disease progression rather than serving as risk factors for disease onset. Furthermore, recent machine learning models have implicated hsa-mir-26a-5p in AD pathophysiology. 32 However, a separate cohort study found significant downregulation of blood-based hsa-mir-26a-5p, which contradicts our results. 33 Our study demonstrated a notable increase in plasma hsa-mir-26a-5p levels among participants with AD. We postulate that these divergent outcomes may be attributable to population-specific factors. To elucidate the significance of this altered expression in AD pathology, we explored the correlation between hsa-mir-26a-5p levels, cognitive decline, and neurodegenerative severity. Consistent with the LASSO analysis, which showed decreased plasma hsa-miR-125b-5p and CSF mir-185b-5p alongside increased plasma hsa-miR-26a-5p in AD patients, lower plasma hsa-miR-125b-5p and CSF mir-185b-5p were associated with accelerated cognitive decline and hippocampal atrophy. While the relationships between plasma hsa-miR-125b-5p and hsa-miR-26a-5p concentrations and hippocampal volume did not reach statistical significance, the observed trends suggest a potential link with neurodegeneration. Notably, lower plasma hsa-miR-26a-5p concentrations were associated with faster cognitive decline, indicating that higher levels of this miRNA may be related to a slower progression of cognitive impairment.
Although CSF miRNA assessment is more invasive than plasma analysis, it offers greater specificity for AD.34,35 In our study, CSF mir-185b-5p was significantly decreased in AD patients, and reduced concentrations were associated with both faster cognitive decline and hippocampal atrophy, suggesting a potential role in neurodegenerative processes. These findings highlight the relevance of plasma and CSF miRNAs as indicators of disease progression rather than diagnostic risk factors.36,37 Our investigation revealed a significant decrease in CSF mir-185b-5p levels in patients with AD, although the role of mir-185b-5p in AD within the CSF remains underexplored. Cellular studies have suggested that MPP + induces neuronal damage, potentially reducing mir-185b-5p levels. 38 These findings indicate a potential link between diminished mir-185b-5p in the central nervous system and neuronal injury. Furthermore, our study identified an association between reduced CSF mir-185b-5p concentrations and accelerated ADAS13 scores as well as hippocampal volume decline. This highlights the significance of low mir-185b-5p levels as risk factors for cognitive impairment and neurodegenerative progression in AD. Given the crucial roles of Aβ deposition and fibrillar amyloid protein levels in AD pathogenesis and clinical diagnosis, we evaluated the relationship between CSF mir-185b-5p levels and both CSF Aβ levels and brain fibrillar amyloid levels.39,40 Our results showed that lower CSF miR-185-5p levels were associated with faster cognitive decline and hippocampal atrophy, suggesting a potential protective role. At the same time, miR-185-5p levels correlated positively with overall amyloid burden, but negatively with fibrillar amyloid. This apparent contradiction could be explained by the different pathological significance of Aβ species. We proposed that miR-185-5p might have suppressed the conversion of soluble Aβ into dense, fibrillar aggregates. When miR-185-5p levels were higher, soluble Aβ might have accumulated, leading to higher total amyloid signal, while the formation of mature fibrils was reduced, resulting in lower fibrillar amyloid. This interpretation was consistent with previous evidence that soluble Aβ oligomers are particularly toxic to synapses. A decrease in miR-185-5p might therefore have facilitated the formation of more neurotoxic Aβ species and contributed to disease progression. Further experimental work is needed to test this hypothesis directly. The association between low miR-185-5p and poor cognitive outcomes likely reflected its broader impact on AD pathology. Prior studies suggested that miR-185 could influence several processes. It may have affected APP metabolism and Aβ production by regulating secretase-related genes.41–43 It might also have modulated Aβ aggregation and clearance through pathways involving molecular chaperones like Clusterin and ApoE, or through autophagy-related mechanisms. Additionally, miR-185 was reported to regulate synaptic proteins and neurotrophic signaling, supporting neuronal survival and plasticity. These actions likely worked in combination. Although our study was focused on clinical associations, identifying the exact targets and mechanisms remains a key goal of our ongoing research.
Regarding the differing roles of miR-125b-5p and miR-26a-5p, we believed these reflected their distinct biological functions. Although lower plasma levels of both were linked to faster cognitive decline, similar to miR-185-5p, heir mechanisms differed. miR-125b-5p has often been found elevated in AD brain and shown to have pathogenic effects. It promoted neuroinflammation by downregulating anti-inflammatory regulators and enhanced tau hyperphosphorylation by targeting proteins. 44 Thus, even though lower peripheral levels were associated with worse outcomes, this did not necessarily suggest a protective role. Instead, it might have reflected insufficient reduction of a harmful factor or complex dynamics between the brain and peripheral circulation. In contrast, miR-26a-5p has generally been reported as downregulated in AD and showed neuroprotective properties. It supported neuron survival and synaptic function by targeting pro-apoptotic and stress-related genes such as PTEN, and 332 GSK3β.45,46 The link between lower levels and faster cognitive decline was consistent with a loss of its protective effects.
Considering these findings, CSF miRNAs may hold promise as biomarkers for monitoring disease progression in AD, offering potential for personalized patient management and improved care. However, further in-depth studies are required to clarify the molecular mechanisms by which these miRNAs function and their precise roles in AD pathology. Such investigations are expected to provide more accurate insights into disease progression and may inform future strategies for therapeutic intervention.
Supplemental Material
sj-docx-1-alz-10.1177_13872877251390836 - Supplemental material for MicroRNA biomarkers in cerebrospinal fluid and plasma predicting cognitive decline in Alzheimer's disease
Supplemental material, sj-docx-1-alz-10.1177_13872877251390836 for MicroRNA biomarkers in cerebrospinal fluid and plasma predicting cognitive decline in Alzheimer's disease by Yang Jiao, Yanfei Ding, Ningdi Luo, Mengyue Niu, Min Zhong, Jun Liu, Aonan Zhao, Yuanyuan Li and for the Alzheimer's Disease Neuroimaging Initiative in Journal of Alzheimer's Disease
Footnotes
Acknowledgements

Ethical considerations
Since only anonymized data were used, no additional ethical approval was required for this secondary analysis.
Consent to participate
This study utilized de-identified data obtained from the ADNI database. All ADNI participants provided informed consent prior to enrollment, and the study was conducted in accordance with relevant guidelines and regulations.
Author contribution(s)
Funding
The authors disclosed receipt of the following financial support for the research, authorship, and/or publication of this article: National Natural Science Foundation of China (82471264, to YYL); National Natural Science Foundation of China (82201392, to ANZ); the Shanghai Sailing Program (22YF1425100, to ANZ); and the China Postdoctoral Science Foundation project (2021M702169, to YJ). Shanghai Rising Stars of Medical Talents Youth Development Program (2023-62, to YYL). The Shanghai Municipal Health Commission Clinical Research Special Fund for the Health Industry (20234Y0026, to YYL). National Research Center for Translational Medicine at Shanghai, Ruijin Hospital, Shanghai Jiao Tong University School of Medicine (Shanghai, China) (Grant No. NRCTM(SH)-2021-03). Shanghai Hospital Development Center Foundation (SHDC22022304).
Declaration of conflicting interests
The authors declared no potential conflicts of interest with respect to the research, authorship, and/or publication of this article.
Data availability statement
All data generated or analyzed during this study are included in this article and its supplementary material files. Further enquiries can be directed to the corresponding author.
Supplemental material
Supplemental material for this article is available online.
References
Supplementary Material
Please find the following supplemental material available below.
For Open Access articles published under a Creative Commons License, all supplemental material carries the same license as the article it is associated with.
For non-Open Access articles published, all supplemental material carries a non-exclusive license, and permission requests for re-use of supplemental material or any part of supplemental material shall be sent directly to the copyright owner as specified in the copyright notice associated with the article.
