
Abstract
Background
Declining physical functionality is an indicator of cognitive impairment, distinguishing normal cognition (NC) from dementia. Whether this extends to pre-dementia stages is unclear.
Objective
Assess physical performance patterns, evaluate relationships with imaging biomarkers, and identify specific measures distinguishing NC, subjective cognitive decline (SCD) and mild cognitive impairment (MCI).
Methods
Group differences (78 NC, 35 SCD, and 41 MCI) in physical function (global function, balance, gait speed, step length, single leg support) were evaluated with logistic regression while distinguishing between MCI due-to-AD and MCI due-to-vascular etiology. Relationships with imaging biomarkers (cortical atrophy score, white matter hyperintensities volumes) were analyzed with ANCOVA.
Results
Participants were 68.6 ± 9.3 years old, had 16.2 ± 3.0 years of education, and 23% were ethnoracial minorities. Physical performance distinguished MCI from NC and SCD. Greater performance on the Mini Physical Performance Test (mini PPT) and balance were associated with lower odds of being SCD versus NC (ORmini PPT = 0.73; 95% CI:0.56–0.97; ORbalance = 0.35, 95%CI:0.16–0.80). AD etiology accounted for most group differences in physical performance versus vascular etiology. Consistent associations between biomarkers, physical performance, and cognition were found.
Conclusions
Findings suggest that: 1) changes in mini PPT performance and balance may help detect cognitive impairments, as early as the SCD stage; 2) changes in gait speed, gait cycle parameters, and Timed Up-and-Go may indicate more significant cognitive impairment; 3) neuronal loss is linked to subtle changes in physical functionality as early as SCD. Physical performance may be a valuable tool in early dementia detection in clinical settings and could identify targets for early intervention.
Keywords
Introduction
The increasing prevalence of Alzheimer's disease and related dementias (AD/ADRD) poses concerns for all stakeholders including patients, caregivers, local communities, and the healthcare system. This highlights the need to identify indicators and predictors of dementia as early in the disease process as possible, especially those that are modifiable and easy to assess in the primary care setting.
Global physical function, gait speed, and balance have been consistently linked to cognitive impairment and incident dementia, therefore helping distinguish dementia from normal cognition (NC) and predicting future risk. 1 Evidence that physical performance changes such as gait slowing precede cognitive decline by several years 2 suggests physical functionality as a valuable marker for subtle change in cognitive function prior to development of clinically significant cognitive impairment. In a series of analyses evaluating the longitudinal relationship between physical function, cognitive performance, and neurodegeneration, challenging gait tasks such as fast 400 m walk (fitness), 3 dual task walking, 4 and dynamic gait parameters including step length 5 have been shown to be superior to gait speed in predicting cognitive change in unimpaired older adults. Evidence suggests that deficits in performance on more complex gait and physical functional measures may precede pathological changes in brain areas involved in spatial processing such as the hippocampus and precuneus. 6 Identifying pathological changes at the earliest stages is particularly important to maximize the efficacy of dementia prevention, intervention, and management strategies. 7 Therefore, measures of physical performance that are sensitive to preclinical changes could have significant clinical care implications but their utility in dementia risk research has been underexplored. Preclinical AD diagnostic guidelines requiring availability of biomarker data to establish presence of neuropathology 8 are now standard in dementia research. Although diagnostic guidelines have not been established for preclinical staging of non-AD dementias, biomarkers of neuropathology reflecting vascular damage9,10 and synucleinopathy 11 have been proposed to guide AD/ADRD research into early detection and prevention of non-AD dementias.
However, AD/ADRD fluid and imaging biomarkers remain expensive and not always available or practical for use in clinical practice making preclinical AD/ADRD as currently defined difficult to diagnose in clinical settings. Subjective cognitive decline (SCD) in the absence of overt objective cognitive impairment is estimated to affect 12% of adults ≥65 years of age. 12 SCD has been linked to AD risk factors including higher presence of an APOE ɛ4 allele, 13 increased risk of amyloid deposition, 14 and a two-fold increase in risk of incident mild cognitive impairment (MCI) 15 compared to those with no SCD. SCD may therefore represent a pertinent measurable at-risk state for AD/ADRD, whose clinical value will be improved by availability of effective treatments to slow down or prevent progression. 16 SCD has been deemed a growing public health concern and a ‘call to action’ by the Center for Disease Control and Prevention in 2019 encourages patients and clinicians to screen for SCD during routine medical visits. 12 While no treatments for SCD are available at this time, evidence for pathological alterations similar to those observed in MCI due to AD and AD as well as higher white matter abnormalities supports SCD as an early precursor of AD 17 and vascular contributions to cognitive impairment and dementia, 18 and potential target for intervention. 19 These pathological similarities between the various stages of AD/ADRD and the temporal relationship observed between deficits in gait and physical functionality and pathological brain changes and cognitive decline,3–6 suggest that a more precise understanding of SCD not only in terms of its cognitive features but also its physical functional profile can help identify easy to measure mobility-based indicators of early cognitive dysfunction and pinpoint potential target for interventions. Although gait speed and dual-task gait speed are known to be associated with early cognitive impairments,20,21 a comprehensive assessment of physical functionality encompassing multiple domains is crucial. This is because different aspects of physical performance may capture distinct elements of cognitive decline, providing a more holistic and nuanced understanding of early disease stages. For instance, balance and step length might reflect changes in different neural pathways and physical systems than gait speed. Additionally, the inclusion of various physical assessments allows for the identification of specific deficits that might be more sensitive or specific to different types or stages of cognitive impairment, such as distinguishing between amnestic and non-amnestic MCI. Identifying subtle physical changes early in the disease process is particularly important given the shift towards early detection and intervention to maximize the success of dementia prevention and management strategies. The goals of this study were to assess patterns of physical performance across early stages of disease, evaluate relationships with ADRD biomarkers, and identify specific measures that distinguish individuals with SCD from NC and MCI.
Methods
Study participants were classified as i) older adults (≥50 years) with NC or ii) in mild stages of cognitive impairment enrolled in the Healthy Brain Initiative (HBI) Study at University of Miami. The HBI protocol has been described in detail elsewhere. 22 Briefly, HBI is an ongoing prospective longitudinal cognitive aging study designed to identify novel predictors of risk for and resilience against AD/ADRD which could be targeted for early intervention. The study focuses on deep phenotyping of participants including clinical, psychosocial, behavioral, and functional data that is collected annually from participants through standardized questionnaires/assessments and study partner reports. In addition, annual fluid and biannual brain imaging biomarkers are collected, allowing accurate assignment into research diagnostic groups in accordance with current guidelines. 23 Data used in the current study was obtained from HBI baseline visits completed between March 2022 through November 2023 for a total of 178 participants with research diagnoses. Fourteen participants were excluded for: (a) MCI due to etiologies other than AD/ADRD such as depression, sleep apnea or head injury (n = 12) or (b) dementia diagnosed at baseline visit given the focus on very early stages of disease in this study (n = 2). Of the remaining 164 participants, 10 did not have physical performance data, leaving us with an analytic sample of 154 participants with research diagnoses/cognitive data and physical performance data. Excluded participants were similar to those included in terms of average age, education, comorbidities, physical activity level, and sex, racial and ethnic distribution (p > 0.05). The HBI study is approved by the Institutional Review Board at the University of Miami and all study participants provided written informed consent prior to engagement in any research activities.
Physical functional assessments
Participants underwent performance-based evaluation of muscle strength, balance, and gait, which allows assessment of global physical function using standardized tools such as the mini Physical Performance Test (mini PPT) and Timed Up-and-Go (TUG). Briefly, the mini PPT is derived from performance on 4 tasks: 1) 50 ft usual pace walking test (gait speed); 2) bending over test (flexibility); 3) the 5× Sit to Stand test (lower extremity muscle strength), and 4) Progressive Romberg Balance test (static balance). The balance subdomain of mini PPT, used in analyses, consists of a series of 3 progressive static balance tests performed with the eyes open for which participants are timed as they complete 10-s side-by-side, semi-tandem, and tandem balance tasks. The side-by-side and semi-tandem tasks are scored as 0 = not held for 10 s or 1 = held for 10 s, while the tandem task as 0 = held for <3 s, 1 = held for 3–9.99 s, or 2 = held for 10 s. The final score for balance sums up the 3 individual task scores and ranges from 0–4 (0 = unable to hold balance for all tasks to 4 = able to hold balance in all 3 tasks). The mini PPT score ranges from 0 to 16 and higher values indicate greater global physical function. The TUG requires standing from a chair, walking for 3 meters, turning around, and sitting back in the chair. The use of hands to stand up or sit down in the chair is not allowed rendering TUG a test of global lower extremity function and fall risk 24 in older adults. The TUG score represents the time (in seconds) taken to complete the sequence of tasks, with higher scores indicating poorer mobility. In addition, participants are asked to perform dual-task TUG, which entails completion of TUG with addition of a cognitive task (i.e., serial 3's subtractions starting at number 87). Finally, participants underwent a series of single and dual task gait evaluations using an electronic pressure-based mat (Zeno Walkway™) and the ProtoKinetics Movement Analysis Software for data processing and analysis (Protokinetics, Version 6.00 C1). Participants were instructed to walk at their usual pace (as if walking down the street) over a 50 ft distance with a practice walk completed prior to the first single task gait assessment. During dual tasks participants were not instructed to prioritize gait or the cognitive task. Several gait measures were derived including gait speed in cm/s and gait cycle metrics such as step length in cm and % single support (SS). To improve interpretation of results, the gait speed scales were adjusted so that a 1-unit change would correspond to 1 dm/s. The dual task gait evaluations were performed while completing serial subtractions, similarly to the dual task TUG. To distinguish between the different modalities of physical functional testing, tests are described as ‘observational’ (or non-computerized) versus computerized.
Cognitive assessments
A comprehensive neuropsychological battery that includes pencil and paper and computerized tests was completed by all participants. The battery is modeled after the Uniform Data Set v3.0 from the National Institute on Aging Alzheimer's Disease Center program 25 and include the following: the Montreal Cognitive Assessment (MoCA), a cognitive screening tool designed to identify mild cognitive impairment (score range: 0–30; higher scores indicate better performance); the Numbers Forward (NF) and Backward (NB), which measure attention and working memory, respectively (score range is 0–9 for NF and 0–8 for NB; higher scores indicate better performance); the Hopkins Verbal Learning Test – Revised (HLVT) assesses verbal learning (immediate recall, score max of 36) and memory (delayed recall, score range 0–12); the Trail Making Tests A and B measure psychomotor speed and executive functioning, respectively (score indicates time in seconds to complete the task with longer times indicative of poorer performance); the Animal Naming Test, which assesses semantic fluency (higher scores indicate better performance); the Number Symbol Coding Test (NSCT), 26 another measure of executive functioning (score range: 0–70; higher scores suggest better performance); the Craft Story, a measure of verbal episodic memory (score range: 0–44 for verbatim immediate and delayed recall, with higher scores indicating better verbal learning and memory); and the Benson Complex Figure Test (BCFT), which assesses visuo-constructive abilities, visual memory, and recognition immediately and after a delay (score range: 0–17 for recall; higher scores suggest better performance). A composite score was derived from these individual cognitive tests and used as a measure of global cognition, with higher scores being indicative of better overall cognition. In addition, a computerized battery of cognitive tests was also administered using the Cognivue Clarity System®, which assesses several cognitive domains including visuospatial abilities, executive functioning, immediate and delayed recall, and abstraction. A total score for the computerized battery (range 0–100) is calculated for which higher values suggest better global cognition.
ADRD imaging biomarkers
Brain magnetic resonance imaging (MRI) scans were collected with a GE 3 T 750 W scanner and images analyzed with Combinostics cNeuro Suite®, which uses artificial intelligence technology to produce automated volumetric imaging quantification of brain areas that are commonly affected in ADRD including cortical regions such as the hippocampus, the inferior lateral ventricle, cerebral gray and white matter, and the cerebral cortex. A global cortical atrophy index is also generated, with an 85% sensitivity and 86% specificity. 22 The global cortical atrophy score (CAS), which is age-corrected, ranges from 0–3, with 0 = normal volume/no ventricular enlargement; 1 = mild atrophy (opening of sulci); 2 = moderate atrophy (volume loss of gyri); and 3 = severe atrophy (’knife blade’ atrophy), providing a global score for atrophy in 13 brain regions. Total brain tissue and deep white matter hyperintensity volumes (WMH) were log-transformed because of highly skewed distributions. Biomarker data was available on subsamples of the total study population including n = 108 (70%) for CAS, a measure of neurodegeneration in AD/ADRD, and n = 125 (81%) for WMH volume, a measure of vascular-related pathological processes.
HBI physical functional assessments, cognitive assessments, and MRI procedures and measures are described in more detail by Besser et al. (2023). 22
Cognitive status
Cognitive status including staging and etiology were determined by consensus (neurologist, neuropsychologist, and nurse practitioners) in accordance with NIA-AA clinical criteria for MCI and dementia,9,11,23,27–29 based on participant performance on neuropsychological testing, participant and study partner interview deriving both a Clinical Dementia Rating (CDR), 30 and a Global Deterioration Scale (GDS). 31 The CDR determines the presence or absence of cognitive impairment, and if present, grades its severity. Only CDR 0 (no dementia) or CDR 0.5 (very mild impairment) were included; however, the CDR does not include a category for SCD. The GDS divides individuals with normal cognitive performance into individuals with no subjective complaints (GDS 1) and those with SCD (GDS 2) and captures MCI (GDS 3). The classification of participants into NC, SCD, and MCI was done independently of biomarker data, to be in line with current practice in the clinical setting and was based on the following criteria: NC = participants with no subjective cognitive complaints and no evidence of cognitive impairment. MoCA scores were generally above 26 and composite cognitive scores were within the normal range; SCD = participants who reported subjective cognitive complaints but had no objective cognitive impairment on detailed testing and did not meet the criteria for MCI; MCI = participants who had both subjective cognitive complaints (participant or informant) and objective evidence of cognitive impairment on neuropsychological testing. MoCA scores were below 23, and their composite cognitive scores indicated impairment in one or more cognitive domains. Further, the CDR scale was used to confirm MCI status, with participants typically having a CDR of 0.5. Disease etiology (e.g., AD, vascular contributions to cognitive impairment and dementia) was also determined for the MCI group using current clinical diagnostic guidelines.9,11,23,27–29 The final sample consists of 78 NC, 35 SCD, and 41 MCI, of which 29 were MCI-AD and 12 were MCI-Vascular. Other MCI etiologies were excluded as described above.
Covariates
Covariates include age, sex (coded as 1 = Male and 2 = female), ethnoracial group (coded as 1 = Non-Hispanic White (NHW); 2 = Non-Hispanic Black (NHB); 3 = Hispanic), education, self-reported physical activity, depressive symptoms, and comorbidities. Physical activity was measured with the Quick Physical Activity Scale (QPAR), 32 which measures days per week and hours per day spent in various activities such as sitting, walking outside, and light, moderate, and strenuous activities. The total QPAR score ranges from 0 to 132 with higher scores indicating a greater level of physical activity. Depressive symptoms were measured with the depression subscale of the Hospital Anxiety and Depression Scale (HADS) with scores ranging from 0–21 (higher scores indicate more depressive symptoms). Comorbidities were measured as the total number of comorbidities reported by participants. These included but were not limited to traumatic head injury, stroke/transient ischemic attack, depression, heart disease, peripheral vascular disease, diabetes, hypertension, liver disease, chronic lung disease, kidney disease, thyroid disease, arthritis, hypercholesterolemia, and hypertension.
Statistical analysis
The sample distribution of sociodemographic characteristics (i.e., age, education, race/ethnicity), health and behavioral factors, and mobility outcomes (e.g., mini PPT score, gait speed) were compared across three diagnostic groups (NC, SCD, MCI) with ANOVA for continuous variables or chi square for categorical variables (i.e., gender, race/ethnicity). As significant differences were found between the three comparison groups in age, depressive symptoms, and comorbidities, all further models assessing the relationships between physical performance, cognitive status, and imaging biomarkers were adjusted for these three factors with a few exceptions as discussed below.
To ensure that cognitive test scores reflect expected differences between NC, SCD, and MCI, we compared group performances on paper and pencil and computerized cognitive tests with analysis of covariance (ANCOVA) controlling for age, sex, education, depressive symptoms, and comorbidities. Furthermore, diagnostic group differences in global (i.e., mini PPT; TUG) and individual (i.e., gait speed, leg length, and single-leg support) physical functional measures were investigated with logistic regression analysis, separately for each physical performance measure, first unadjusted (Model 1) and then adjusted for age, depressive symptoms and comorbidities (Model 2). To evaluate differences by suspected disease etiology, the MCI group was further separated into MCI due to AD (MCI-AD) and MCI due to vascular (MCI-Vascular) causes and compared against NC and SCD with logistic regression analysis adjusted for a smaller number of covariates (age and comorbidities) given the small size of the MCI-Vascular group. We used variance inflation factor (VIF), tolerance, and correlation matrix analyses to evaluate the presence of multicollinearity in our models. A VIF value greater than 10, a tolerance value lower than 0.1, and correlation coefficients greater than 0.6 indicate high multicollinearity, which could potentially bias the regression estimates.
We then assessed biological plausibility for the physical performance-cognition association by evaluating ANCOVA-based partial correlations between imaging biomarkers and various physical functional measures while controlling for age (except for CAS), depressive symptoms, comorbidities, and additionally for sex and physical activity, which are strongly correlated to physical performance. Finally, we evaluated ANCOVA-derived mean differences in imaging biomarkers across diagnostic groups while controlling for age (except for CAS), sex, physical activity level, depressive symptoms, and comorbidities. All analyses were performed with the SAS on Demand for Academics Suite (SAS Institute Inc., Cary, NC, USA). A p < 0.05 was used to evaluate statistical significance.
Results
Sociodemographic characteristics and mobility outcomes by clinical diagnostic group are presented in Table 1. The sample had a mean age of 68.6 ± 9.3 yrs, mean education of 16.2 ± 3.0 yrs and was 66.7% female. The ethnoracial breakdown of the sample included 115 (76.7%) NHW, 13 (8.7%) NHB, and 22 (14.7%) Hispanics. Overall, participants performed in the normal range on global physical functional measures (average mini PPT = 12.7 ± 2.4, TUG single task = 7.6 ± 1.9), and had an average gait speed of 10.9 ± 1.7 dm/s, which corresponds to a gait speed of 1.1 ± 0.2 m/s, considered to be within the normal range for older adults (<0.8 m/s is indicative of impaired gait speed and has been linked to increased risk for disability, hospitalization, and death. 33 The MCI group significantly older than the other two groups (p < 0.001), while the NC group less comorbidities (p = 0.031) and depressive symptoms (p < 0.001) than the SCD and MCI groups. The MCI participants performed significantly worse on all physical functional measures including dynamic gait metrics (i.e., gait speed, step length, and % single-leg support) compared to SCD and NC. Performance was worse on dual task tests that incorporated a cognitive challenge (i.e., serial subtractions) across diagnoses (all group differences were significant at p < 0.01).
Sample characteristics and mobility performance by diagnostic group.
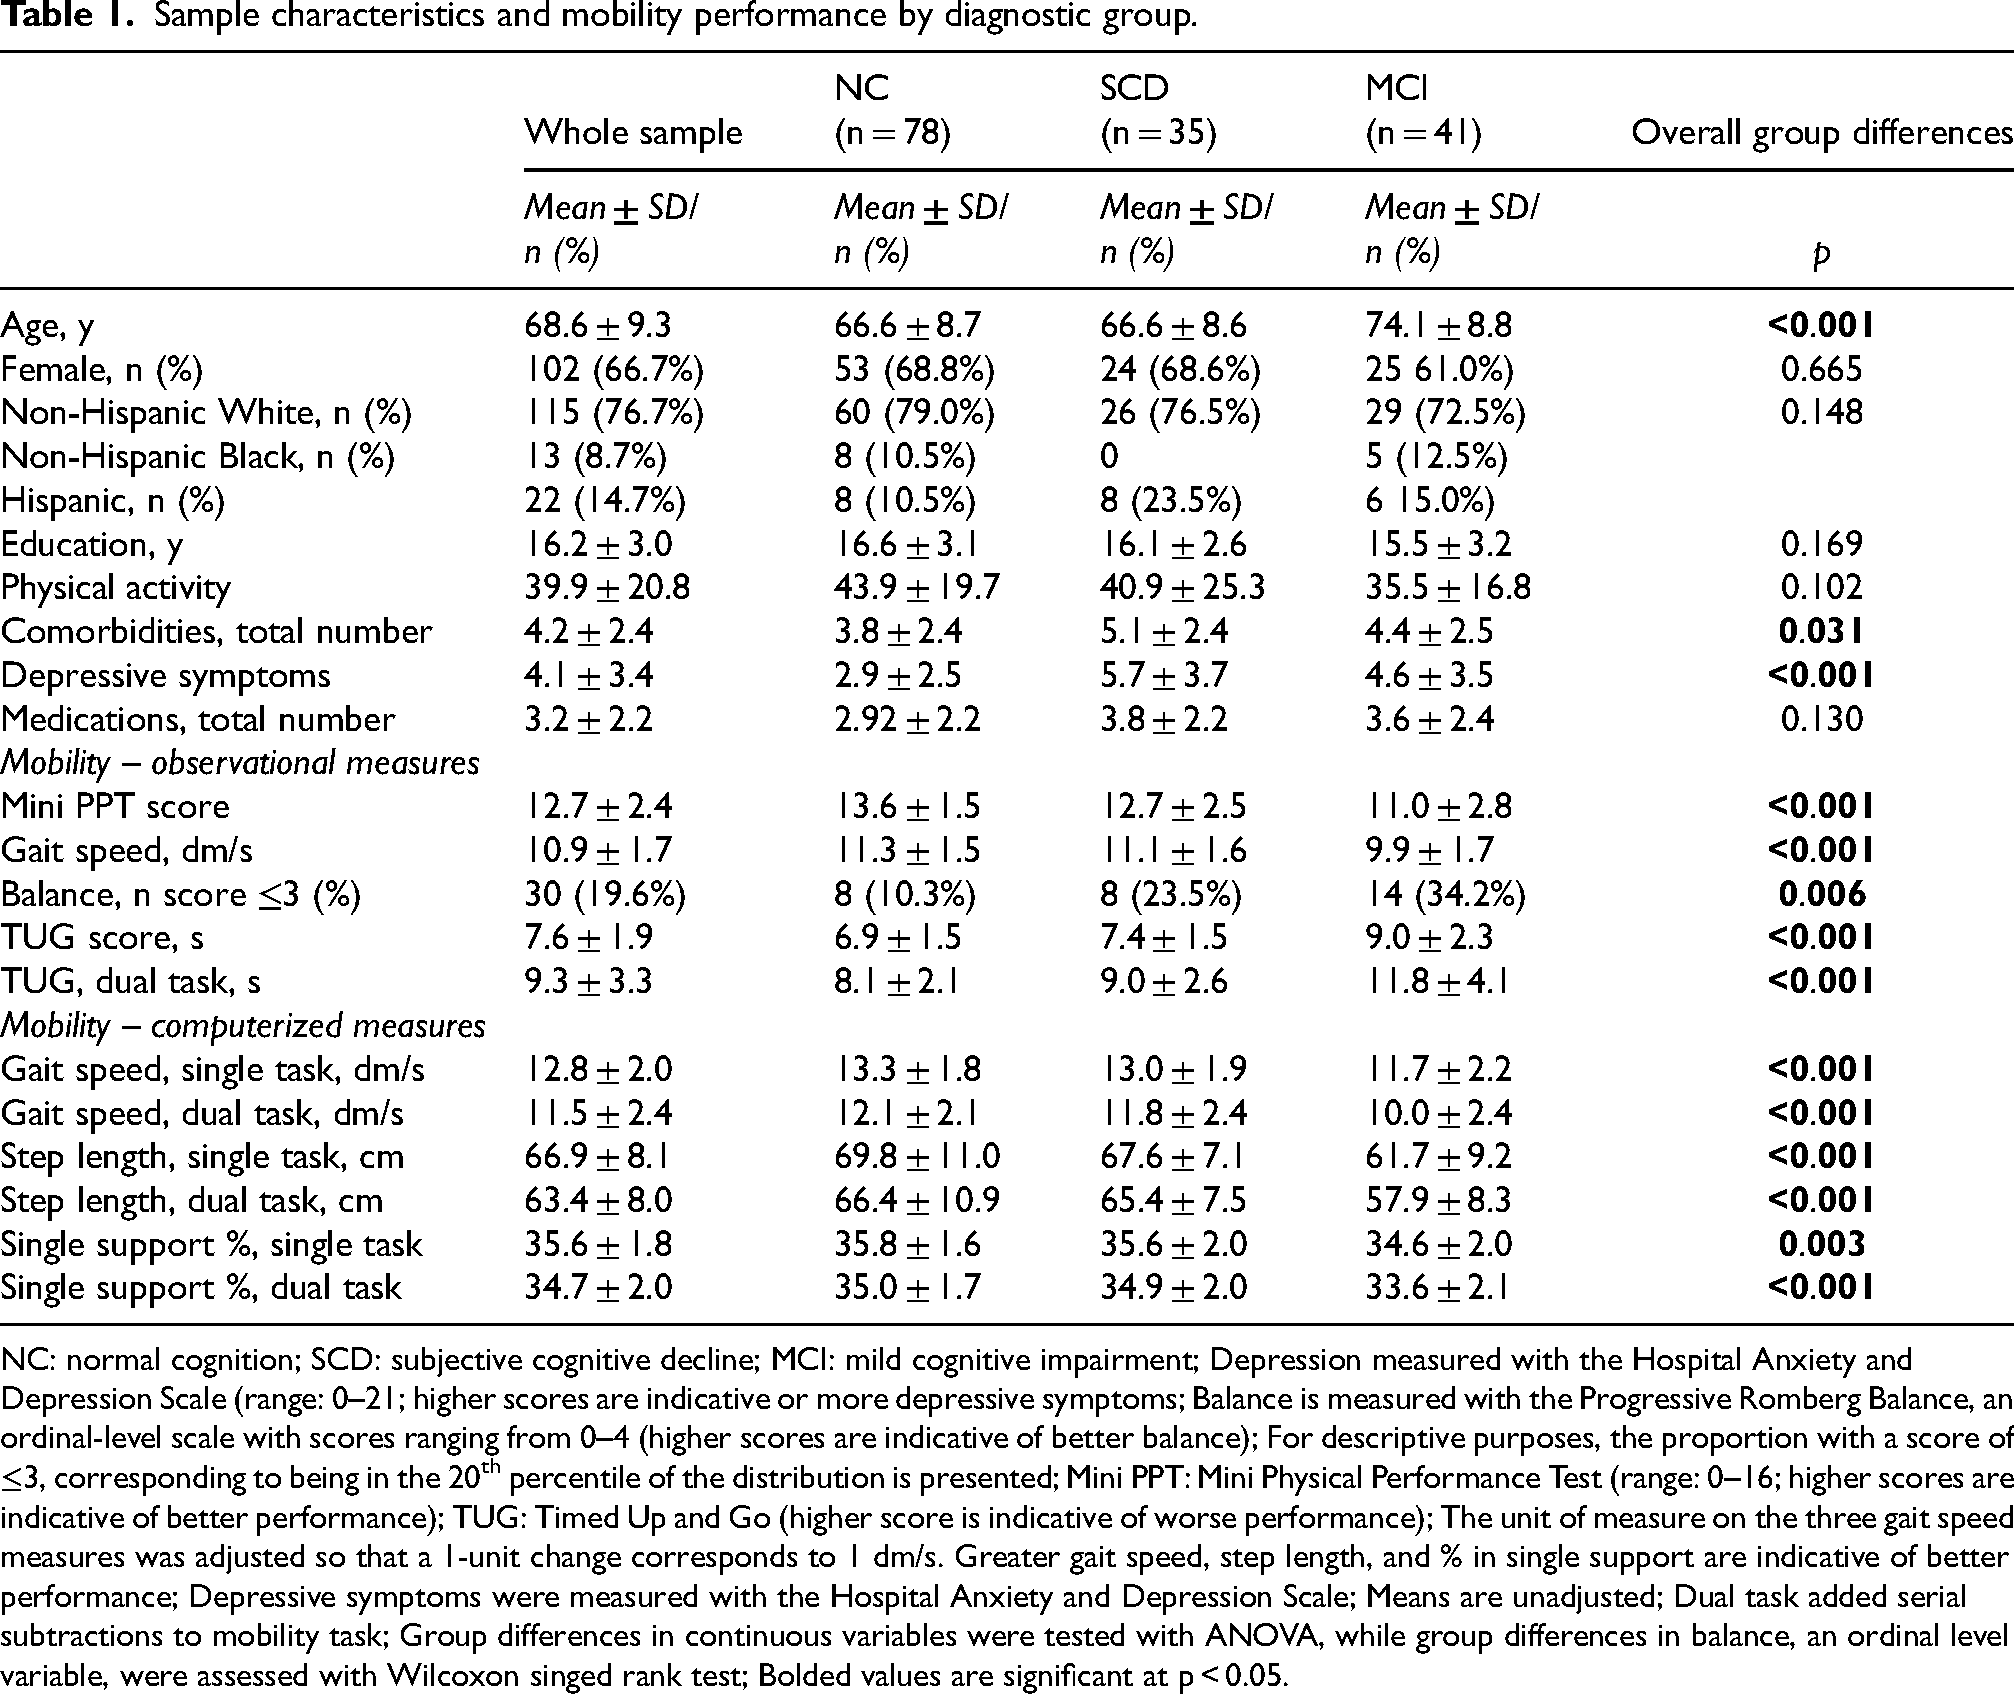
NC: normal cognition; SCD: subjective cognitive decline; MCI: mild cognitive impairment; Depression measured with the Hospital Anxiety and Depression Scale (range: 0–21; higher scores are indicative or more depressive symptoms; Balance is measured with the Progressive Romberg Balance, an ordinal-level scale with scores ranging from 0–4 (higher scores are indicative of better balance); For descriptive purposes, the proportion with a score of ≤3, corresponding to being in the 20th percentile of the distribution is presented; Mini PPT: Mini Physical Performance Test (range: 0–16; higher scores are indicative of better performance); TUG: Timed Up and Go (higher score is indicative of worse performance); The unit of measure on the three gait speed measures was adjusted so that a 1-unit change corresponds to 1 dm/s. Greater gait speed, step length, and % in single support are indicative of better performance; Depressive symptoms were measured with the Hospital Anxiety and Depression Scale; Means are unadjusted; Dual task added serial subtractions to mobility task; Group differences in continuous variables were tested with ANOVA, while group differences in balance, an ordinal level variable, were assessed with Wilcoxon singed rank test; Bolded values are significant at p < 0.05.
Performance on cognitive testing followed a downward stepwise pattern with NC performing better than SCD, and SCD performing better than MCI (Table 2). Overall differences were highly significant (most at p < 0.001) with the MCI group performing worse than the NC and SCD groups. However, the group with SCD only significantly differed from the NC group on the MoCA (p = 0.017). These observed differences are reported with adjustment for age, sex, education, depressive symptoms, and comorbidities.
Adjusted mean cognitive performance by diagnostic group.
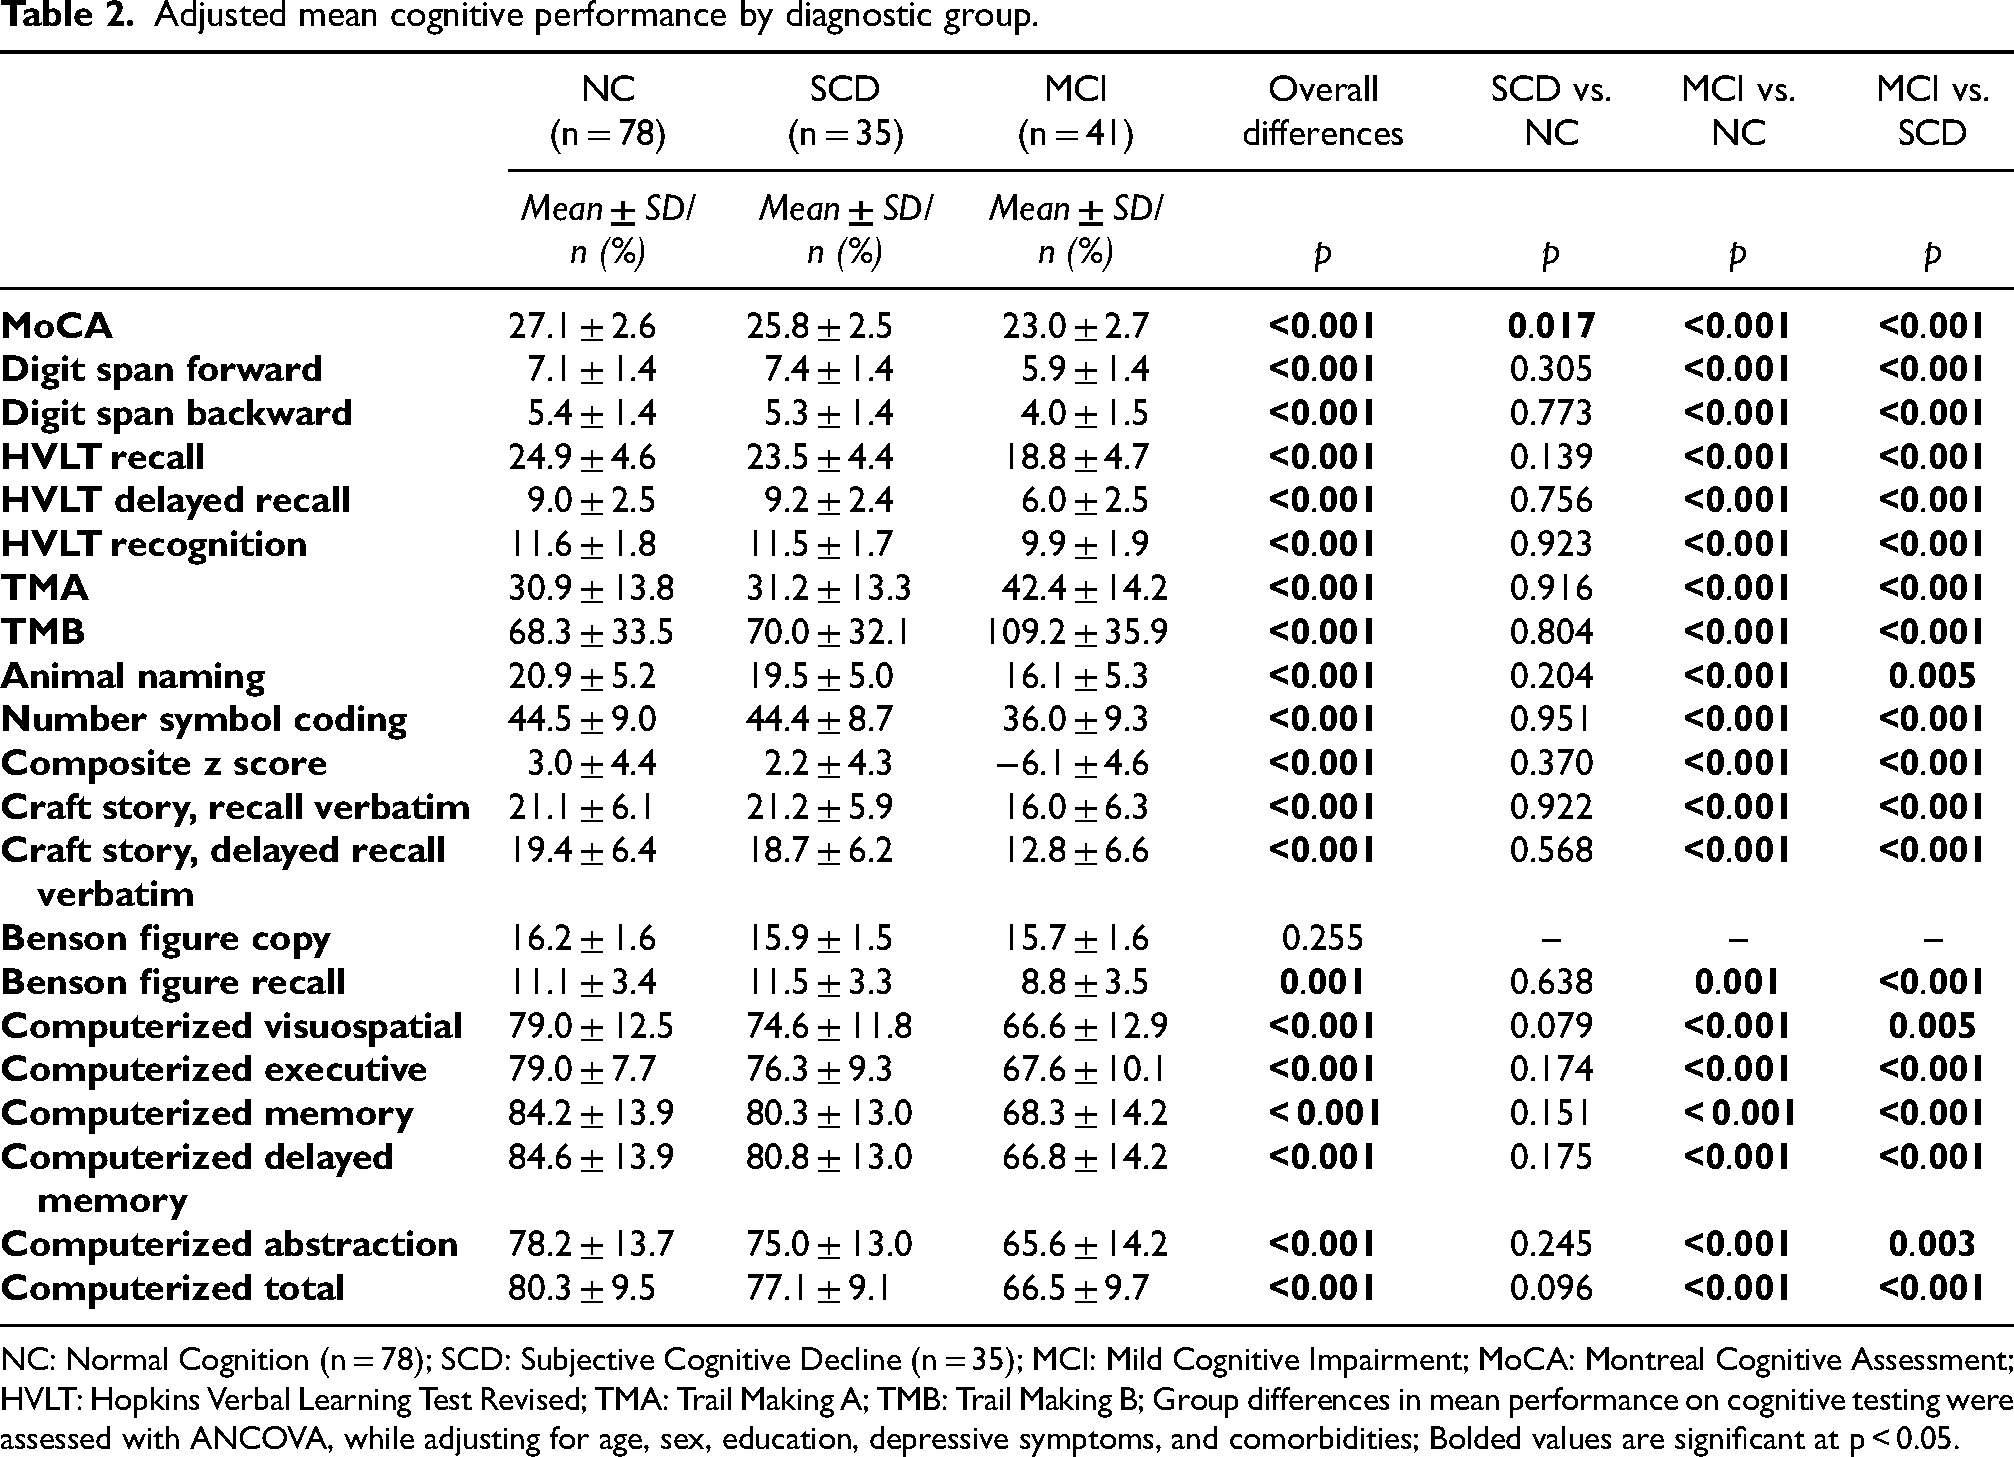
NC: Normal Cognition (n = 78); SCD: Subjective Cognitive Decline (n = 35); MCI: Mild Cognitive Impairment; MoCA: Montreal Cognitive Assessment; HVLT: Hopkins Verbal Learning Test Revised; TMA: Trail Making A; TMB: Trail Making B; Group differences in mean performance on cognitive testing were assessed with ANCOVA, while adjusting for age, sex, education, depressive symptoms, and comorbidities; Bolded values are significant at p < 0.05.
Group differences by global and individual measures of physical performance are presented in Table 3 without adjustment (Model 1) and with adjustment for age, depressive symptoms, and comorbidities (Model 2). Findings showed that for every 1-unit increase in mini PPT score, there was a 27% decreased likelihood of being in the SCD versus NC group (OR = 0.73, 95% CI: 0.57–0.93), a 44% decreased likelihood of being MCI versus NC, and a 23% decreased odd of being MCI versus SCD in the unadjusted model. Further adjustment for covariates lowered the likelihood of mini PPT to significantly distinguish between MCI and SCD. Similarly, better performance on balance was associated with significantly lower odds of being in the SCD and MCI compared to the NC group (OR SCD vs. NC = 0.45, 95% CI: 0.22–0.93; OR MCI vs. NC = 0.37, 95% CI = 0.18–0.73) in the unadjusted model. The ability of balance to differentiate SCD from NC remained significant (OR = 0.35, 95% CI: 0.16–0.80) and that to differentiate MCI from NC was borderline significant (OR = 0.47, 95%CI: 0.21–1.03, p = 0.059) after covariate adjustment. We also found gait speed, single- and dual-task TUG, and all computerized physical functional measures to distinguish MCI from NC, and MCI from SCD (better performance associated with a lower likelihood of being in the MCI group compared to the NC and SCD groups). These relationships remained significant after adjustment for covariates.
Physical performance as a classifier of disease stage.

NC: Normal Cognition (n = 78); SCD: Subjective Cognitive Decline (n = 35); MCI: Mild Cognitive Impairment (n = 41); Mini PPT: Mini Physical Performance Test (range: 0–16, higher scores are indicative of better performance); Balance is measured with the Progressive Romberg Balance, an ordinal-level scale with scores range from 0–4 with higher scores indicative of better balance; TUG: Timed Up and Go Test (higher score is indicative of worse performance); The unit of measure on the three gait speed measures was adjusted so that a 1-unit change corresponds to 1 dm/s. Greater gait speed, step length, and % in single support are indicative of better performance; OR: Odds Ratio; CI: Confidence Interval around OR; Dual task added serial subtractions to mobility task; Logistic regression was used to assess diagnostic group differences in physical performance; Models are adjusted for age, depressive symptoms, and comorbidities; Bolded values are significant at p < 0.05.
Potential differences in these patterns between AD and vascular etiologies in MCI were also assessed (Table 4). Participants diagnosed with MCI-AD and MCI-Vascular were significantly older than NC (p < 0.001) and those with SCD (p = 0.002), and the MCI-Vascular group was significantly less physically active (p = 0.030) and had more comorbidities (p = 0.010) and greater depression (p < 0.001) than NC. Given the small size of the MCI-Vascular group however, group differences were adjusted only for age and comorbidities, the most significant and consistent correlates of physical performance. We found most observational and all computerized physical performance measures to separate MCI-AD (n = 29) from NC (n = 78) and SCD (n = 35). We did not find any physical performance measure to pick up differences between MCI-Vascular (n = 12) and SCD, although better performances on mini PPT and single-task TUG were associated with a lower likelihood of being in the MCI-Vascular versus the NC group.
Physical performance as a classifier of disease etiology in MCI (N MCI-AD = 29; N MCI-Vascular = 12).

NC: Normal Cognition (n = 78); SCD: Subjective Cognitive Decline (n = 35); MCI-AD: Mild Cognitive Impairment due to Alzheimer's Disease (n = 29); MCI-Vascular: Mild Cognitive Impairment due to Vascular causes (n = 12); Mini PPT: Mini Physical Performance Test (range: 0–16, higher scores are indicative of better performance); TUG: Timed Up and Go Test (higher score is indicative of worse performance); Balance is measured with the Progressive Romberg Balance, an ordinal scale with scores ranging from 0–4, with higher scores indicative of better balance; The unit of measure on the three gait speed measures was adjusted so that a 1-unit change corresponds to 1 dm/s; Greater gait speed, step length, and % in single support are indicative of better performance; OR: Odds Ratio; CI: Confidence Interval around OR; Dual task added serial subtractions to mobility task; Logistic regression was used to assess diagnostic group differences in physical performance; Models are adjusted for age and comorbidities due to the small number of participants in the MCI-Vascular group, the smallest category; Bolded values are significant at p < 0.05.
We next evaluated the relationship between physical performance and imaging biomarkers as an approach to establishing a biological explanation for the physical functionality to cognition relationship (Table 5). We found that better performance on most physical functional measures was associated with lower CAS controlling for sex, physical activity, depressive symptoms, and comorbidities. For example, for each one-point increase in the mini PPT score, there was an associated 0.09 unit decrease in CAS (p = 0.028). No association with CAS was found for balance and single leg support %. Single- and dual task step length were negatively associated with brain tissue- and deep- WMH volumes (both log-transformed) and single-task gait speed was negatively associated with deep WMH volume for both observational and computerized tests with adjustment for age, sex, physical activity, depressive symptoms, and comorbidities.
Imaging – physical performance associations.
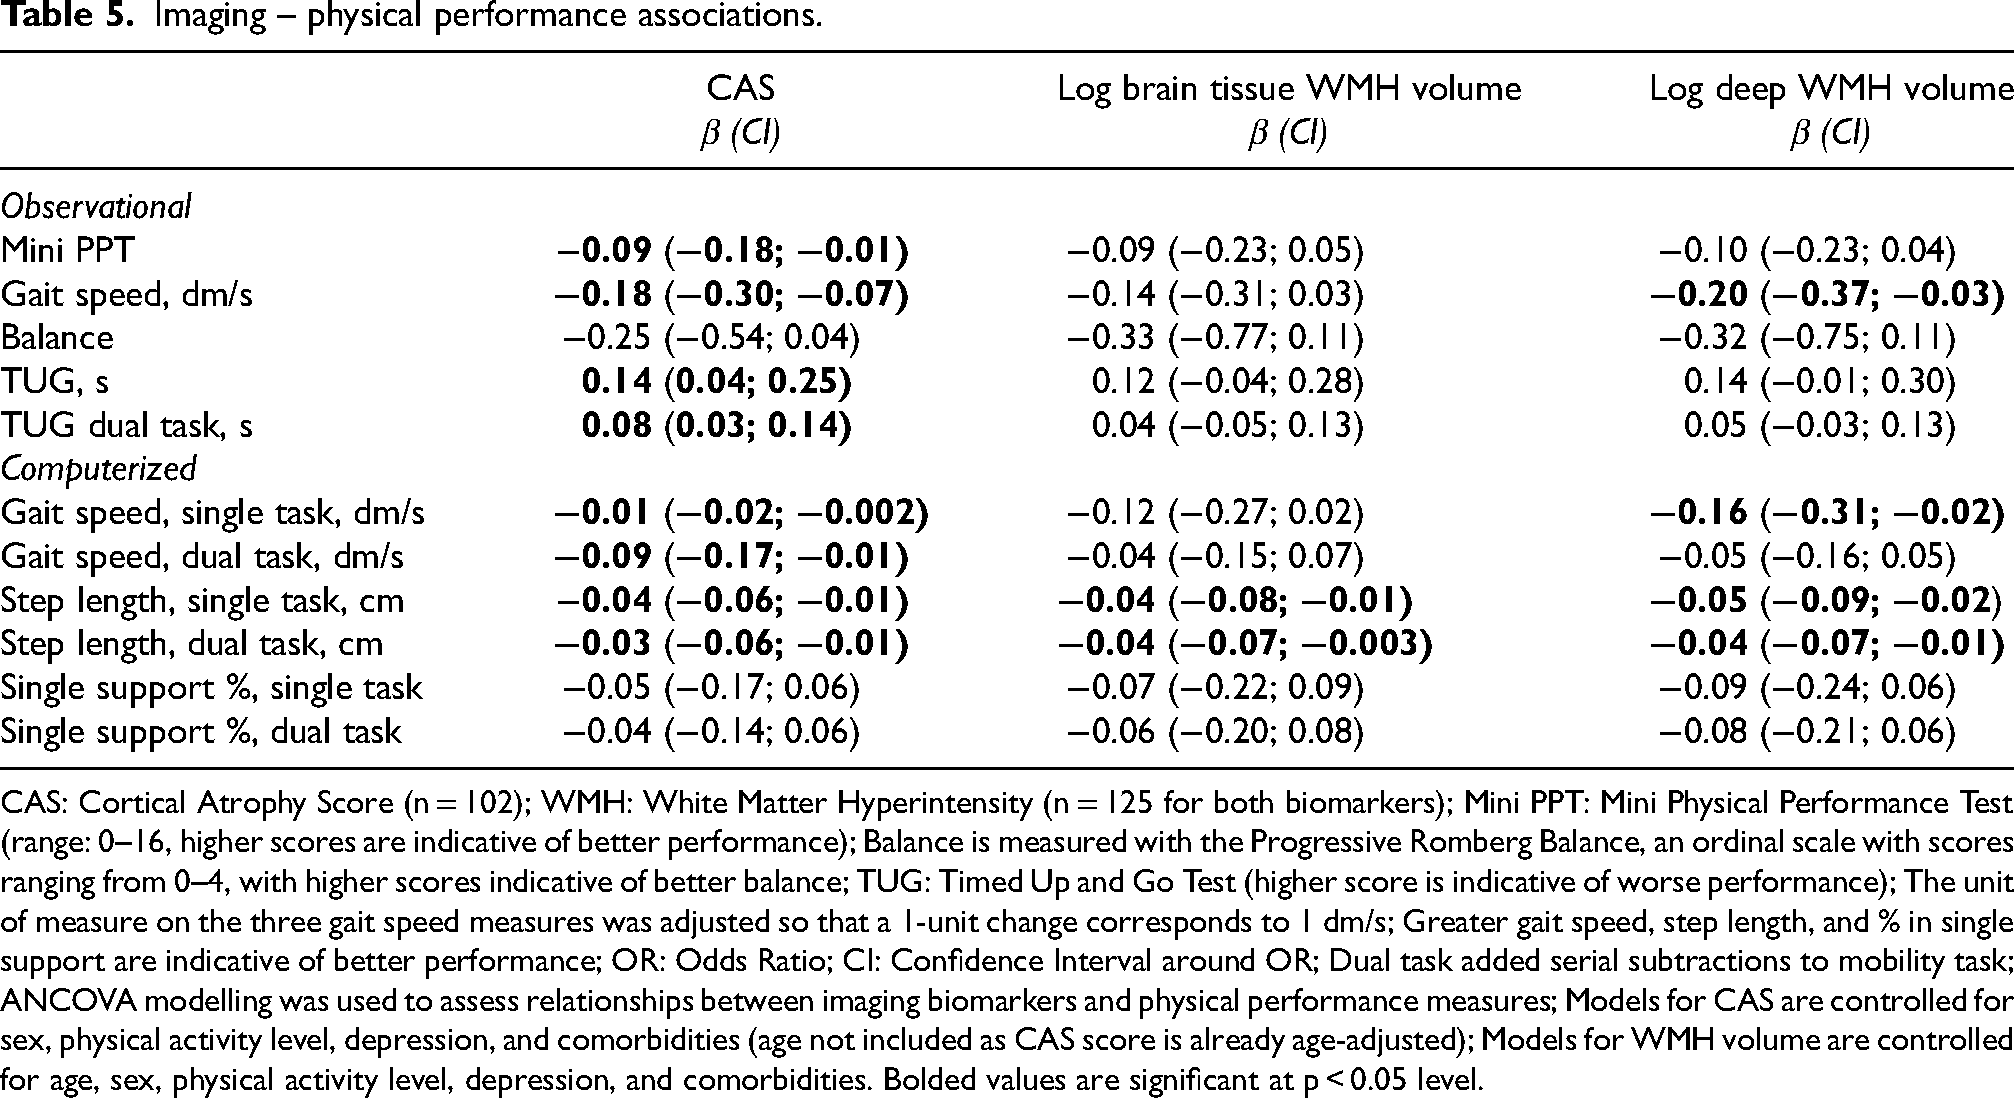
CAS: Cortical Atrophy Score (n = 102); WMH: White Matter Hyperintensity (n = 125 for both biomarkers); Mini PPT: Mini Physical Performance Test (range: 0–16, higher scores are indicative of better performance); Balance is measured with the Progressive Romberg Balance, an ordinal scale with scores ranging from 0–4, with higher scores indicative of better balance; TUG: Timed Up and Go Test (higher score is indicative of worse performance); The unit of measure on the three gait speed measures was adjusted so that a 1-unit change corresponds to 1 dm/s; Greater gait speed, step length, and % in single support are indicative of better performance; OR: Odds Ratio; CI: Confidence Interval around OR; Dual task added serial subtractions to mobility task; ANCOVA modelling was used to assess relationships between imaging biomarkers and physical performance measures; Models for CAS are controlled for sex, physical activity level, depression, and comorbidities (age not included as CAS score is already age-adjusted); Models for WMH volume are controlled for age, sex, physical activity level, depression, and comorbidities. Bolded values are significant at p < 0.05 level.
Finally, imaging biomarkers by diagnostic group with adjustment for age (except for CAS), sex, physical activity, depressive symptoms, and comorbidities are shown in Figure 1. A greater cortical atrophy score was found in SCD (1.81 ± 1.12, p = 0.041) and MCI (2.06 ± 1.34, p = 0.001) compared to NC (1.27 ± 1.24). SCD and MCI did not differ significantly on CAS (p = 0.390). Patterns of WMH volumes were not consistent across groups, although we found lower deep WMH volume (p = 0.019) and a trend for lower brain tissue WMH volume (p = 0.057) in the SCD group compared to the MCI group. Collinearity analyses revealed VIF values of <2, tolerance values above 0.65, and correlation coefficients below 0.4 suggesting a lower likelihood of biased regression estimates due to multicollinearity.
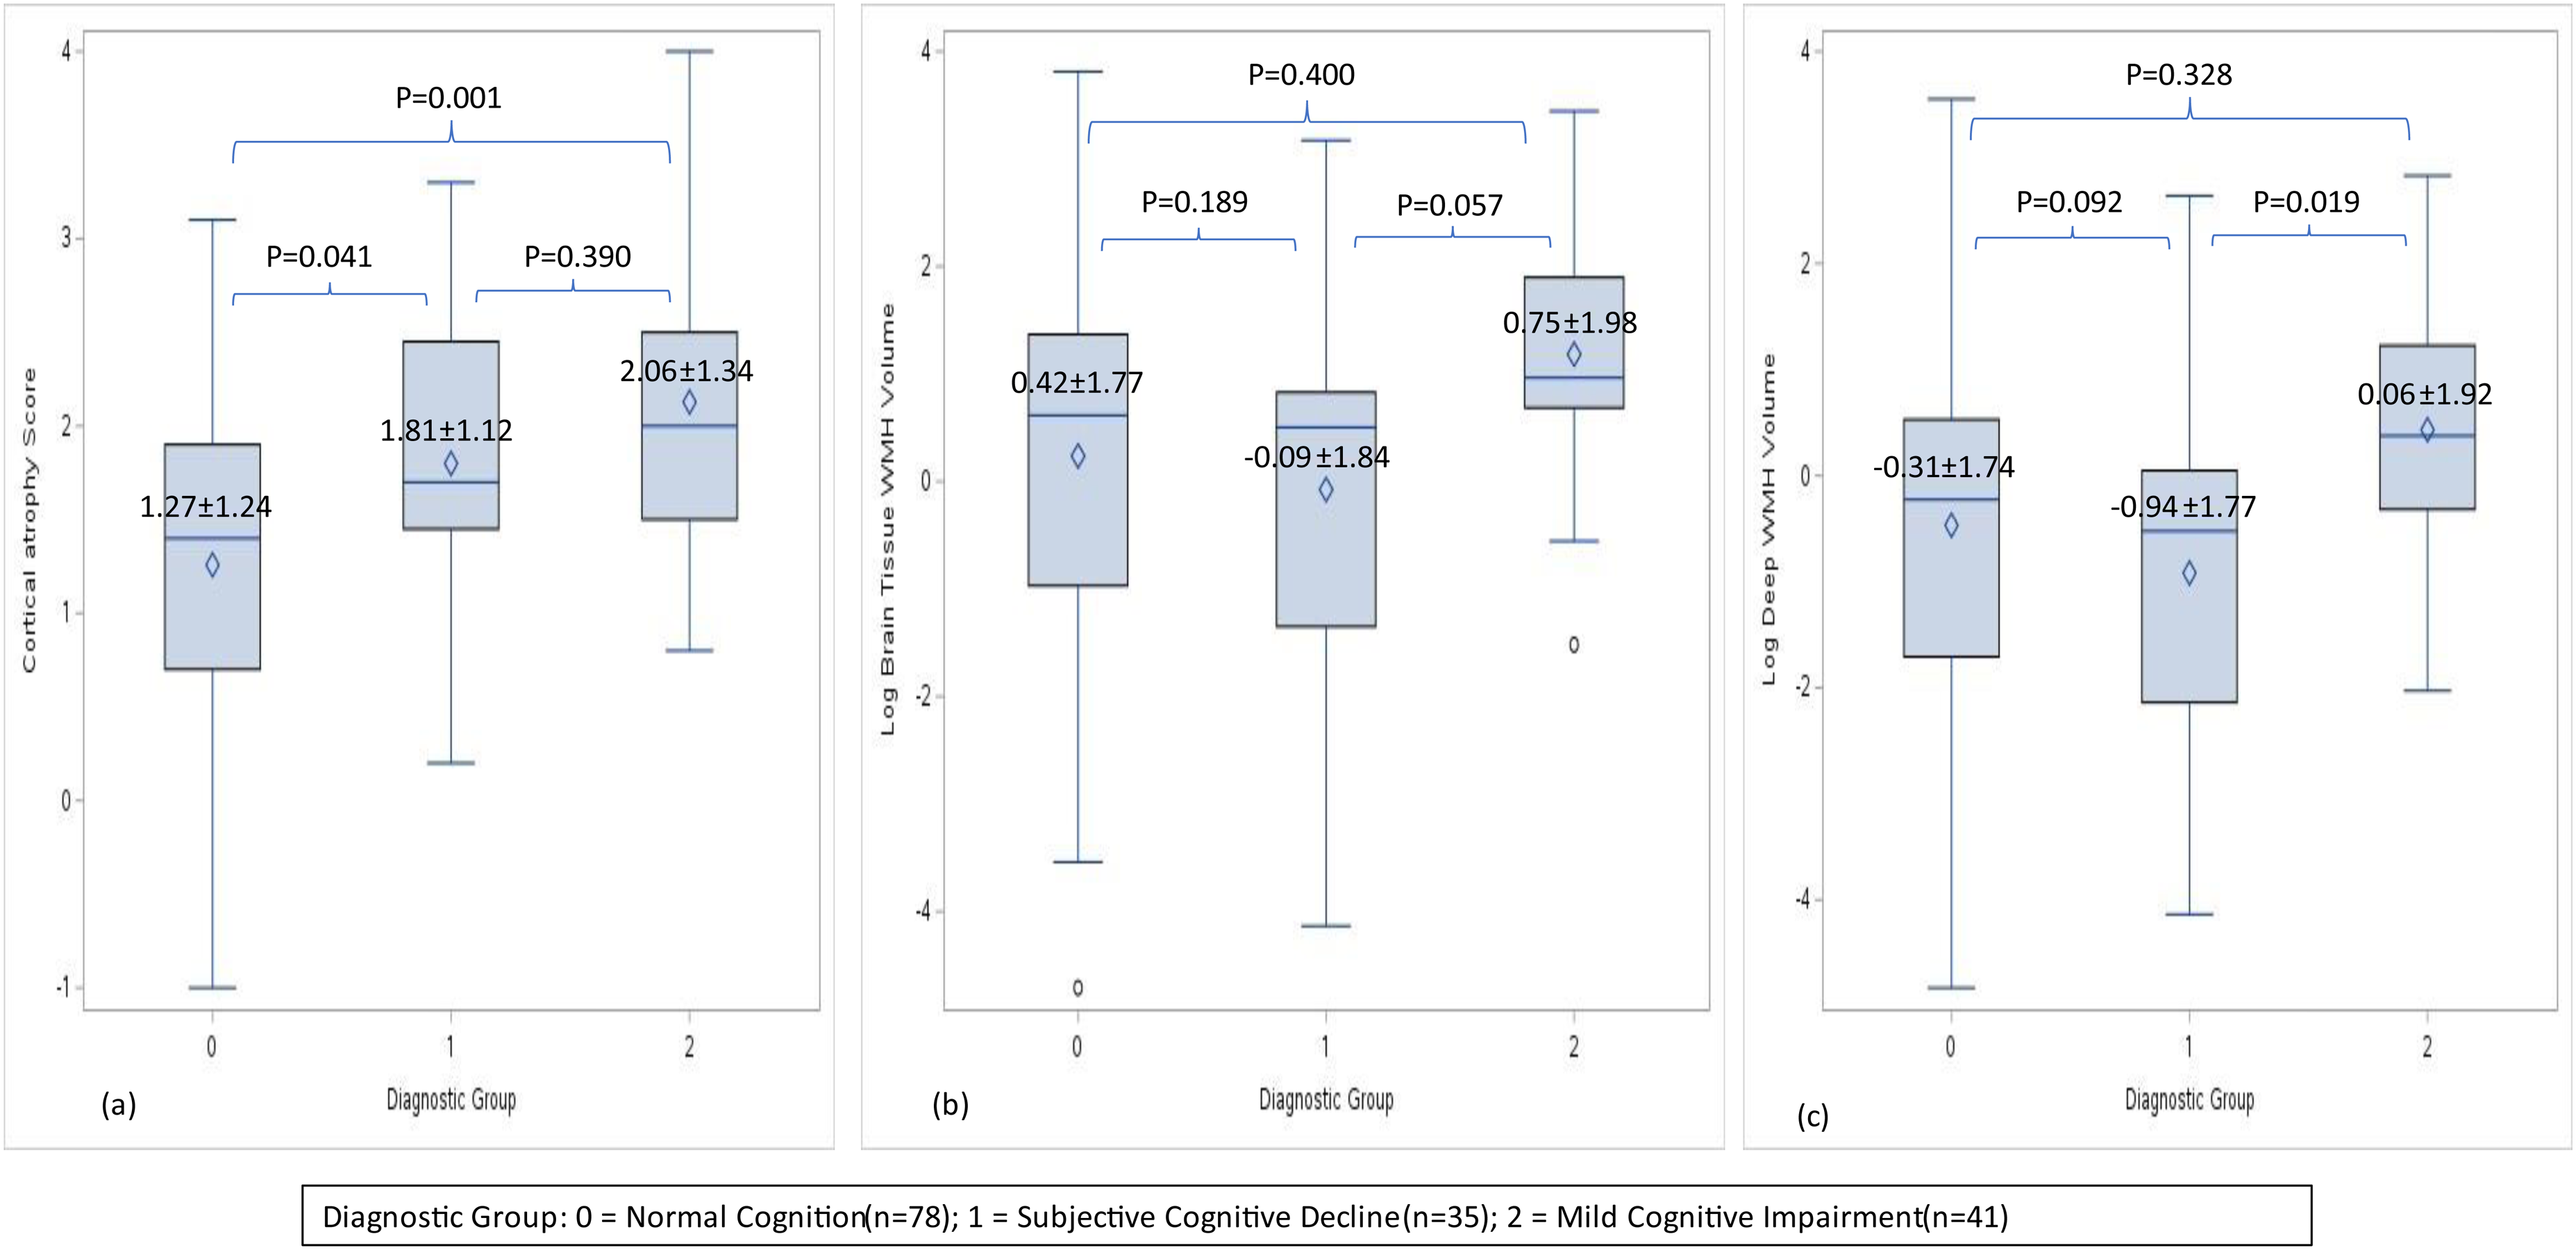
Adjusted mean imaging biomarkers across diagnostic groups. Panels present mean ± SD biomarker levels across diagnostic groups (NC, n = 78; SCD, n = 35; MCI, n = 41) adjusted for age (except for CAS), sex, physical activity, depression, and comorbidities and p values for diagnostic group differences were obtained using ANCOVA: (a) Cortical Atrophy Score (overall mean = 1.64 ± 0.09SE); (b) Brain tissue white matter hyperintensity volume (overall mean = 0.45 ± 0.14SE); (c) Deep white matter hyperintensity volume (−0.28 ± 0.14SE). WMH volumes are presented on logarithmic scales.
Discussion
We found evidence across several objective measures of physical performance to support physical functionality as a potential indicator of cognitive impairment in early AD/ADRD. Using a cross-sectional analytic approach, we found single and dual task gaits speed, TUG, step length, and % in single leg support to distinguish MCI from NC and SCD and mini PPT and balance to differentiate SCD from NC. Group differences were mostly observed in the MCI-AD subgroup although the small number of subjects diagnosed with MCI-Vascular in our study may have negatively impacted our ability to detect significant effects in this subgroup. Negative associations between physical performance, cortical atrophy, and white matter hyperintensity burden and greater cortical atrophy across disease stages further support lower physical performance as an early ADRD biomarker. These findings have implications in early detection and intervention for AD/ADRD.
The downward trend in physical performance with increasing cognitive impairment (NC > SCD > MCI) observed in our study generally aligns with prior reports of lower physical functionality in individuals with cognitive impairment compared to those with normal cognition. A meta-analysis of 36 cross-sectional or longitudinal studies demonstrated reduced gait speeds of 0.11 m/s (corresponding to 1.1 dm/s) in MCI compared to NC, 34 which is similar to our finding of 1.4 dm/s lower speed gait in MCI versus NC. Lower performance on gait has been linked in prior studies to higher odds of experiencing cognitive decline, 4 with dual task gait speed being more sensitive in discriminating MCI from NC, especially when counting tasks are used. 35 Finally, other measures of physical functionality including TUG, step length, and balance have been reported previously to separate MCI from NC 36 and to help identify those at increased risk of cognitive decline or incident MCI.37,38 In support of previous reports, we found greater performance across most functional measures including global and individual domains, both observational and computerized, to effectively separate MCI from NC. However, it is important to note that while we observed this downward trend in physical performance across diagnostic groups, not all differences reached statistical significance, suggesting that further research is needed to confirm these patterns.
In our study, SCD was compared against both NC and MCI, with the expectation that cognitive and physical performance for this group will fall in between the NC and MCI groups. We found lower performance on MoCA in SCD versus NC but greater performance than in MCI. Similarly, mini PPT differentiated all groups in the unadjusted model although the MCI versus SCD differences were no longer significant after covariate adjustment, therefore partially supporting our hypothesis. Furthermore, these findings are in line with prior reports of lower physical performance in older adults in preclinical stages of disease compared to NC 39 as well as lower performance on several cognitive domains including MoCA and a higher risk of MCI in individuals with SCD. 40 By comparing SCD against both NC and MCI, the study enhances our current understanding of physical performance as a potential indicator of covert cognitive dysfunction and increased AD/ADRD risk in SCD.
While our study did not find poorer performance in certain cognitive domains compared to other studies, several factors might explain this discrepancy. Differences in sample characteristics, such as age and education levels, variations in cognitive assessment tools, and methodological differences in study design and statistical analyses, could all contribute to the differing results. Additionally, the relatively small sample size and the specific stages of cognitive impairment in our participants might limit the ability to detect significant cognitive deficits. Future research with larger and more diverse samples and standardized methodologies is needed to further explore these associations.
Study findings are robust extending across various dimensions of physical and cognitive performance. Gait, as measured observationally and with computerized tools, was effective in separating MCI from SCD and NC, highlighting the utility of both modalities of gait assessment in identifying AD/ADRD risk. This is important, especially considering the evidence that observational gait analysis remains the preferred method of assessment in the clinical setting, although computerized methods tend to be more accurate and reliable. 41 Further differentiation of MCI and NC was achieved by mini PPT, TUG, step length, and single leg support. This is consistent with other reports supporting global measures of functionality/mobility such as Short Physical Performance Battery, 42 spatial gait characteristics, 43 dual task gait speed, 44 and dual TUG 45 as useful strategies for early detection of MCI.
In addition to gait, dual task gait speed and single and dual step length and % in single leg support phase were effective at distinguishing SCD from MCI in our study, supporting prior reports on dual tasks. 46 The simultaneous execution of cognitive and movement tasks, which share neural networks, leads to cognitive overload and a greater dual-task cost in cognitively impaired individuals. 47 Our findings on dual gait speed support the notion that the increased cognitive demands during dual-task gait speed testing may lead to clinically significant changes in gait speed in the SCD stage.
While gait adaptations such as shorter step length 48 and lower % of the gait cycle spent in single leg support 49 may be made by patients with cognitive impairment versus normal cognition to ensure gait stability, 50 their effectiveness in detecting risk of cognitive impairment in preclinical stage remains unclear. Our findings of a lower likelihood of being MCI versus SCD with increasing step length and % in single leg support during single- and dual-task conditions highlight gait cycle measures’ potential for the detection of cognitive changes prior to symptom development. Moreover, in support of prior reports, 51 we found performance on single and dual TUG to discriminate MCI from SCD beyond the effect of sociodemographic, health, and behavioral factors.
Greater mini PPT scores were associated with a lower likelihood of being SCD versus control. These effects were robust and not explained by differences in age, depressive symptoms, and comorbidities, supporting mini PPT as a potentially useful tool for the early detection of pre-symptomatic disease processes. The observed MCI-NC differences in mini PPT provide further credence to the potential significance of mini PPT in detecting cognitive impairment across the pre-dementia spectrum, starting as early as the SCD stage. This potential role of physical performance as an indicator of pre-MCI stage needs further validation in larger studies.
Balance is a complex process that requires integration of sensory, nervous, and musculoskeletal systems, with dysfunction in these processes, all common in later life, interfering with balance control. While impairment in balance increases with increasing cognitive impairment, 52 poor standing balance in cognitive healthy older adults has been linked to lower cognitive performance, greater rates of cognitive decline, 38 and higher risk of incident cognitive impairment, 53 highlighting its role as a risk factor for cognitive decline. Whether balance impairment occurs in the SCD stage remains unclear. While some studies have found significant impairment as early as the SCD stage, 54 others have not. 42 These contrasting results were attributed to differences in the age of SCD participants and patient versus community-based populations. 42 The significant effect of balance in distinguishing between SCD and NC coupled with the borderline significance in differentiating MCI from NC provides some support for the notion that subtle changes in balance may be detected early in the disease process. Determination of whether balance can be an effective tool in the detection of very early-stage cognitive impairment requires further validation in large studies with younger participant populations. In addition, whether certain balance tests (e.g., one leg standing, used in negative studies 42 versus progressive Romberg tests, used in our study) or the use of tools measuring balance on continuous versus ordinal scales are more effective at detecting balance impairment in pre-dementia stages also need further evaluation.
Gait is also a complex activity that requires coordination of activity across several brain regions. Slowing of gait, particularly during complex walking tasks, predicts future lower hippocampus and precuneus thickness 7 and may therefore capture latent pathology and an increased risk of cognitive decline and dementia. 5 In our study, gait speed did not separate SCD from NC, although it did distinguish MCI from both NC and SCD groups. This may be due to the study inclusion criteria resulting in the SCD group being on average 11 years younger than in previous positive studies (Sverdrup study included participants aged 70 years and older) 2 and having similar gait speeds as the NC participants. These differences suggest that in the SCD group gait speed may have been less likely to be impacted by the high cognitive load resulting from the complex multisystem integration processes required by gait. These impacts were evident in the MCI group. Our findings of gait speed distinguishing SCD from MCI but not from NC may suggest that in younger individuals with SCD (75% were ≤73 years in our sample) slower gait speed may be more likely to detect more advanced cognitive dysfunction and possibly less likely to be an early marker of cognitive decline.
It is also important however to note that the between-group differences for SCD and NC were primarily observed in global measures of function such as the mini PPT MoCA. Balance, which can be considered a global measure of the integration of sensorimotor function, also showed differences when adjusting for covariates. These findings suggest that while some individual mobility measures were informative, the global measures provided the most consistent differentiation between SCD and NC groups.
When we separated MCI into AD versus vascular etiologies, we found the effect of physical performance in separating MCI from NC and SCD to be restricted to the MCI group with AD etiology. These findings are in contrast with our previous reports of greater functional decline in individuals progressing to non-AD dementias compared to those progressing to AD 55 and with more recent reports of lower gait speed in non-AD versus AD dementia subtypes. 42 While our results may be explained by the small number of participants with the MCI-Vascular subtype, other possible explanations may relate to differences in disease stage between study populations, as our study included older adults with MCI while our prior study and other studies finding non-AD etiologies to better relate to physical function and change in physical function involved subjects in later stages of disease Alternatively, it may be that various aspects of physical dysfunction differ in their underlying neuronal substrates. A recent large 3-cohort longitudinal study in adults aged 65 years and older found that gait speed decline, which preceded cognitive decline by up to a decade, was associated with cerebrovascular disease pathologies (macro-infarcts) while other functional measures such as hand strength decline were associated with AD pathologies (tau tangles). 56 A better understanding of the link between gait, balance, and other physical functional measures and brain pathology would facilitate early identification of individuals at risk for various ADRDs.
The mechanisms linking gait, balance, and other physical dysfunction to cognitive impairment are complex and multifactorial, involving neurodegeneration, vascular damage, cardiovascular and metabolic factors, and inflammatory burden. Additionally, psychological changes such as depression and anxiety, as well as physical inactivity play significant roles in affecting both cognition and mobility. Psychological factors can influence gait and balance through changes in motivation, energy levels, and coordination, while regular physical activity is known to support both cognitive function and physical health by enhancing neuroplasticity, reducing inflammation, and improving cardiovascular health.57,58 In our study, better physical performance was correlated with lower cortical atrophy. In addition, we observed that cortical atrophy increased with increasing cognitive impairment (lower in NC than SCD and MCI) while physical performance decreased with increasing cognitive impairment, linking the decreased physical performance in SCD and MCI to increased cortical atrophy. These findings provide support for the neurodegeneration mechanism linking neuronal loss to subtle changes in physical functionality as early as SCD stage. Loss of neurons in the basal ganglia, motor cortex, cerebellum, the frontal cortex, and the posterior parietal cortex impedes effective execution of movement, slowing down performance, and concurrently interfering with normal cognitive processes. 59 Findings of lower cortical thickness were also reported in individuals with motoric cognitive risk syndrome, characterized by subjective complaints and slow gait, 60 further supporting our findings in the SCD group.
Limitations and strengths
Our results should be interpreted considering several limitations. First, the relatively small sample size may have prevented us from observing significant differences in physical performance between the study groups and certain subgroups such as MCI-Vascular, men in the SCD group, and the non-Hispanic Black and Hispanic groups. These small sample sizes limit the statistical power and generalizability of our findings. Future studies with larger and more diverse populations are needed to validate our results and provide more robust conclusions. Second, the cohort is relatively young and well educated, which may also impact the generalizability of our results. Third, the cross-sectional design precludes determination of causation, which would require a longitudinal design. Fourth, while AD/ADRD biomarkers are collected in the HBI study, at the time of this study only 16 individuals met biomarker criteria for preclinical AD (normal cognitive performance with positive biomarkers), impeding our ability to focus our investigation on preclinical disease. Larger samples with biomarker data including white matter hyperintensities will help to better characterize the pre-MCI stage including SCD and its non-AD paths. However, while biomarkers are not commonly used in clinical settings, SCD remains a useful measure of preclinical disease in the busy clinical practice. Finally, imaging biomarkers were available in a subset of participants. However, participants missing imaging data did not differ from those with imaging data in terms of mean age, education, depressive symptoms, physical activity level, comorbidities, and sex distribution, although minorities were more represented in the missing imaging data group (13.4% versus 7.8% NHB and 22.4% versus 8.8% Hispanic, p = 0.015). Given the lack of ethnoracial differences between the diagnostic groups, this ethnoracial differential is, however, unlikely to impact the results significantly. Several strengths should also be noted including deep phenotyping of HBI participants, comprehensive cognitive testing including pencil-and-paper and computerized scales, observational and electronic pressure mat measures of mobility, and imaging ADRD biomarkers, allowing a more complex evaluation of individual mobility measures in early ADRD detection.
Results of this cross-sectional analysis describe patterns of physical performance across early stages of disease, evaluate relationships with imaging ADRD biomarkers, and identify mini PPT and balance as potentially effective markers of cognitive dysfunction, as early as the SCD stage. Our findings highlight the value of physical performance as an indicator of covert cognitive dysfunction and identify potential targets for early intervention to slow down or stop progression to clinical stages of the disease.
Footnotes
Acknowledgements
The authors have no acknowledgements to report.
Author contribution(s)
Funding
The authors disclosed receipt of the following financial support for the research, authorship, and/or publication of this article: This study was supported by grants to JEG from the National Institute on Aging (R01AG071514, R01AG071514S1, R01AG069765, R01NS101483, R01NS101483S1, R01AG071643, R01AG057681, and P01AG066584).
Declaration of conflicting interests
The authors declared the following potential conflicts of interest with respect to the research, authorship, and/or publication of this article: JEG serves on the Board of Directors for the Lewy Body Dementia Association, Lewy Body Resource Center, the South Florida Chapter of the Alzheimer Association and the South Palm Beach County YMCA, as a consultant for Biogen, performs clinical and cognitive evaluations in his clinical practice (15% effort) and bills for these procedures, is funded by NIH grants (R01 AG040211, R01 NS1010483, R01 AG057681, P30 AG059295, U01 NS100610, U54 AG063546, R01 AG056610, R01 AG054425, R01 AG056531, R01 AG040211, R01 NS1010483, R01 AG057681, P30 AG059295, U01 NS100610, U54 AG063546, R01 AG056610, R01 AG054425, and R01 AG056531) and by the Harry T. Mangurian Foundation, and the Leo and Anne Albert Charitable Trust, and receives research support as Director and Principal Investigator of the Lewy Body Dementia Research Center of Excellence from the Lewy Body Dementia Association. JEG is an Editorial Board Member of this journal but was not involved in the peer-review process of this article nor had access to any information regarding its peer- review.
The remaining authors declared no potential conflicts of interest with respect to the research, authorship, and/or publication of this article.
Data availability
The data supporting the findings of this study are available upon request from the corresponding author. The data are not publicly available due to privacy or ethical restrictions.