



Abstract
Background
Genome-wide association studies (GWAS) have identified numerous genetic variants associated with Alzheimer's disease (AD), but their functional implications remain unclear. Transcriptome-wide association studies (TWAS) offer enhanced statistical power by analyzing genetic associations at the gene level rather than at the variant level, enabling assessment of how genetically-regulated gene expression influences AD risk. However, previous AD-TWAS have been limited by small expression quantitative trait loci (eQTL) reference datasets or reliance on AD-by-proxy phenotypes.
Objective
To perform the most powerful AD-TWAS to date using summary statistics from the largest available brain and blood cis-eQTL meta-analyses applied to the largest clinically-adjudicated AD GWAS.
Methods
We implemented the OTTERS TWAS pipeline to predict gene expression using the largest available cis-eQTL data from cortical brain tissue (MetaBrain; N = 2683) and blood (eQTLGen; N = 31,684), and then applied these models to AD-GWAS data (Cases = 21,982; Controls = 44,944).
Results
We identified and validated five novel gene associations in cortical brain tissue (PRKAG1, C3orf62, LYSMD4, ZNF439, SLC11A2) and six genes proximal to known AD-related GWAS loci (Blood: MYBPC3; Brain: MTCH2, CYB561, MADD, PSMA5, ANXA11). Further, using causal eQTL fine-mapping, we generated sparse models that retained the strength of the AD-TWAS association for MTCH2, MADD, ZNF439, CYB561, and MYBPC3.
Conclusions
Our comprehensive AD-TWAS discovered new gene associations and provided insights into the functional relevance of previously associated variants, which enables us to further understand the genetic architecture underlying AD risk.
Keywords
Introduction
Alzheimer's disease (AD) has a strong genetic component, with heritability (h2) estimates ranging from h2∼60–80% based on twin studies.1,2 However, known AD risk variants discovered through genome-wide association studies (GWAS) explain only ∼30% of the genetic variance in disease risk while the remaining ∼70% is attributed to undiscovered AD variants. 3 Multiple recent large-scale GWAS4,5 have been conducted with varying stringency in phenotyping criteria, with some studies using AD-by-proxy (GWAX) phenotypes 6 that may increase study heterogeneity 7 but also dramatically increase sample size. These GWAS have been successful at identifying new AD risk variants, though nearly all of these variants fall in non-coding regions making their roles in disease risk difficult to interpret. A key component to the translation of these findings into drug targets is understanding how these non-coding variants influence gene expression.8–10 Transcriptomic integration with GWAS has the potential to both improve statistical power for discovery of novel genetic associations and accelerate associated drug development by mapping variants to their functional outcomes.
The evolution of expression quantitative trait loci (eQTL) studies mirrors that of GWAS. Initially small in scale, eQTL studies have now been combined through meta-analyses, resulting in highly powered investigations.11,12 While eQTLs typically have larger effects and can be detected in smaller sample sizes compared to disease-associated variants, 13 prior work examining the genetic architecture of cis-regulatory variation 14 demonstrates that weaker eQTLs form polygenic components that complement strong, sparse eQTL effects. 12
Metabrain, the largest brain eQTL meta-analysis to date, identified eight cis-eQTLs in the cortex that appear to drive known AD GWAS signals by performing single-site Mendelian Randomization followed by colocalization. 11 However, this analysis was limited by the assumption of a single-causal variant (cis-eQTL) driving each AD GWAS association. Importantly, these researchers also found within cortex that 8815 (54%) genes with cis-eQTLs carried significant secondary cis-eQTLs. 11 Hence, by performing single-site Mendelian Randomization followed by colocalization the authors were only able to evaluate approximately half of their findings by focusing on genes modulated by sparse genetic architectures.
In comparison, transcriptome-wide associations studies (TWAS) enable us to model both sparse and polygenic genetic architectures by performing a gene-based association test between the predicted genetically-regulated expression of a gene and the disease of interest. While TWAS were originally designed to use individual-level data, 15 recent methodological developments have extended these approaches to allow for the use of summary statistics for both creating expression prediction models and conducting association analyses.16–25
Previous TWAS for AD have utilized smaller-scale eQTL reference datasets applied to both clinical AD and AD-by-proxy individual-level and summary data. Methodological extensions to the original TWAS framework like BGW-TWAS, 26 T-GEN, 27 VC-TWAS, 28 UTMOST,29,30 InTACT, 31 and MR-JTI32,33 have been developed and applied to AD, leading to improvements in gene discovery by incorporating trans-eQTLs, epigenetic annotations, random cis-eQTL effect modeling, and multi-tissue modeling 34 that leverages shared tissue expression profiles to boost power. While these studies have advanced our understanding of how heritable gene expression is associated with AD risk, they have identified varying numbers of significant AD TWAS associations, from 8 35 to 415 genes. 32 However, there has been limited functional validation or fine mapping of the results. Despite methodological improvements, most of these studies have relied on Genotype-Tissue Expression (GTEx) 36 data for model training. While GTEx provides genetic data across 54 diverse tissue types, representing unparalleled tissue diversity, the sample size of only 838 donors restricts generalizability especially considering brain tissue has an even smaller sample size of only approximately 200 individuals. 36
To address this gap, we leverage the largest available AD GWAS summary statistics comprising over 65,000 individuals along with the largest blood and brain cis-eQTL summary statistics from published meta-analyses to identify novel AD-TWAS associations. Using the recently established OTTERS approach, 17 which combines diverse modeling techniques to account for variations in the sparseness or polygenicity of gene regulation, we generated candidate TWAS associations. These candidates were then rigorously filtered and validated to distill the most robust TWAS signals. Additionally, we fine-mapped causal eQTLs and performed conditional analyses to provide deeper insights into the genetic architecture underlying the identified TWAS associations.
Methods
Data resources
Sources of summary statistics
We leveraged the largest available cis-eQTL meta-analysis summary statistics for two key AD-associated tissues: We performed an inverse variance-weighted fixed-effects meta-analysis across the MetaBrain study-specific results, excluding the GTEx study, which we used for model performance evaluation. Similarly, we obtained a version of the eQTLGen meta-analysis summary statistics that excluded GTEx.
We used the largest clinically diagnosed AD meta-analysis from Kunkle et al. (2019) (Stage I: AD Cases = 21,982; Controls = 44,944) to perform our primary analysis so our generated results would be most reflective of an AD phenotype (Supplemental Table 1). 37 However, we also performed all analyses using AD-related dementia (ADRD) summary statistics from Bellenguez et al. (2022) as this is the largest GWAX study to date related to AD 5 and include these analyses in Supplemental Table 2.
We limited our analysis to European-descent populations, as all four meta-analyses were based on this population.
Linkage disequilibrium reference dataset
Because we used summary statistics, an individual-level reference dataset was needed to estimate linkage disequilibrium (LD) for model building in OTTERS and fine-mapping. We used 503 unrelated EUR samples from the 1000 Genomes high coverage release 38 (Link: https://ftp.1000genomes.ebi.ac.uk/vol1/ftp/data_collections/1000G_2504_high_coverage/working/20220422_3202_phased_SNV_INDEL_SV/) as a reference and filtered the dataset to only contain variants common to both the 1000 Genomes and GTEX (v8) (Link: https://www.gtexportal.org/home/downloads/adult-gtex/overview).
Standardization of summary statistics
Both MetaBrain 11 and ADRD summary statistics 5 were available in build 38. We lifted eQTLGen 12 and AD summary statistics 37 from GRCh37/hg19 to GRCh38/hg38 using UCSC liftOver (https://hgdownload.soe.ucsc.edu/downloads.html). To ensure consistency in effect direction/coded allele, we aligned all variants to GRCh38, removing variants with a reference or alternative allele that did not match the GRCh38 reference and flipping direction of the effect as appropriate. After our alignment procedure, we also wanted to ensure that the SNPs used in expression prediction models were available in all other datasets, so we restricted our analysis to only include variants consistently available within eQTL summary statistics, AD summary statistics, 1000 Genomes, and GTEx. Using these criteria, we examined a total of 7,859,831 SNPs for the brain cortex analysis and 7,653,537 SNPs for the whole blood analysis. When using the ADRD summary statistics, we explored a total of 7,952,002 SNPs for the analysis of brain cortex analysis and 7,638,319 SNPs for the analysis of whole blood analysis.
OTTERS implementation
We extended the recently published OTTERS framework 17 in several ways. In Stage I: Training, we used the standard five polygenic risk score (PRS) methods for summary statistic data implemented in OTTERS: p-value thresholding with LD clumping (P + T) at two thresholds (p < 0.05 & p < 0.001) 25 ; elastic net regression implemented in the method lassosum 19 ; Bayesian regression with a continuous shrinkage (CS) prior on SNP effect sizes implemented in the method PRS-CS 23 ; and finally a non-parametric Bayesian multiple Dirichlet progress regression method SDPR 24 (Figure 1). The P + T methods are designed to capture sparse genetic architectures, while the elastic net and Bayesian approaches are better suited for capturing more polygenic genetic architectures. In Stage II: Testing, the p-values produced from each of these modeling approaches were subsequently aggregated using the aggregated Cauchy association test (ACAT) 39 to generate an omnibus p-value (ACAT-O) (Figure 1). An overview of our processing and results filtering workflow is shown in Figure 1.
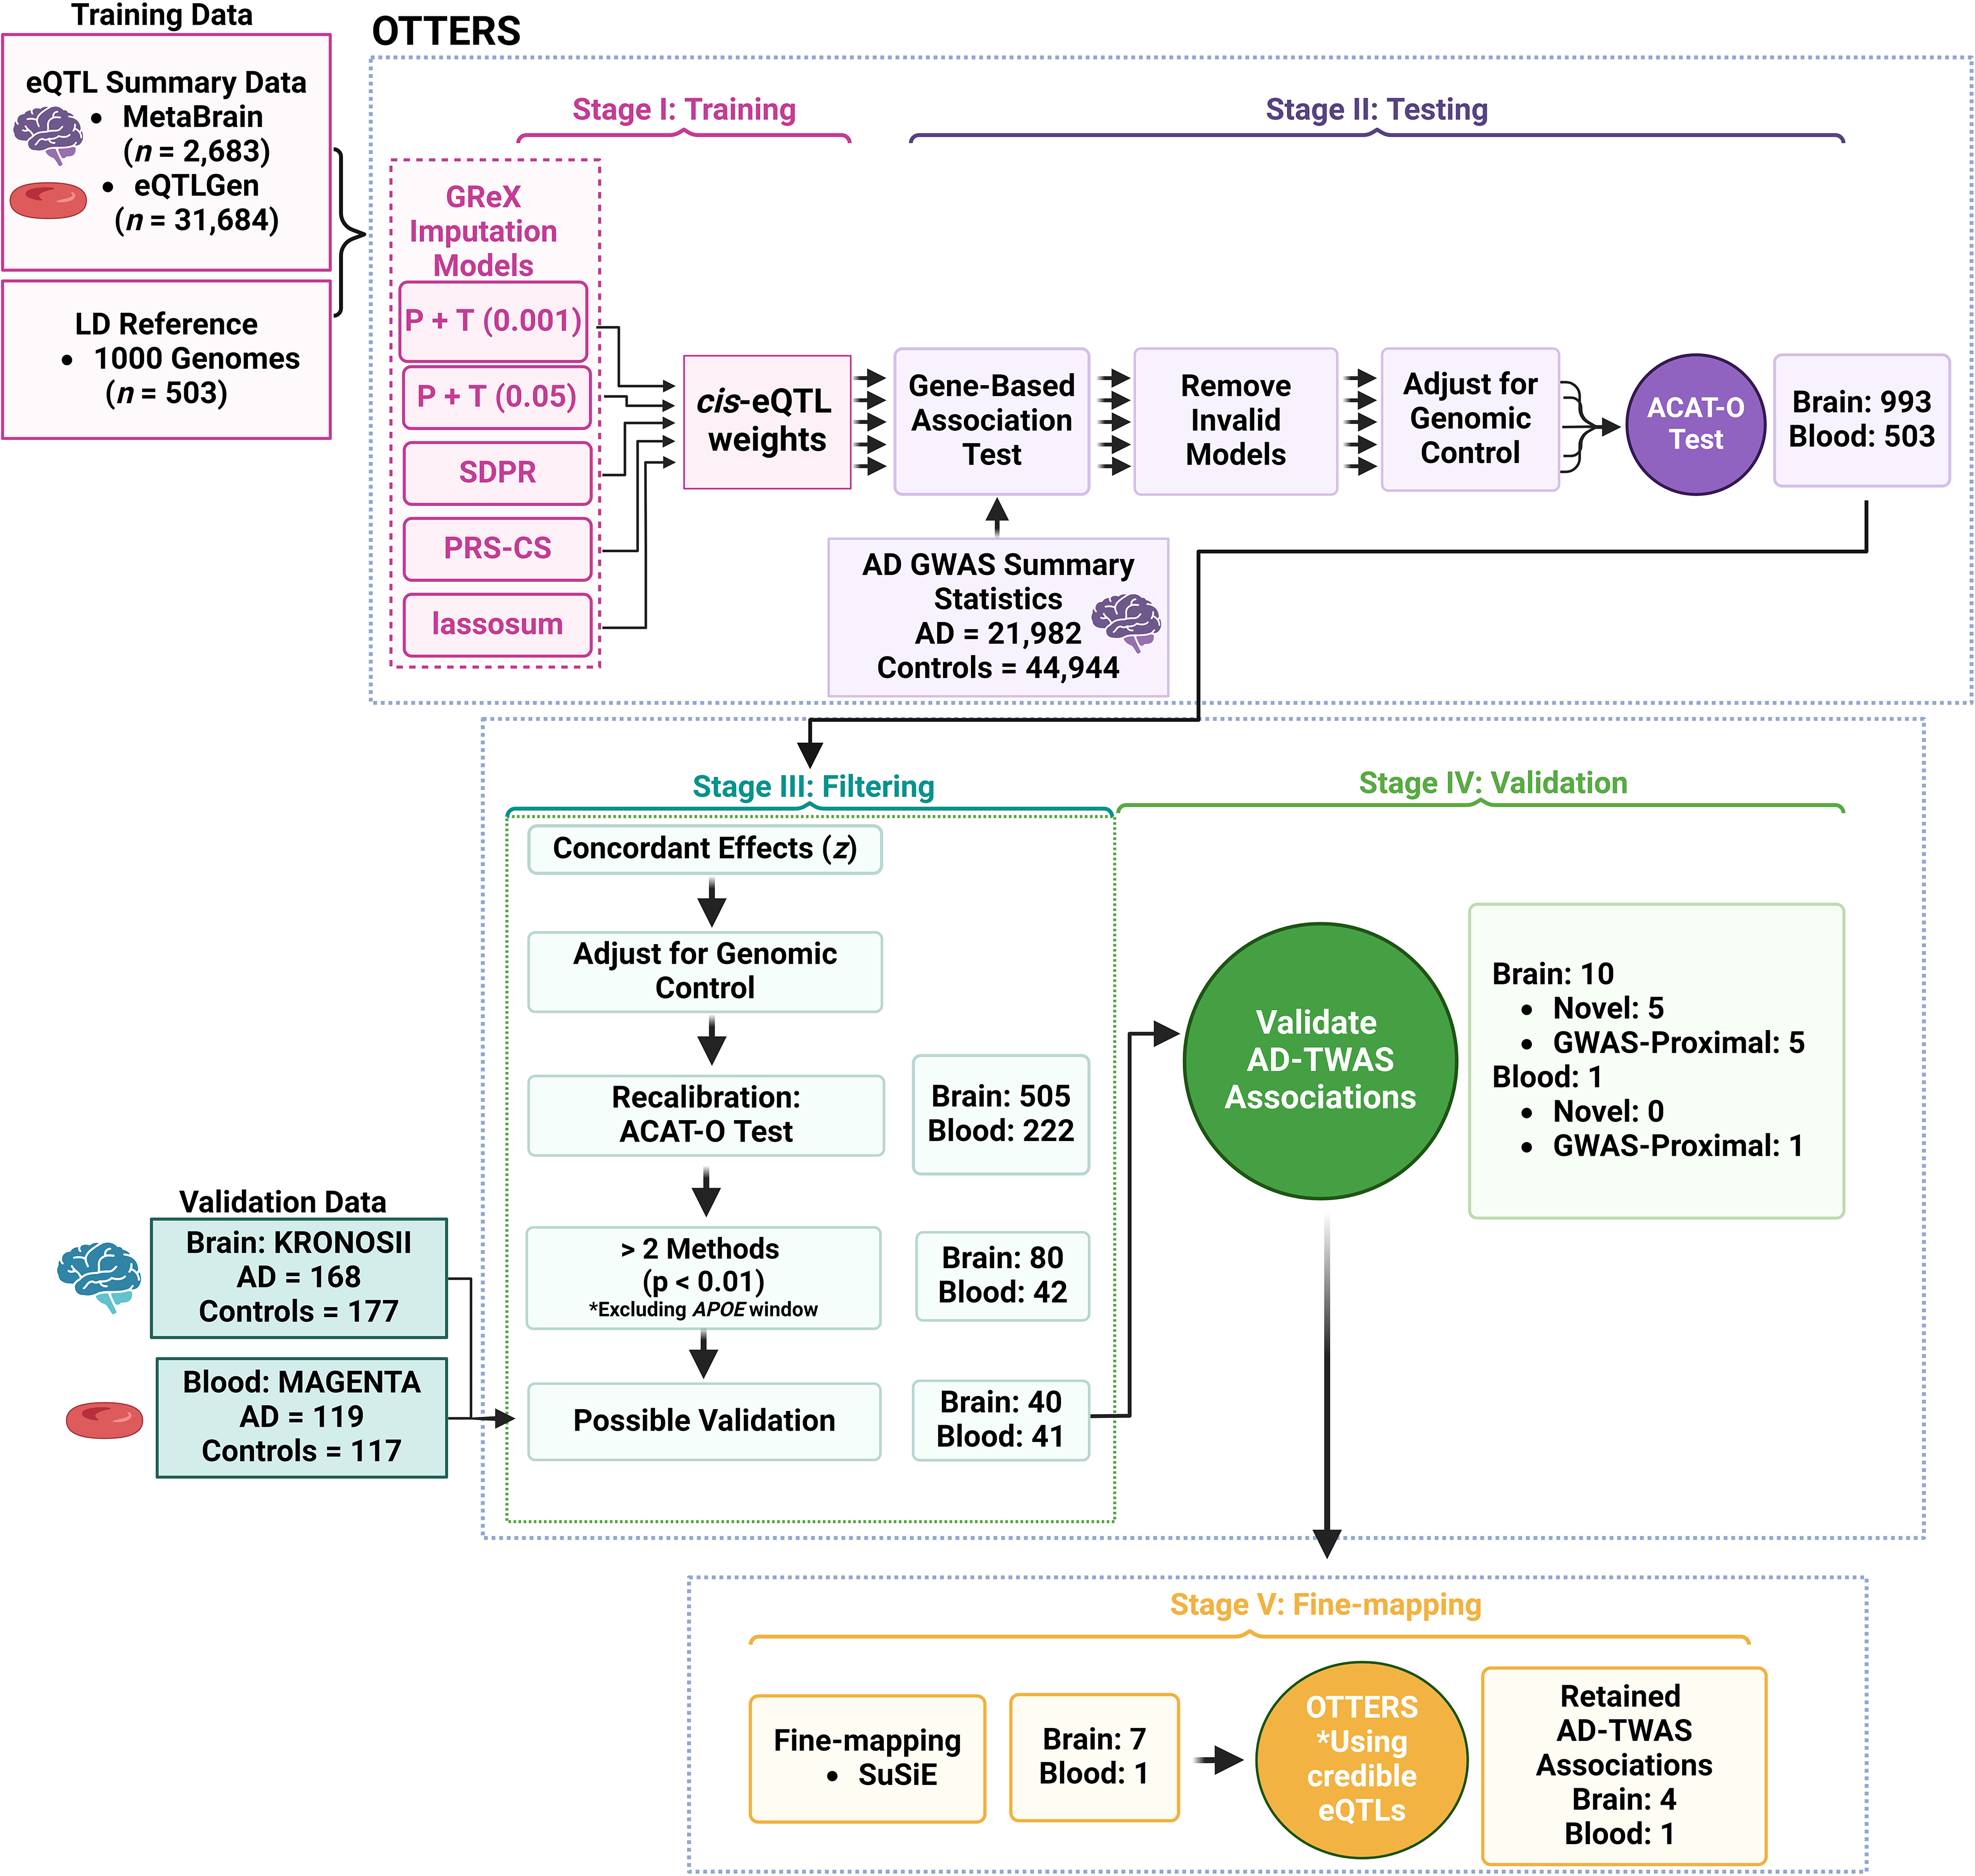
OTTERS workflow. OTTERS uses eQTL summary data and a LD reference panel to train five imputation models (P + T 0.001, P + T 0.05, lassosum, SDPR, PRS-CS) (Stage I). These models are subsequently applied to AD GWAS summary data and the p-values of valid models are combined using ACAT-O (Stage II). We filter the results based on concordant z scores and validate the AD-TWAS associations using RNA-Seq data (Stage III & IV). Finally, we further explore the AD-TWAS association using fine-mapping and re-running of the OTTERS workflow using only credible eQTLs to assess whether a sparse or polygenic architecture is needed for the TWAS association (Stage V). Created in BioRender. https://BioRender.com/y68n779. TWAS: transcriptome-wide association study; GWAS: genome-wide association study; AD: Alzheimer's disease; eQTL: expression quantitative trait loci; OTTERS: Omnibus Transcriptome Test using Expression Reference Summary data.
While the original implementation of OTTERs 17 (https://github.com/daiqile96/OTTERS) used the pseudovalidate option within the lassosum (v.0.4.5) method to select the optimal tuning parameter between Ridge and Lasso regression, we instead used the validate option to generate our models with GTEX (v8) EUR normalized expression, covariate, and genetic data from Brain_Cortex and Whole_Blood (Link: https://www.gtexportal.org/home/downloads/adult-gtex) as validation sets. This modification increased model sparsity and had a higher predictive performance relative to the pseudovalidate option (Supplemental Figure 1). As we used GTEx v8 expression data to evaluate the performance of all imputation models, we prevented overfitting of the lassosum model by only including a randomly generated 50% split of the GTEx data (Brain: N = 92/183; Blood: N = 279/558) to serve as a validation testing dataset during model training and the remaining 50% served as an independent dataset for model evaluation. We also expanded the shrinkage and mixing parameters (balance between Ridge and Lasso regression) of the OTTERS lassosum implementation by also testing shrinkage penalties of 0.05, 0.1, 0.25, 0.33, 0.75, and 0.95 and mixing parameters of 0.05, 0.2, 0.25, 0.3, 0.4, 0.5, 0.6, 0.7, 0.75, 0.8, 0.9, and 0.95.
Post-processing of findings from OTTERS
In the original OTTERS implementation, invalid gene models are filtered based on a R2 > 0.01 and after models are adjusted for genomic control. We improve upon the existing approach by instead requiring an R > 0.1 between the predicted and actual normalized expression of the gene based on GTEx v8 data as using only the R2 value masks genes models with negative correlations that are biologically nonsensical. In Stage II: Testing, we remove invalid models prior to adjusting for genomic control to keep them from skewing the adjustment (Figure 1). Overall, we used valid z-scores to adjust p-values for genomic control and subsequently ran the initial ACAT-O test. Multiple-testing was controlled by a Bonferroni-correction of the ACAT-O p-values identified at the end of Stage II: Testing (Figure 1). In Stage III: Filtering, we tested if z-score direction was concordant among tested methods and replaced gene models with NA values if there was any discordance across the methods, effectively requiring all methods to agree on the direction of effect (Figure 1). After we applied this concordance restriction, we applied genomic control to the concordant z-scores and re-ran that ACAT-O test to yield ACAT-OCON (concordance-restricted ACAT-O) p-values. By applying genomic control at this stage of the analysis, we reduced the overall ACAT inflation (AD: Brain: λ = 1.58 > λCON = 1.17; Blood: λ = 1.27 > λCON = 1.04; ADRD: Brain: λ = 0.95 > λCON = 0.88; Blood: λ = 0.92 > λCON = 0.86) (Supplemental Figures 2–9).
While each of the tested methods has advantages and disadvantages that lead to differing SNP selection, ultimately all methods receive the same set of input eQTL summary statistics. By enforcing concordance among the tested methods, we can enrich our results for higher confidence TWAS associations. We subsequently annotated whether a gene fell within a known AD GWAS association based on whether a 1 Mb window around the gene's transcription start and end site overlapped with a 1 Mb window around APOE or whether a 1 Mb window around the gene fell within a 1 Mb window around a known AD/ADRD GWAS association. We used a combined list of lifted-over AD GWAS associations 37 and ADRD GWAS associations 5 for this annotation of the results. Finally, we restricted our associations to genes where there was at least a nominally significant p-value (p < 0.01) for a minimum of two out of five methods tested (in addition to a Bonferroni-corrected significant ACAT-OCON p-value) (Figure 1). We implemented these criteria to minimize the potential for false-positive associations and prevent any single method from biasing our results while still allowing for the detection of multiple different model types.
Independent validation of OTTERS-identified genes
In Stage IV: Validation, results meeting our post-processing criteria were further validated in an independent analysis of differential gene expression among AD cases and controls (Figure 1). We acknowledge that since actual gene expression is a combination of genetic, environmental, and gene × environmental effects that this form of validation may be overly strict and some signals that exert their effects cumulatively in earlier life stages may be missed. However, since therapeutic intervention will most likely occur in late life, we believe that TWAS signals with persisting genetic effects at this stage will be best suited for targeted drug development. We performed one-tailed T-tests (using the direction of effect predicted in our results) within a non-Hispanic white (NHW) whole-blood dataset 40 (AD Cases = 119; Controls = 117) and a partially independent brain RNA microarray dataset, KRONOSII, 41 that was curated for high AD pathology and low secondary pathology (AD Cases = 168; Controls = 177). More specifically, we utilized the RNA_eQTL_residual-corrected-data_KRONOSII_Brainome.txt for the validation of brain cortex results (Link: https://drive.google.com/drive/folders/15WmJsBXIH3Feib9Vu_bU2VpYQ2pDc8WX). For the whole blood validation, we used residualized normalized expression data after covariate adjustment for sex, age-at-exam, and principal components 1–12 (PC1–12) to capture population substructure estimated analysis using flashpcaR. 42 Because we used summary statistics, it was difficult to rule out the possibility that some samples from the KRONOSII study were included in the MetaBrain study or the AD summary statistics; however, we assume based on documentation of the KRONOSII study that any overlap would be somewhat limited. 41 We used a Bonferroni-corrected p-value based on the number of genes tested to determine if a TWAS hit was validated in the actual expression data. In the microarray expression data, multiple probes mapped to a single gene in some instances, and we required at least one probe to be significantly differentially expressed between AD Cases and Controls for that the TWAS gene model to be validated.
Fine-mapping validated associations
In Stage V: Fine-mapping, we identify the specific eQTLs driving the significant TWAS results by applying the SuSiE (Sum of Single Effects)43,44 approach (susieR package v.0.12.35) to the original summary statistics while also using the same LD reference panel used in the OTTERS analysis. Credible sets of causal eQTLs were generated for eight of eleven validated TWAS associations, though seven of these eight SuSiE analyses reported convergence issues in the model fitting, which could indicate a mismatch between the eQTL summary statistics and the 1000 Genomes EUR LD matrix. For consistency however, we used the same LD matrix for all analyses. We extracted the variants falling within identified credible sets and subsequently re-ran the modified OTTERS pipeline using only the SuSiE identified SNPs to assess how the sparse fine-mapped eQTLs influence TWAS model results. We only re-ran our model for our validated TWAS associations from blood and brain. As we only performed analyses on a small set of genes, we did not adjust for genomic control and instead focused on the overall ACAT-O p-values. We annotated the credible SNPs included in the models using the FunctIonaL gEnomics Repository (FILER). 45
GWAS conditional analysis
For our validated AD-TWAS associations that were proximal to known AD/ADRD GWAS loci, we sought to determine whether the genetically-regulated expression of the identified genes was driving the original GWAS association. To this end, we leveraged individual-level data from the Alzheimer's Disease Genetics Consortium (ADGC), encompassing 29,681 NHW participants across 35 cohorts. We conducted a series of logistic regression models that included both the predicted genetically-regulated expression of the AD-TWAS gene and the GWAS SNP dosage, along with covariates such as sex, age, cohort, and population substructure (PC1–3). These analyses closely mirrored the approach used by Kunkle et al. (2019). 37 When the logistic regression results warranted further investigation, we also performed linear regression models using either the GWAS SNP dosage or the genetically-regulated gene expression as the outcome variable, in order to disentangle the significant predictors. For this conditional analysis, we tested the top two most significantly associated modeling methods that produced valid gene models, with the exception of MTCH2, where we tested all sparse eQTL models as this was the only gene where every approach yielded a significant AD-TWAS association (Supplemental Table 3). Additionally, we used PLINK1.9 to perform linkage disequilibrium calculations (–r2 square) within this ADGC cohort to assess the strength of LD between AD/ADRD GWAS SNP and the causal eQTLs contained within the sparse genetically-regulated gene expression models.
Visualizing AD GWAS and eQTL signals
We used the eQTpLot package 46 to visualize our data with eQTLGen 12 and MetaBrain 11 summary statistics without GTEx as input alongside clinically-adjudicated AD GWAS summary statistics 37 and the 1000 Genomes Unrelated European High Coverage dataset serving as an LD reference. As the goal of this approach is visualizing colocalizing AD GWAS and eQTL signals, we focused on analyzing only validated AD-GWAS proximal genes (Blood: MYBPC3; Brain: MTCH2, MADD, PSMA5, ANXA11 and CYB561). We used the default parameters for visualizing the data, except for expanding the range to 1000 kb, adjusting the sigpvalue_eQTL to 2.02 × 10⁻⁵ for MYBPC3 based on eQTLGen, 12 and determining the appropriate MetaBrain 11 eQTL p-value threshold by extracting the p-value most closely corresponding with a FDR of 0.05 for each gene based on the original summary statistics. We did not plot PSMA5 as there were no variants below the 0.05 FDR threshold. Visualizations not included in text are provided in Supplemental Figures 10–13.
Results
OTTERS results and quality filtering
For brain, 993 models out of 9282 were significantly associated with AD (Bonferroni-corrected ACAT-O p < 5.39 × 10⁻⁶) (Figure 1: Stage II). We applied additional stringent filtering criteria to these prediction models, with 505 models showing concordant effect among all valid model z-scores (Figure 1: Stage III) and of those models 80 have nominal associations among at least two methods excluding five of these genes that fall within a 1 Mb window of APOE (Figure 1: Stage III). For blood, 503 models out of 7214 were significantly associated with AD (Bonferroni-corrected ACAT-O p < 6.93 × 10⁻⁶) (Figure 1: Stage II). After filtering, 222 models show concordant effect and of those models 42 have nominal associations amongst at least two individual methods excluding two of these genes that fall within a 1 Mb window of APOE (Figure 1: Stage III).
Annotation of significant TWAS associations
We assumed significant TWAS associations from our OTTERS approach were driven by either 1) re-weighting and aggregating multiple sub-significant GWAS associations into a single TWAS gene association, or 2) identification of a TWAS-significant gene by either directly selecting a GWAS-associated variant in the expression prediction model or indirectly tagging a GWAS-associated variant through linkage disequilibrium. Thus, we annotated our TWAS results as either novel or GWAS-proximal, respectively, by creating 1 Mb regions around variants identified as significant GWAS associations from Kunkle et al. (2019) and Bellenguez et al. (2022), and assessing whether this window overlaps with a 1 Mb window around each TWAS gene.5,37 Using this criterion, we identified 80 significant genes (excluding five genes falling within the APOE window) of which 50 were novel genes and 30 were GWAS association-proximal genes within brain. Similarly, we identified 42 significant genes within blood (excluding two genes falling within APOE window) of which 18 were novel genes and 24 were GWAS association-proximal genes. Comparing results between blood and brain, there were no novel genes common between the two tissues which illustrates the tissue specificity of these signals. For genes that are proximal to known GWAS loci, we identified four genes that were identified in both blood and brain, and which also had concordant effect directions in both tissues (KANSL1, ARL17A, LRRC37A2, and C1QTNF4) (Supplemental Table 4).
Validation in expression datasets
To validate TWAS associations from blood, we examined differences in gene expression within an independent whole-blood RNA-seq dataset of NHW, clinically-diagnosed AD cases (N = 119) and age-and-sex-matched controls (N = 117). Based on the direction of effect from each TWAS association, we tested if measured gene expression differed significantly between AD cases and controls using a one-tailed t-test. We were able to test 40/41 (98%) of our novel and GWAS-Proximal genes.
From this analysis, we validated one gene (MYBPC3) that was proximal to the known AD/ADRD GWAS locus SPI1 (Table 1). Specifically, we found a positive association between MYBPC3 (myosin-binding protein C) expression and AD risk (ACAT-OCON p = 4.43 × 10⁻⁸; t-test p = 6.5 × 10⁻⁴).
Validated TWAS associations using AD GWAS summary statistics.
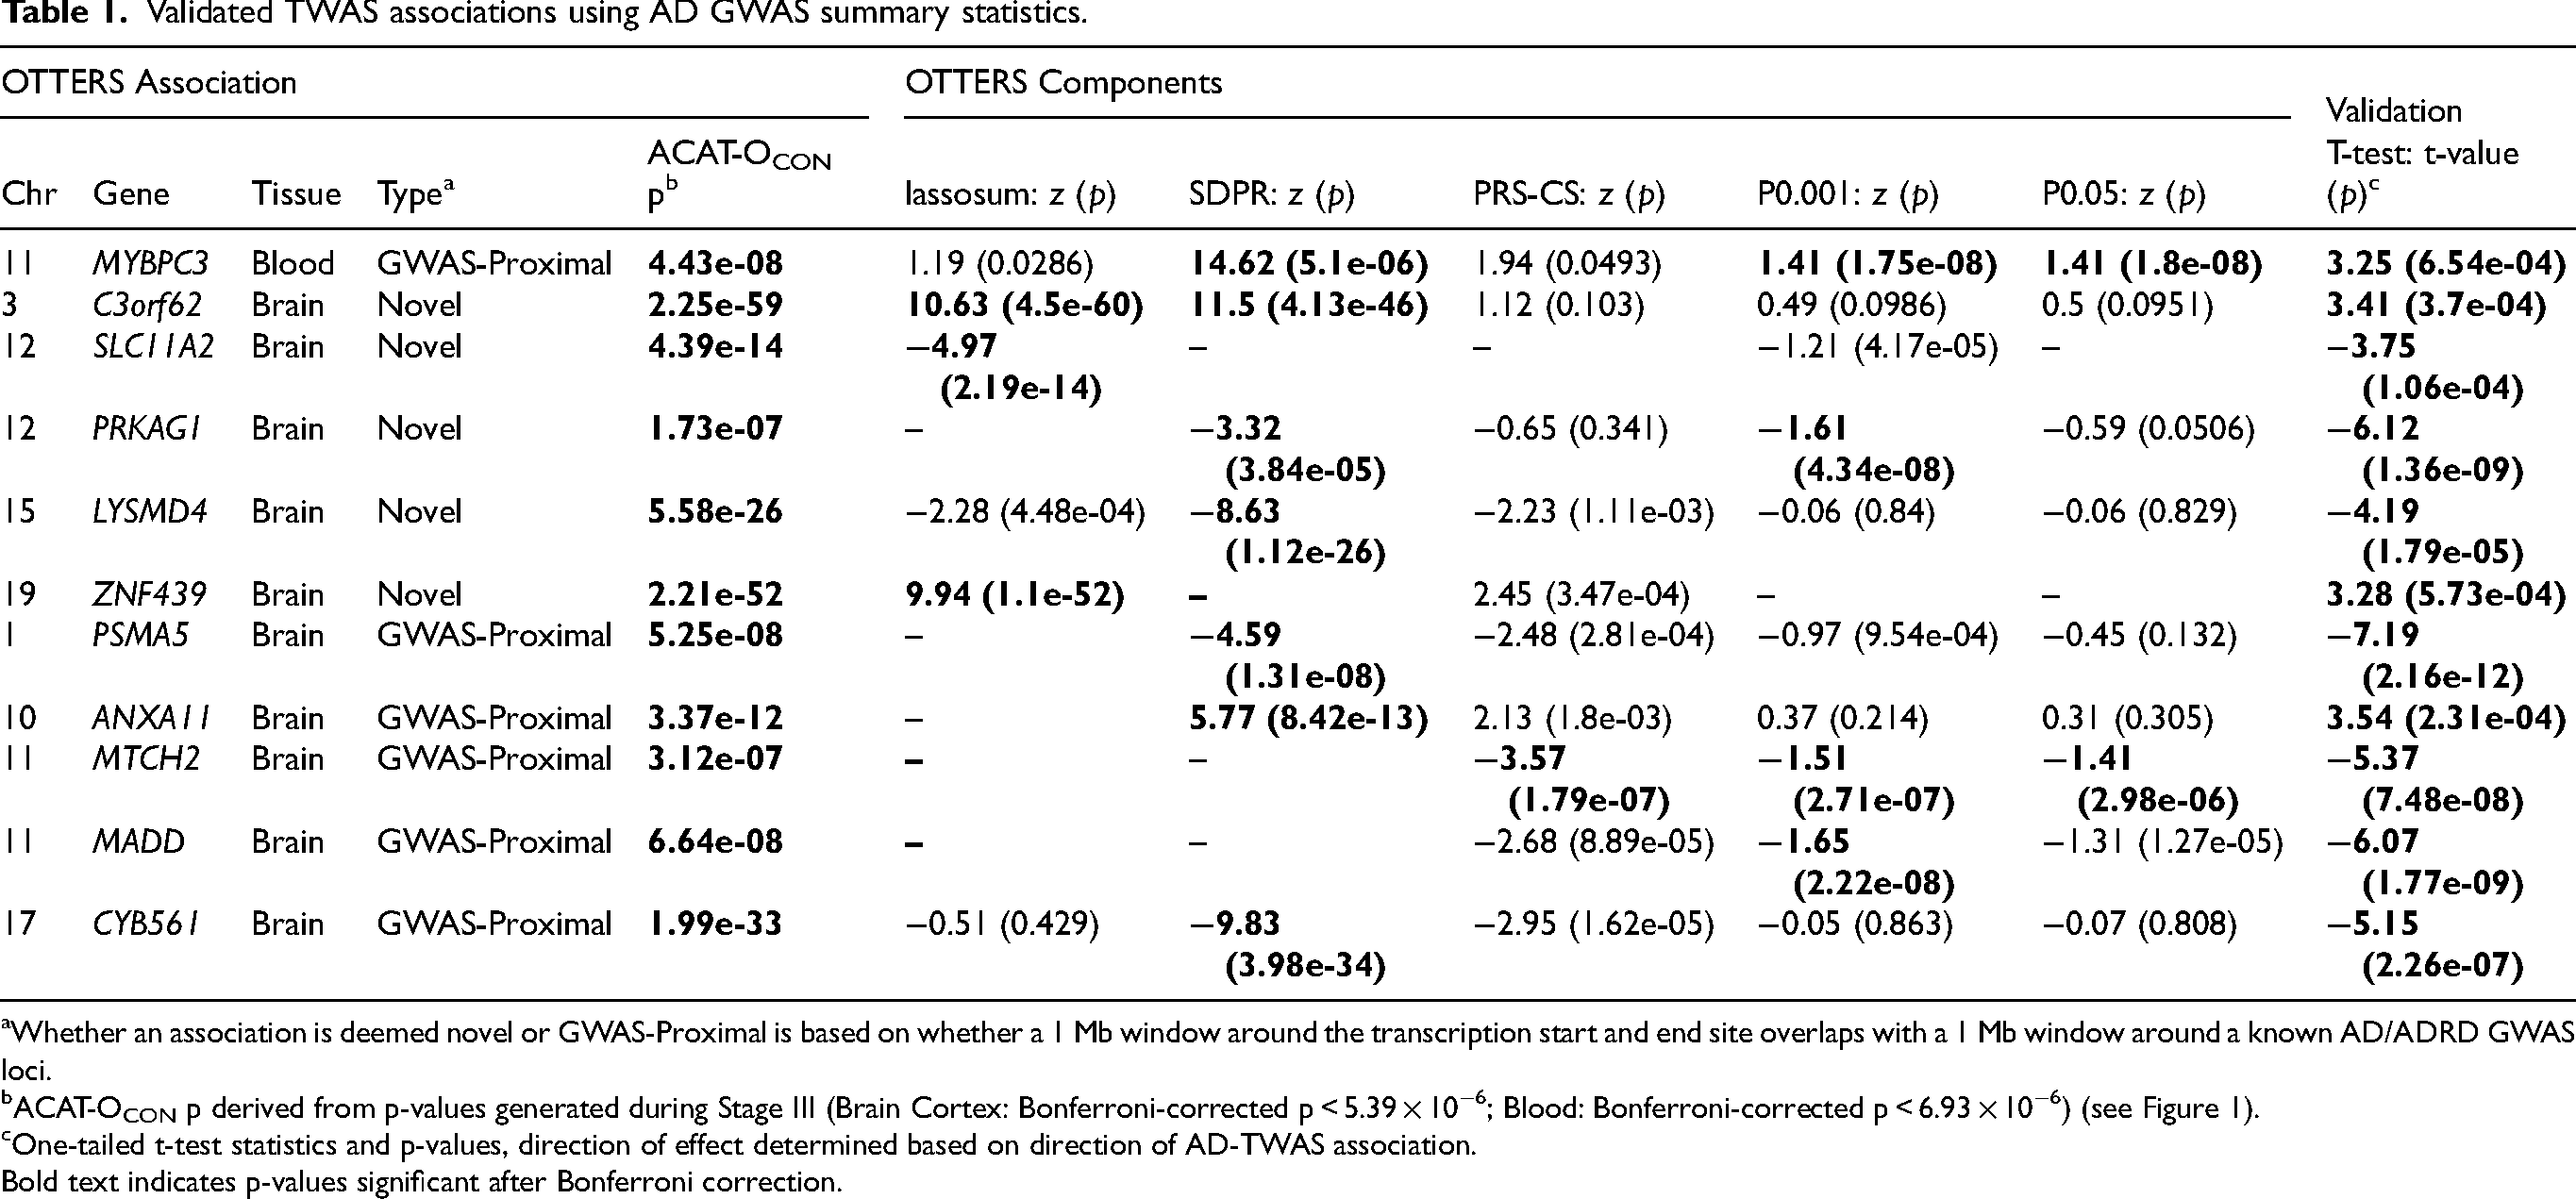
Whether an association is deemed novel or GWAS-Proximal is based on whether a 1 Mb window around the transcription start and end site overlaps with a 1 Mb window around a known AD/ADRD GWAS loci.
ACAT-OCON p derived from p-values generated during Stage III (Brain Cortex: Bonferroni-corrected p < 5.39 × 10⁻⁶; Blood: Bonferroni-corrected p < 6.93 × 10⁻⁶) (see Figure 1).
One-tailed t-test statistics and p-values, direction of effect determined based on direction of AD-TWAS association.
Bold text indicates p-values significant after Bonferroni correction.
Brain associations were validated using a brain microarray-based expression dataset of neuropathologically curated cases that were enriched for AD pathology and minimized co-occurring neurodegeneration markers such as Lewy bodies, and controls were neuropathologically confirmed as having minimal pathology loads. 41 Based on the microarray data, we were able to assess 40/80 of TWAS associations identified using the AD GWAS summary statistics. We validated ten associations. Five of 23 novel AD TWAS associations were statistically significant (Bonferroni-corrected t-test p < 0.001; C3orf62, LYSMD4, PRKAG1, ZNF439, SLC11A2) (Table 1). In addition, we validated five AD TWAS associations (5/17) that were located proximal to a known AD/ADRD GWAS loci (Bonferroni-corrected t-test p < 0.001 PSMA5, ANXA11, MTCH2, MADD, CYB561) (Table 1).
Fine-mapping TWAS associations
We next explored whether a sparse genetic model based on fine-mapped causal eQTLs for each cis-regulatory region would produce a similar strength TWAS association with improved interpretability. To test this assumption, we analyzed eQTL meta-analysis summary statistics using SuSiE and subsequently re-ran our OTTERS pipeline using only this subset of fine-mapped eQTLs (Stage V: Fine-mapping, Figure 1). Credible sets of causal eQTLs were generated for eight of eleven validated TWAS associations. Of the eight validated associations with credible sets, five genes (MTCH2, MADD, CYB561, ZNF439, and MYBPC3) had equivalent or improved AD-TWAS association statistics when the OTTERS analysis was restricted to the fine-mapped causal eQTLs within these credible sets (Table 2). In contrast, the remaining three genes (C3orf62, LYSMD4, and ANXA11) were no longer significant, indicating that their effects rely on a more polygenic genetic architecture than captured by the SuSiE fine-mapping (which was limited to 10 credible sets).
Validated TWAS associations using fine-mapped causal eQTLs applied to AD GWAS summary statistics.
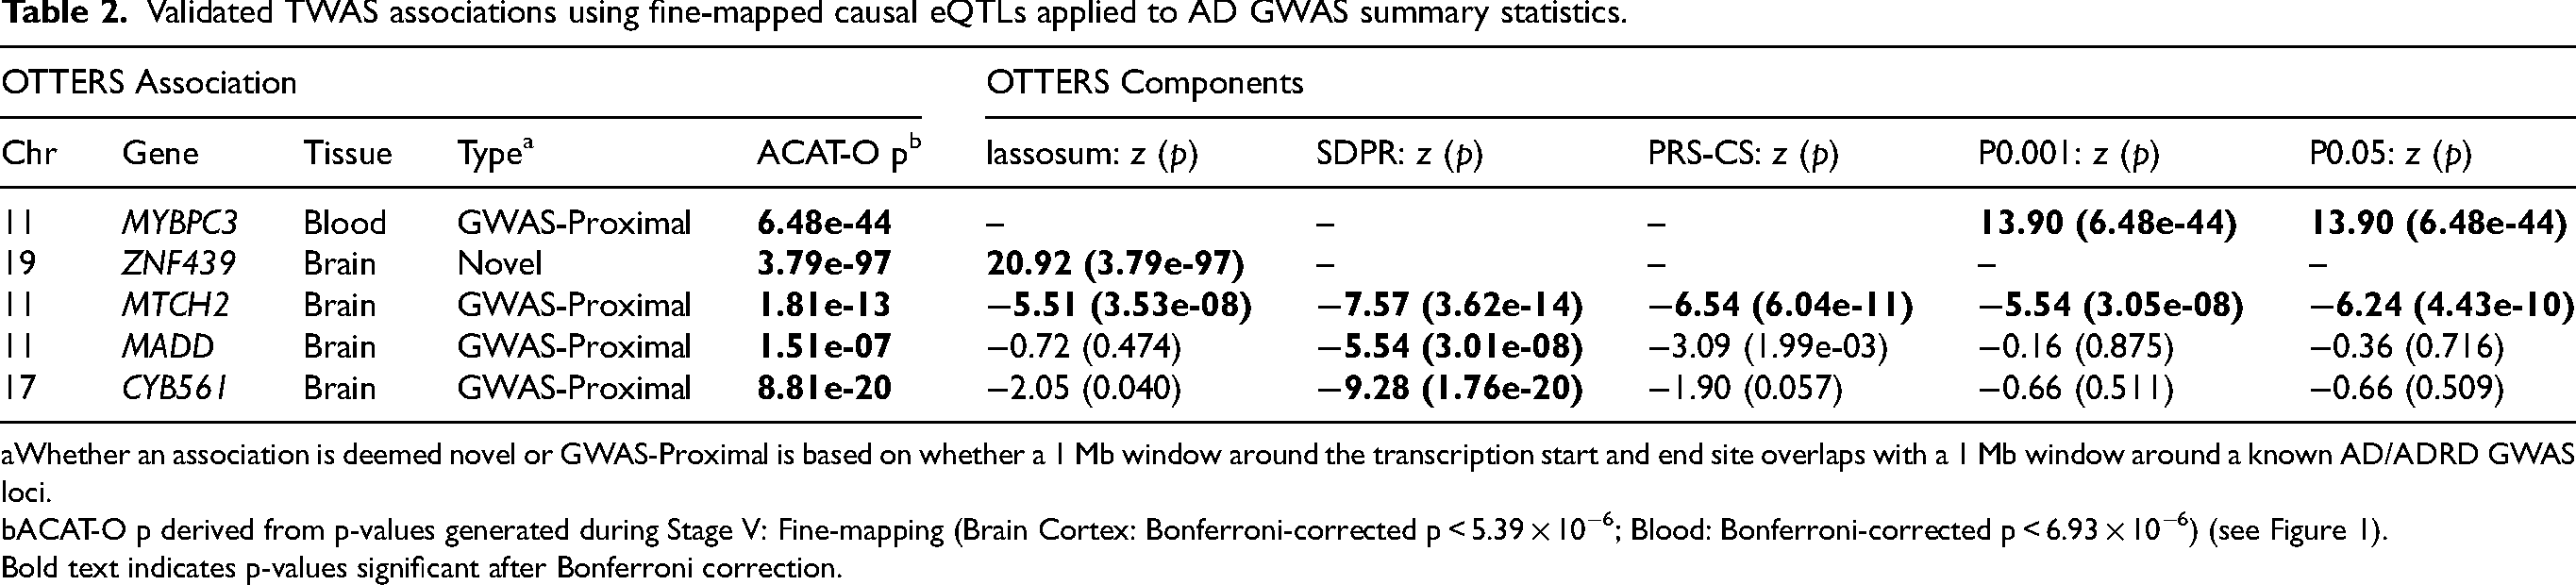
Whether an association is deemed novel or GWAS-Proximal is based on whether a 1 Mb window around the transcription start and end site overlaps with a 1 Mb window around a known AD/ADRD GWAS loci.
ACAT-O p derived from p-values generated during Stage V: Fine-mapping (Brain Cortex: Bonferroni-corrected p < 5.39 × 10⁻⁶; Blood: Bonferroni-corrected p < 6.93 × 10⁻⁶) (see Figure 1).
Bold text indicates p-values significant after Bonferroni correction.
Brain: MTCH2 & MADD
The MTCH2 OTTERS association was primarily driven by the PRS-CS approach modeling 1336 SNPs (ACAT-OCON p = 3.12 × 10⁻⁷; pPRS−CS_CON p = 1.79 × 10⁻⁷; zPRS−CS = −3.57; R2PRS−CS = 5.7%). This model was reduced to seven credible sets with eight causal eQTLs by SuSiE fine-mapping, which produced significant AD-TWAS associations using all strategies and each method selected between one to three causal eQTLs. The most parsimonious model was generated by the lassosum approach and contained a single eQTL that falls with active enhancer/promoter regions based on chromatin accessibility and histone modification data (Supplemental Material). This model demonstrated slightly improved model performance compared to the original (5.7% versus 6.3% variance in gene expression explained) and maintained a strong association to AD (pLassosum = 3.53 × 10⁻⁸; zLassosum = −5.51). This variant is located approximately 235 kb downstream from the established SPI1 AD locus. In our analysis, a valid model for SPI1 within brain was generated only using SDPR and was not significantly associated with AD (ACAT-OCON p = 0.47; zSDPR = 0.59; R2SDPR = 1.0%). We ran a conditional analysis using a series of logistic regression models within a subset of cohorts analyzed by Kunkle et al. (2019) 37 and confirmed that there are individually significant associations between the SPI1 locus and AD status (z = −3.2, p = 1.35 × 10⁻³) and the genetically-regulated expression of MTCH2 and AD status (z = −4.6, p = 4.08 × 10⁻⁶). However, when both variables are included within the model only the genetically-regulated expression of MTCH2 remains significant (z = −3.3, p = 9.09 × 10⁻⁴) whereas the SPI1 association is no longer significant (z = −0.18, p = 0.86). Additionally, we visualized the correlation between MTCH2 eQTLs and AD-GWAS summary statistics and found a significant enrichment of MTCH2 eQTLs among AD-GWAS significant SNPs (Fisher's exact test p = 3.88 × 10−186) corresponding with a significant correlation between the strength of the MTCH2 eQTLs and AD-GWAS summary statistics (r = 0.82, p = 5.06 × 10−73) (Figure 2). These results suggest that the genetically-regulated expression of MTCH2 appears to be a driving factor behind the SPI1 AD GWAS locus association.
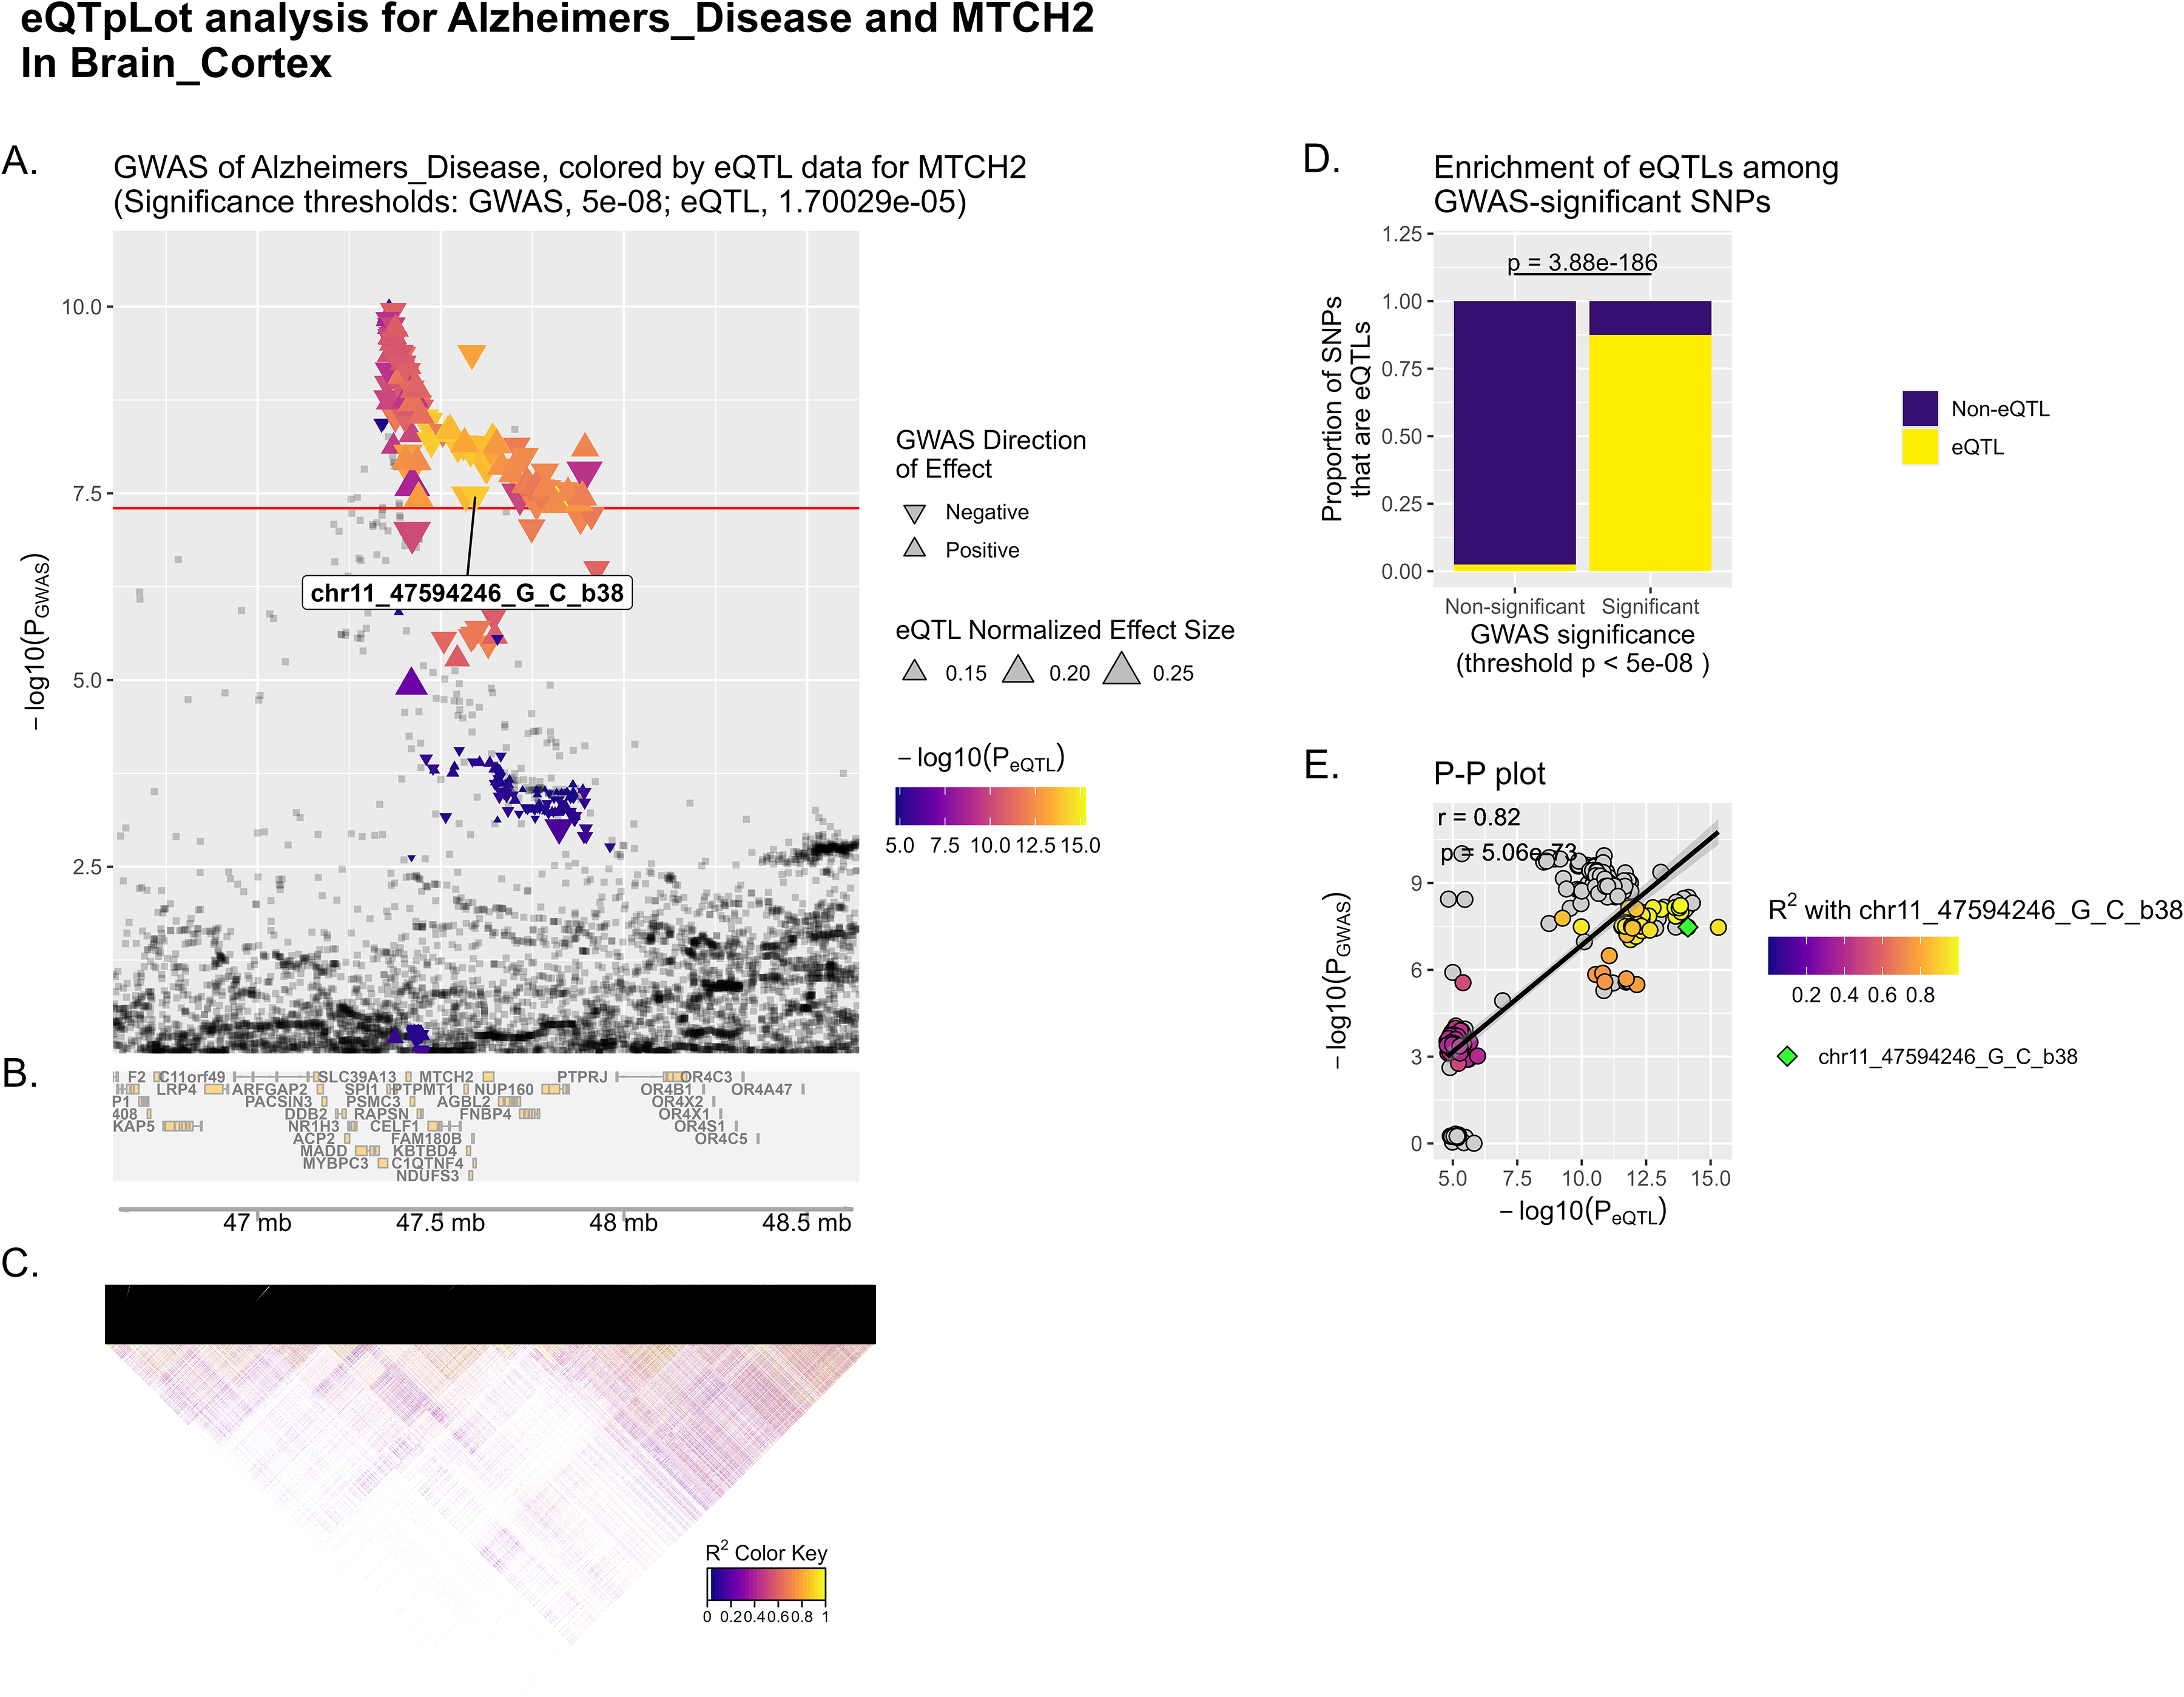
eQTpLot analysis for the brain AD-TWAS association MTCH2. (a) Manhattan plot of GWAS results for Alzheimer's Disease. Points are colored and sized according to corresponding MetaBrain eQTL data for MTCH2. The SNP chr11_47594246_G_C_b38 is the sole variant included in the sparse lassosum fine-mapped model of MTCH2, which retained the strength of its AD-TWAS association despite containing only a single variant. (b) Genomic region surrounding MTCH2, including neighboring genes, based on 1 MB window. (c) Linkage disequilibrium (LD) heatmap for the genomic region. (d) Bar plot showing the enrichment of eQTLs among GWAS-significant SNPs (Fisher's exact test p = 3.88 × 10−186). (E) P-P plot comparing AD-GWAS p-values with eQTL p-values for MTCH2 (Pearson's correlation coefficient r = 0.82, p = 5.06 × 10−73).
However, MADD is located approximately 90 kb upstream from the SPI1 GWAS association 37 and 350 kb upstream from MTCH2. The MADD OTTERS association was primarily driven by the P + T(0.001) approach modeling 307 SNPs (ACAT-OCON p = 6.64 × 10⁻⁸; pP + T_0.001_CON = 2.22 × 10⁻⁸; zP + T_0.001 = −1.65; R2P + T_0.001 = 4.9%). This model was reduced to six credible sets with 14 potential causal eQTLs by SuSiE fine-mapping, which produced a six SNP SDPR model demonstrating slightly improved model performance to the original (4.9% versus 6.3% variance in gene expression explained). This model also maintained a strong negative association to AD (pSDPR = 3.01 × 10⁻⁸; zSDPR = −5.54). Based on our earlier results with MTCH2, we assessed in a series of conditional models whether MADD contributes to the SPI1 locus association and found that MADD genetically-regulated expression was not associated with AD in either the individual (z = −1.2, p = 0.23) or combined models (z = −0.21, p = 0.83). Of note, we were able to impute the genetically-regulated expression of MADD using only five out of six SNPs within the model as the other SNP was unable to be imputed in the ADGC cohort, which may have slightly reduced the strength of the initial MADD association to AD. However, we confirmed using a linear model with imputed MTCH2 expression as the outcome that the genetically-regulated expression of MADD (t MADD = 10.05) and the SPI1 dosage (t SPI1 = 143.35) were both significantly associated predictor variables (p < 2 × 10⁻¹⁶). Moreover, the SPI1 locus is in moderate LD with the single causal eQTL within the MTCH2 expression model (r2 = 0.45) whereas the MADD SNPs are in weak LD with the MTCH2 eQTL (r2 < 0.09) which is reflected in the strength of their effect sizes on MTCH2 expression. When we visualized the correlation between MADD eQTLs and AD-GWAS summary statistics, we did not find a significant enrichment of MADD eQTLs amongst AD-GWAS significant SNPs (Fisher's exact test p = 0.785) (Supplemental Figure 10). Overall, these results suggest that both the MADD AD-TWAS association and SPI1 locus GWAS association are driven by the cis-regulatory region surrounding MTCH2.
Brain: CYB561
The CYB561 OTTERS association was driven by the SDPR approach modeling 1616 SNPs (ACAT-OCON p = 1.99 × 10⁻³³; pSDPR_CON = 3.98 × 10⁻³⁴; zSDPR = −9.83; R2SDPR = 28.1%). Fine-mapping identified seven credible sets each containing a single causal eQTL SNP. OTTERS analysis of these SNPs identified a six SNP SDPR model with nearly identical performance (R2SDPR = 24%) and produced a TWAS result of similar significance (pSDPR = 1.8 × 10⁻²⁰; zSDPR = −9.3). CYB561 is located 34 kb upstream to the identified GWAS associations located near ACE identified in Bellenguez et al., 5 and only 24 kb upstream of the ACE association in Kunkle et al. 37 In our analysis, all modeling approaches produced valid results for ACE within the brain and overall the ACE gene model was nominally negatively associated with AD risk (ACAT-OCON p = 0.001; z = [−0.5, −2.6]; R2SDPR = [6%, 10%]).
As the ACE GWAS locus is located nearly in the middle of the promoter elements of ACE (∼16 kb) and CYB561 (∼24 kb), we assessed in a series of logistic regression models if the genetically-regulated expression of CYB561 is driven by its close proximity to the ACE GWAS locus. We found that while there was a significant association between the ACE locus and AD status (z = 2.9, p = 3.49 × 10⁻³), there was not a significant association between the genetically-regulated expression of CYB561 and AD status (z = −0.757, p = 0.449). Moreover, we confirmed using a linear model with the dosage of the ACE GWAS locus as the outcome variable that the genetically-regulated expression of CYB561 was the strongest significantly associated predictor variable (t = −18.9, p < 2 × 10⁻¹⁶) despite being in weak LD with the ACE GWAS locus (r2 < 0.02). When we visualized the correlation between CYB561 eQTLs and AD-GWAS summary statistics, we did not find a significant enrichment of CYB561 eQTLs among AD-GWAS significant SNPs (Fisher's exact test p = 0.785) (Supplemental Figure 11). These results suggest that the regulatory architecture underlying this genomic region is more complex and requires further exploration in larger sample sizes to clarify the association between CYB561 genetically-regulated expression and AD.
Brain: ZNF439
The OTTERS association for ZNF439 was driven by the lassosum approach, which modeled 1336 SNPs. This model yielded a highly significant association to AD (ACAT-OCON p = 2.21 × 10−52; pLassosum _CON = 1.1 × 10−52; zLassosum = 9.94; R2Lassosum = 5.7%). Though causal eQTL fine-mapping, we identified five credible sets each containing a single causal eQTL and subsequent application of these SNPs to the OTTERS approach led to the generation of a four SNP lassosum model demonstrating slightly reduced model performance in terms of variance explained (R2Lassosum = 5.0%) but further strengthened the association to AD (pLassosum = 3.79 × 10−97; zLassosum = 20.92). Functional annotation of these causal eQTLs revealed that the effect size direction of each SNP within the model corresponded to histone markers of active transcription or repressive chromatin, underscoring the additional biological complexity underlying the functional roles of these genetic variants (Supplemental Material).
Blood: MYBPC3
The original OTTERS association to MYBPC3 was driven most strongly by the P + T 0.001 approach modeling 1081 SNPs (ACAT-OCON p = 4.43 × 10⁻⁸; pP + T_0.001_CON = 1.75 × 10⁻⁸; zP + T_0.001 = 1.41; R2P + T_0.001 = 3.6%). Fine-mapping of MYBPC3 yielded four credible sets each containing a single causal eQTL. Restricting the OTTERS method to the credible causal eQTLs, the SDPR, lassosum, and PRS-CS modeling approaches were able to explain only a negligible proportion of gene expression, falling short of our R2 > 1% filtering threshold. In contrast, the P + T methods used a two-SNP model and maintained a statistically significant positive association with AD risk (pP + T_0.001 = 6.48 × 10−44, zP + T_0.001 = 13.9, R2P + T_0.001 = 1%).
As MYBPC3 is approximately 90 kb upstream the SPI1 AD GWAS locus, we also ran a conditional analysis using a series of logistic regression models to determine whether the genetically-regulated expression of MYBPC3 within blood may be contributing to the SPI1 locus signal. We confirmed that the SPI1 locus was individually associated with AD status (z = −3.2, p = 1.35 × 10⁻³) and that there was a marginal association between the genetically-regulated expression of MYBPC3 and AD status (z = 1.8, p = 0.07). However, when both variables were included within the model, only the SPI1 locus association remained significant (z = −2.73, p = 0.006), while the MYBPC3 genetically-regulated expression association was no longer marginally significant (z = −0.66, p = 0.51). Of note, we were only able to impute the genetically-regulated expression of MYBPC3 using a single-SNP, as the other SNP could not be imputed in the ADGC cohort, which may have reduced the strength of the initial MYBPC3 association to AD. Additionally, the single SNP within the MYBPC3 expression model is in moderate LD with the SPI1 GWAS variant (r2 = 0.49), which may explain the previously found marginal association to AD. When we visualized the correlation between MYBPC3 eQTLs and AD-GWAS summary statistics, we found a significant enrichment of MYBPC3 eQTLs amongst AD-GWAS significant SNPs (Fisher's exact test p = 8.54 × 10−50) corresponding with a significant subtle correlation between the strength of the MYBPC3 eQTLs and AD-GWAS summary statistics (r = 0.23, p = 2.26 × 10⁻³³) (Supplemental Figure 12). Overall, these results suggest that the MYBPC3 AD-TWAS association in blood may possibly contribute to the AD-GWAS signal at the SPI1 locus and further work is necessary to clarify this association.
Conditional analyses in polygenic AD-TWAS associations
We identified two genes (Brain: PSMA5 and ANXA11) that were located proximal to known GWAS loci and potentially driven by polygenic eQTL architectures that were unable to be fine-mapped.
Brain: PSMA5
Our identified PSMA5 OTTERS association was driven most strongly by the SDPR approach, which modeled 2,592 SNPs (ACAT-OCON p = 5.25 × 10⁻⁸; pSDPR _CON = 1.31 × 10⁻⁸; zSDPR = −4.59; R2SDPR = 3.7%), followed closely by the PRS-CS approach also modeling 2,592 SNPs (pPRS−CS _CON = 2.81 × 10⁻⁴; zPRS−CS = −2.48; R2PRS−CS = 5.9%). However, we were unable to fine-map any causal eQTLs within PSMA5 using SuSiE. Given that the SORT1 ADRD GWAS locus 5 is located approximately 66 kb from the transcription start site of PSMA5, we assessed in a series of logistic regression models whether the PSMA5 AD-TWAS association was driven by its proximity to the SORT1 locus. Importantly, in our brain analyses we did not generate a valid model to predict SORT1 expression.
We found a significant association between the SORT1 locus and AD status (z = 6.44, p = 2.62 × 10⁻³) in the ADGC NHW cohort. While the SDPR model of PSMA5 genetically-regulated expression was not significantly associated with AD (z = 1.40, p = 0.16), the PRS-CS model was significantly associated with AD (z = 2.25, p = 0.024). Notably, there was minimal LD between the SORT1 locus and the SNPs contained with the PSMA5 model (r2 < 0.04). In the combined logistic regression model, both the SORT1 locus and PRS-CS genetically-regulated expression of PSMA5 retained their significant associations to AD (pSORT1 = 2.88 × 10⁻³; pPRS−CS_PSMA5 = 0.027), consistent with the slight LD identified between these genetic signals. Collectively, our results suggest that the identified TWAS association between PSMA5 and AD represents a distinct genetic signal, independent of the previously reported GWAS association at the nearby SORT1 ADRD locus.
Brain: ANXA11
The ANXA11 TWAS association was driven mostly strongly by the SDPR approach, which modeled 3157 SNPs (ACAT-OCON p = 3.37 × 10⁻¹²; pSDPR _CON = 8.42 × 10⁻¹³; zSDPR = 5.77; R2SDPR = 1.8%). When examining the correlation between ANXA11 eQTLs and AD-GWAS summary statistics, we observed a subtle but statistically significant relationship between the strength of the ANXA11 eQTLs and AD-GWAS summary statistics (r = 0.3, p = 2.27 × 10⁻¹⁶) (Supplemental Figure 13). Through fine-mapping, we were able to identify six credible sets containing seven causal eQTLs. However, when we re-ran the OTTERS approach restricted to these causal eQTLs, the AD-TWAS association for ANXA11 diminished to nominal significance (p = [0.034, 0.044]), despite the genetically-regulated expression explained by the model increasing from 1.8% to 4.9%. Given that ANXA11 is located ∼343 kb upstream of the TSPAN14 ADRD GWAS locus, we assessed whether TSPAN14 locus might be driving the ANXA11 AD-TWAS association. Using a series of logistic regression models, we found that neither the TSPAN14 locus nor the genetically-regulated expression of ANXA11 was associated with AD status in this cohort. Interestingly, we did identify several SNPs within the 3157 SNP SDPR model that were within high LD (r2 > 0.9) with the TSPAN14 locus. Additionally, ANXA11 was also identified as a significant ADRD-TWAS association (Supplemental Table 2), suggesting that the initial AD-TWAS association may be driven instead by co-occurring forms of dementia (e.g., Fronto-temporal dementia) and/or misdiagnosis. Furthermore, our findings suggest that the TSPAN14 ADRD GWAS locus may be associated with a broader ADRD phenotype rather than a clinical AD phenotype.
Discussion
In this study, we leveraged the largest available eQTL meta-analysis summary statistics from both cortical brain tissue and blood, and applied them to the largest clinically adjudicated AD case-control GWAS dataset through a summary-statistics based TWAS framework. This approach utilized five different methods to capture a range of sparse to polygenic genetic architectures underlying gene expression regulation. Using this TWAS framework, we identified and validated five novel genes within cortical brain tissue (PRKAG1, C3orf62, LYSMD4, ZNF439, SLC11A2) where the genetically-regulated expression of these genes was significantly associated with AD status. Additionally, we identified and validated six genes that were proximal to known AD/ADRD GWAS associations (Blood: MYBPC3; Brain: MTCH2, CYB561, MADD, PSMA5, ANXA11). Finally, we fine-mapped causal eQTLs and obtained similar or improved TWAS power for five genes (MTCH2, MADD, CYB561, ZNF439 and MYBPC3) when using sparse eQTL prediction models.
Our identified novel validated associations span a wide spectrum of functional understanding, with genes having limited information on function (LYSMD4, C3orf62, ZNF439) to genes with recognized roles in energy metabolism (PRKAG1) and iron homeostasis (SLC11A2). Although functional information on LYSMD4, C3orf62, and ZNF439 is limited, several studies support their biological relevance to Alzheimer's disease. These genes have been implicated in processes such as neuronal development (LYSMD4, 47 C3orf62, 48 ZNF439 49 ) and degeneration (LYSMD4, 50 ZNF439 51 ). Based on the limited information available, further mechanistic studies are essential to elucidate how the expression of these genes is connected to AD.
PRKAG1 (Protein Kinase AMP-activated Non-Catalytic Subunit Gamma 1) encodes a component of AMPK and is involved in sensing cellular energy. During metabolic stress, AMPK inhibits macromolecule biosynthesis and cell growth while activating energy-producing pathways. In our study, we found that low levels of PRKAG1 within cortical brain tissue were associated with an increased AD risk (ACAT-OCON p = 1.73 × 10⁻⁷). Interestingly, a 2012 study using healthy adult human cortical slices exposed to sublethal doses of amyloid-beta soluble oligomers found PRKAG1 to be upregulated after exposure. 52 This work suggests our association may be driven by lack of proper biological compensation during high AD pathology and further work is needed to clarify the role of PRKAG1. While PRKAG1 has limited associations with AD, activators of AMPK are recognized for their therapeutic potential in treating AD such as by promoting autophagy and reducing insulin resistance. 53 For instance, researchers have found that moderate aerobic exercise can counteract amyloid-beta-induced learning and memory impairment in animal models through in part AMPK restoration. 54
SLC11A2 (Solute carrier family 11 member 2) encodes a proton-coupled divalent metal ion transporter that plays a critical role in iron homeostasis and has been previously associated with amyotrophic lateral sclerosis (ALS) and Parkinson's disease. In our study, we found reduced expression of SLC11A2 within the brain was associated with an increased AD risk (ACAT-OCON p = 4.39 × 10⁻¹⁴). While there are limited studies specifically exploring the connection between SLC11A2 and AD, one prior study used 216 AD cases and 323 controls found a nominally significant (p = 0.08) association between a variant (rs407135) within SLC11A2 and AD. 55 Interestingly, in a prion mouse model Slc11a2 expression within the hippocampus was found to be sustainably reduced during disease progression which is concordant with our findings. 56
Our TWAS associations identified as proximal to known AD/ADRD loci include PSMA5 (component of 20S core proteasome complex), ANXA11 (calcium–dependent phospholipid-binding protein), MTCH2 (mitochondrial insertase and regulator of apoptosis and lipid homeostasis), MADD (adaptor protein regulating apoptosis through activation of mitogen-activated protein kinase), and CYB561 (Transmembrane Ascorbate-Dependent Reductase).
Several previous AD TWAS studies have identified MTCH2 as being associated with AD status, and our work further supports the notion that the genetically-regulated expression of MTCH2 appears to drive the GWAS association at the SPI1 locus.34,35 Notably, we were able to retain the strength of this association using only a single causal eQTL for MTCH2 genetically-regulated expression. This result builds upon prior work by Gockley et al. (2021) as they also identified MTCH2 genetically-regulated expression as significantly negatively associated with AD using six neo-cortical brain tissues (N_RNA-seq = 888) (Supplemental Table 5). 35 Through joint-conditional probability analysis and colocalization analysis, these researchers identified that MTCH2 likely shares a single causal variant with the SPI1 locus. 35 However, their best performing models for MTCH2 expression contained 260 SNPs, none of which overlapped with the SNPs identified as causal eQTLs through fine-mapping and/or retained in our OTTERS models, which highlights the importance of fine-mapping causal eQTLs using the largest available eQTL resource (Supplemental Material). MADD is also located near SPI1 and has been found to be negatively associated AD status and our results support that this association may be driven by MTCH2. Critically, we cannot exclude the possibility that other nearby genes contribute to AD risk at this locus, and SPI1 has been functionally validated with extensive modeling within myeloid cells, especially microglia, for its role in AD risk. 57
Interestingly, ANXA11 has been found in prior work to be associated with ALS with or without frontotemporal dementia and our work further supports the role of ANXA11 in neurodegeneration. 58 PSMA5 has also been associated with AD based on several in vivo animal models that have identified PSMA5 downregulation is involved in APP-induced inhibition of cell proliferation, and our work further motivates additional studies to clarify how PSMA5 expression modulation impacts AD pathogenesis.59–61
To further explore the novelty of our findings, we compared our validated AD associations to seven prior AD TWAS26,27,29,35,62,63 and Mendelian Randomization (MR) 64 studies (Supplemental Table 5). Most of these studies reported either nominal or no associations with AD, except for the AD-MTCH2 association, which replicated and was discussed previously. 35 The lack of strong replicating associations may stem from differences in sample sizes, modeling approaches, and AD GWAS summary statistics. As our study represents the largest AD-TWAS conducted to date, these findings emphasize the importance of increasing sample sizes to uncover new associations.
There are several considerations to our study. First, we examined only cis-regulatory variants, as the OTTERS framework was designed for cis-eQTLs, and prior work has found that trans-eQTL effects tend to be relatively weaker. 65 While we used a standard 1 Mb window around the transcription start and end sites, we acknowledge that regions outside of this window may also harbor relevant eQTLs due to the complex 3D architecture of chromatin interactions.
We focused our analysis on cortical brain tissue, which provided the largest available brain sample size, to enhance statistical power for detecting tissue-specific effects—a challenge when using multi-tissue modeling. Prior work has suggested that approximately 8,000 samples are optimal for imputation model training in TWAS, while 56,000 samples are needed in the GWAS summary statistics to achieve maximal power. 66 Given these benchmarks, our study stands as the most well-powered AD-TWAS to date, leveraging brain and blood eQTL meta-analyses and diverse modeling approaches. However, by utilizing the largest available eQTL meta-analyses, we were unable to identify independent datasets with sufficient sample size to perform robust validation. Therefore, larger brain sample sizes will be crucial to improve statistical power for future work and enable researchers to further uncover the genetic mechanisms underlying AD risk.
Additionally, the cortical brain tissue eQTL data from MetaBrain is aggregated from numerous studies that sampled various cortical brain regions, including the dorsolateral prefrontal cortex, frontal cortex, anterior cingulate cortex, and temporal cortex. 11 Consequently, our findings pertain to bulk cortical brain tissue, rather than specific regions where individual associations may differ. We are unable to identify which brain cell types contribute to the observed bulk associations solely based on their bulk expression signature. Future development and application of single-cell brain datasets will be essential for clarifying the cellular context of these associations. However, our examination of baseline single-cell expression data for these genes in the Human Protein Atlas (proteinatlas.org) 67 suggests that the identified AD-associated genes show low regional and cell-type specificity within the brain, aligning with our use of bulk eQTL data in this analysis (Supplemental Figures 14–23). For MYBPC3, the single validated AD-blood association, we observed increased expression in macrophages within the central nervous system, along with slightly elevated expression in neutrophils and monocytes (Supplemental Figure 24). This finding suggests the MYBPC3 AD-TWAS association may be driven by its expression in immune cells.
Although we performed fine-mapping of our TWAS associations, our results suggest only a small portion of TWAS associations are explained by fine-mapped causal eQTLs. While we propose that models not amenable to fine-mapping are likely driven by more polygenic gene expression models, it is also possible that these are explained by other effects unmeasured in our analysis, like long-range linkage disequilibrium, haplotype effects, or the tagging of structural variants or other unobserved genetic variants. Additionally, using our stringent validation criteria, we may have missed TWAS associations that are driven by gene expression changes that do not persist into later stages of the disease captured by our differential expression association analyses. However, as these results represent the best independent evaluation of our TWAS effects, we have chosen to specifically highlight genes meeting this validation criterion.
Finally, our study's generalizability is limited by its focus on individuals of European descent, as the underlying eQTL meta-analysis primarily used European-descent samples. This restriction means the identified genetic associations may not translate uniformly across diverse populations, a limitation highlighted by existing research on polygenic risk scores showing reduced transferability of European-derived genetic risk models to other ancestral groups. 67 While genetic signals likely include both shared and ancestry-specific components, ongoing research capturing broader genomic diversity will be essential to distinguish between these components.
Overall, by combining multiple large scale eQTL summary statistics with AD GWAS results, we have performed a TWAS that identified several new gene associations to AD and provided functional insights for several previously associated GWAS loci.
Supplemental Material
sj-docx-2-alz-10.1177_13872877251326288 - Supplemental material for Brain and blood transcriptome-wide association studies identify five novel genes associated with Alzheimer's disease
Supplemental material, sj-docx-2-alz-10.1177_13872877251326288 for Brain and blood transcriptome-wide association studies identify five novel genes associated with Alzheimer's disease by Makaela A Mews, Adam C Naj, Anthony J Griswold, , Jennifer E Below and William S Bush in Journal of Alzheimer's Disease
Supplemental Material
sj-xlsx-3-alz-10.1177_13872877251326288 - Supplemental material for Brain and blood transcriptome-wide association studies identify five novel genes associated with Alzheimer's disease
Supplemental material, sj-xlsx-3-alz-10.1177_13872877251326288 for Brain and blood transcriptome-wide association studies identify five novel genes associated with Alzheimer's disease by Makaela A Mews, Adam C Naj, Anthony J Griswold, , Jennifer E Below and William S Bush in Journal of Alzheimer's Disease
Footnotes
Acknowledgments
We would like to thank all the authors who contributed to the summary statistics from the eQTL datasets (MetaBrain, eQTLGen) and AD/ADRD GWAS as these resources were invaluable to our work. We are also grateful to the authors of the OTTERS pipeline for their clear published methodology. The conditional analyses utilized data from the Alzheimer's Disease Genetics Consortium (ADGC) (https://www.adgenetics.org/). The researchers associated with the ADGC (Collaborators Appendix) contributed to the planning and execution of the ADGC, and/or provided data, but were not involved in the analysis or writing of this article. The full acknowledgement statement for the Alzheimer's Disease Genetics Consortium can be found here:  . We are grateful to the contributors who gathered the samples utilized in this study, as well as the patients and their families, whose assistance and participation enabled this work to be carried out. The Genotype-Tissue Expression (GTEx) Project was supported by the Common Fund of the Office of the Director of the National Institutes of Health, and by NCI, NHGRI, NHLBI, NIDA, NIMH, and NINDS. The data used for the analyses described in this manuscript was obtained from dbGaP accession number phs000424.v7.p2 on 04/03/2018. This work made use of the High Performance Computing Resource in the Core Facility for Advanced Research Computing at Case Western Reserve University.
Consent to participate
Written informed consent was obtained either from the study participant or legal guardian.
Consent for publication
Not applicable.
Ethical considerations
All study procedures were approved by the institutional review boards at each corresponding study center.
Author contributions
Makaela A Mews (Conceptualization; Formal analysis; Investigation; Methodology; Visualization; Writing – original draft; Writing – review & editing); Adam C Naj (Funding acquisition; Writing – review & editing); Anthony J Griswold (Data curation; Funding acquisition; Resources); Jennifer E Below (Funding acquisition; Writing – review & editing); William S Bush (Conceptualization; Funding acquisition; Project administration; Resources; Supervision; Writing – review & editing).
Funding
The authors disclosed receipt of the following financial support for the research, authorship, and/or publication of this article: This work was funded by the National Institute on Aging (NIA) (Grant: RF1AG061351; PIs: Adam C Naj, PhD, Jennifer E Below, PhD, and William S Bush, PhD & Grant: RF1AG070935; PIs: Anthony J Griswold, PhD and William S Bush, PhD). Our funding sources had no role in the preparation or submission of this manuscript.
Declaration of conflicting interests
The authors declared no potential conflicts of interest with respect to the research, authorship, and/or publication of this article.
Data availability
The data supporting the findings of this study are available on request from the corresponding author. These analyses were derived from the following resources available in the public domain: 1000 Genomes high coverage (https://ftp.1000genomes.ebi.ac.uk/vol1/ftp/data_collections/1000G_2504_high_coverage/working/20220422_3202_phased_SNV_INDEL_SV/), GTEX (v8) (https://www.gtexportal.org/home/downloads/adult-gtex/overview; dbGap accession number: phs000424.v7.p2 accessed on 04/03/2018), MetaBrain summary statistics (https://metabrain.nl/cis-eqtls.html), eQTLGen summary statistics (https://eqtlgen.org/cis-eqtls.html), Kunkle et al. (2019) clinically-adjudicated AD GWAS summary statistics (https://www.niagads.org/datasets/ng00075#:∼:text = Overview.%20The%20International%20Genomics%20of%20Alzheimer's%20Project), Bellenguez et al. (2022) AD GWAX summary statistics (https://www.ebi.ac.uk/gwas/studies/GCST90027158), and Brain Expression Validation Dataset (https://drive.google.com/drive/folders/15WmJsBXIH3Feib9Vu_bU2VpYQ2pDc8WX). We used the OTTERS pipeline () for the basis of our AD-TWAS analysis.
Supplemental material
Supplemental material for this article is available online.
Collaborators appendix
The collaborators associated with the Alzheimer's Disease Genetics Consortium (ADGC) include the following individuals: Erin Abner, PhD; Perrie M. Adams, PhD; Alyssa Aguirre, LCSW; Marilyn S. Albert, PhD; Roger L. Albin, MD; Mariet Allen, PhD; Lisa Alvarez, Howard Andrews, PhD; Liana G. Apostolova, MD; Steven E. Arnold, MD; Sanjay Asthana, MD; Craig S. Atwood, PhD; Gayle Ayres, DO; Robert C. Barber, PhD; Lisa L. Barnes, PhD; Sandra Barral, PhD; Jackie Bartlett, PhD; Thomas G. Beach, MD PhD; James T. Becker, PhD; Gary W. Beecham, PhD; Penelope Benchek, PhD; David A. Bennett, MD; John Bertelson, MD; Sarah A. Biber, PhD; Thomas D. Bird, MD; Deborah Blacker, MD; Bradley F. Boeve, MD; James D. Bowen, MD; Adam Boxer, MD, PhD; James B. Brewer, MD; James R. Burke, MD PhD; Jeffrey M. Burns, MD MS; William S. Bush, PhD; Joseph D. Buxbaum, PhD; Goldie Byrd, PhD; Laura B. Cantwell, MPH; Chuanhai Cao, PhD; Cynthia M. Carlsson, MD; Minerva M. Carrasquillo, PhD; Kwun C. Chan, PhD; Scott Chasse, PhD; Yen-Chi Chen, PhD; Marie-Francoise Chesselet, PhD; Nathaniel A. Chin, MD; Helena C. Chui, MD; Jaeyoon Chung, PhD; Suzanne Craft, PhD; Paul K. Crane, MD MPH; Marissa Cranney, BS; Carlos Cruchaga, PhD; Michael L. Cuccaro, PhD; Jessica Culhane, PhD; C. Munro Cullum, PhD; Eveleen Darby, MA MS; Barbara Davis, MA; Philip L. De Jager, MD PhD; Charles DeCarli, MD; John C. DeToledo, MD; Dennis W. Dickson, MD; Nic Dobbins, PhD; Ranjan Duara, MD; Nilufer Ertekin-Taner, MD PhD; Denis A. Evans, MD; Kelley M. Faber, MS; Thomas J. Fairchild, PhD; Daniele Fallin, PhD; Kenneth B. Fallon, MD; David W. Fardo, PhD; Martin R. Farlow, MD; John Farrell, PhD; Lindsay A. Farrer, PhD; Victoria Fernandez-Hernandez, Tatiana M. Foroud, PhD; Matthew P. Frosch, MD PhD; Douglas R. Galasko, MD; Adriana Gamboa, BS; Kathryn M. Gauthreaux, PhD; Tamar Gefen, PhD; Daniel H. Geschwind, MD PhD; Bernardino Ghetti, MD; John R. Gilbert, PhD; Alison M. Goate, D.Phil; Thomas Grabowski, MD; Neill R. Graff-Radford, MD; Anthony R. Griswold, PhD; Jonathan L. Haines, PhD; Hakon Hakonarson, MD PhD; Kathleen Hall, PhD; James R. Hall, PhD; Ronald L. Hamilton, MD; Kara L. Hamilton-Nelson, MPH; Xudong Han, PhD; Oscar Harari, PhD; John Hardy, PhD; Lindy E. Harrell, MD PhD; Elizabeth Head, PhD; Victor Henderson, MD MS; Michelle Hernandez, BS; Lawrence S. Honig, MD PhD; Ryan M. Huebinger, PhD; Matthew J. Huentelman, PhD; Christine M. Hulette, MD; Bradley T. Hyman, MD PhD; Linda Hynan, PhD; Laura Ibanez, BS; Gail P. Jarvik, MD PhD; Suman Jayadev, MD; Lee-Way Jin, MD PhD; Kimberly Johnson, MSW PhD; Leigh Johnson, PhD; Bruce Jones, PhD; Gyungah Jun, PhD; M. Ilyas Kamboh, PhD; Moon Il Kang, PhD; Anna Karydas, BA; Mindy J. Katz, MPH; John S.K. Kauwe, PhD; Jeffrey A. Kaye, MD; C. Dirk Keene, MD PhD; Benjamin Keller, PhD; Aisha Khaleeq, MD; Ronald Kim, MD; Janice Knebl, DO; Neil W. Kowall, MD; Joel H. Kramer, PsyD; Walter A. Kukull, PhD; Brian W. Kunkle, PHD MPH; Amanda P. Kuzma, MS; Frank M. LaFerla, PhD; James J. Lah, MD PhD; Eric B. Larson, MD MPH; Melissa Lerch PhD; Alan J. Lerner MD; Yuk Ye Leung, PhD; James B. Leverenz, MD; Allan I. Levey, MD PhD; Andrew P. Lieberman, MD PhD; Richard B. Lipton, MD; Oscar L. Lopez, MD; Kathryn L. Lunetta, PhD; Constantine G. Lyketsos, MD MHS; Douglas Mains, DrPH; Jennifer Manly, PhD; Logue Mark, PhD; David Marquez, PhD; Daniel C. Marson, JD PhD; Eden R. Martin, PhD; Eliezer Masliah, MD; Paul Massman, PhD; Arjun V. Masurkar, MD PhD; Richard Mayeux, MD; Wayne C. McCormick, MD MPH; Susan M. McCurry, PhD; Stefan McDonough, PhD; Ann C. McKee, MD; Marsel Mesulam, MD; Jesse Mez, PhD; Bruce L. Miller, MD; Carol A. Miller, MD; Charles Mock, PhD; Abhay Moghekar, MD; Thomas J. Montine, MD PhD; Edwin Monuki, Sean D. Mooney, PhD; John C. Morris, MD; Shubhabrata Mukherjee, PhD; Amanda J. Myers, PhD; Adam C. Naj, PhD; Trung Nguyen, PhD; James Noble, PhD; Kelley Nudelman, PhD; Sid E. O’Bryant, PhD; Kyle Ormsby, PhD; Marcia Ory, PhD MPH; Raymond Palmer, PhD; Joseph E. Parisi, MD; Henry L. Paulson, MD PhD; Valory Pavlik, PhD; David Paydarfar, MD; Victoria Perez, BS; Margaret A. Pericak-Vance, PhD; Ronald C. Petersen, MD PhD; Marsha Polk, BS; Liming Qu, MS; Mary Quiceno, MD; Joseph F. Quinn, MD; Ashok Raj, MD; Farid Rajabli, PhD; Vijay Ramanan, PhD; Eric M. Reiman, MD; Joan S. Reisch, PhD; Christiane Reitz, MD PhD; John M. Ringman, MD; Erik D. Roberson, MD PhD; Monica Rodriguear, MA; Ekaterina Rogaeva, PhD; Howard J. Rosen, MD; Roger N. Rosenberg, MD; Donald R. Royall, MD; Mary Sano, PhD; Andrew J. Saykin, PsyD; Gerard D. Schellenberg, PhD; Julie A. Schneider, MD; Lon S. Schneider, MD; William W. Seeley, MD; Richard M. Sherva, PhD; Dean K. Shibata, PhD; Scott Small, MD; Amanda G. Smith, MD; Janet Smith, BS; Yeunjoo Song, PhD; Salvatore Spina, MD; Peter St George-Hyslop, MD FRCP; Robert A. Stern, PhD; Alan Stevens, PhD; Stephen Strittmatter, MD PhD; David Sultzer, BS; Russell H. Swerdlow, MD; Andrew Teich, PhD; Jeffrey Tilson, PhD; Giuseppe Tosto, MD; John Q. Trojanowski, MD PhD; Juan C. Troncoso, MD; Debby W. Tsuang, MD; Otto Valladares, MS; Vivianna M. Van Deerlin, MD PhD; Christopher Van Dyck, MD; Linda J. Van Eldik, PhD; Jeffery M. Vance, MD PhD; Badri N. Vardarajan, MS; Robert Vassar, PhD; Harry V. Vinters, MD; Li-San Wang, PhD; Sandra Weintraub, PhD; Kathleen A. Welsh-Bohmer, PhD; Nick Wheeler, PhD; Ellen Wijsman, PhD; Kirk C. Wilhelmsen, MD PhD; Benjamin Williams, MD; Jennifer Williamson, MS; Henrick Wilms, MD; Thomas S. Wingo, MD; Thomas Wisniewski, MD; Randall L. Woltjer, MD PhD; Martin Woon, PhD; Steven G. Younkin, MD PhD; Lei Yu, PhD; Yi Zhao, MS; Xiongwei Zhou, PhD; Congcong Zhu, PhD
References
Supplementary Material
Please find the following supplemental material available below.
For Open Access articles published under a Creative Commons License, all supplemental material carries the same license as the article it is associated with.
For non-Open Access articles published, all supplemental material carries a non-exclusive license, and permission requests for re-use of supplemental material or any part of supplemental material shall be sent directly to the copyright owner as specified in the copyright notice associated with the article.
