
Abstract
Background
Neuropsychological (NP) assessment is crucial for diagnosing prodromal and Alzheimer's disease and related dementia (ADRD) syndromes. Yet, traditional NP scores often overlook errors and the process by which summary scores are obtained; information that can provide deeper insights into cognitive impairments and clinical heterogeneity.
Objective
To classify community-dwelling adults into neurocognitive phenotypes, identify NP test errors and processes that differentiate between groups, and explore their association with brain imaging measures.
Methods
Framingham Heart Study (FHS) data were analyzed, focusing on NP summary scores and errors derived from the Boston Process Approach. Latent class analysis identified distinct neurocognitive phenotypes. Regression analyses assessed the relationships with NP errors and brain MRI measures.
Results
A total of 1195 participants (mean age 69.6 and 56.3% women) were included. Cognitively normal (CN), moderate-mixed, and dysexecutive impairment groups were identified. The number of Trail Making Test – Part B (TMT-B) pen lifts and TMT-B examiner-corrected errors were associated with the dysexecutive phenotype and differentiated it from the CN group (OR = 1.39, 95% CI = 1.28–1.52, p < 0.001, AUC = 0.85 and OR = 3.40, 95% CI = 2.65–4.38, p < 0.001, AUC = 0.92; respectively). Similarly, Boston Naming Test (BNT) circumlocution errors were associated with the moderate-mixed phenotype and differentiated it from the CN group (OR = 1.87, 95% CI = 1.49–2.35, p < 0.001, AUC = 0.81). These scores were significantly associated with reduced hippocampal volumes.
Conclusions
Detailed NP error and process analysis enhances traditional methods, offering a comprehensive approach to identifying and understanding cognitive impairments.
Keywords
Introduction
Alzheimer's disease (AD) is believed to be the most common cause of dementia, yet the neuropathology associated with a clinical diagnosis of AD has considerable neuropathological heterogeneity and presents with multiple underlying components.1–3 In one recent autopsy series, participants presenting with only AD-related pathology were actually quite rare. Moreover, in life, most of these participants did not develop dementia. 4 Neuropsychological (NP) assessment is a key component used to characterize and diagnose both prodromal dementia syndromes, such as mild cognitive impairment (MCI), and dementia, including AD and related dementias (ADRD). In recent years, analysis of NP summary scores using sophisticated, person-centered statistical methods has indicated the presence of considerable clinical heterogeneity (i.e., evidence for the existence of a number of MCI and ADRD phenotypic syndromes).5,6 Libon and colleagues found that when a panel of NP summary scores was analyzed using latent class analysis (LCA), patients could be classified into groups presenting with a single-domain amnestic disorder, a single-domain dysexecutive syndrome, as well as a group with mild, multi-domain ADRD, and a group with moderate, more advanced ADRD. 5
In addition to summary scores, an analysis of the errors and processes by which NP tests are completed can augment and provide additional information regarding the brain-behavior relations that underlie MCI and ADRD syndromes.6–8 Thus, when statistically determined MCI subgroups were studied, Libon and colleagues also found that subsequent analyses of processes and errors extracted from NP summary scores measuring executive, language, and memory abilities revealed performance patterns that were similar to AD and non-AD dementia. 8 The analysis of processes and errors seen on NP tests is the cornerstone of the Boston Process Approach (BPA), as described by Edith Kaplan.9,10 Kaplan's conceptualization of the BPA does not suggest that an analysis of errors or process scores will or should replace or supplant traditional summary scores but that all NP tests and their accompanying summary scores measure various neurocognitive operations.9,10 Thus, the analysis of errors and processes provides a level of granularity that can identify and disambiguate subtle neurocognitive constructs that underlie ADRD and MCI syndromes, complementing summary scores.11,12
Much of the prior literature that has analyzed NP process and error behaviors has been conducted with memory clinic patients.6–8,13 However, research with memory clinic patients tends to selectively include more cognitively impaired patients who are seeking clinical services and may not necessarily be representative of the greater population. Thus, a question that remains to be explored is how an analysis of processes and errors made on NP tests generalizes to non-memory clinic, community-dwelling participants. Only a limited number of studies have examined the role of error responses on NP functioning in community-based cohorts, including data from the Framingham Heart Study (FHS).12,14–17 These community-based studies have provided emerging, preliminary evidence suggesting that an analysis of errors and other BPA-based measures can help characterize neurocognitive and underlying brain changes thought to be related to ADRD and MCI.
In this study, we applied LCA to a panel of NP summary scores to classify participants from FHS into distinct NP phenotypes. Given the observed heterogeneity in the clinical presentation of MCI and ADRD syndromes, a person-centered analysis, such as LCA, allows for a data-driven approach to uncover and characterize specific homogeneous NP phenotypes. We then examined the association between these LCA-determined groups and the errors and other BPA-based measures made on these tests.5–7 The primary objective of this study was to identify NP test errors and process scores that differentiated LCA-determined neurocognitive phenotypes in a community-dwelling cohort and explore their associations with brain magnetic resonance imaging (MRI) measures.
Methods
Study population and sample
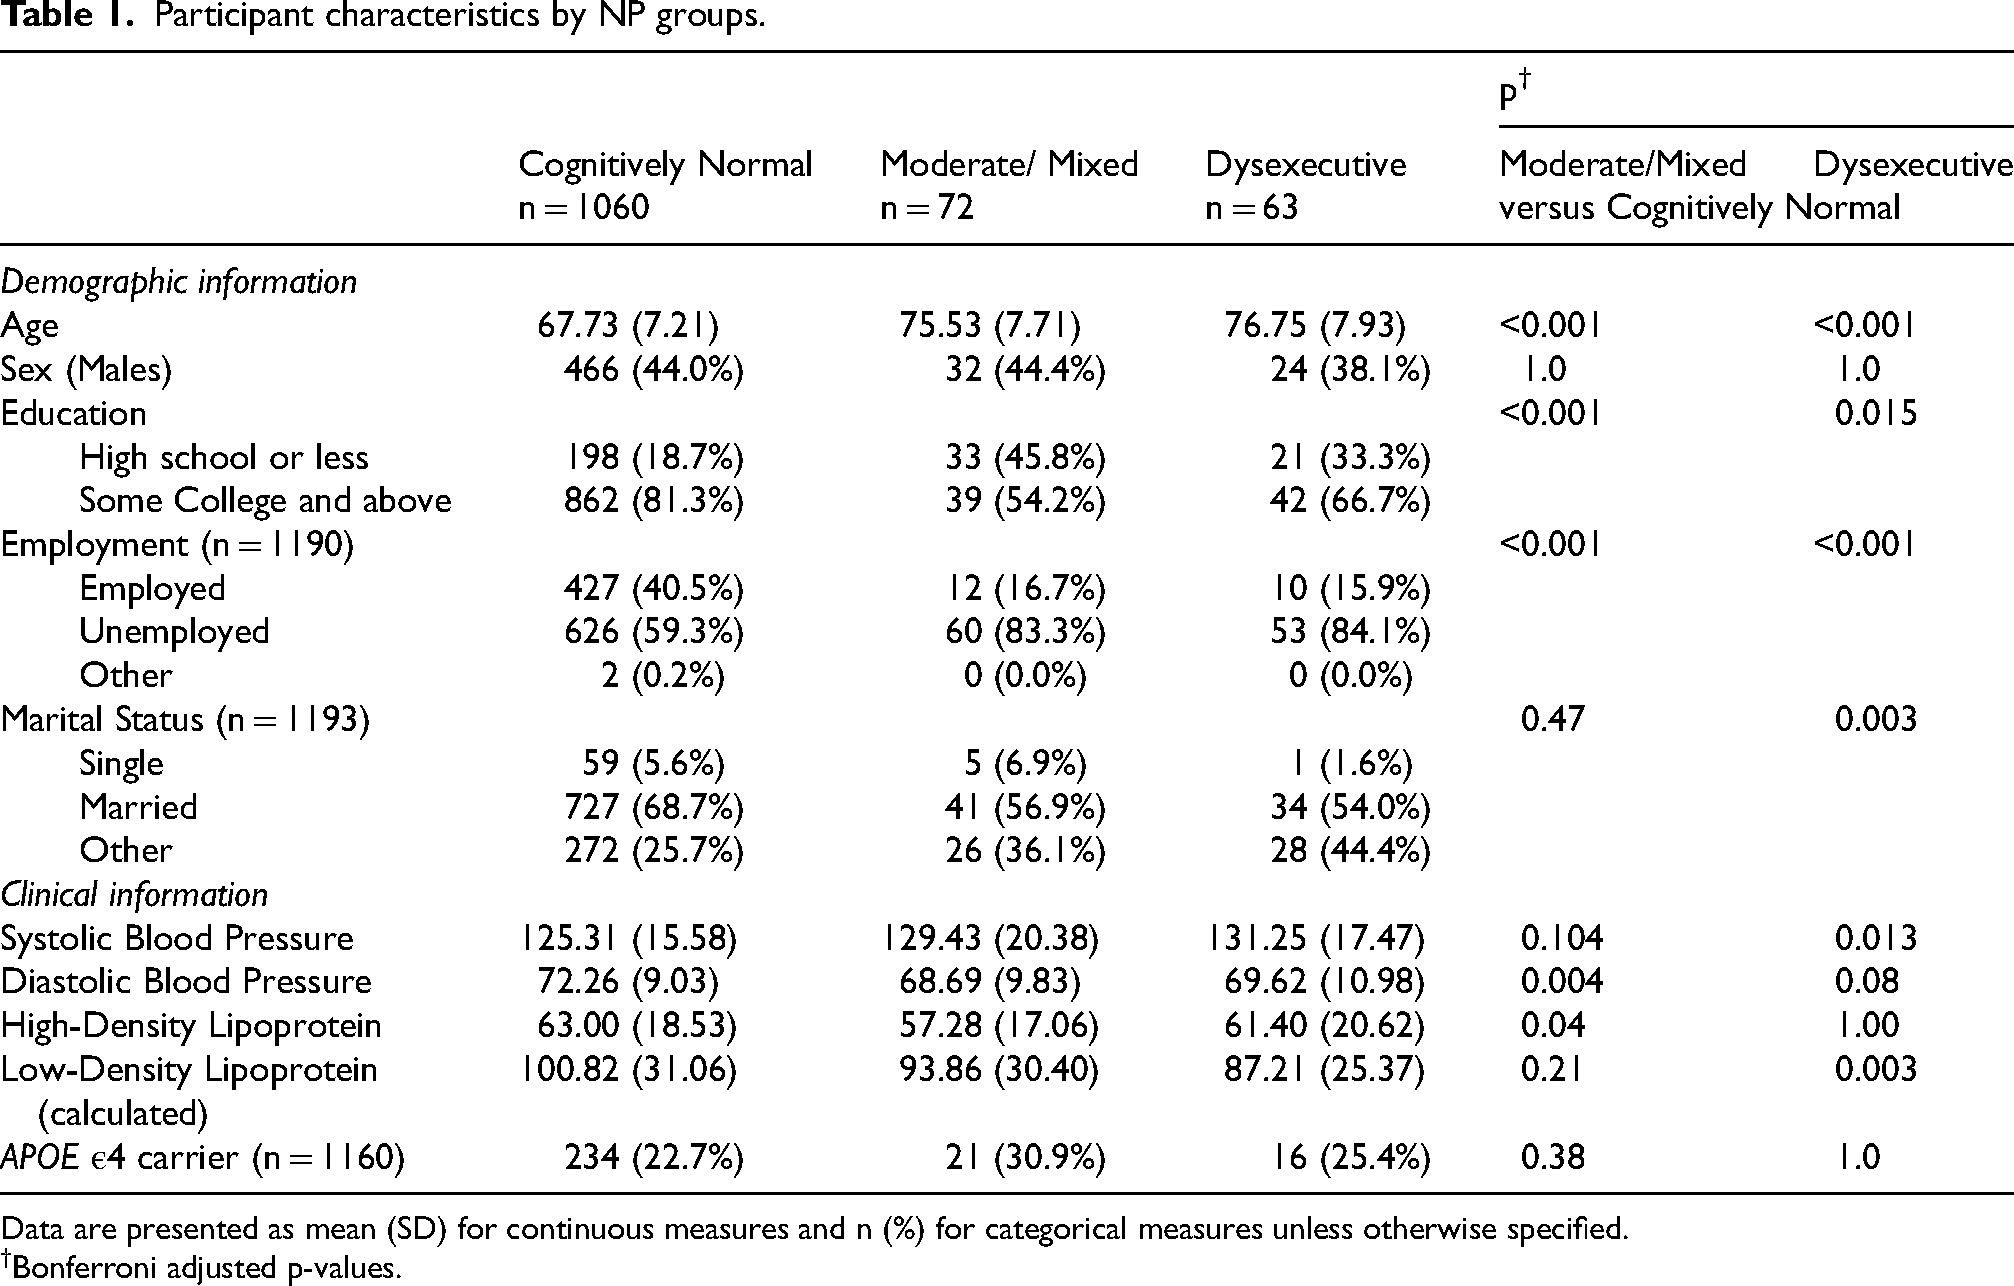
Initiated in 1948, FHS is a longitudinal, community-based cohort with regular health exams.18,19 The present study used data from the FHS Offspring (Gen 2) cohort, which began in 1971–1975 with 5124 participants who had, on average, health exams every four years. The design and selection criteria for the Gen 2 cohort have been previously described. 18 To be eligible for inclusion in the study sample, participants had to attend the ninth core health exam (Exam 9) between 2011–2014 and have available NP information and MRI measures. Based on these eligibility criteria, the sample included 1195 participants. All FHS participants included in this study were characterized as cognitively normal. Informed consent was obtained from all study participants, and the study protocol was approved by the Institutional Review Board of the Boston University Medical Campus.
Neuropsychological evaluation
Starting in 1976, a baseline NP assessment was administered to FHS participants. Follow-up NP tests were performed, on average, every 2–6 years. Details regarding the NP tests administered, their summary scores, and normative data have been previously published.20–22 The specific NP tests analyzed in the current study assessed three neurocognitive domains: (1) executive abilities (Wechsler Adult Intelligence Scale (WAIS) Digit Span Backward subtest; Controlled Oral Word Association Test (letters ‘FAS’); Trail Making Test, Part B (TMT-B)); (2) language and language-related abilities (Boston Naming Test (BNT) – 30 item version; ‘animal’ fluency test; WAIS Similarities subtest); and (3) verbal episodic memory (Wechsler Memory Scale (WMS) Logical Memory (LM) – Immediate Recall; WMS LM – Delayed Recall; WMS LM – Delayed Recognition tests). For the TMT test, participants were explicitly instructed not to lift the pen from the paper.
Unique to FHS is that all NP tests are scored using tenets suggested by the BPA, 9 which is based on the notion that a variety of neurocognitive abilities underlie the summary scores obtained from virtually all NP tests. Scoring errors and process-related behavior are based on careful observation of the research participant by the examiner during the entire testing process to determine how, when, and why successful responses and errors emerge.9,10,12 Using these procedures, it is possible to obtain a better understanding of the scope of the cognitive processes underlying the behavior.
The analysis of errors undertaken in the current study included perseverations, intrusions, and confabulations, which can provide insight into how the participant arrived at an incorrect response. 11 From the protocol of NP tests listed above, we examined a total of 19 errors and process scores (Supplemental Table 1).
Brain imaging measures
Participants who attended Exam 9 and had available NP data also underwent a brain MRI scan between 2011–2014. MRI acquisition and measurement techniques have previously been described. 23 Brain MRI measures included total and regional (e.g., left hemisphere, right hemisphere) markers of neurodegeneration (hippocampal volumes (milliliters (mL3)) and markers of cerebrovascular disease (white matter hyperintensity (WMH) volumes (mL3); these areas were selected a priori based on literature describing the involvement of these brain markers in neurodegenerative conditions, including MCI and AD.24,25 All images were read masked to demographic and clinical information using a custom-design analysis package. 23 Inter-rater reliability values for agreement among more than 10 raters was robust (0.90; see 23 ).
Statistical analysis
Covariates
Age at NP exam (years), sex (female, male), and education (years) were included as potential confounders in the analyses. We also included total cerebral volume (mL3), as a covariate in models that assessed the relationship between NP errors and process scores and brain structural MRI measures of interest to correct for head size.
LCA determined NP groups
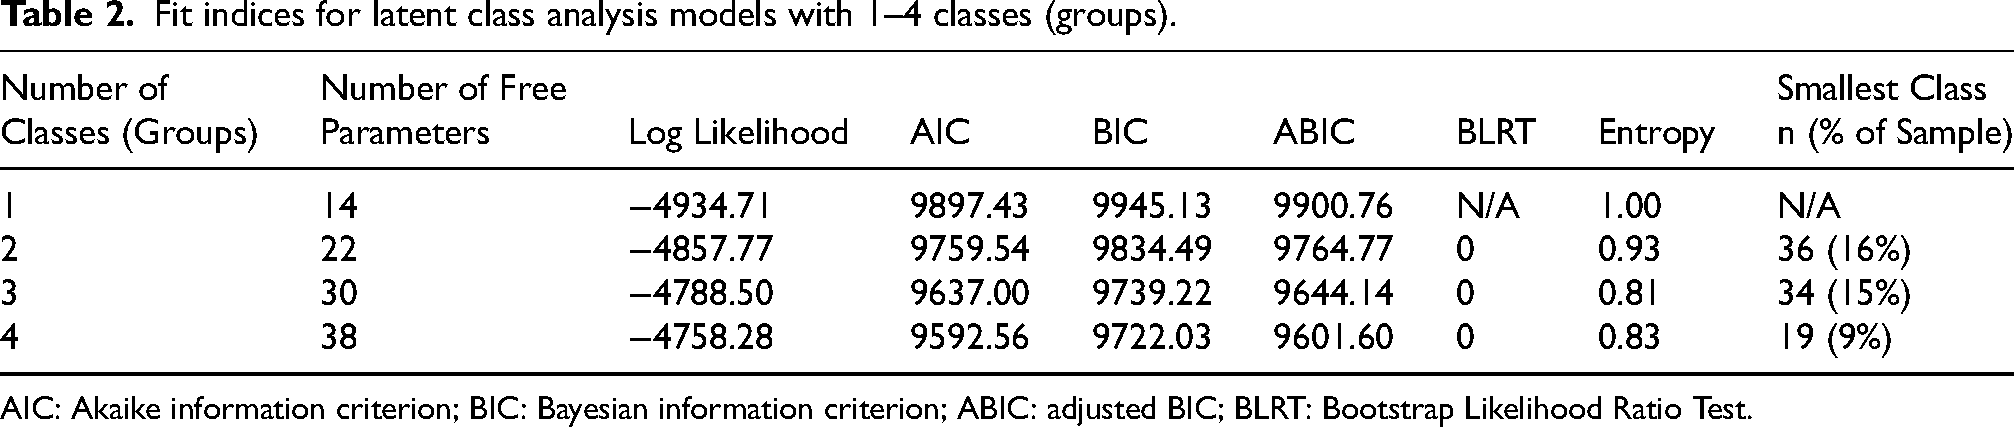
LCA (Mplus Version 7.1) was used to empirically identify neurocognitive phenotypes using the nine NP raw scores (Digit Span Backward, Letter Fluency, TMT-B, BNT, ‘Animal’ fluency, Similarities subtest, and Logical Memory subtests (Immediate Recall, Delayed Recall, Delayed Recognition)). 26 Prior to inclusion in the analysis, the predictors (NP test raw scores) were z-scored (mean = 0, SD = 1) within the sample. They were not compared to a normative or reference group or corrected for demographics. All z-scores with an absolute value >3.0 SD above or below the mean were treated as outliers and removed. The number of classes starts with one class and increases by one until there is no improvement to the model.26,27 To determine the best-fitting model, the lowest values of the Bayesian Information Criterion (BIC), Akaike Information Criterion (AIC), and sample size-adjusted BIC (ABIC) indicate optimal model fit. Entropy, an index of posterior probabilities and adequacy of participants’ placement within classes, was also considered; values >0.8 are preferred.28–30 The smallest class size was also examined; small classes may indicate overfitting of the model and difficulties with generalizability. The Bootstrap Likelihood Ratio Test indicates whether the model with k classes fits better than the model with k − 1 classes. The final selection was made on the best-fitting model and whether they were clinically meaningful based on previous research. This analysis has been applied to similar protocols of NP tests to classify participants into meaningful groups and has been described in more detail. 6
Receiver operator curve analyses
Using LCA-determined groups as the grouping variable, we conducted receiver operating characteristic (ROC) analyses to evaluate the predictive accuracy of NP errors and process scores in classifying the neurocognitive phenotypes. From the total of 19 NP errors and process variables, we selected those with an area under the curve (AUC) considered to be acceptable (AUC ≥0.64) and included them in a second ROC analysis to determine whether a given NP error or process score was significantly related to a specific neurocognitive phenotype.31,32 All selected variables in the final model had an AUC ≥ 0.64 and were used as the criteria to determine whether a given NP error or process score was significantly related to a specific neurocognitive phenotype. We also quantified the strength of the association between each NP error and process score that was significantly related to each neurocognitive phenotype using logistic regression models and calculating odds ratios (ORs), along with 95% confidence intervals (CIs). These models were adjusted for age, sex, and education, with the cognitively normal (CN) neurocognitive phenotype (described below in the Results section) serving as the reference group.
Regression analyses
We performed additional analyses to assess the relationship between NP error and process variables and brain MRI measures. Linear regression models were used to evaluate the association between NP errors and process scores with total hippocampal volume and regional hippocampal volumes (i.e., left/right hemisphere), as well as total WMH volume and regional WMH volumes (i.e., left/right hemisphere). Models were adjusted for age, sex, education, and total brain volume. All statistical analyses were performed using Stata 14 (StataCorp LP, College Station, TX) and SPSS, Version 27.0 (IBM Corp, Armonk, NY). Statistical significance was assessed at a 0.05 level of significance.
Results
Latent class analysis determined groups
From a total sample of 1195 participants, the mean age was 69.6 years, and 56.3% (n = 673) were women (Table 1). The LCA post-estimation criterion suggested a four-class model supported by statistical fit indices (4-class index AIC = 9592.56, BIC = 9722.03, and ABIC = 9601.60 versus 3-class index AIC = 9637.00, BIC = 9739.22, and ABIC = 9644.14) (Table 2). For the purpose of this analysis, two of the four groups (group 2, CN, and group 3, low normal) with similar performance across NP tests were combined into a single cognitively normal profile (Supplemental Figure 1). Overall, the three NP phenotype groups were defined as CN (n = 1060), a moderate-mixed impairment group (n = 72), and a dysexecutive group (n = 63). A summary of NP test z-scores by group is shown in Figure 1.
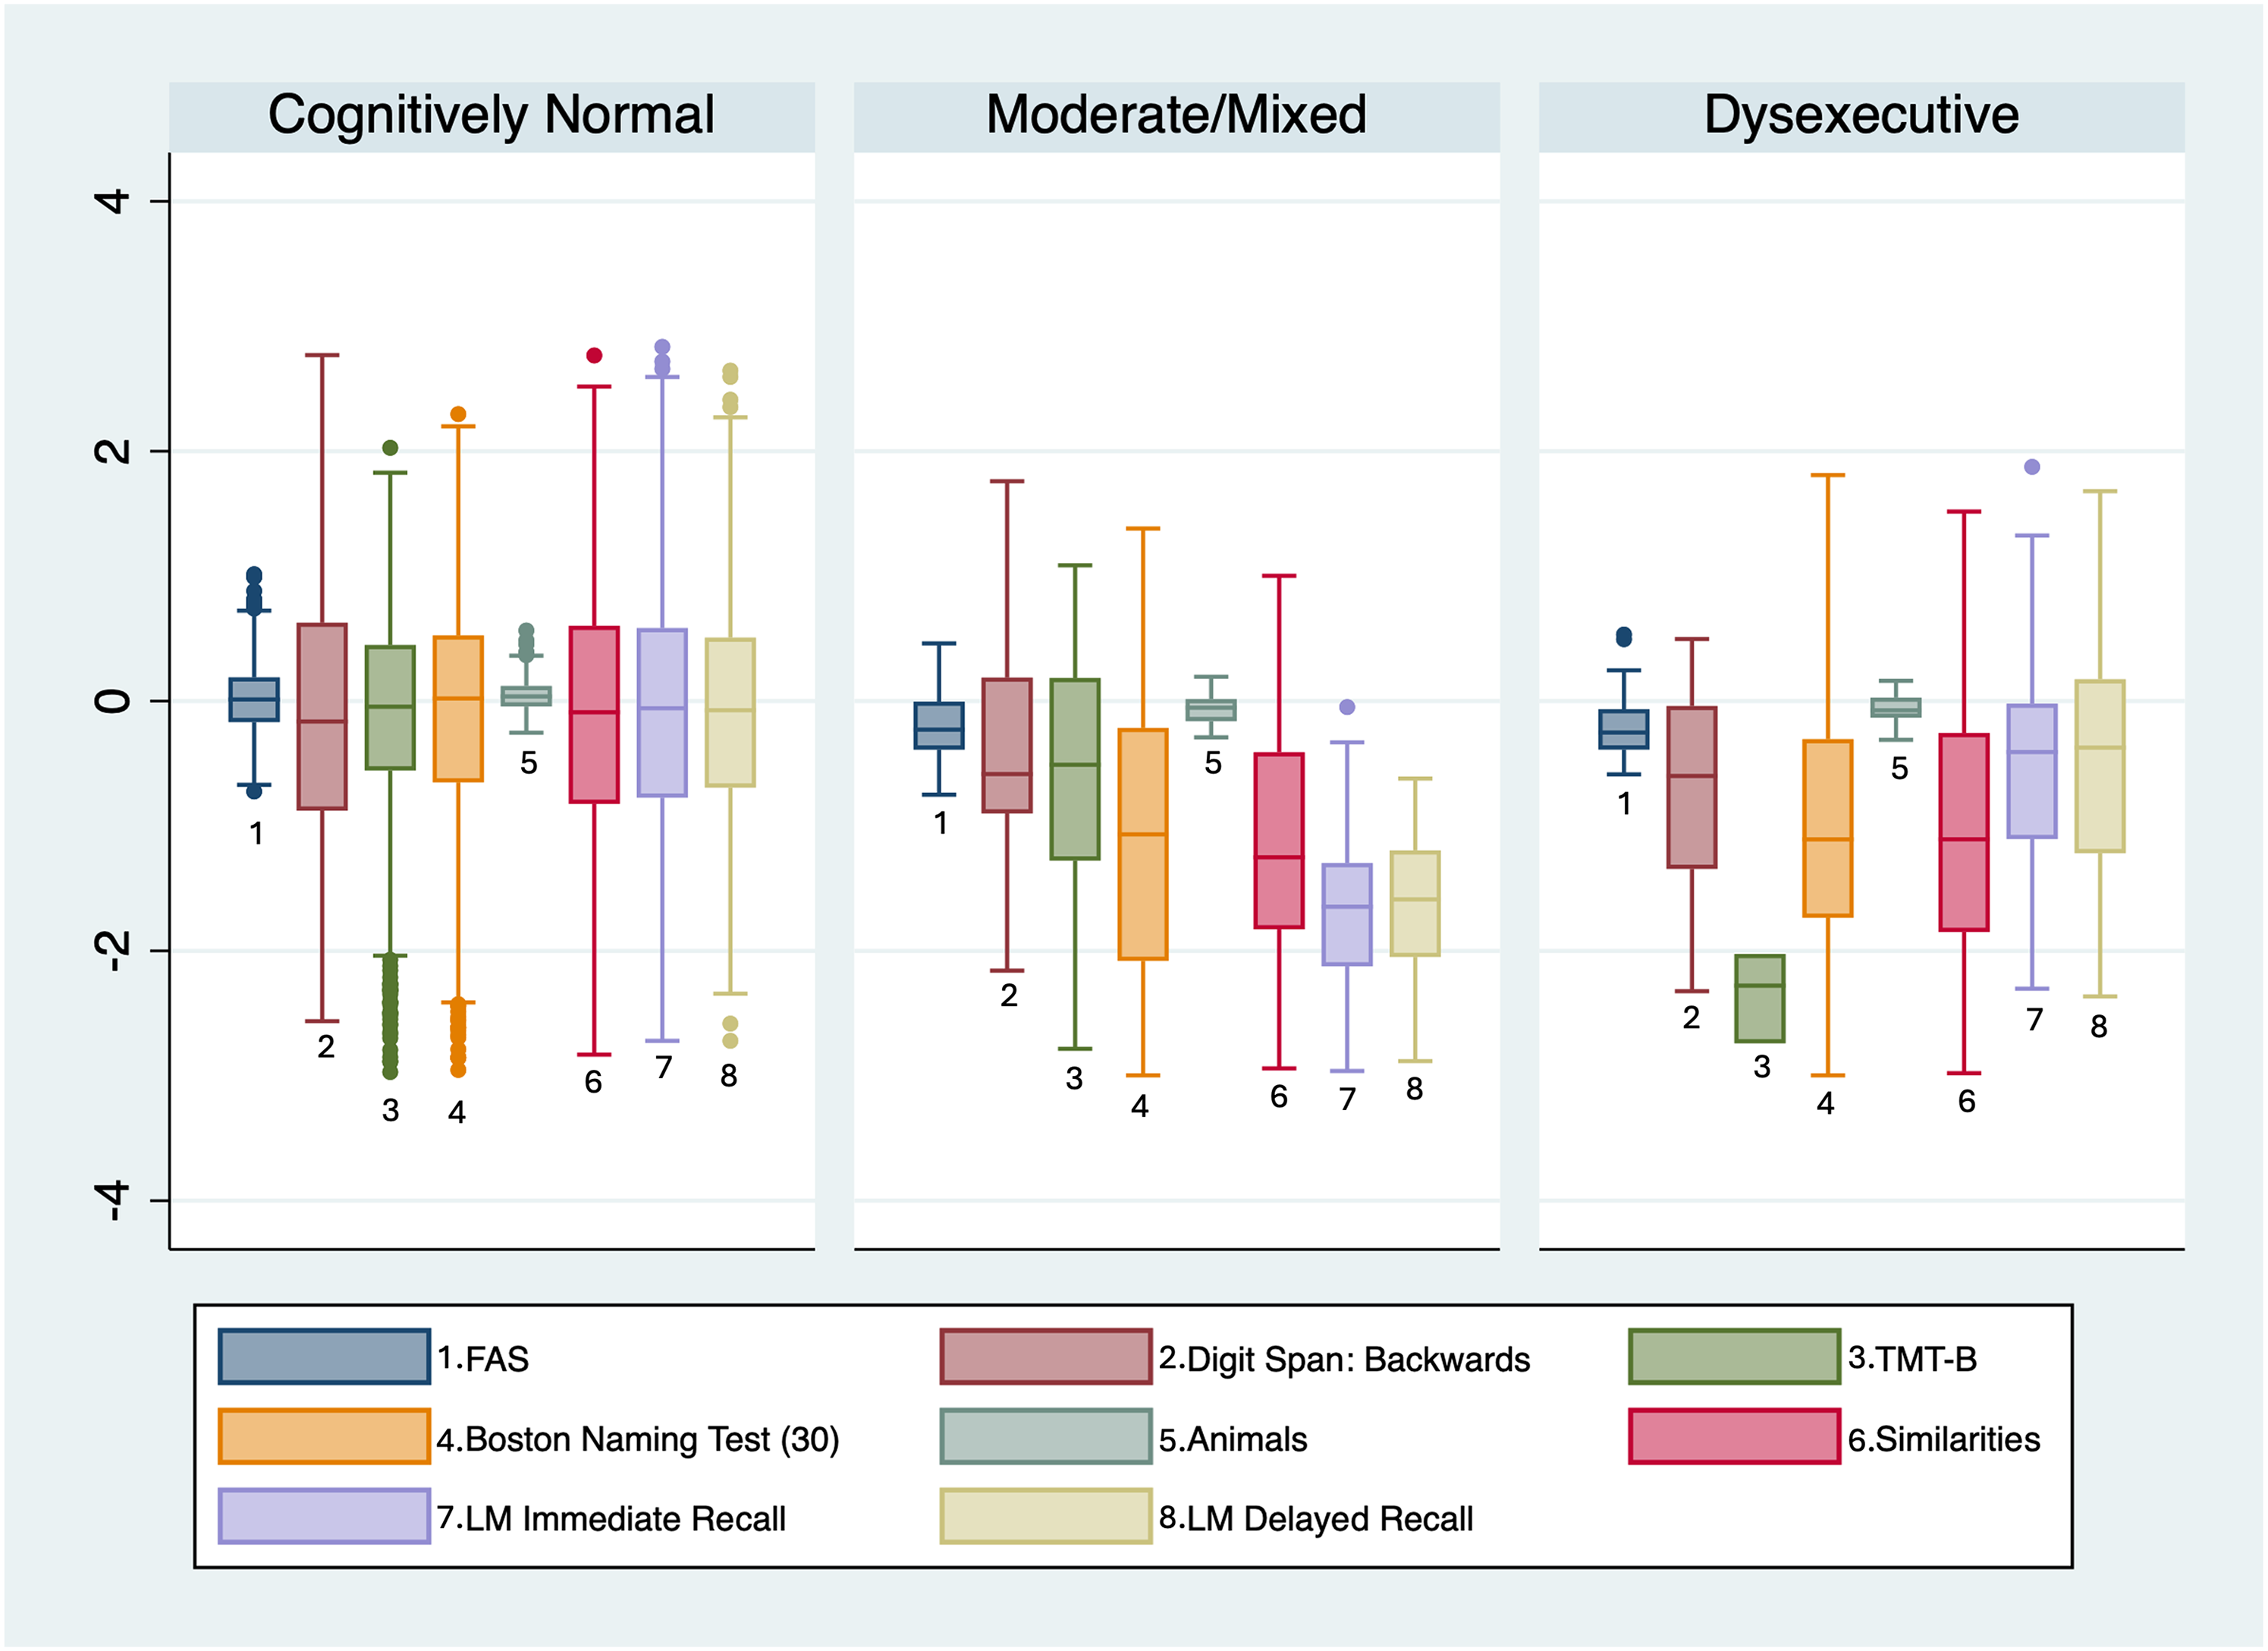
NP test z-scores by cognitive phenotype.
Participant characteristics by NP groups.
Data are presented as mean (SD) for continuous measures and n (%) for categorical measures unless otherwise specified.
Bonferroni adjusted p-values.
Fit indices for latent class analysis models with 1–4 classes (groups).
AIC: Akaike information criterion; BIC: Bayesian information criterion; ABIC: adjusted BIC; BLRT: Bootstrap Likelihood Ratio Test.
The CN phenotype (LCA-derived groups 2 and 3) was characterized as having at least average performance on all NP tests (e.g., z-score between −1.0 and +1.0 for each test); the moderate-mixed phenotype (LCA-derived group 1) was characterized as having below average performance (e.g., z-score below −1.0) on multiple NP tests across the domains that were assessed; and a dysexecutive phenotype (group 4) was characterized as having below average performance on NP tests related to executive function and at least average performance on NP tests not related to executive abilities. (Supplemental Table 2).
Demographic characteristics and APOE ε4 status
Individuals with a CN phenotype were significantly younger compared to their counterparts in the dysexecutive [76.8 ± 7.9 versus 67.7 ± 7.2, p < 0.001] and moderate-mixed [75.5 ± 7.7 versus 67.7 ± 7.2, p < 0.001] phenotypes. Education was dichotomized as high school or less versus college or above. Individuals in both the dysexecutive and moderate-mixed phenotypes had a lower percentage of college or above [CN: 862 (81.3%) versus dysexecutive: 42 (66.7%), p = 0.015; moderate-mixed: 33 (45.8%), p < 0.001, respectively]. No significant differences were found for sex and APOE ε4 status (Table 1).
NP errors-process scores and LCA-determined phenotypes
A description of all NP test errors and process variables and the respective NP test is included in Supplemental Table 1. In addition, Supplemental Table 3 provides their raw scores by NP phenotype.
Results from the ROC analysis showed that only errors and process scores derived from TMT-B (e.g., number of times participant lifted their pen from paper; number of examiner-corrected errors), WAIS Similarities (e.g., loss-of- set errors), and BNT (e.g., number of circumlocution errors; number of semantic paraphasia errors; number of perceptual errors) yielded an AUC ≥ 0.64 for predicting individuals in the moderate-mixed and in the dysexecutive phenotype, respectively, when the CN phenotype was the reference group (Table 3).
AUC predicting moderate/mixed and dysexecutive phenotypes versus CN.
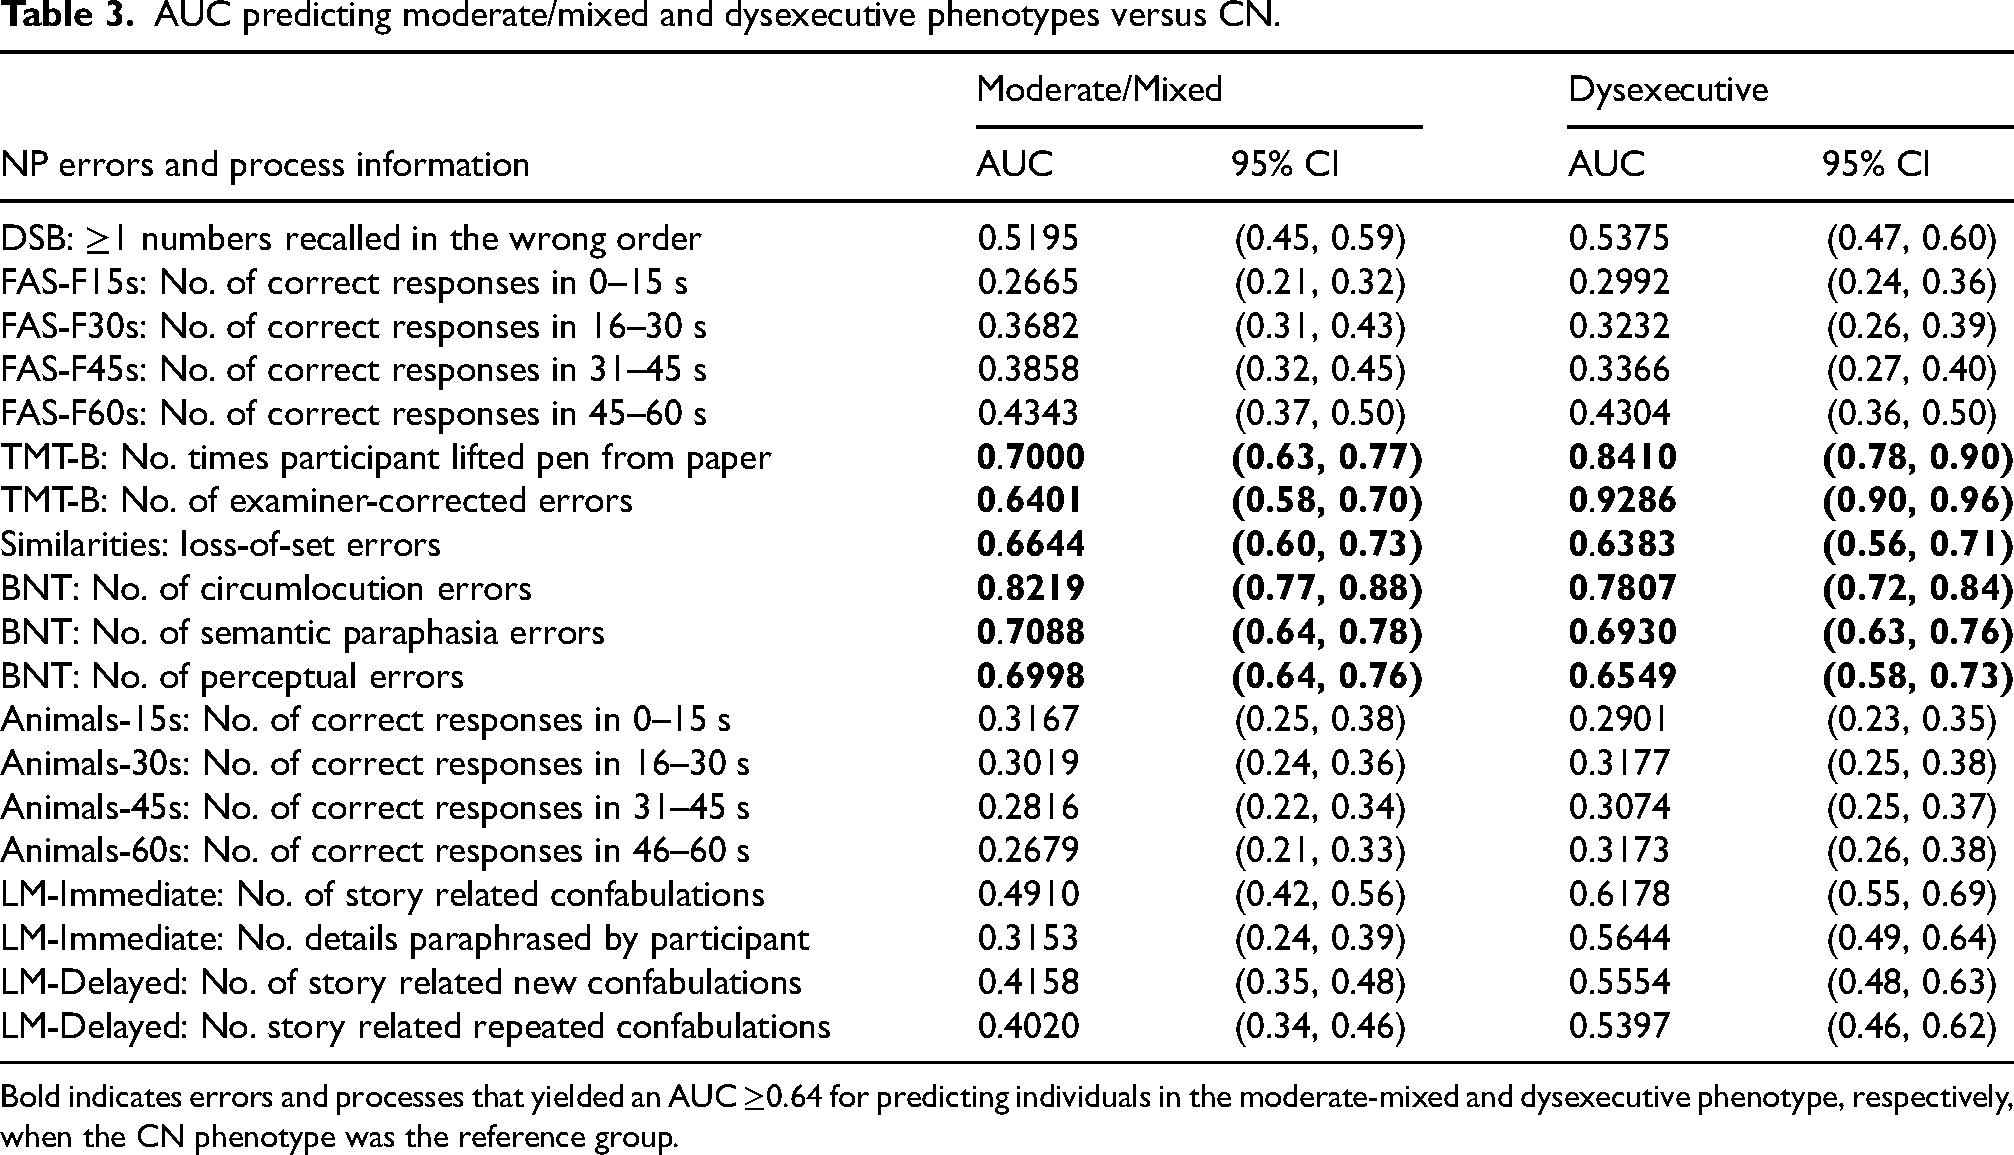
Bold indicates errors and processes that yielded an AUC ≥0.64 for predicting individuals in the moderate-mixed and dysexecutive phenotype, respectively, when the CN phenotype was the reference group.
A subsequent ROC analysis to identify individuals with a moderate-mixed phenotype showed that the number of circumlocution errors on BNT yielded the best performance with an AUC of 0.81 (Figure 2). Regression analyses indicated that a greater number of perceptual, semantic, and circumlocution errors on BNT were significantly associated with a moderate-mixed phenotype, independent of age, sex, and education (OR = 1.87; 95% CI = 1.49–2.35; p < 0.001, OR = 1.69; 95% CI = 1.45–1.96; p < 0.001, and OR = 1.45; 95% CI = 1.31–1.60; p < 0.001, respectively) (Table 4).
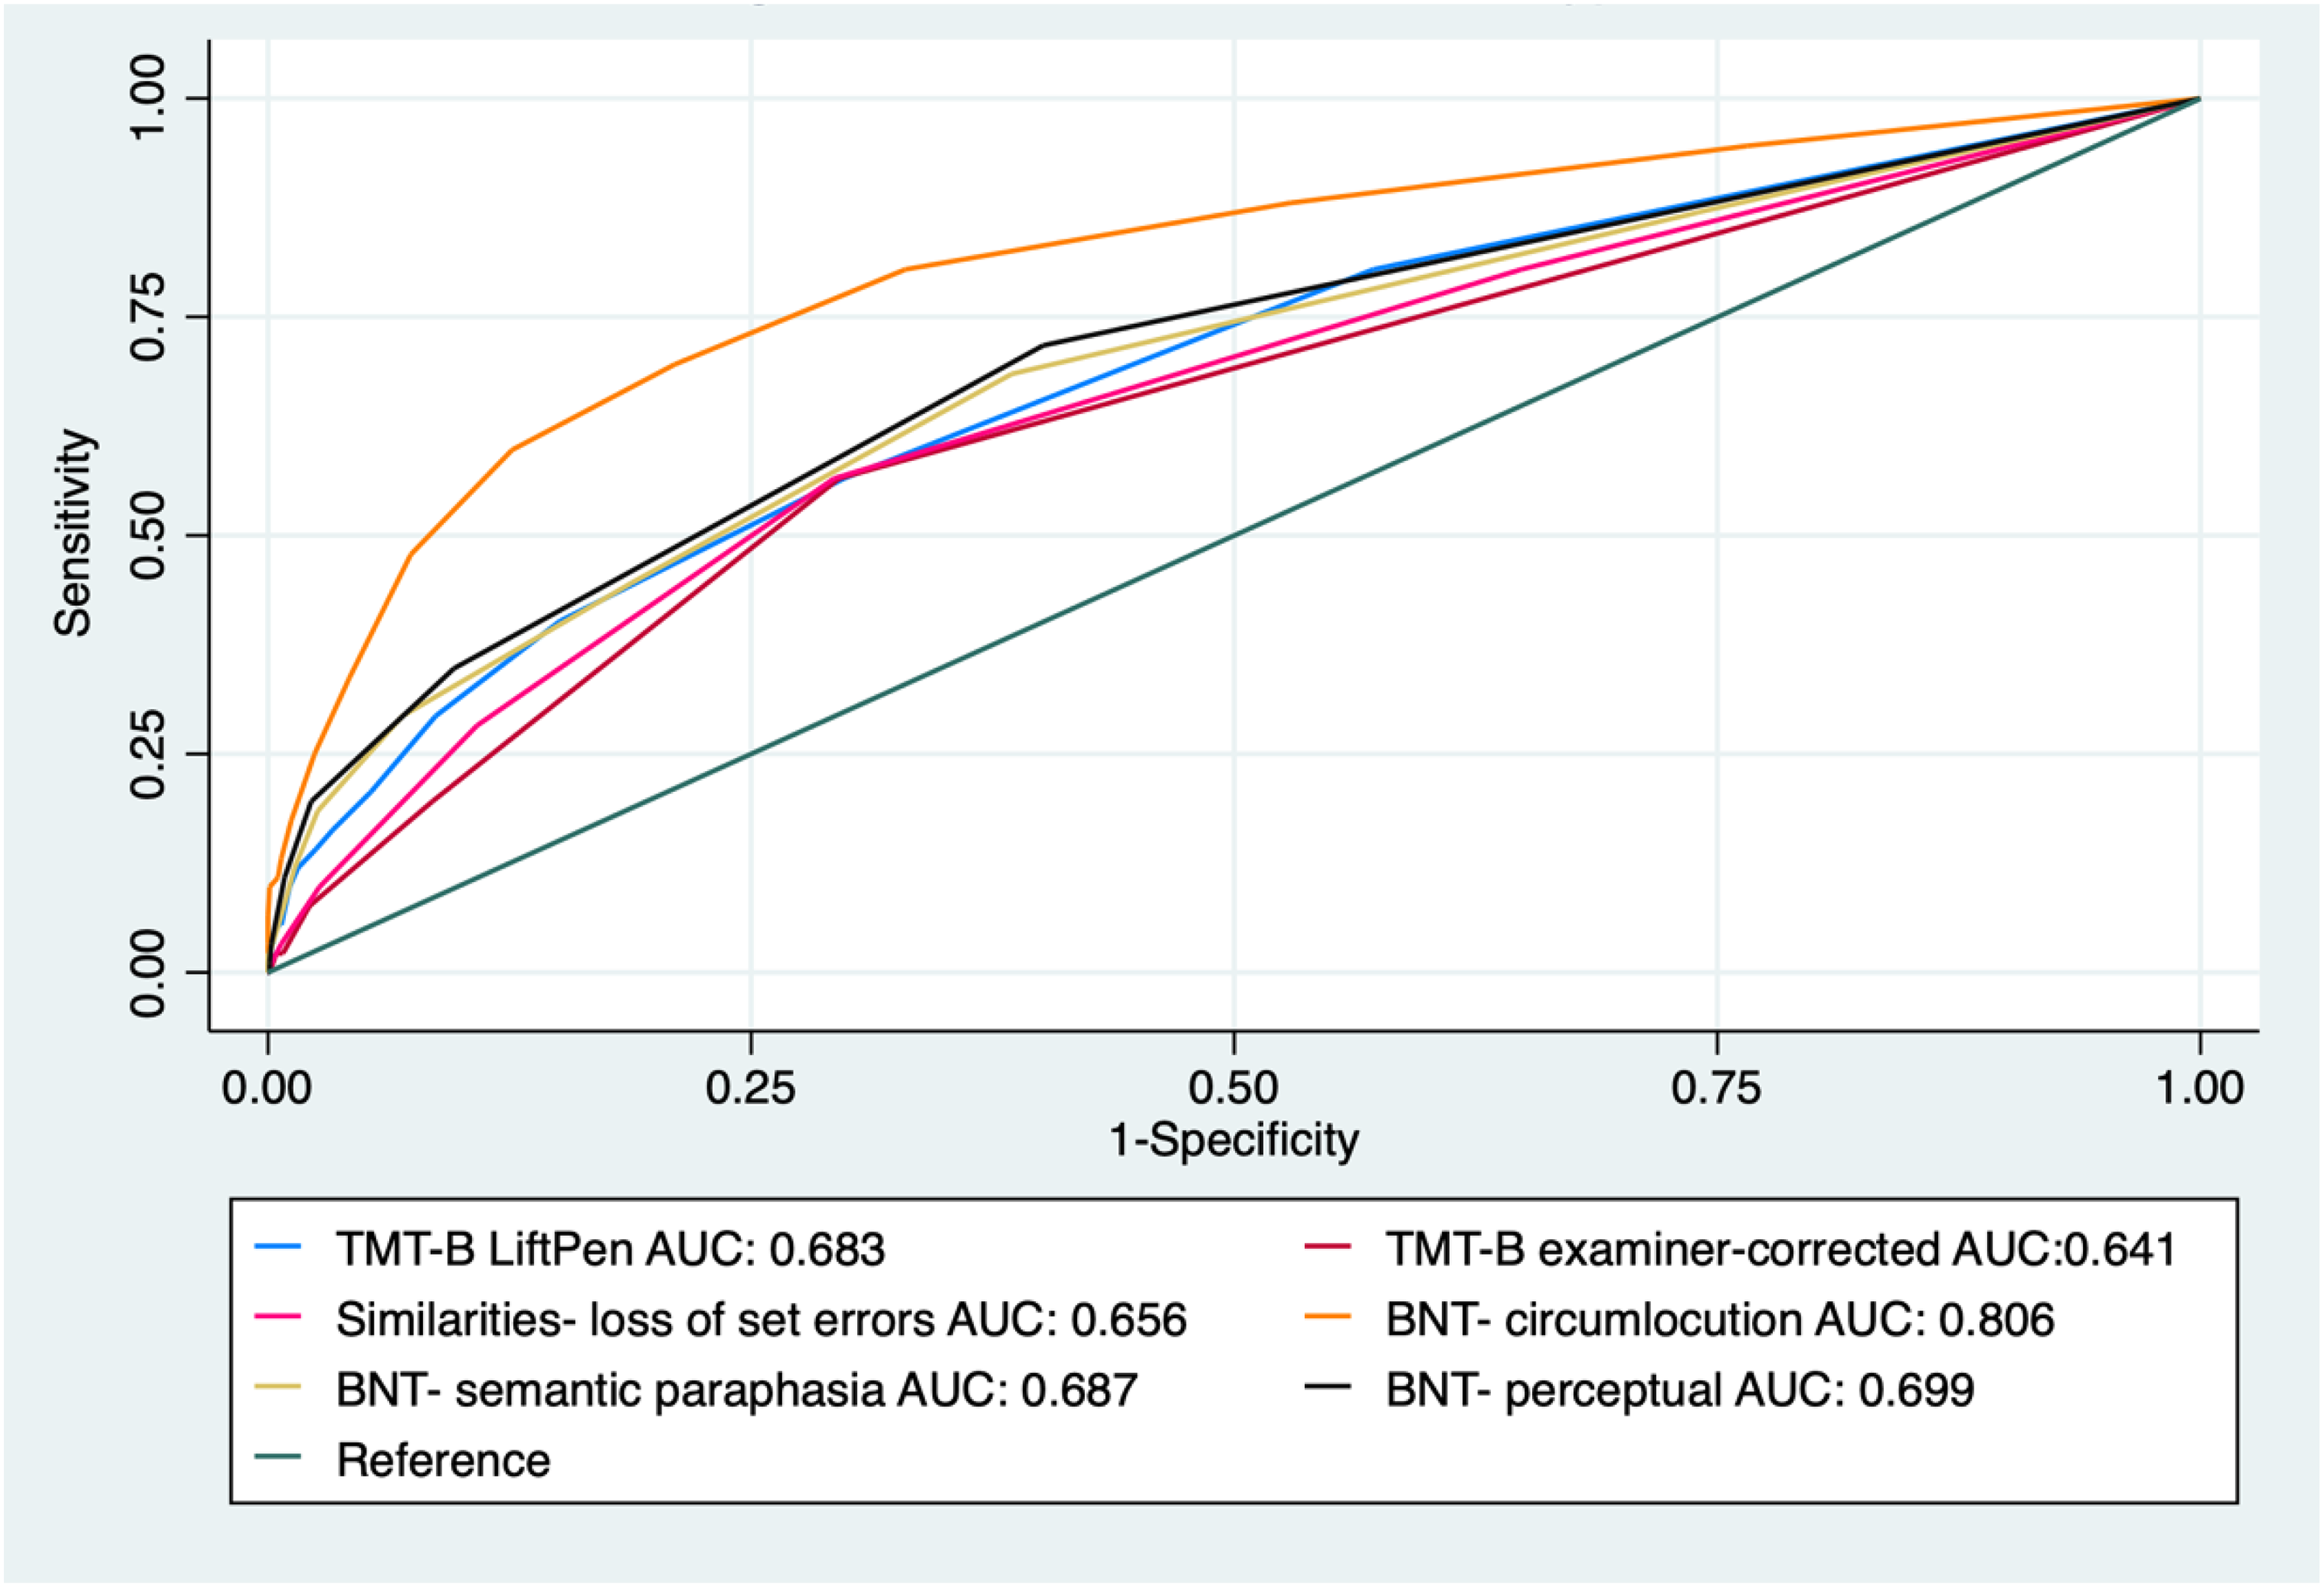
ROC curves of NP errors to predict moderate-mixed phenotype.
Association between NP errors-processes information and neurocognitive phenotypes.
Age, Sex, years of education.
Reference group: CN: Cognitively Normal neurocognitive phenotype.
ROC analysis, using the six selected errors and process scores associated with individuals classified into the dysexecutive phenotype, showed that the number of times the participant lifted the pen from the paper on TMT-B and the number of examiner-corrected errors on TMT-B yielded the best model performance, with AUCs of 0.85 and 0.92, respectively (Figure 3). Regression models to assess the association with the dysexecutive phenotype showed that a greater number of times the participant lifted the pen from the paper on TMT-B (OR = 1.39; 95% CI = 1.28–1.52; p < 0.001) and examiner-corrected errors on TMT-B (OR = 3.40; 95% CI = 2.65–4.38; p < 0.001) were significantly associated with a dysexecutive phenotype after adjusting for age, sex, and education (Table 4).
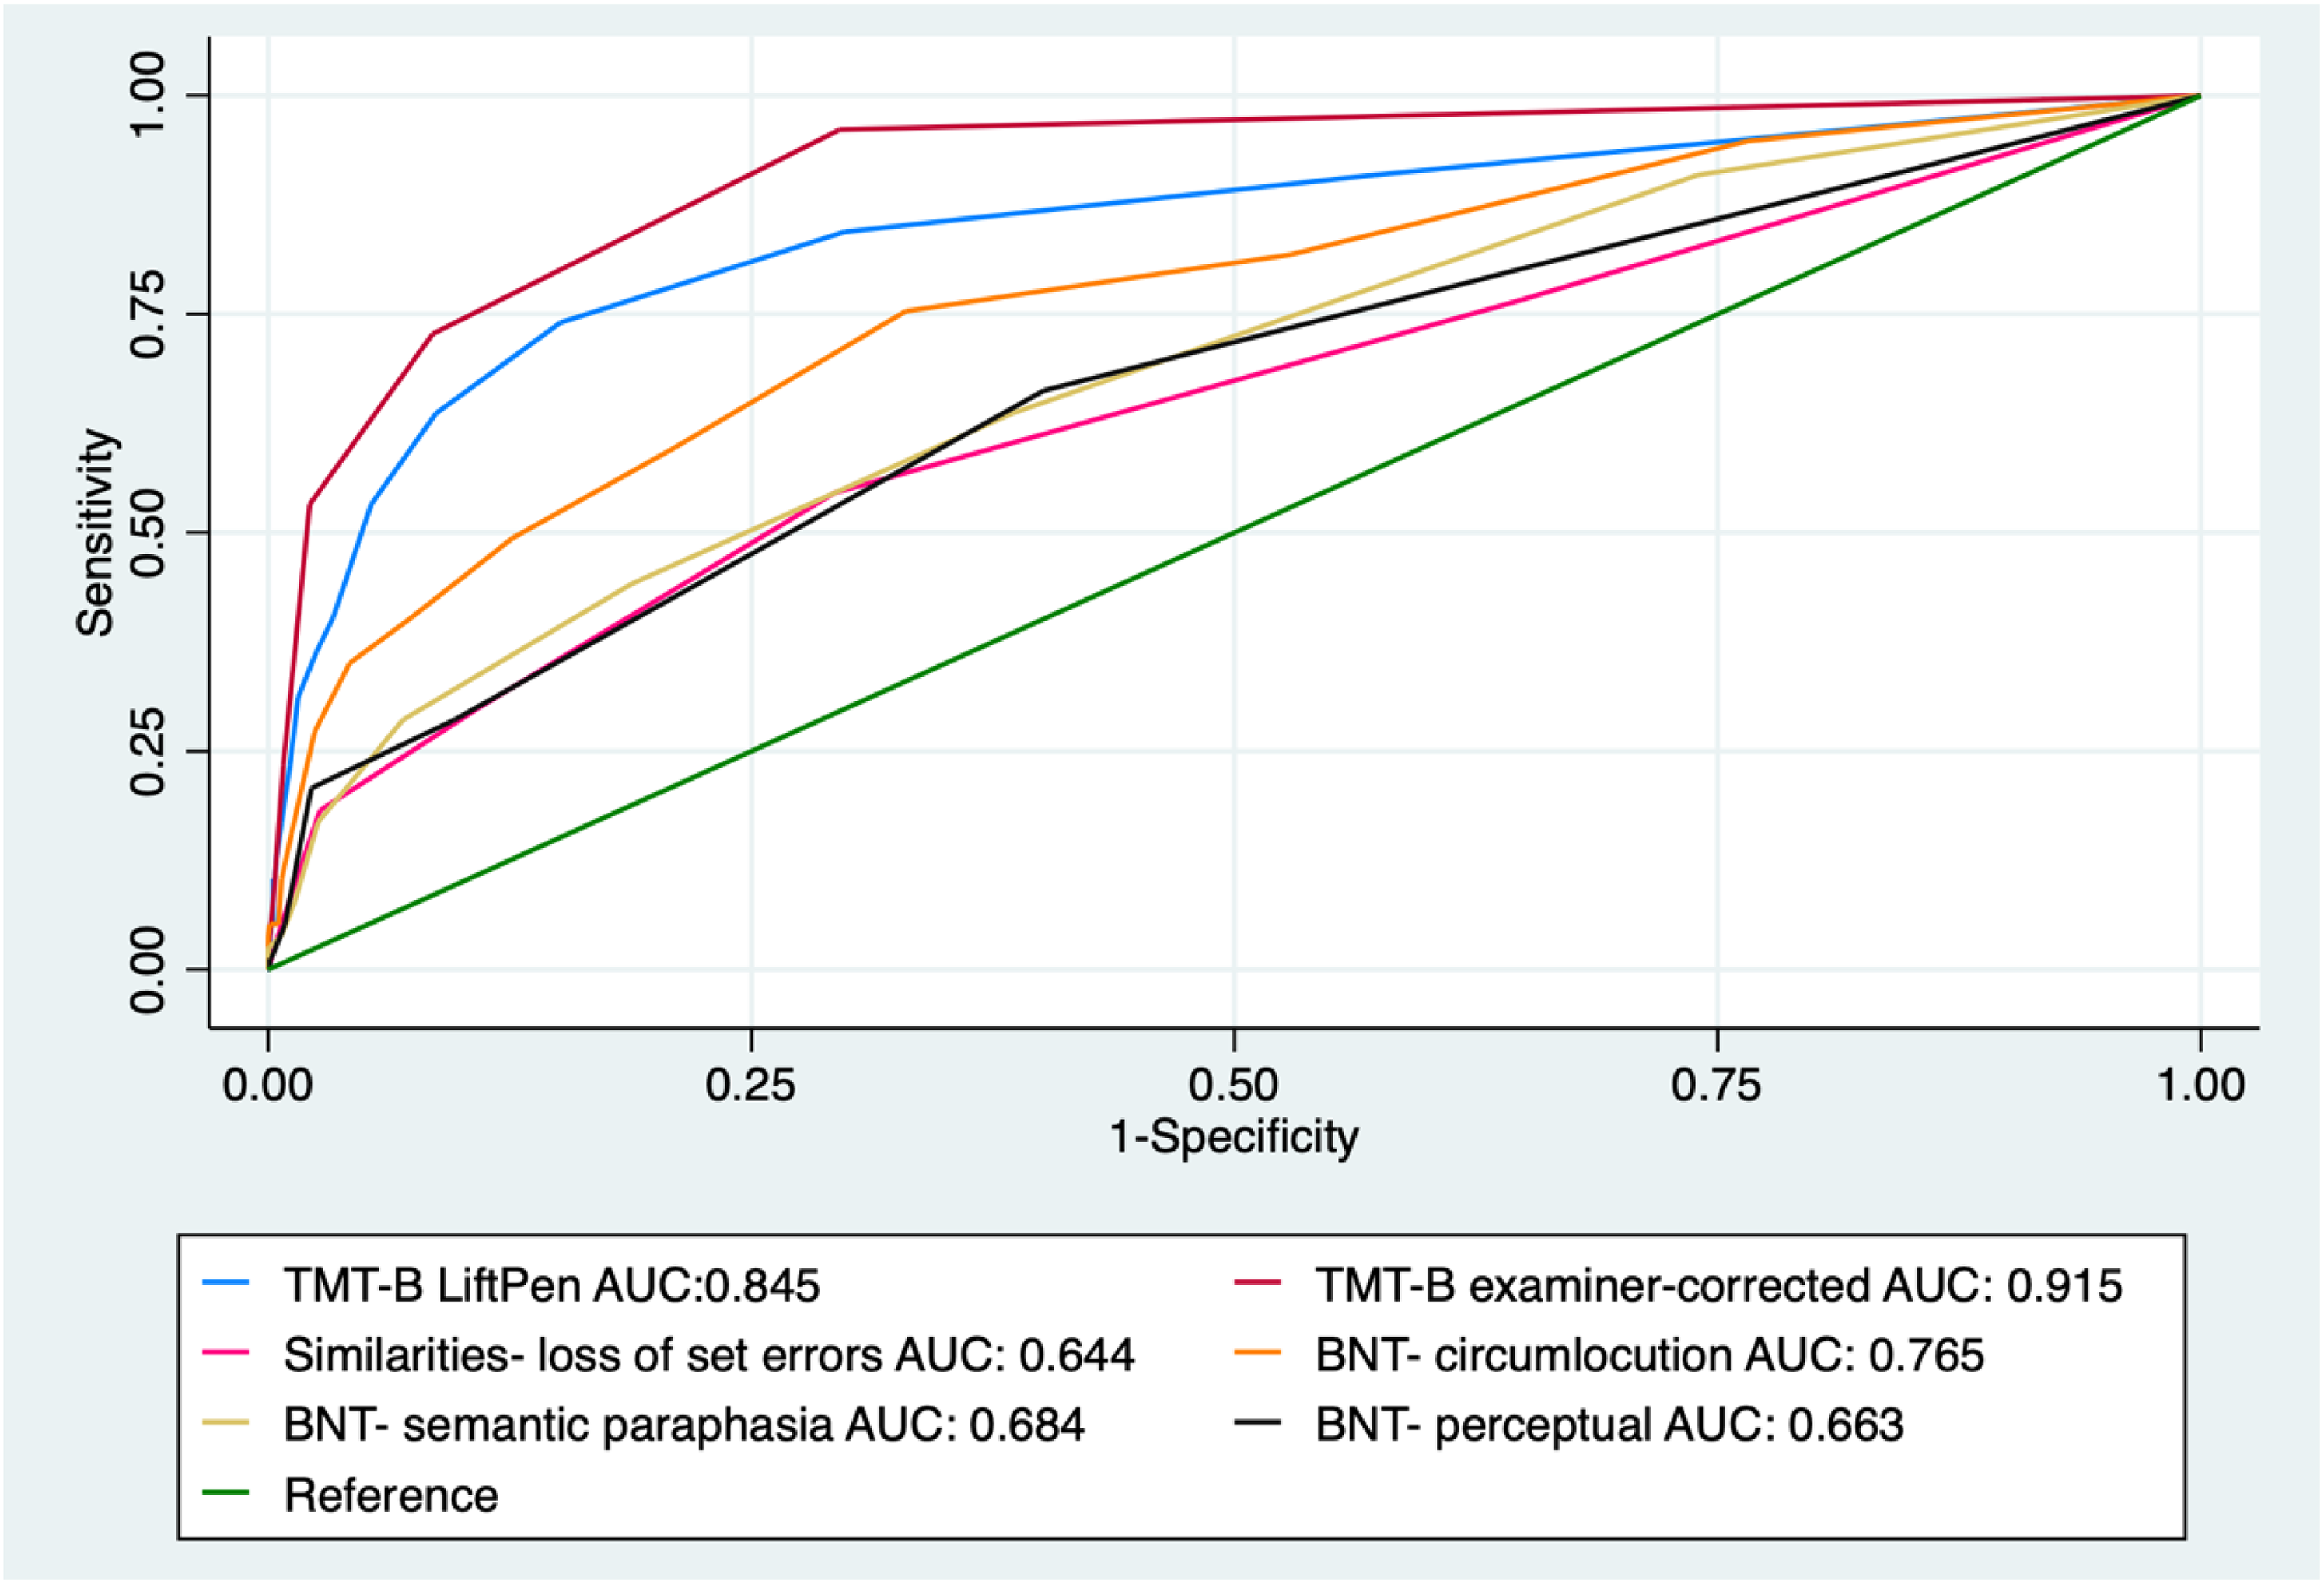
ROC curves of NP errors to predict Dysexecutive phenotype.
The number of loss-of-set errors from the Similarities subtest performed similarly in identifying individuals with moderate-mixed phenotypes and dysexecutive phenotypes, with an AUC of 0.66 and 0.64, respectively (Figures 2 and 3). From the regression analysis, a greater number of loss-of-set errors from the Similarities subtest was significantly associated with a dysexecutive phenotype (OR = 1.48; 95% CI = 1.22–1.80; p < 0.001) and a moderate-mixed phenotype (OR = 1.50; 95% CI = 1.24–1.81; p < 0.001), independent of the effects of age, sex, and education (Table 4).
MRI regions of interest and latent class determined groups
Differences in volumes were found such that participants classified as presenting with a moderate-mixed phenotype had significantly less total hippocampal volume (mL3) [6.00 ± 0.72 versus 6.65 ± 0.72, p < 0.001], right hippocampal volume [3.02 ± 0.41 versus 3.35 ± 0.36, p < 0.001] and left hippocampal volume [2.99 ± 0.36 versus 3.30 ± 0.38, p < 0.001] than individuals with a CN phenotype (Table 5). Likewise, individuals in the dysexecutive group had less total hippocampal volume (mL3) [6.17 ± 0.56 versus 6.65 ± 0.72, p = 0.001], right hippocampal volume [3.12 ± 0.31 versus 3.35 ± 0.36, p = 0.002] and left hippocampal volume [3.05 ± 0.28 versus 3.30 ± 0.38, p = 0.001] (Table 5). No significant differences were found for WMH volumes.
MRI brain measures by neurocognitive phenotype.
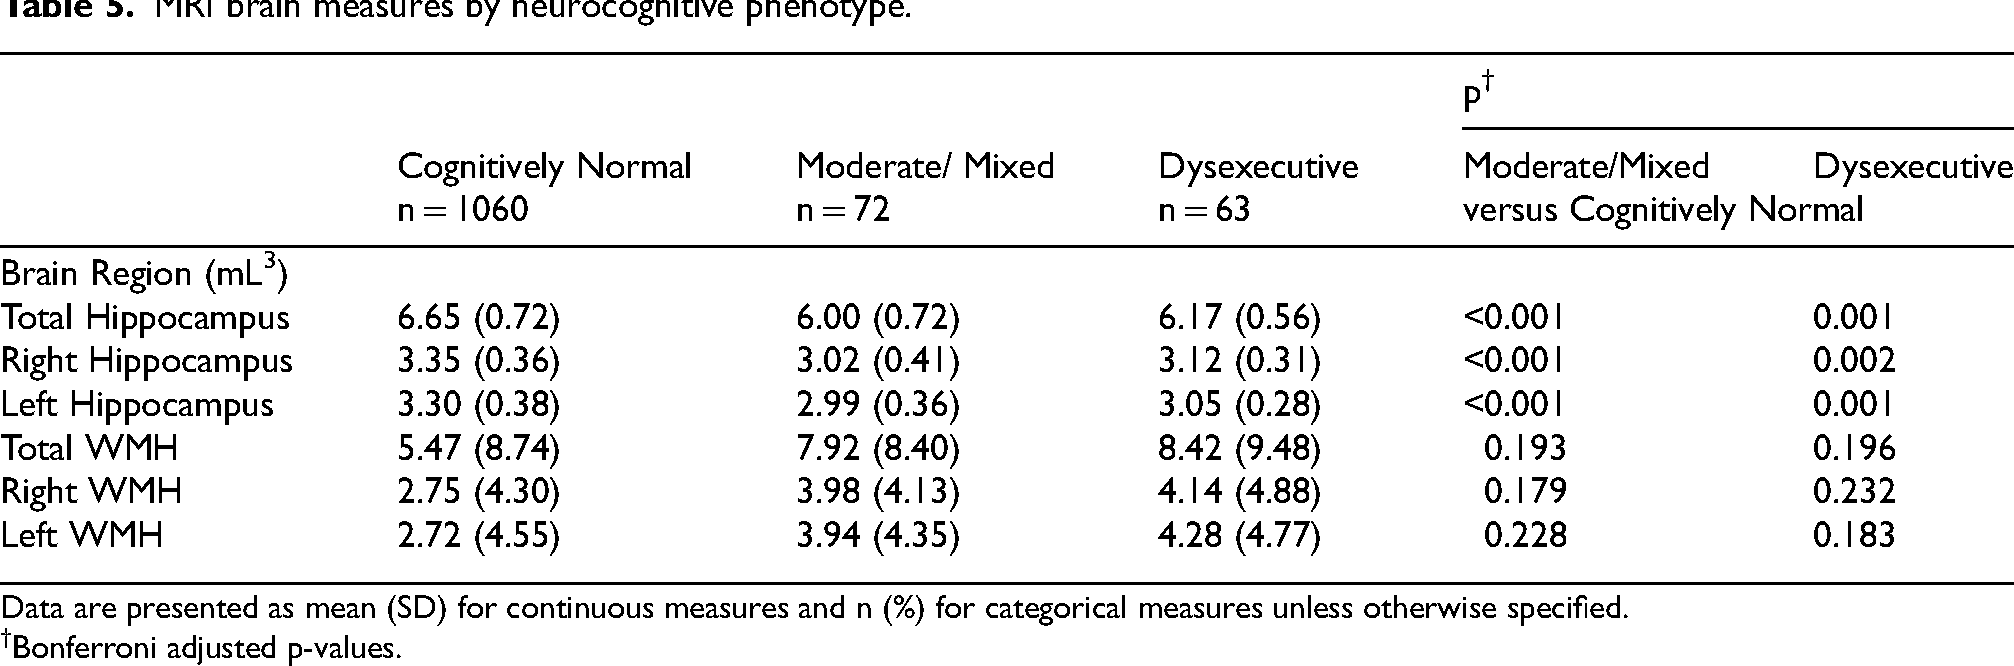
Data are presented as mean (SD) for continuous measures and n (%) for categorical measures unless otherwise specified.
Bonferroni adjusted p-values.
MRI regions of interest and neuropsychological errors and processes
Subsequent regression analysis examined the association between the six selected errors and process variables with hippocampal and WMH volumes. A greater number of pen lifts on TMT-B was significantly associated with smaller total, right, and left hippocampal volumes [B = −0.35; SE = 0.14, p = 0.014, B = −0.66; SE = 0.27, p = 0.015, B = −0.56; SE = 0.26, p = 0.027, respectively; and greater total, right, and left WMH volumes [B = 0.02; SE = 0.01, p = 0.034, B = 0.04; SE = 0.02, p = 0.032, B = 0.04; SE = 0.02, p = 0.041, respectively] (Table 6). A greater number of examiner-corrected errors on TMT-B was not significantly associated with hippocampal or WMH volume change.
Association between NP errors-processes information and MRI measures.
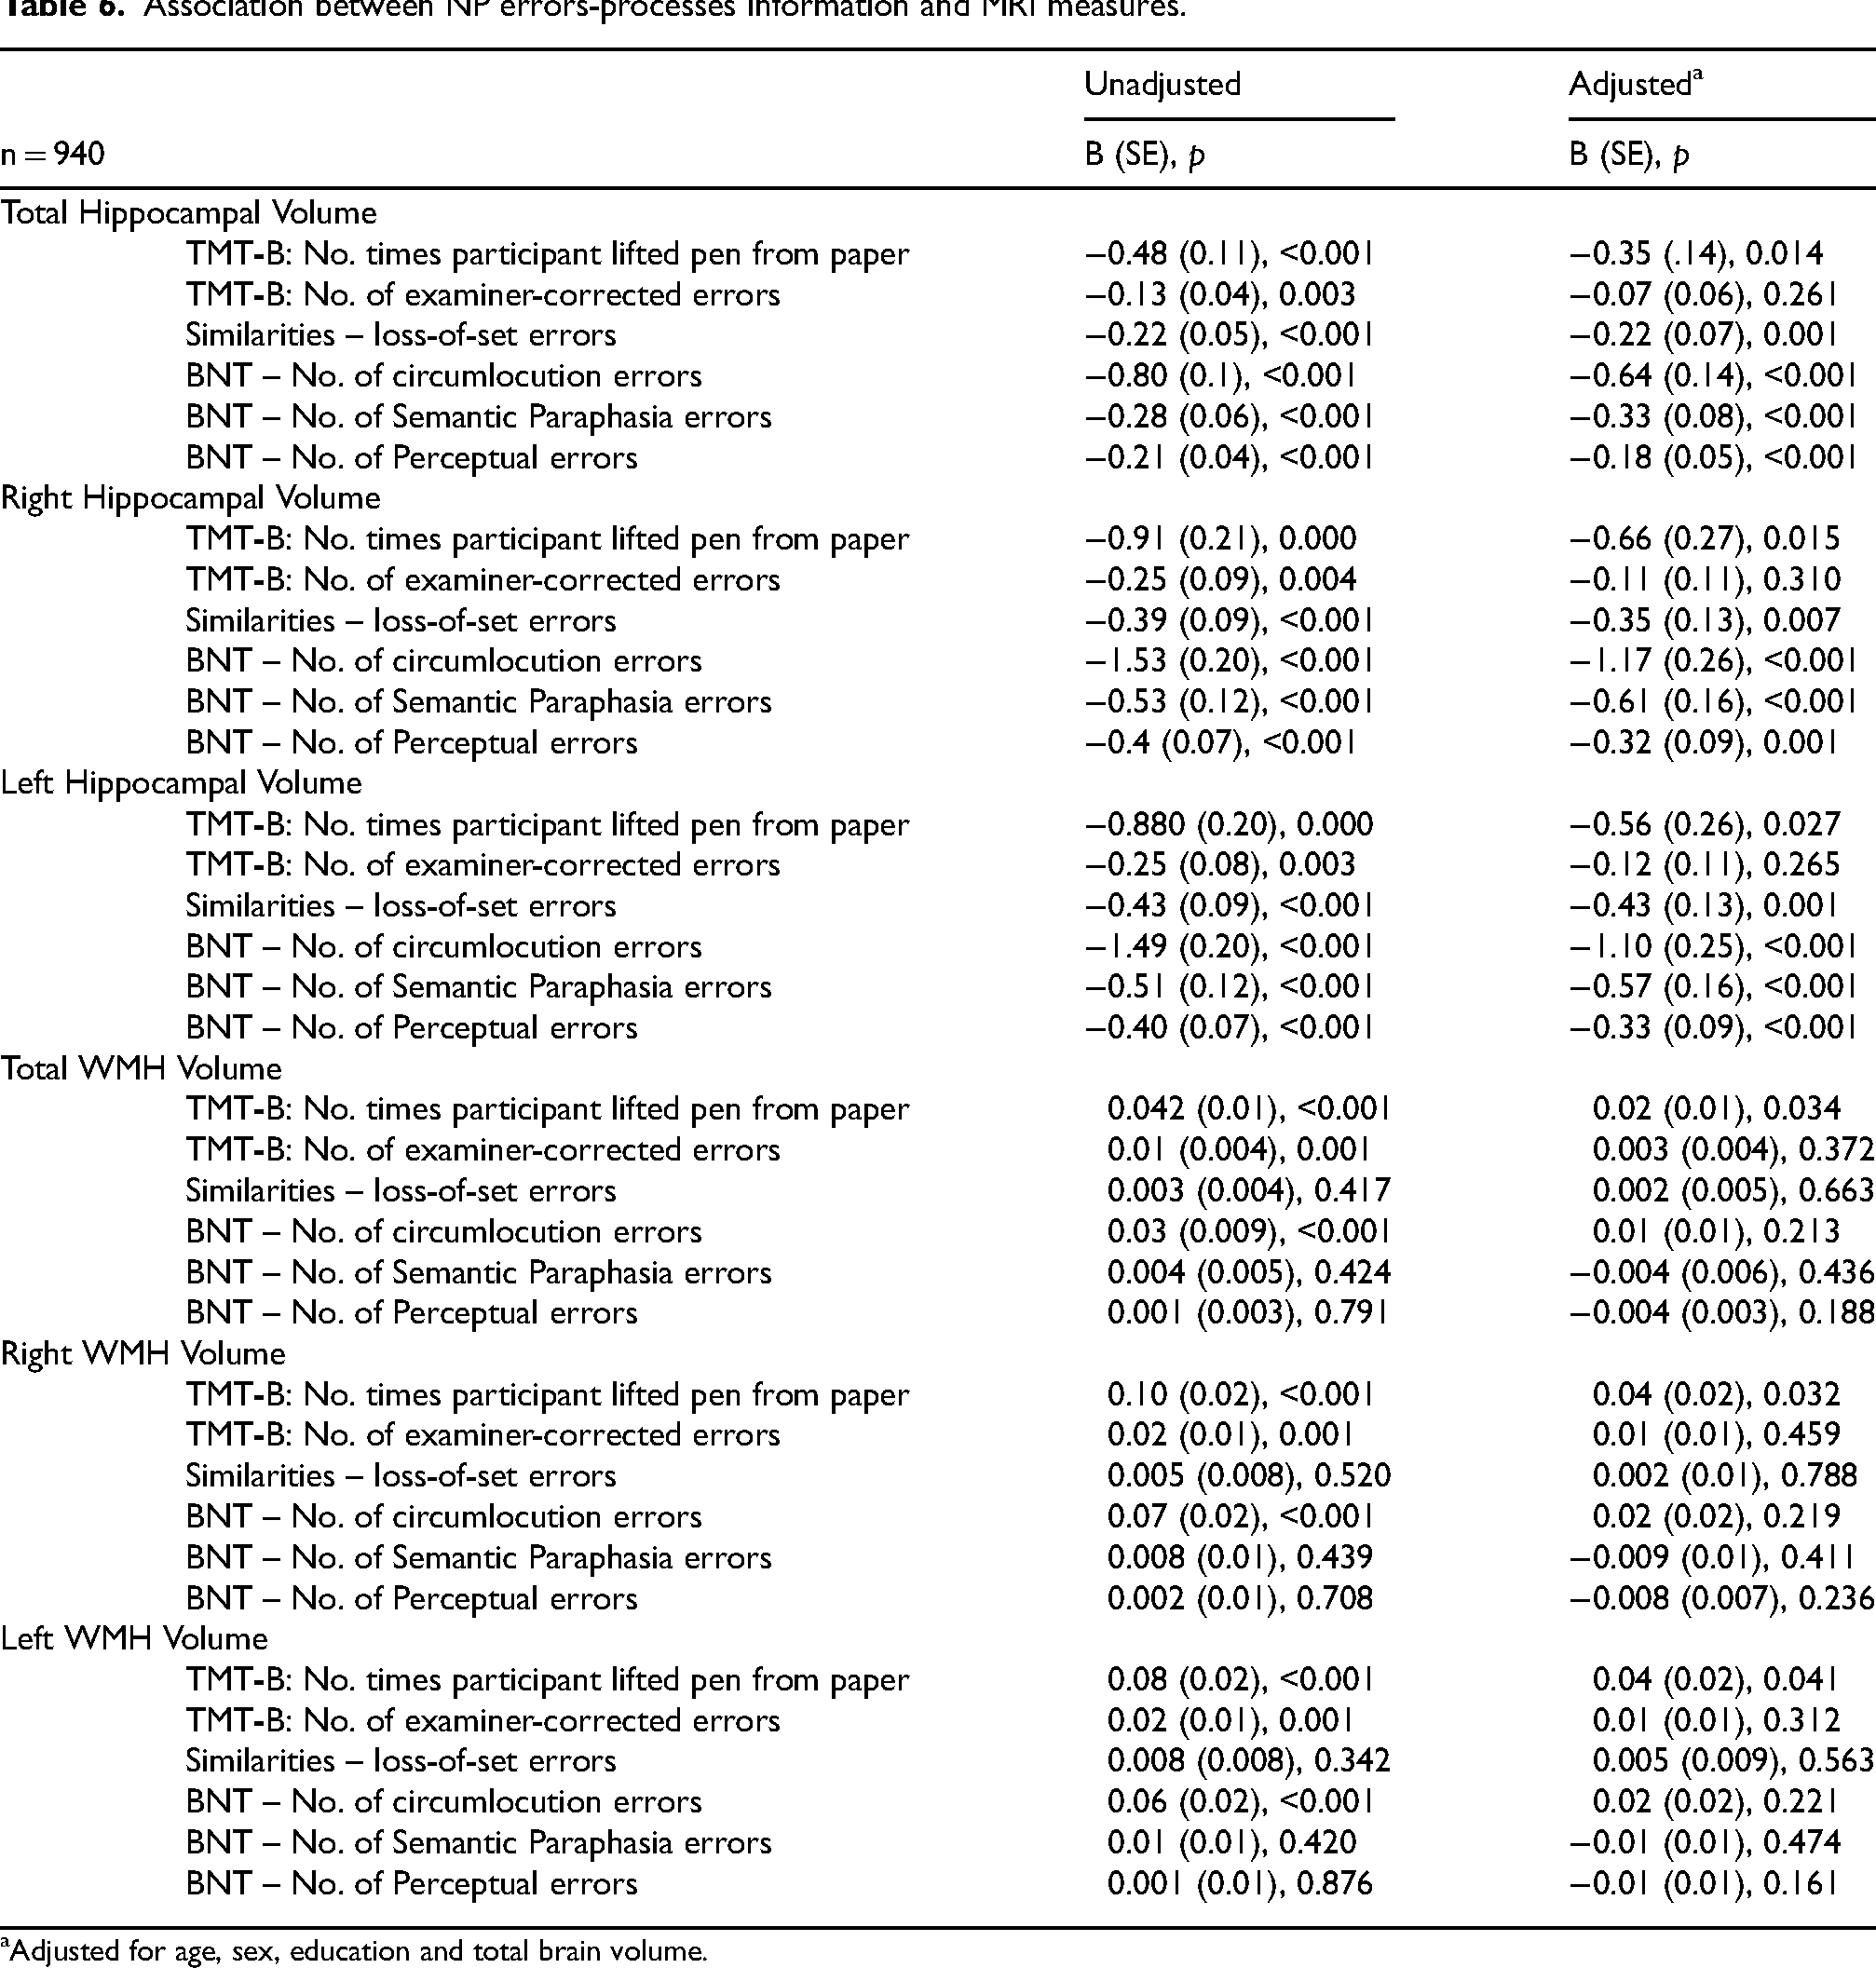
Adjusted for age, sex, education and total brain volume.
A greater number of loss-of-set errors on Similarities showed a significant association with decreased hippocampal volumes [total: B = −0.22; SE = 0.07, p = 0.001, right: B = −0.35; SE = 0.13, p = 0.007 and left: B = −0.43; SE = 0.13, p = 0.001, respectively]. No associations between the number of loss-of-set errors on Similarities and WMH volumes were observed (Table 6). Finally, a greater number of errors on BNT were significantly associated with decreased hippocampal volumes (number of BNT circumlocution errors [total: B = −0.64; SE = 0.14, p < 0.001, right: B = −1.17; SE = 0.26, p < 0.001 and left: B = −1.10; SE = 0.25, p < 0.001]; number of semantic paraphasia errors [total: B = −0.33; SE = 0.08, p < 0.001, right: B = −0.61; SE = 0.16, p < 0.001 and left: B = −0.57; SE = 0.16, p < 0.001]; and number of perceptual errors [total: B = −0.18; SE = 0.05, p < 0.001, right: B = −0.32; SE = 0.09, p < 0.001 and left: B = −0.33; SE = 0.09, p < 0.001]) (Table 6).
Discussion
In the current study, LCA was able to classify a sample of older adults from a community-based cohort into groups presenting with intact or normal cognitive abilities and groups with moderate-mixed and dysexecutive cognitive impairment. The majority of participants were classified into the CN group, with smaller numbers of participants classified as presenting with measurable cognitive impairment. The moderate-mixed group tended to present with reduced NP summary scores on most tests, while those classified into the dysexecutive group appeared to present with more circumscribed cognitive difficulty. Prior research using similar person-centered analyses applied to NP test summary scores from memory clinic patients with dementia and MCI obtained similar results such that groups of patients presenting with both mixed cognitive impairment and circumscribed dysexecutive difficulty were described.6,7 The current research did not reveal a participant group with circumscribed evidence for amnesia, i.e., low scores on both delay free recall and recognition memory test conditions with relatively intact performance on other tests. This situation is not unexpected, given that all of these participants live in the community and were not drawn from a memory clinic.
The current research underscores how process-based measures provide valuable insights into cognitive processes underlying test performance. Increasing numbers of pen lifts observed in the moderate-mixed group could reflect a multitude of underlying cognitive impairments, such as problems maintaining mental set and problems with efficient visual search or scanning. Also, frequent circumlocutions and loss-of-set errors, as seen on tests that assess visual confrontation naming and verbal concept formation, could suggest meaningful word-finding difficulty. These findings align with previous work by Eppig et al. 7 and Libon et al., 6 where panels of NP summary and process and error scores obtained from memory clinic patients were able to characterize differing dementia and MCI syndromes. Dysexecutive and word-finding difficulty can be indicators of emergent dementia-related illness. Thus, the analyses of process-based behavior derived from commonly administered NP tests such as the TMT-B, Similarities subtest, and the BNT provide additional information regarding the neurocognitive constructs that underlie commonly used NP summary scores.
Not all NP summary scores yielded statistically significant patterns of errors and other process-based information. For example, sequencing errors from the TMT-B, but not from the Digits Backwards subtest were predictive of inclusion in the impaired groups. Similarly, accessing lexical information on BNT and the Similarities subtest, but not the ‘animal’ fluency test, was also predictive of inclusion in the impaired groups. The reason(s) for these results could derive from the greater number and nature of neurocognitive demands associated with the TMT-B, Similarities, and BNT tests. For example, as compared to the Digit Span Backward subtest, successful performance on the TMT-B requires a capacity for effective visual scanning, motor operations, and complex mental set maintenance. 33 Also, the ability to effectively analyze and put into context visually presented information is required for successful BNT performance. These abilities may not necessarily be required for successful performance on the ‘animal’ fluency test.
The relationship between errors and process scores seen on NP tests and MRI parameters found that the number of pen lifts on TMT-B, loss-of-set errors on the Similarities subtest, and the number of circumlocution errors, semantic paraphasia errors, and perceptual errors on BNT were all significantly associated with decreased hippocampal volumes. Among the NP errors and process scores examined in the analysis, only the number of pen lifts on TMT-B was associated with a small but significant increase in WMH volumes. To the best of our knowledge, this is the first study to assess error performance and process scores from TMT-B, the Similarities subtest, and the BNT as related to MRI-defined regions of interest in a community-based sample.
A previous analysis of error performance in FHS found that increased error production on Logical Memory was associated with WMH volume, 14 but did not examine errors or process scores from the TMT-B, the Similarities subtest, or the BNT. Our findings align with newer research underscoring the role of the hippocampus in cognitive abilities other than episodic memory. For instance, O'Shea et al. 34 found that hippocampal volume is associated with executive functions such as processing speed and working memory, emphasizing its centrality in cognitive flexibility. Moreover, Schevenels et al. 35 demonstrated that left hippocampal volume significantly predicted long-term language recovery in post-stroke aphasia, further highlighting its role in language processing. While these studies focus on specific populations, their findings suggest that hippocampal integrity may be a shared neural substrate for executive and language functions, which also aligns with the relationships observed in our study.
Given the exploratory nature of this analysis, it is unclear whether the associations between distinct anatomic regions of the brain and the errors and process scores observed on the TMT-B, the Similarities subtest, and the BNT represent a single or combined underlying neurocognitive construct. Interestingly, a study using cortical stimulation mapping found that naming errors, including semantic and phonological paraphasic errors, circumlocutions, neologisms, and no-response errors, showed distinct neuroanatomical correlates across frontal, parietal, and posterior temporal dorsal areas of the brain. 36 Also, other studies have found that errors made on tests of naturalistic action were associated with specific MRI-defined regions.37,38 These findings are suggestive of the potential of extending the assessment of cognition to include errors and process scores, in combination with selected MRI biomarkers and other risk factors, to enhance the identification of MCI and preclinical dementia. Future research integrating advanced imaging techniques and larger, more diverse cohorts will be essential to delineate the contributions of specific regions of interest and their interactions within broader cognitive networks.
This research documents an association between error and process scores with MRI regions of interest associated with dementia, which may have important clinical applications. For example, versions of the TMT-B and visual confrontation naming tests are part of other neuropsychological protocols such as the Montreal Cognitive Assessment (MoCA). 39 MoCA TMT-B pen lifts and MoCA naming errors could signal the presence of an emergent nascent illness despite a superficially correct summary score. The current research also aligns with evolving digital-based cognitive assessments that can be administered with commercial, off-the-shelf mobile devices that easily allow researchers to evaluate the added utility of error and process information.33,40,41 Previous studies have shown that digital-based NP tasks can provide automatically scored measures and metrics of process-based behaviors and neurocognitive constructs.42–44 For example, scores derived from the digital version of the TMT-B, including time to complete the entire test, time to draw individual lines connecting successive test stimuli, the total number of pen strokes needed to complete the test, and difficulty drawing straight lines connecting successive test stimuli, were worse among groups identified with subtle and mild instrumental activities of daily living impairment than their unimpaired counterparts.
With the anticipated rise in dementia cases over the next decade, alongside advancements in preventive and therapeutic strategies, comprehensive cognitive tools present an opportunity to enhance early identification of individuals at preclinical and early stages of ADRD.45–47 This study highlights the distinct value of NP process and error scores in providing deeper insights into cognitive phenotypes. Rather than replacing summary scores, these measures offer complementary benefits by detecting subtle cognitive deficits and identifying individuals who might require a more detailed NP evaluation. For example, circumlocution errors on the BNT demonstrated unique predictive value for moderate-mixed impairments, a phenotype typically identified through more time-intensive assessments. These findings point to the potential for developing focused, shorter, more time-efficient NP protocols designed to capture specific errors and processes. This information could be integrated into effective and scalable NP screening tools. Leveraging technology, such tests could be deployed remotely, enabling early detection and intervention, particularly in resource-limited settings.
The main strength of this analysis was the use of a longitudinal, community-based cohort sample, which enhances the representativeness of the study's findings compared to previous studies, which utilized highly selected samples, such as those from memory clinics. Although this study provides valuable insights, certain limitations must be acknowledged. First, while our study benefited from a large, community-based cohort of 1195 participants, it is important to acknowledge that this sample size may not fully represent the broader population. The vast majority of the participants in our sample were cognitively healthy, limiting the number and types of cognitively impaired profiles identified. Also, our sample consisted of mainly White participants or those from European descent who were well-educated, which limits the generalizability of our findings to more diverse samples. Future studies should aim to include a higher proportion of individuals with varying levels of cognitive impairment, as well as populations with younger adults and non-White populations, to further validate and improve the generalizability of these findings. Second, our study focused on a subset of errors and process scores from NP tests that met a predetermined AUC cutoff (0.64), which may have excluded other potentially relevant measures. Additionally, we were limited to the NP tests available in our dataset, and the absence of tests targeting other cognitive domains may have constrained our ability to fully characterize the relationships between NP errors/processes and cognitive phenotypes. Future studies incorporating a broader range of NP tests and measures could provide further insights and strengthen the observed associations.
Conclusion
Using Framingham Heart Study data, this study found three neurocognitive phenotypes in community-dwelling older adults: cognitively normal, moderate-mixed impairment, and dysexecutive impairment. These phenotypes were distinguished by NP test errors and process scores, such as TMT-B pen lifts and BNT circumlocution errors, which were also associated with decreased hippocampal volumes. Our findings underscore the value of detailed NP test error and process analysis in enhancing the identification and understanding of cognitive impairments in older adults, offering a more comprehensive approach than use of traditional summary scores alone. Given that our research is limited by its predominantly healthy and less diverse sample, future research should include a broader range of cognitive impairments and diverse populations. Integrating digital cognitive assessments could further refine diagnostic tools and interventions, supporting early detection and management of ADRD.
Supplemental Material
sj-docx-1-alz-10.1177_13872877251334608 - Supplemental material for Neuropsychological phenotypic characteristics in a cohort of community-based older adults: Data from the Framingham Heart Study
Supplemental material, sj-docx-1-alz-10.1177_13872877251334608 for Neuropsychological phenotypic characteristics in a cohort of community-based older adults: Data from the Framingham Heart Study by Ileana De Anda-Duran, Phillip H Hwang, Deborah AG Drabick, Stacy L Andersen, Rhoda Au and David J Libon in Journal of Alzheimer's Disease
Footnotes
Acknowledgments
The authors have no acknowledgments to report.
ORCID iDs
Ethical considerations
The study protocol was approved by the Institutional Review Board of the Boston University Medical Campus (Approval number: H-40620) on December 17, 2020.
Consent to participate
All participants provided written informed consent prior to participating.
Consent for publication
Not applicable.
Author contributions
Ileana De Anda-Duran (Conceptualization; Formal analysis; Methodology; Visualization; Writing – original draft; Writing – review & editing); Phillip H Hwang (Conceptualization; Formal analysis; Methodology; Supervision; Writing – original draft; Writing – review & editing); Deborah AG Drabick (Formal analysis; Methodology; Writing – review & editing); Stacy L Andersen (Conceptualization; Data curation; Methodology; Writing – original draft; Writing – review & editing); Rhoda Au (Conceptualization; Funding acquisition; Investigation; Methodology; Writing – original draft; Writing – review & editing); David J Libon (Conceptualization; Formal analysis; Investigation; Methodology; Writing – original draft; Writing – review & editing).
Funding
The author(s) disclosed receipt of the following financial support for the research, authorship, and/or publication of this article: IDA was supported by the Alzheimer's Association under grant AARFD-23-1150584. PHH was supported by the National Institute on Aging under grant K01AG080119 and the Alzheimer's Association under grant 23AARF-1019048. SLA was supported by the National Institute on Aging under grant K01AG057798. FHS funded this work partly with federal funds from the National Heart, Lung, and Blood Institute, Department of Health and Human Services under contract number 75N92019D00031 and contracts N01-HC-25195 and HHSN269201500001I, grants from the National Institute of Health (R00AG062783, R01-AG008122, R01-AG062109, U01AG068221, R01HL159620, R43DK134273, R21CA253498, and U19AG068753).
Declaration of conflicting interests
The author(s) declared the following potential conflicts of interest with respect to the research, authorship, and/or publication of this article: Dr. Libon receives royalties from Oxford University Press and consults to Linus Health, Inc; Dr. Libon receives royalties from Linus Health. Dr. Au is a scientific advisor to Signant Health and a consultant to Biogen. The remaining authors have no disclosures to report. Drs. Au, De Anda-Duran, and Libon are Editorial Board Members of this journal but were not involved in the peer-review process of this article nor had access to any information regarding its peer review.
Data availability
Data not provided in the article and additional information on methods and materials can be shared on responsible request.
Supplemental material
Supplemental material for this article is available online.
References
Supplementary Material
Please find the following supplemental material available below.
For Open Access articles published under a Creative Commons License, all supplemental material carries the same license as the article it is associated with.
For non-Open Access articles published, all supplemental material carries a non-exclusive license, and permission requests for re-use of supplemental material or any part of supplemental material shall be sent directly to the copyright owner as specified in the copyright notice associated with the article.