



Abstract
Background
Hypertension and the APOE4 allele are known risk factors for Alzheimer's disease (AD) and E4 carriers show different blood pressure (BP) and cognitive responses to high fat feeding.
Objective
We investigated the influence of these factors on global cerebral blood flow (CBF) and four regions of interest (ROIs) (angular gyrus, hippocampus, posterior cingulate, temporal lobe) using arterial spin labeling (ASL) MRI in fasting state and after ingestion of heavy cream in older adults.
Methods
29 adults (age in years 66.8 ± 4.1) underwent baseline and 1, 2, 3-h ASL MRI after ingestion of 100 mL heavy cream. We used pCASL MRI with background suppression to measure CBF in ml/100 g/min. Statistical analyses included mixed-effects modeling and Pearson correlation to ascertain whether CBF changed over time and how variables influenced results.
Results
Global CBF decreased at 1-, 2-, and 3-h post-heavy cream, compared to time 0 (overall change 7.11%, p < 0.01); recapitulated in 3 of 4 ROIs. Mean arterial pressure emerged as a predictive variable for both baseline and post-heavy cream CBF (β = −0.25, 95% CI = −0.39, −0.10, p = 0.002). Individuals with higher BP demonstrated reduced CBF, particularly in posterior cingulate and temporal lobe (β = −5.50, 95% CI = −9.9, −1.09; β = −6.28, 95% CI = −12.35, −0.21, respectively, both p < 0.05). Examination of correlations with BP and change scores revealed that this relationship was driven largely by E4 carriers.
Conclusions
CBF decreased after ingestion of heavy cream, globally and in regions known to be important in AD, and this finding was driven by E4 carriers with higher BP.
Introduction
Alzheimer's disease (AD) is the most common cause of dementia, and one AD risk factor identified in epidemiologic studies is a ‘Western diet’ which is characterized by high intake of saturated high fat foods (HFF).1,2 The Lancet recently updated its list of preventable risk factors for dementia, including hypertension (HTN), elevated LDL cholesterol, and obesity—all of which could be impacted by diet. 3 Hypertension has long been known to be a risk factor for both vascular and AD dementia, and one clinical trial demonstrated a reduction in AD and MCI with aggressive treatment of blood pressure in older adults4,5 However, it is unknown which factors or combination of factors induced by HFF impart this AD risk and how this risk is applied across different groups at risk for AD. For example, the E4 allele confers an odds ratio of 3.68 for developing AD, 6 and the association between HFF and AD in human epidemiological work is predominantly limited to E4 non-carriers in some7,8 but not all studies. 9 We and others have shown that E4 carriers respond differently to acute 10 as well as chronic diet interventions, 11 and E4 carriers demonstrated a more significant blood pressure drop after acute fat feeding which could be one mechanism for this difference. 12
Remarkably, human studies demonstrate that a single high fat meal can increase markers of peripheral inflammation and oxidation,13,14 alter vascular reactivity and blunt post-prandial vasodilation,15–17 and worsen cognitive test results in older adults, 18 indicating that single meal studies may be useful for elucidating mechanisms for why HFF increases AD risk, or how different groups are affected by HFF. To accomplish this, we need to develop biomarkers to add to these epidemiologic studies to gain a better understanding of what mechanisms serve to protect against AD. Measuring acute blood flow response to lipid ingestion with arterial spin labeling (ASL) MRI may be one tool to help uncover mechanisms and potential responders and non-responders to diet therapies. This is a non-invasive technique to quantify global and regional cerebral blood flow (CBF).19,20 In dementia, the pattern of hypoperfusion seen using ASL closely matches established patterns of hypometabolism on glucose PET scans due to the close coupling of perfusion and metabolism in the brain, and reduced CBF seen in AD often precedes cognitive decline and brain atrophy.21,22
In addition to dementia, multiple studies have now demonstrated the utility of ASL in acute diet and metabolic studies23,24 as well as drug studies, including studies on intranasal insulin delivered to the brain.25–27 In these studies, changes in blood flow through ASL were detectable in small numbers of participants. In some cases, these blood flow changes correlated with cognitive outcomes. 27 Since different groups at risk for AD seem to respond differently to diet and supplement interventions, functional neuroimaging including perfusion imaging may also be useful to assess clinical response to varying treatments. Therefore, we undertook this study to understand how CBF, and changes in CBF as demonstrated through ASL, can be utilized as a clinical biomarker in various trials including those involving diet interventions. Overall, our results demonstrate that hypertension was associated with significant reductions in cerebral blood flow, particularly in response to dietary challenge. Furthermore, this finding was predominantly seen in those with the APOE E4 risk gene.
Methods
Participants
This pilot study enrolled 30 participants from the Meal and Memory study (ClinicalTrials.gov Identifier: NCT03070535). Eligible participants were adults aged 55 and older without dementia or diabetes, not on statins or diabetic medications, and had previously obtained APOE genotype via PCR analysis. All participants provided informed consent prior to the study, which was approved by the Institutional Review Board of the University of Washington. All procedures were in accordance with the ethical standards of the institutional review board of the University of Washington and with the 1964 Helsinki declaration and its later amendments or comparable ethical standards.
Study design
The study was conducted at the University of Washington's South Lake Union campus. Participants fasted for 8 h prior to the study, except for water and medications and were asked not to vigorously exercise the morning of the study. Upon arrival, participants’ baseline vitals, including height, weight, blood pressure (BP), and heart rate, were recorded. No other vitals were collected during the visit. Participants then walked to the MRI building and rested for 15 min before the baseline MRI scan. Participants consumed 100 mL of heavy cream, providing 370 calories, 40.4 grams of total fat, and 23.6 grams of saturated fat, within a 5-min period. Heavy cream has been used as oral fat tolerance tests in several studies.28–31
Subsequent ASL MRI scans were conducted at 1-, 2-, and 3-h post-drink ingestion. During waiting intervals, participants were instructed to rest or engage in light activities (e.g., reading, knitting) without exercising, leaving the facility or consuming other food or drink except water during the time points.
Perfusion MRI protocol
Imaging parameters were in accordance with the 2015 recommendations of the Perfusion Study Group of the International Society for Magnetic Resonance in Medicine. All MRI scans were performed on a 3T Philips Ingenia CX scanner (Best, The Netherlands) using a 32-channel reception coil with Sensitive Encoding (SENSE). The arterial spin labeling (ASL) protocol utilized pseudo-continuous arterial spin labeling (pCASL) to measure CBF in mL/100 g/min. This non-invasive technique employs magnetically labeled arterial blood water as endogenous contrast. Imaging parameters were as follows:
Dual adiabatic background suppression pulses were applied to minimize tissue contamination at TI = 2050 and 3250 ms. A total of 30 control-label pairs were acquired. An equilibrium magnetization scan (M0) was also acquired (TR = 10000 ms.) without labeling or background suppression. The labeling plane was parallel to the imaging volume.
Image processing and quality inspection
ASL images were processed using FSL (FMRIB Software Library). Motion correction was applied using FSL-MCFLIRT, and data were registered to the M0 image. Pair-wise subtraction between control and label images was performed, followed by application of a two-compartment model to quantify CBF. The CBF quantification considers a two-compartment Buxton model with the assumption of very rapid or instantaneous exchange of the entire bolus from the vascular compartment to the tissue compartment.32,33 The resulting CBF maps were co-registered to T1-weighted structural images and transformed into MNI space. In addition to assessing global blood flow, we chose in advance to assess four specific regions considered to be vulnerable in AD: angular gyrus, hippocampus, posterior cingulate and temporal lobe. Masks of these regions are provided in MNI space based on PET imaging by Landau et al. and were identified using the Harvard-Oxford Cortical and Subcortical atlas in MNI space.34,35
Quality control
Motion artifacts were assessed for visually if the difference images between control and label showed edge-artifacts even after motion correction. Difference maps were assessed and delays and low cortical CBF values such as those < 10 ml/100 gm/min or negative CBF values were attributed to poor labeling or CVD requiring longer labeling. Quality control was done prior to any data analysis. One subject's data had to be excluded from analysis due to not passing quality control measures (artifacts could not be corrected for), therefore we had 29 subjects for the analysis.
Statistical analysis
Statistical analyses were performed using R and SAS on Demand (2025). Time associated trends in CBF over time post-heavy cream ingestion were evaluated using linear mixed-effects models (LMMs) to account for repeated measures. The model included a random intercept per subject to account for between-subject variability and fixed effects for time and any analyzed covariates. Additional LMMs employed to evaluated associations between CBF and baseline characteristics (e.g., sex, age, BMI, SBP, DBP, APOE status, and heart rate). Each baseline characteristic was evaluated in separate LMMs, rather than in a single LMM, due to sample size limitations. Mean arterial pressure (MAP) was calculated as:
Results
Clinical characteristics and hypertension status
We analyzed data from 29 participants, with 13 (45%) classified as lower BP and 16 (55%) as higher BP. Table 1 summarizes the clinical characteristics of the participants. Regarding E4 genotype status, 14 participants (48%) were E4 genotype-negative, while 15 participants (52%) were E4 genotype-positive. There were no significant differences between the groups in characteristics such as age, sex, E4 genotype, BMI, and heart rate. The mean (± SD) arterial pressure (MAP) for participants with low BP was 82.6 (± 4.7) mmHg compared to 97.5 (± 7.5) mmHg for participants with high BP. Of the participants in the higher BP group, 5 (31%) had elevated blood pressure (SBP 120–129 mmHg and DBP less than 80 mmHg), 6 would meet criteria for Stage 1 HTN (SBP 130–139 mmHg or DBP 80–89 mmHg), and 5 (31%) would meet criteria for Stage 2 HTN (SBP > 140 mmHg or DBP > 90 mmHg) if being diagnosed on this BP only, as per the 2017 AHA HTN criteria. Only 3 of the participants were prescribed medication for HTN at the time of the study-all three were in the high BP group in this analysis.
Clinical characteristics of study participants stratified by blood pressure status.

Mean (±SD) or Frequency N (%).
Time-dependent changes in cerebral blood flow
There were time-dependent decreases in CBF following heavy cream ingestion for all participants (Figure 1, Tables 2 and 3). At baseline, total CBF was 33.61 ± 4.85 ml/100 g/min and decreased over 3 h to 31.22 ± 4.52 ml/100 g/min (Table 2). Significant reductions in CBF were observed over time in the hippocampus (HBF), posterior cingulate (PCBF), and temporal lobe (TBF) but not angular gyrus (AGBF). Table 3 presents the results of mixed-effects regression modeling of CBF over time, which demonstrates a significant association between decreases in CBF and time for total CBF and for all regions except for angular gyrus (p < 0.01) (time values similar with and without MAP in model).

Time-dependent changes in cerebral blood flow following lipid ingestion in older adults. Spaghetti plots with trend lines for cerebral blood flow (CBF) and four regions of interest: angular gyrus (AGBF), hippocampus (HBF), posterior cingulate (PCBF), and temporal lobe (TBF). The plots show individual participant data (light blue lines) and group mean trends (dark blue lines) across time points (baseline, 1 h, 2 h, and 3 h post-lipid ingestion). Asterisks (*) indicate statistically significant changes from baseline (p < 0.05) (colors are visible in the online version).
Cerebral blood flow measurements in participants by BP status over time.
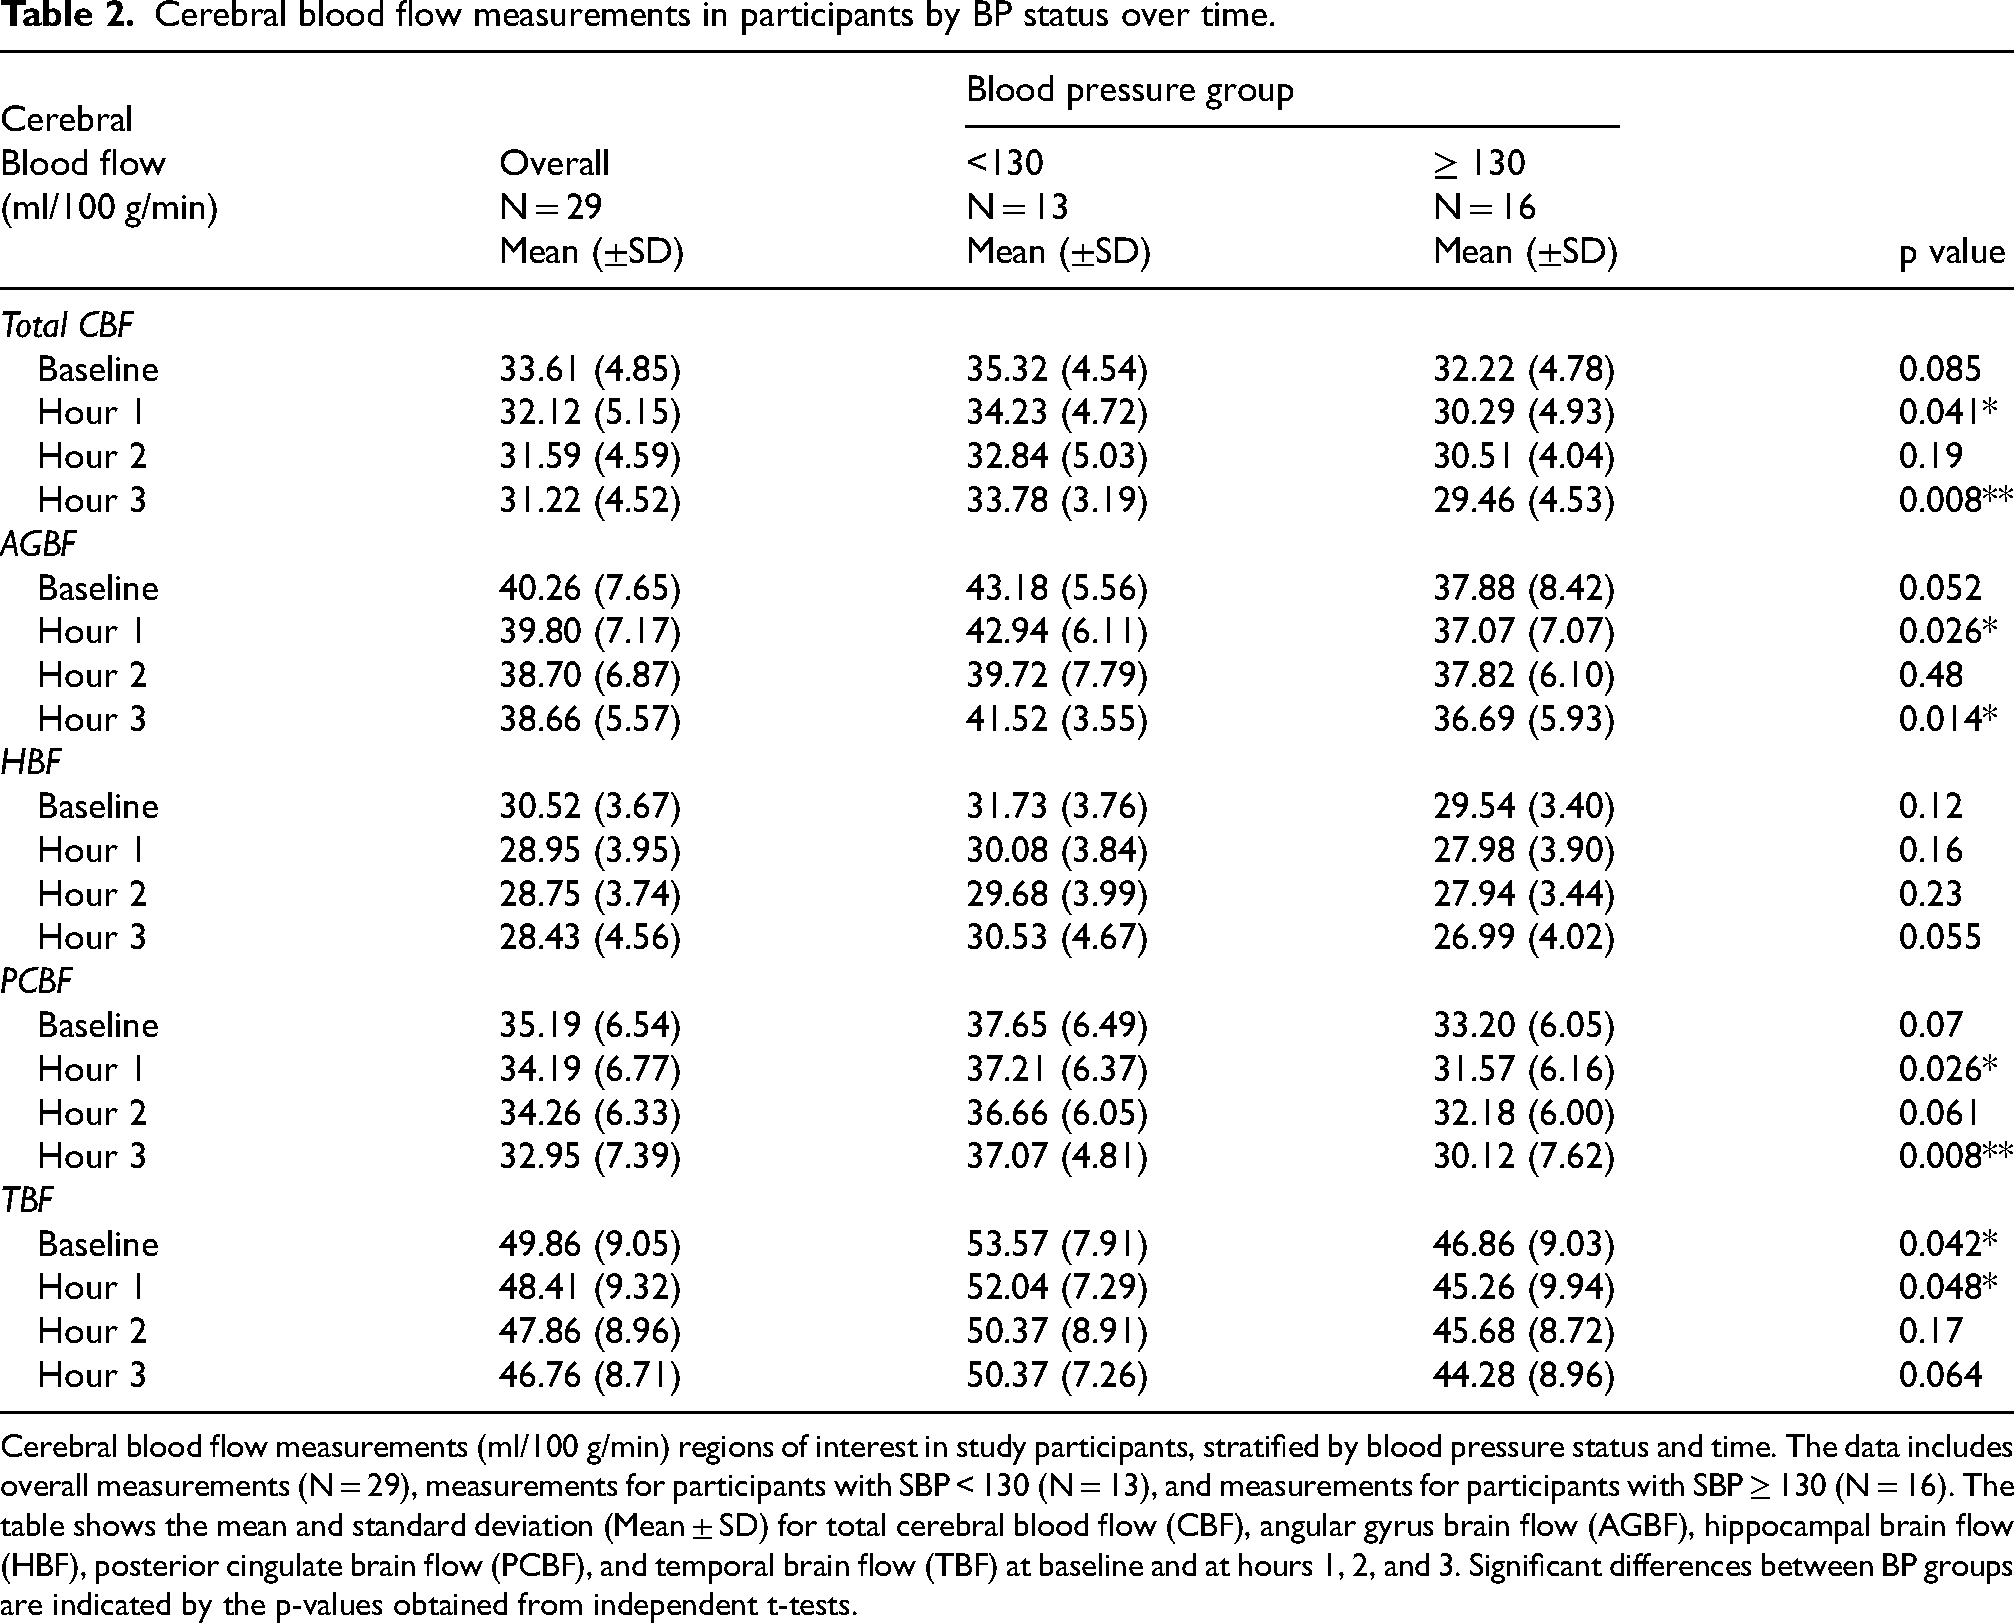
Cerebral blood flow measurements (ml/100 g/min) regions of interest in study participants, stratified by blood pressure status and time. The data includes overall measurements (N = 29), measurements for participants with SBP < 130 (N = 13), and measurements for participants with SBP ≥ 130 (N = 16). The table shows the mean and standard deviation (Mean ± SD) for total cerebral blood flow (CBF), angular gyrus brain flow (AGBF), hippocampal brain flow (HBF), posterior cingulate brain flow (PCBF), and temporal brain flow (TBF) at baseline and at hours 1, 2, and 3. Significant differences between BP groups are indicated by the p-values obtained from independent t-tests.
Mixed-effects regression modeling of cerebral blood flow over time, with mean arterial pressure (MAP) and SBP ≥ 130.
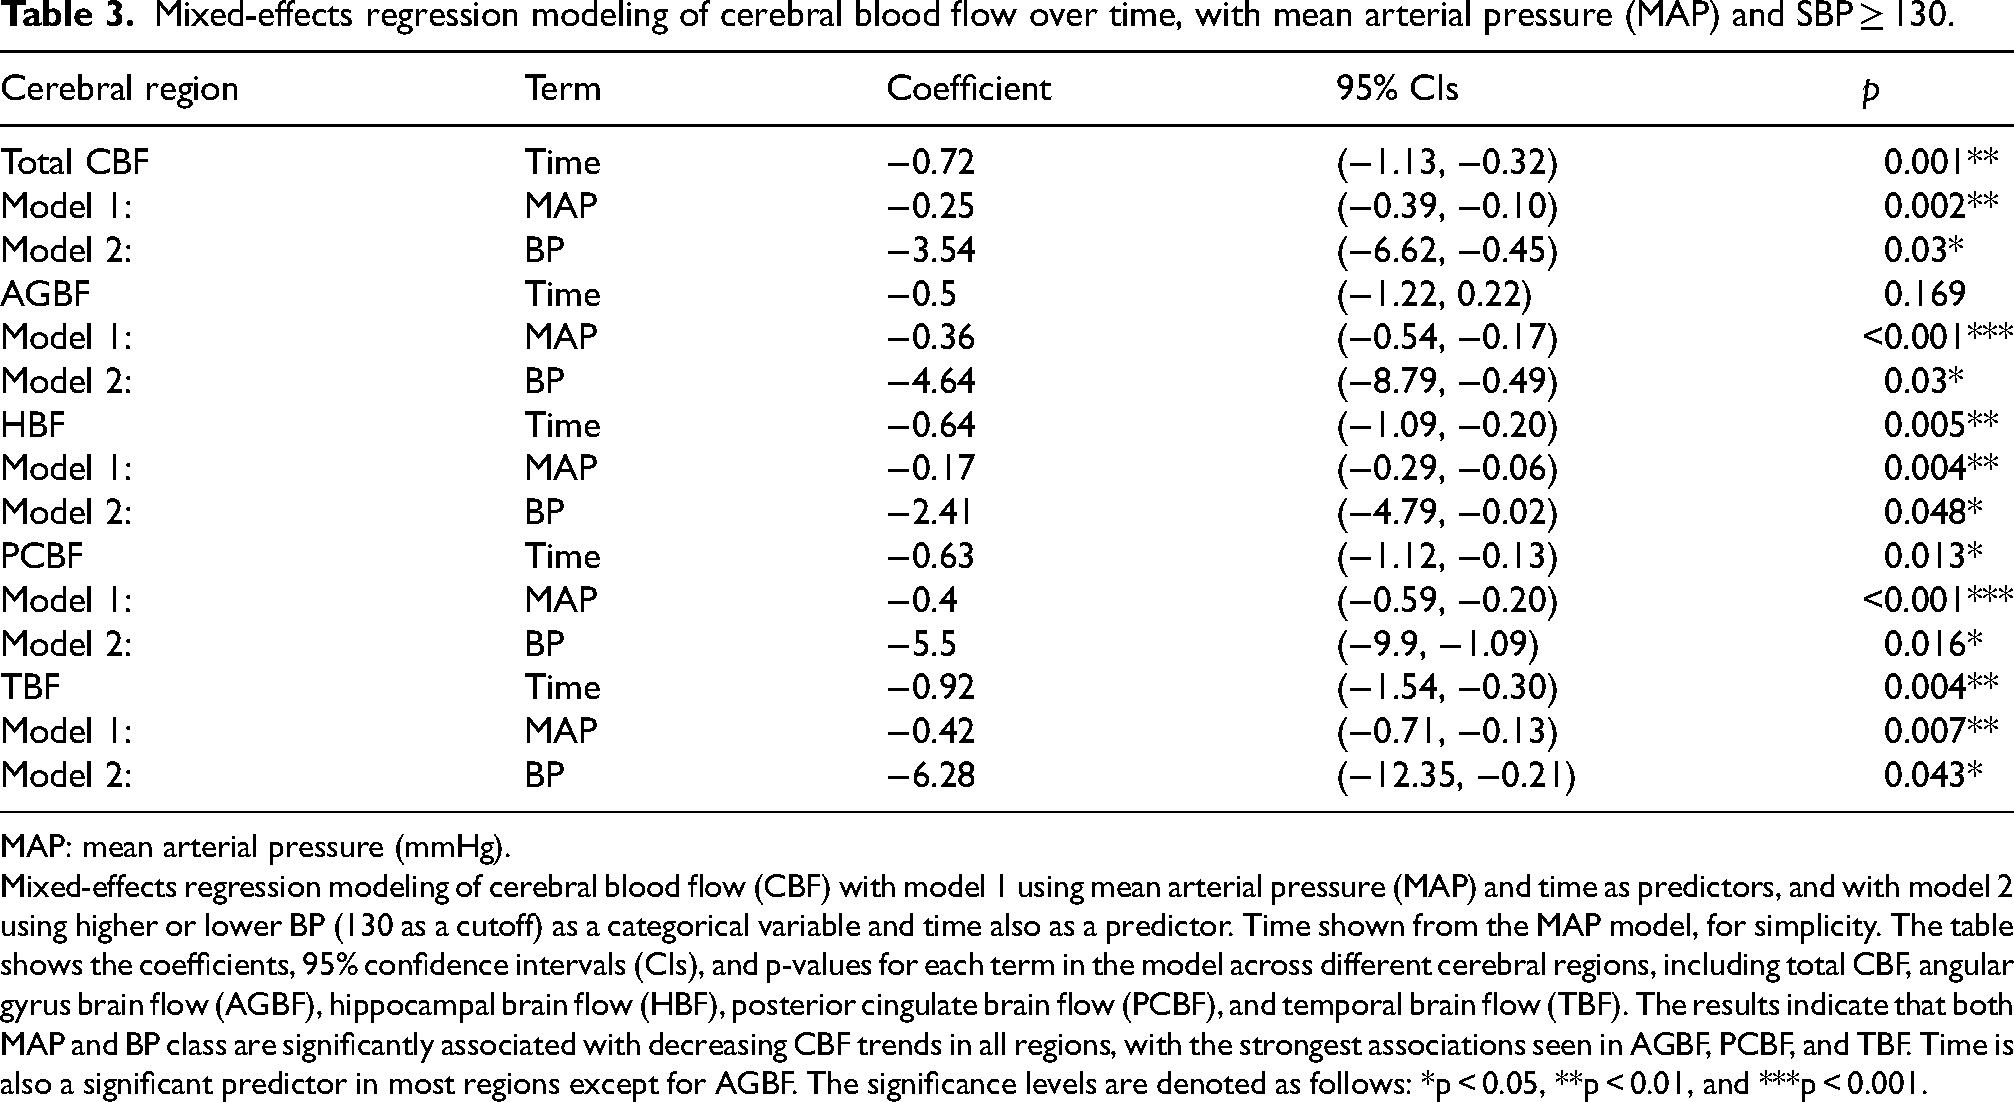
MAP: mean arterial pressure (mmHg).
Mixed-effects regression modeling of cerebral blood flow (CBF) with model 1 using mean arterial pressure (MAP) and time as predictors, and with model 2 using higher or lower BP (130 as a cutoff) as a categorical variable and time also as a predictor. Time shown from the MAP model, for simplicity. The table shows the coefficients, 95% confidence intervals (CIs), and p-values for each term in the model across different cerebral regions, including total CBF, angular gyrus brain flow (AGBF), hippocampal brain flow (HBF), posterior cingulate brain flow (PCBF), and temporal brain flow (TBF). The results indicate that both MAP and BP class are significantly associated with decreasing CBF trends in all regions, with the strongest associations seen in AGBF, PCBF, and TBF. Time is also a significant predictor in most regions except for AGBF. The significance levels are denoted as follows: *p < 0.05, **p < 0.01, and ***p < 0.001.
Impact of covariates on CBF
Next, we explored whether the continuous covariates of SBP, DBP, MAP, age, BMI, and heart rate or dichotomous variables APOE and sex affected CBF. Only the blood pressure variables were consistently significant predictors, with MAP being the most significantly associated with CBF values across all examined regions. The strongest associations were observed in the angular gyrus, posterior cingulate, and temporal lobe (p < 0.01 for all, Table 3).
To examine these findings in a clinical context, participants were divided into clinical categories of low BP or high BP based on their fasting blood pressure as above. Table 2 details CBF measurements stratified by BP status and time. At baseline, higher BP participants had lower total CBF (32.22 ± 4.78 ml/100 g/min) compared to lower BP participants (35.32 ± 4.54 ml/100 g/min), though this difference was not statistically significant (p = 0.085). Significant differences between these groups did emerge at hour 1 (p = 0.041) and hour 3 (p = 0.008), with higher BP participants showing lower CBF. Examining the pattern in Table 2 suggests that the magnitude of the difference in CBF was exaggerated over time, then converged, then exaggerated once again after three hours. Table 3 shows analyses collapsed across time points using LMMs, identical to the MAP analyses (model 2 in Table 3). higher BP was significantly associated with reduced total CBF and in all ROIs, with the most pronounced reductions in the posterior cingulate and temporal lobe.
Impact of sex and APOE on CBF change
To assess time-related changes in CBF, we calculated change scores by subtracting baseline (time 0) values from those at three subsequent time points. We then performed ANOVAs using sex and E4 as categorical variables for each change score; covariates were not significant. When HTN status was included at 1 h, an E4*HTN interaction emerged: E4 carriers with lower blood pressures showed increased PCBF (F = 5.94, p = 0.0226) and AGBF (F = 10.69, p = 0.0032), whereas the other groups had decreases. A similar, nonsignificant trend appeared for global CBF (F = 3.65, p = 0.0682). Pearson correlation analyses corroborated these findings (Table 4, Figure 2). Among E4 carriers, higher SBP was linked to a smaller decrease in CBF in several regions. In non-carriers, no association was observed at 1 h, and a positive association emerged for AGBF at 2 and 3 h (Table 4). Analyses of sex and higher blood pressure showed no consistent pattern, and the E4*sex interaction was not significant.
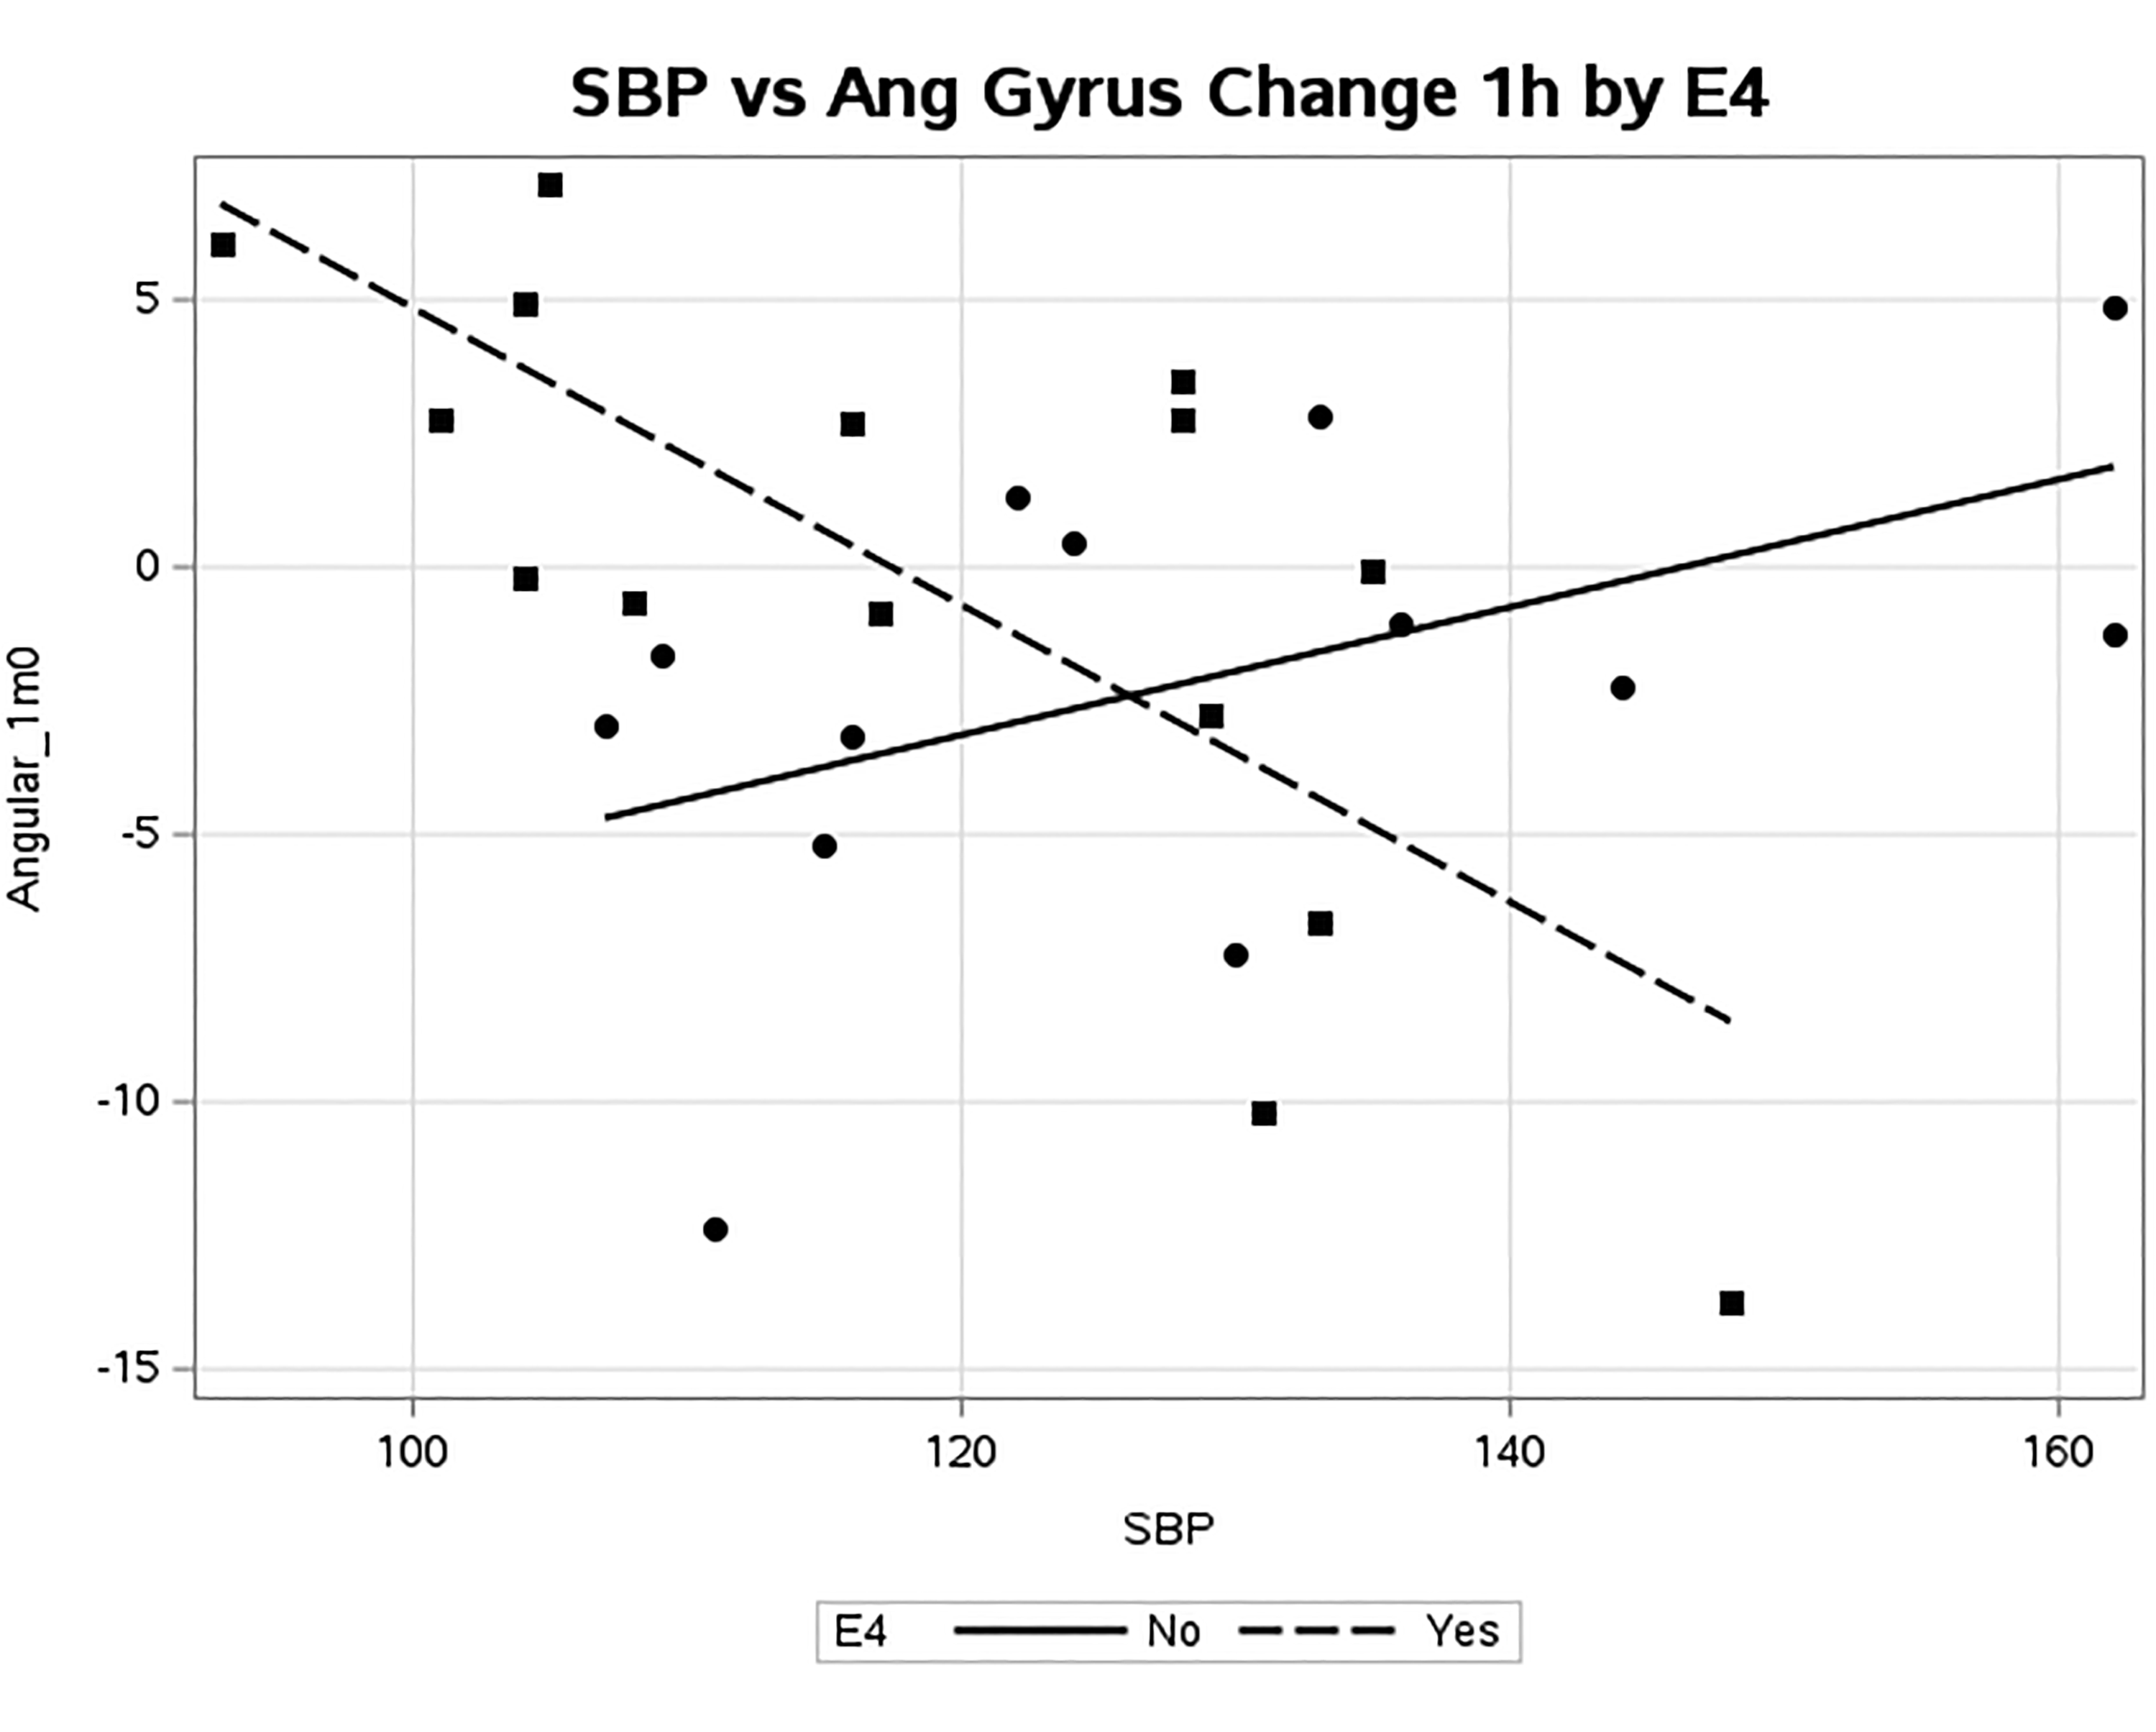
Scatter plot for change scores at one hour for angular gyrus by E4 status. E4 carriers (squares, dotted line) show a more negative change in CBF as SBP goes up, whereas there is no significant relationship for E4 non-carriers (circles, solid line). Correlation coefficients and p values given in Table 4.
Correlation matrix of CBF change scores by E4 status.
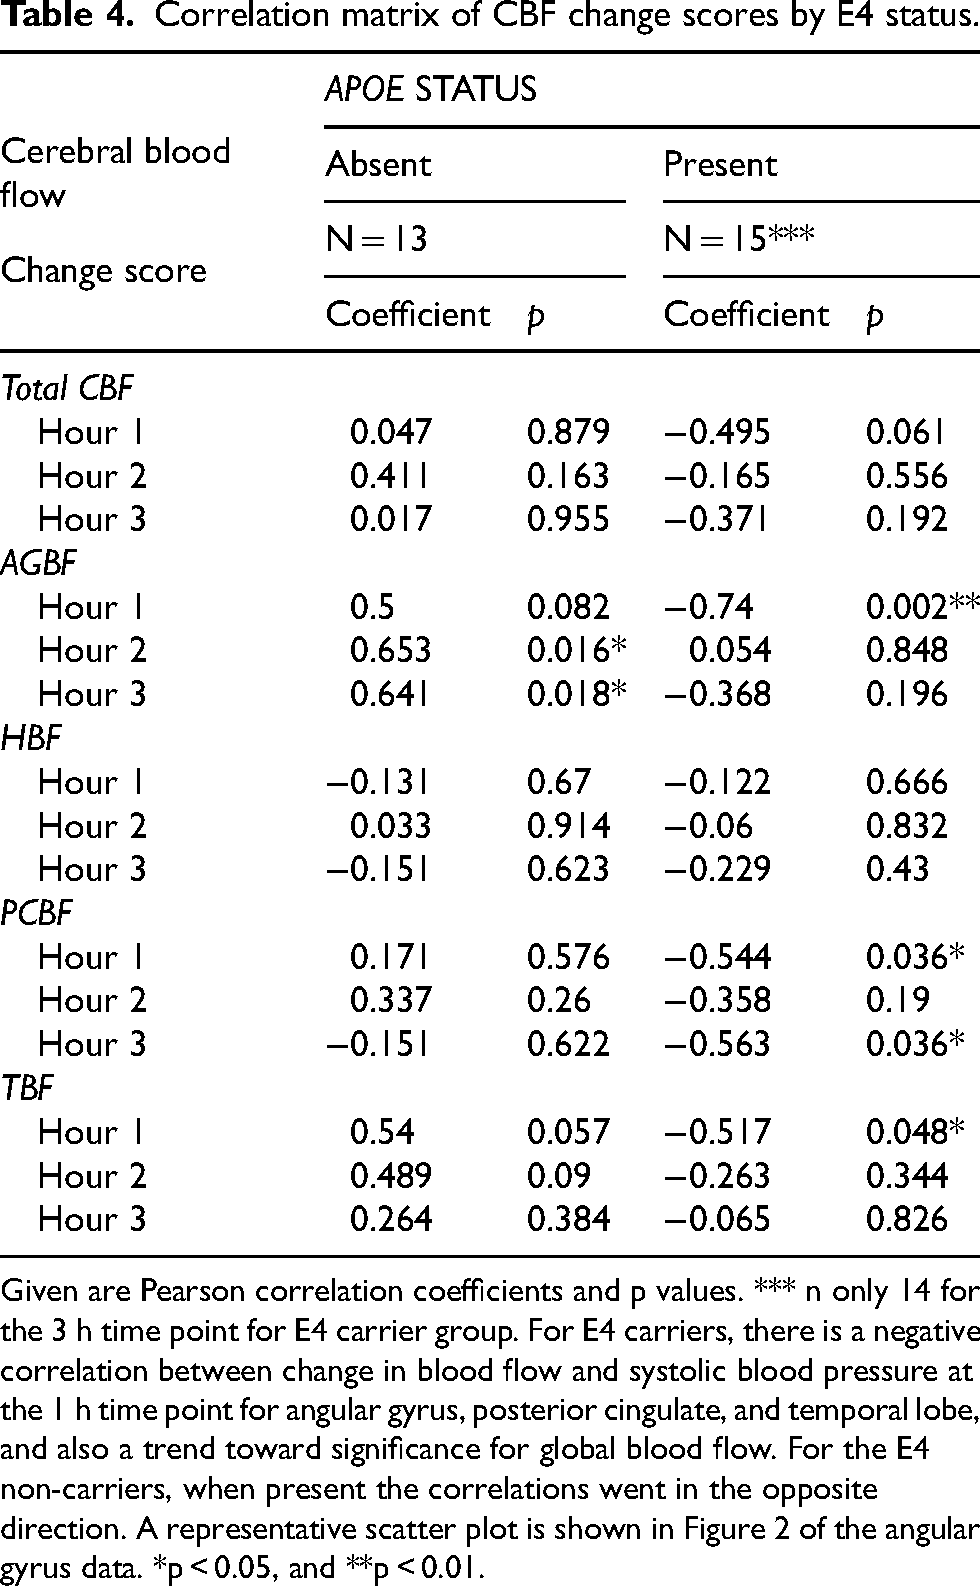
Given are Pearson correlation coefficients and p values. *** n only 14 for the 3 h time point for E4 carrier group. For E4 carriers, there is a negative correlation between change in blood flow and systolic blood pressure at the 1 h time point for angular gyrus, posterior cingulate, and temporal lobe, and also a trend toward significance for global blood flow. For the E4 non-carriers, when present the correlations went in the opposite direction. A representative scatter plot is shown in Figure 2 of the angular gyrus data. *p < 0.05, and **p < 0.01.
Discussion
In this cohort of older adults, global CBF and CBF in three of four AD-related regions decreased following ingestion of a heavy cream lipid drink. All regions except the angular gyrus showed a pattern similar to the global flow reduction. Neither age, BMI, heart rate, nor sex influenced baseline CBF or change scores. However, baseline systolic (SBP), diastolic (DBP), and mean arterial pressure (MAP) were significant in the model at multiple time points: participants with even mild elevations in BP had lower total and regional CBF at hours 1 and 3. Notably, SBP at hour 1 was more strongly associated with CBF decline in APOE E4 carriers.
CBF and feeding studies
The pattern of hypoperfusion seen on ASL closely matches glucose hypometabolism and can precede brain atrophy; therefore, ASL imaging is emerging as a useful modality for clinical dementia studies.21,22 Multiple studies have demonstrated ASL utility in acute drug, diet and metabolic studies.23,24 Studies that mimicked a fasting state or involved administration of insulin tended to show
CBF and demographic variables
As different groups at risk for AD seem to respond differently to diet and supplement interventions, perfusion neuroimaging may be useful to assessing clinical response treatments. Analysis of a multimodal intervention that included diet (FINGER) demonstrated that those with E4 + carrier status (E3/E4 and E4/E4) favored lower carbohydrate and higher fat and protein diets, compared to individuals with other genotypes. 11 We have shown that E4 carriers not only failed to benefit cognitively from low fat feeding, but also demonstrated cognitive improvement after HFF. 10 Although reasons for this paradox are unknown, E4 carriers exhibit several different responses to HFF, including a more significant blood pressure drop. 12 These blood pressure variations may influence cerebral blood flow. In this study, we observed no APOE-related differences at baseline, but only E4 carriers showed a relationship between higher SBP and lower CBF at 1 h post. These findings align with previous work demonstrating E4-specific responses to high-fat feeding, though the direction of the correlation was unexpected as we predicted increased CBF in HFF in E4 carriers. Future studies with larger sample sizes and additional biomarker and cognitive testing are needed to confirm and contextualize these results. Regarding sex, previous published data indicate differences in ASL measures between sexes, where women tend to have higher CBF in both younger and older populations.43–45 We did not find a sex difference at baseline or CBF change scores; the reasons for this are unclear.
CBF and blood pressure
MAP was highly correlative with global and regional blood flow; MAP collected at time 0 maintained that relationship after 3 h post heavy cream drink. Calculated MAP showed a stronger fit with baseline and post-drink CBF measures than the individual BP components, which is physiologically congruent as MAP represents the blood flow presented to the brain. These findings underscore the need to include blood pressure as a control variable in ASL-based CBF assessments and to measure perfusion across different brain regions over time in both fasting and fed states. Using an AHA-recommended SBP cutoff of 130 mm Hg, 36 we found that even mildly elevated blood pressure (mean SBP 137.9) was associated with reduced global and regional CBF in learning- and memory-related areas and persisted for 3 h. These findings align with other studies which have shown an association between high blood pressure and low cerebral blood flow. When cerebral blood flow was measured through vascular or invasive measures including the Xenon-133 method, in general no change in CBF has been detected comparing those with HTN to those without, even in the elderly. 41 However, when examined by ASL, global and regional blood flow changes have been detected in those with HTN.46,47 In a small study of older adults with HTN, intensive versus usual lowering of BP over 12 weeks showed an increase in ASL global CBF. 46 In a randomized BP trial of older adults (SPRINT MIND), intensive BP control to a target of less than 120 mm Hg (compared to <140) was associated with increased global CBF, and this finding was more pronounced in individuals with cardiovascular disease. 47 In a younger cohort, those with HTN had lower overall global and regional CBF; and in this case most of the differences were noted in white matter rather than gray matter blood flow. 48 Given that HTN itself is a risk factor for AD, 4 improvements in CBF may be one mechanism by which this occurs.5,47
Brain regions
Regions of interest examined in this study were adapted from previous ASL and imaging studies and were based on known areas affected in AD. These included the angular gyrus and posterior cingulate which are part of the inferior parietal lobe, the entire temporal lobe, and the hippocampus which is a portion of the temporal lobe.34,35 In a group of older adults with and without AD, regional brain hypoperfusion by ASL correlated well with impaired glucose uptake by FDG-PET imaging, particularly in the angular gyrus and the posterior cingulate. 34 In this study, global CBF and three of the four prespecified areas of interest in AD decreased over time in response to the lipid drink; no such decrease was measured in the angular gyrus. The areas most affected by elevated BP were the posterior cingulate and the temporal lobe. Individuals with mild cognitive impairment have CBF reductions in the posterior cingulate gyrus and neighboring precuneus. Reduction in blood flow to these areas occurs prior to brain atrophy and these regions may be susceptible to early vascular dysregulation leading to disrupted brain connectivity. 22 The lack of significant blood flow changes in angular gyrus could be due to lack of power in this smaller area or possibly due to region-specific response to heavy cream ingestion.
Limitations
This small pilot study included only one set of vitals, no pulse oxygenation or heart rate monitoring during MRIs, and required participants to walk 1–2 blocks between buildings. We attempted to mitigate this by allowing a 15-min acclimatization period before baseline imaging, but some individuals may have walked or biked further, potentially affecting results. Heavy cream was not compared to other macronutrients (e.g., protein or sugar), and thus we cannot determine whether post-prandial CBF decreases are unique to lipids or when CBF returns to baseline.
Conclusions
In this small pilot study, we observed decreases in both global and regional CBF—findings consistent with other reports showing post-prandial CBF declines across various macronutrients. We also noted that mildly elevated blood pressure was associated with lower CBF, and most participants meeting 2017 AHA hypertension criteria were not on medication. These results underscore the importance of blood pressure management in sustaining cerebral perfusion and highlight MAP's influence on CBF across different regions over time. They also indicate that ASL studies should account for blood pressure, time of day, and fasting versus fed state. Lastly, the association between higher SBP and lower CBF was strongest in E4 carriers, suggesting potential for personalized nutrition interventions for AD prevention, pending confirmation in larger studies.
Footnotes
Acknowledgments
Special thanks to the Alzheimer's Disease Research Center and the Nutrition and Obesity Research Center at University of Washington, and REDCap hosted at University of Washington supported by grant #UL1TR002319.
ORCID iDs

Ethical considerations
All procedures were in accordance with the ethical standards of the institutional review board of the University of Washington and with the 1964 Helsinki declaration and its later amendments or comparable ethical standards.
Consent to participate
All participants provided informed consent prior to the study, which was approved by the Institutional Review Board of the University of Washington.
Author contributions
Nathaniel K Ashford (Formal analysis; Writing – original draft; Writing – review & editing); Swati Rane (Conceptualization; Data curation; Formal analysis; Investigation; Writing – review & editing); Kristen M Farris (Writing – original draft; Writing – review & editing); Jasroop Miglani (Writing – review & editing); Daniel S Hippe (Formal analysis; Writing – review & editing); Baocheng Chu (Data curation; Methodology; Writing – review & editing); Tarun Gandhi (Conceptualization; Methodology; Writing – review & editing); Angela J Hanson (Conceptualization; Formal analysis; Funding acquisition; Investigation; Methodology; Project administration; Validation; Writing – original draft; Writing – review & editing).
Funding
The authors disclosed receipt of the following financial support for the research, authorship, and/or publication of this article: This study was directly funded by 1K23AG047978-01A1 and the Chair of Medicine scholars award from the University of Washington School of Medicine.
Declaration of conflicting interests
The authors declared no potential conflicts of interest with respect to the research, authorship, and/or publication of this article.
Data availability
The data that support the findings of this study are available from the corresponding authors upon request.