
Abstract
Background:
Reliable cerebral blood flow (CBF) biomarkers using a noninvasive imaging technique are sought to facilitate early diagnosis and intervention in early Alzheimer’s disease (AD).
Objective:
We aim to identify brain regions in which CBF values are affected and related to cognitive decline in early AD using a large cohort.
Methods:
Perfusion MRIs using continuous arterial spin labeling were acquired at 1.5 T in 58 normal controls (NC), 50 mild cognitive impairments (MCI), and 40 AD subjects from the Cardiovascular Health Study Cognition Study. Regional absolute CBF and normalized CBF (nCBF) values, without and with correction of partial volume effects, were compared across three groups. Association between regional CBF values and Modified Mini-Mental State Examination (3MSE) were investigated by multiple linear regression analyses adjusted for cardiovascular risk factors.
Results:
After correcting for partial volume effects and cardiovascular risk factors, ADs exhibited decreased nCBF with the strongest reduction in the bilateral posterior cingulate & precuneus region (p < 0.001) compared to NCs, and the strongest reduction in the bilateral superior medial frontal region (p < 0.001) compared to MCIs. MCIs exhibited the strongest nCBF decrease in the left hippocampus and nCBF increase in the right inferior frontal and insular region. The 3MSE scores within the symptomatic subjects were significantly associated with nCBF in the bilateral posterior and middle cingulate and parietal (p < 0.001), bilateral superior medial frontal (p < 0.001), bilateral temporoparietal (p < 0.02), and right hippocampus (p = 0.02) regions.
Conclusion:
Noninvasive perfusion MRI can detect functional changes across diagnostic class and serve as a staging biomarker of cognitive status.
INTRODUCTION
Alzheimer’s disease (AD) is the most common cause of dementia in the elderly and the sixth leading cause of death in the US [1]. The prevalence of AD increases exponentially after the age of 65 [2] and is expected to triple by 2050 [3]. AD has become a major global health concern due to the aging demographic [4]. The resulting impact of AD will be devastating unless prevention, early detection, and treatment options become available. Diagnostic biomarkers are needed to detect the incipient stages of the disease and allow early intervention since the disease appears to be nonreversible [5].
Multimodal imaging studies have been conducted over the last two decades to identify biomarkers for detecting early stage mild cognitive impairment (MCI) and AD. Amyloid-β and tau measured in the cerebrospinal fluid or by PET could be detected a decade before clinical symptoms of AD occur [6]. However, amyloid-β and tau may not be sensitive to disease progression [7]. Functional deficits may precede volume loss measured by the structural MRI and may be more suitable for monitoring disease progression and therapy effects.The results from a meta-analysis showed that cerebral glucose metabolism measured by fluorodeoxyglucose (FDG) PET has high sensitivity and specificity in the diagnosis of AD [8].
Arterial spin labeling (ASL) [9, 10] provides a means of quantifying cerebral blood flow (CBF) by labeling arterial blood water as a diffusible tracer. ASL is well suited to monitor disease progression and examine therapy effects because of its noninvasiveness and low safety risks. Over the last decade, ASL has proven to be sensitive to regional CBF deficits to early AD stage [11, 12]. ASL-MRI identified regional deficits in similar regions and had comparable diagnosis accuracy and discriminative power when compared with FDG-PET [13].
However, the studies of ASL CBF patterns in early AD contained considerable variations associated with the small sample size (n < 30 in each diagnostic class: normal control (NC) or MCI or AD) and the heterogeneity of the patient disease stage within each diagnostic class [11, 12]. Two ASL CBF studies used the multi-site Alzheimer’s Disease Neuroimaging Initiative (ADNI) data, but the ADNI ASL CBF data has a small number of AD subjects: one study with 15 AD subjects [14] and the other one with 24 AD subjects [15]. Only one ASL study included a large number of sample size (73 subjects with subjective complaints, 35 MCI, and 71 AD) [16]. However, the subjects from the study are from referral clinics and such AD subjects are typically in the late AD stage. Without reliable regions with CBF deficits in early AD, it will be difficult for longitudinal and prospective therapy studies to trace CBF as AD progresses and therapy continues. Moreover, the studies did not adjust for cardiovascular risk factors. This is an important limitation because the elderly with cardiovascular risk factors may be particularly vulnerable to cognitive change as a function of reduced CBF [17]. Therefore, cardiovascular risk factors may be confounders in the relationships between CBF and diagnostic class or cognition.
The purpose of this study was to identify brain regions in which CBF is affected by MCI and AD using a large population-based study. CBF maps with and without correction of partial volume effect (PVE) were analyzed by adjusting for cardiovascular risk factors. In addition, an association between CBF values at the affected regions and cognition measured by the Modified Mini-Mental State Examination (3MSE) was investigated.
METHODS
Study population
The Cardiovascular Health Study (CHS) is a multicenter study established in 1989 to investigate risk factors for cardiovascular disease in elderly individuals. In 1998, CHS participants without AD were recruited by the University of Pittsburgh for the CHS-Cognition Study (CHS-CS). Beginning in 2002, 195 of the CHS-CS participants received neuropsychological assessments and 3MSE at baseline. The subjects were classified as NC, MCI, or AD based on cognitive status adjudications [18]. The CHS-CS diagnostic criteria for MCI includes both MCI-amnestic type and MCI-multiple cognitive domain type [18]. Participants also received structural and perfusion MRIs at baseline. The 3MSE scores [19] were used to assess general cognitive ability for the population. The 3MSE adds four additional questions (date and place of birth, word fluency, similarities, and delayed recall of words) to the earlier Mini-Mental State Examination (MMSE), provides additional scoring guidelines, and increases the range of item scores to produce a maximum total score of 100 points. It has been shown that 3MSE scores have increased sensitivity in detecting dementia in comparison to the MMSE [20, 21]. Inclusion and adjudication criteria for the CHS-CS subjects were previously published [22]. Forty-seven participants were excluded from analysis because of the following reasons: six subjects with evidence of structural central nervous system lesions (e.g., brain infarcts, central nervous system neoplasms, prior brain surgery) or history of strokes or head trauma encephalopathy (two in the NC group, one in the MCI group, three in the AD group), twelve subjects with incomplete scans due to scan failure and subjects requesting to exit early (two in the NC group, four in the MCI group, six in the AD group), six subjects with excessive structural MRI artifacts caused by patient motion (two in the NC group, four in AD group), twelve subjects with CBF quantification issues due to not scanned phase contrast (PC) Cine or misplaced PC Cine or missing ASL image files (five in the NC group, four in the MCI group, three in the AD group), ten subjects with improper placement of the ASL MR imaging labeling plane in a position that was not orthogonal to both carotid arteries (five in the MCI group, five in the AD group), one subject with a greater than 20% difference between left and right carotid arterial mean velocities (one in the AD group). Based on the exclusion criteria, 148 of the 195 subjects were included in the baseline cross-sectional study, including 58 NC subjects (31 females, 83.4±3.7 years), 50 MCI patients (32 females, 84.5±3.6 years), and 40 AD patients (28 females, 84.1±3.5 years).
MRI acquisition
All studies were conducted at the University of Pittsburgh MR Research Center using a dedicated GE Signa 1.5 T MRI (LX Version). All subjects or their caregivers signed written informed consent approved by the institutional review board (IRB). A quadrature transceiver head coil was used for image acquisition. High-resolution sagittal structural images were acquired using 3D T1-weighted spoiled gradient recalled echo (SPGR) images. CBF MRI was labeled using a multi-slice continuous arterial spin labeling (CASL) sequence with double adiabatic inversion [22–24]. The CASL label and control planes were prescribed based on a coronal phase contrast MR angiogram (MRA) of the carotid and vertebral arteries. The labeling plane was set at least 1 cm above the common carotid bifurcation, which is about 10 cm below the center of the perfusion imaging volume. The CASL labeling duration was 3.7 s and the post-labeling delay was 0.7 s. Nineteen 5 mm slices were acquired using axial echo planar imaging (EPI) (TR: 5.4 s, TE: min full) sequentially from superior to inferior to avoid radiofrequency perturbation of the endogenous tracer as it moves superiorly into the brain and to minimize signal intensity discontinuities associated with interleaved acquisitions. Fifty label and control pairs were acquired to allow signal averaging. Arterial velocities at the labeling plane were measured using peripheral-gated axial PC cine velocimetry MRI. B1 was measured at the labeling plane using a multiple flip angle EPI acquisition. The detailed pulse sequence parameters can be found in [22–24].
Pre-processing
The CASL labeled images and control images were motion corrected by realignment of SPM8 (Wellcome Trust Centre for Neuroimaging). CASL difference images were generated by subtracting the motion-corrected labeled images from control images. The CBF maps were generated from the difference images using the CASL kinetic model [22, 25]. A T1 of 1.2 s was used for gray matter based on our in vivo measurements (1.17±0.01 s at 1.5 T) and consistent with the literature [26]. The inversion efficiency was calculated for each subject using the arterial velocities and B1 measured at the label plane [24].
High-resolution T1-weighted MRIs were segmented into gray matter, white matter, and cerebrospinal fluid. Next, the CASL images were registered and normalized using SPM8 from their original space to a standard space using the T1 gray matter images as an intermediate. The registration parameters were used to transform the subject CBF maps into the standard Montreal Neurological Institute (MNI) space. The a priori GM template from the SPM8 software package was used. We chose the high-resolution gray matter images as the intermediate to ensure optimal realignment. The images were further smoothed with a 6×6×6 mm Gaussian kernel.
CBF maps can differ between groups either because brain tissue volumes or the CBF per volume of tissue vary. Brain tissue loss (atrophy) was reported in AD using structural neuroimaging (for a review, see [27]). We calculated the PVE-corrected (or atrophy-corrected) CBF maps to separate the CBF changes independent of brain tissue atrophy. The PVE-corrected CBF map was calculated by dividing the CBF map by the voxel-wise gray matter fraction map in the ASL data space, which was derived by registering the segmented gray matter map in the T1 data space to the mean of the CBF difference images for each subject. The PVE correction assumes that the white matter does not contribute to the CBF signal of the voxel at 1.5 T. Both the CBF maps and PVE-corrected CBF maps were analyzed separately in the following statistical analysis.
Statistical analysis
The entire brain was not included in the statistical analysis due to the variation of the brain volume coverage between individual subject CBF maps. Global CBF for each subject was calculated as the mean gray matter CBF in the covered brain volume. Global CBF values from all the subjects were compared using the general linear model (GLM) with group index (NC/MCI/AD) as the independent variable, and age and gender as confounding variables. Only the gray matter voxels that had CBF data from >1/2 of participants in each group were analyzed. For the gray matter voxels, a multiple linear regression was performed to examine the CBF differences on a voxel-by-voxel basis between NC, MCI, and AD groups. In the GLM, voxel-wise CBF was considered as the dependent variable. The group index (NC/MCI/AD) was considered as the independent variable. Age and gender were included as confounding variables. Individual degrees of freedom for the analyzed voxels instead of a uniform value were used to generate the accurate p-value maps for each contrast, including CBFNC > CBFMCI, CBFNC < CBFMCI, CBFMCI > CBFAD, CBFMCI< CBFAD, CBFNC > CBFAD, and CBFAD > CBFNC. The voxel-level significance threshold was set to p < 0.01. In order to guard against any false positive findings from the multiple comparisons, cluster-level p values were calculated by calling the SPM8 subroutine with the average degree of freedom in each cluster as its degree parameter. Only the clusters with a cluster-level p-value threshold of 0.05 were reported.
The automatic anatomical labeling (AAL) atlas, showing anatomical parcellation of the standard MNI brain, was used to label the anatomical locations of each cluster [28]. Two percentage measures were calculated for each cluster. Percentage of cluster (% Cluster) was calculated as the ratio of the number of voxels in the common region of each cluster and the defined anatomical region to the number of voxels in each cluster, indicating the percentage of each cluster that falls within the defined anatomical region. Percentage of region (% Region) was calculated as the ratio of the number of voxels in the common region to the number of voxels in each defined anatomical region, indicating the percentage of each defined anatomical region that falls within the cluster.
Post hoc regional analyses were performed to determine whether the AD-affected regions detected in the voxel-level analysis had better sensitivity in group differences. For each subject, the absolute CBF and normalized CBF (nCBF) in each region was calculated. The absolute CBF for each region was calculated as the mean CBF over all the voxels within the region. The nCBF for each region was calculated as the ratio of the absolute CBF to the global CBF. The global CBF was calculated as the mean of voxel CBF values over the entire brain mask. Normalization by global CBF (for the calculation of nCBF) was used because it was reported to be more sensitive in detecting CBF abnormalities in early AD compared to normalization by cerebellum or white matter [29]. nCBF can remove the individual global CBF differences and transient factors that affect global CBF. Because of incomplete coverage, the number of voxels in each ROI may vary between individuals in calculation of mean regional CBF values. The regional CBF value was removed from further analysis if the number of voxels in the ROI was less than 10. These per-subject mean regional CBF values were the dependent variables in subsequent multiple linear regression models. Age and gender were first considered as covariates in the regional analysis. In addition, we adjusted additional confounders, including education in years and cardiovascular risk factors (hypertension, diabetes, and the presence of heart disease).The cardiovascular risk factors were adjusted because the factors were demonstrated to affect CBF and so could potentially bias the group comparison results. For instance, we have shown hypertension and diabetes can affect CBF [30, 31]. Family-wise error (FWE) corrections were performed to guard against false positives from the multiple comparisons [32] by following the procedures: (a) order the p values from the lowest to highest p1, p2, ... , p m , where m is the total number of hypotheses tested (m = 12 regions); (b) for a given α = 0.05, seek the largest k such as p k ≤ α/(m - k + 1) ; and (c) p1, ... , p k were the significant p values after FWE correction.
A post-hoc correlation analysis was performed to investigate the relationship between CBF in the brain regions affected by MCI/AD and the baseline cognitive status across all the subjects. Both absolute CBF and nCBF values in the brain regions were analyzed. The partial correlation coefficients between the regional CBF values and the 3MSE scores were examined by multiple linear regression models with age and gender as covariates. We also adjusted additional risk factors (education levels and cardiovascular risk factors) for association of the regional CBF values with the 3MSE scores by adding the additional risk factors as covariates. The association across all the subjects may be driven by the higher 3MSE scores in the NCs and lower 3MSE scores in the ADs. To explore the capability of regional CBF in characterizing the cognitive performance of symptomatic subjects, the association was analyzed for the symptomatic subjects (the MCI and AD subjects only).
RESULTS
Table 1 summarizes the subjects’ demographic information and 3MSE scores at the baseline. No significant differences between age, gender, and education were found between the NC, MCI, and AD groups. Subjects with AD had significantly lower 3MSE scores than MCI and NC subjects. The voxel-level map produced by our customized general linear model (Fig. 1A) had much greater brain coverage than the map produced using the general linear model from the conventional neuroimaging toolboxes (e.g., SPM) (Fig. 1B). In fact, almost all of the gray matter voxels were analyzed using our customized model.
Demographic and cognitive scores at baseline
†3MSE scores, hypertension, and heart disease cases were not completed for all of the subjects. The actual number of subjects with the valid records is indicated inside the brackets. For the correlation of regional CBF values with 3MSE, only the subjects with 3MSE scores were used in the analysis.
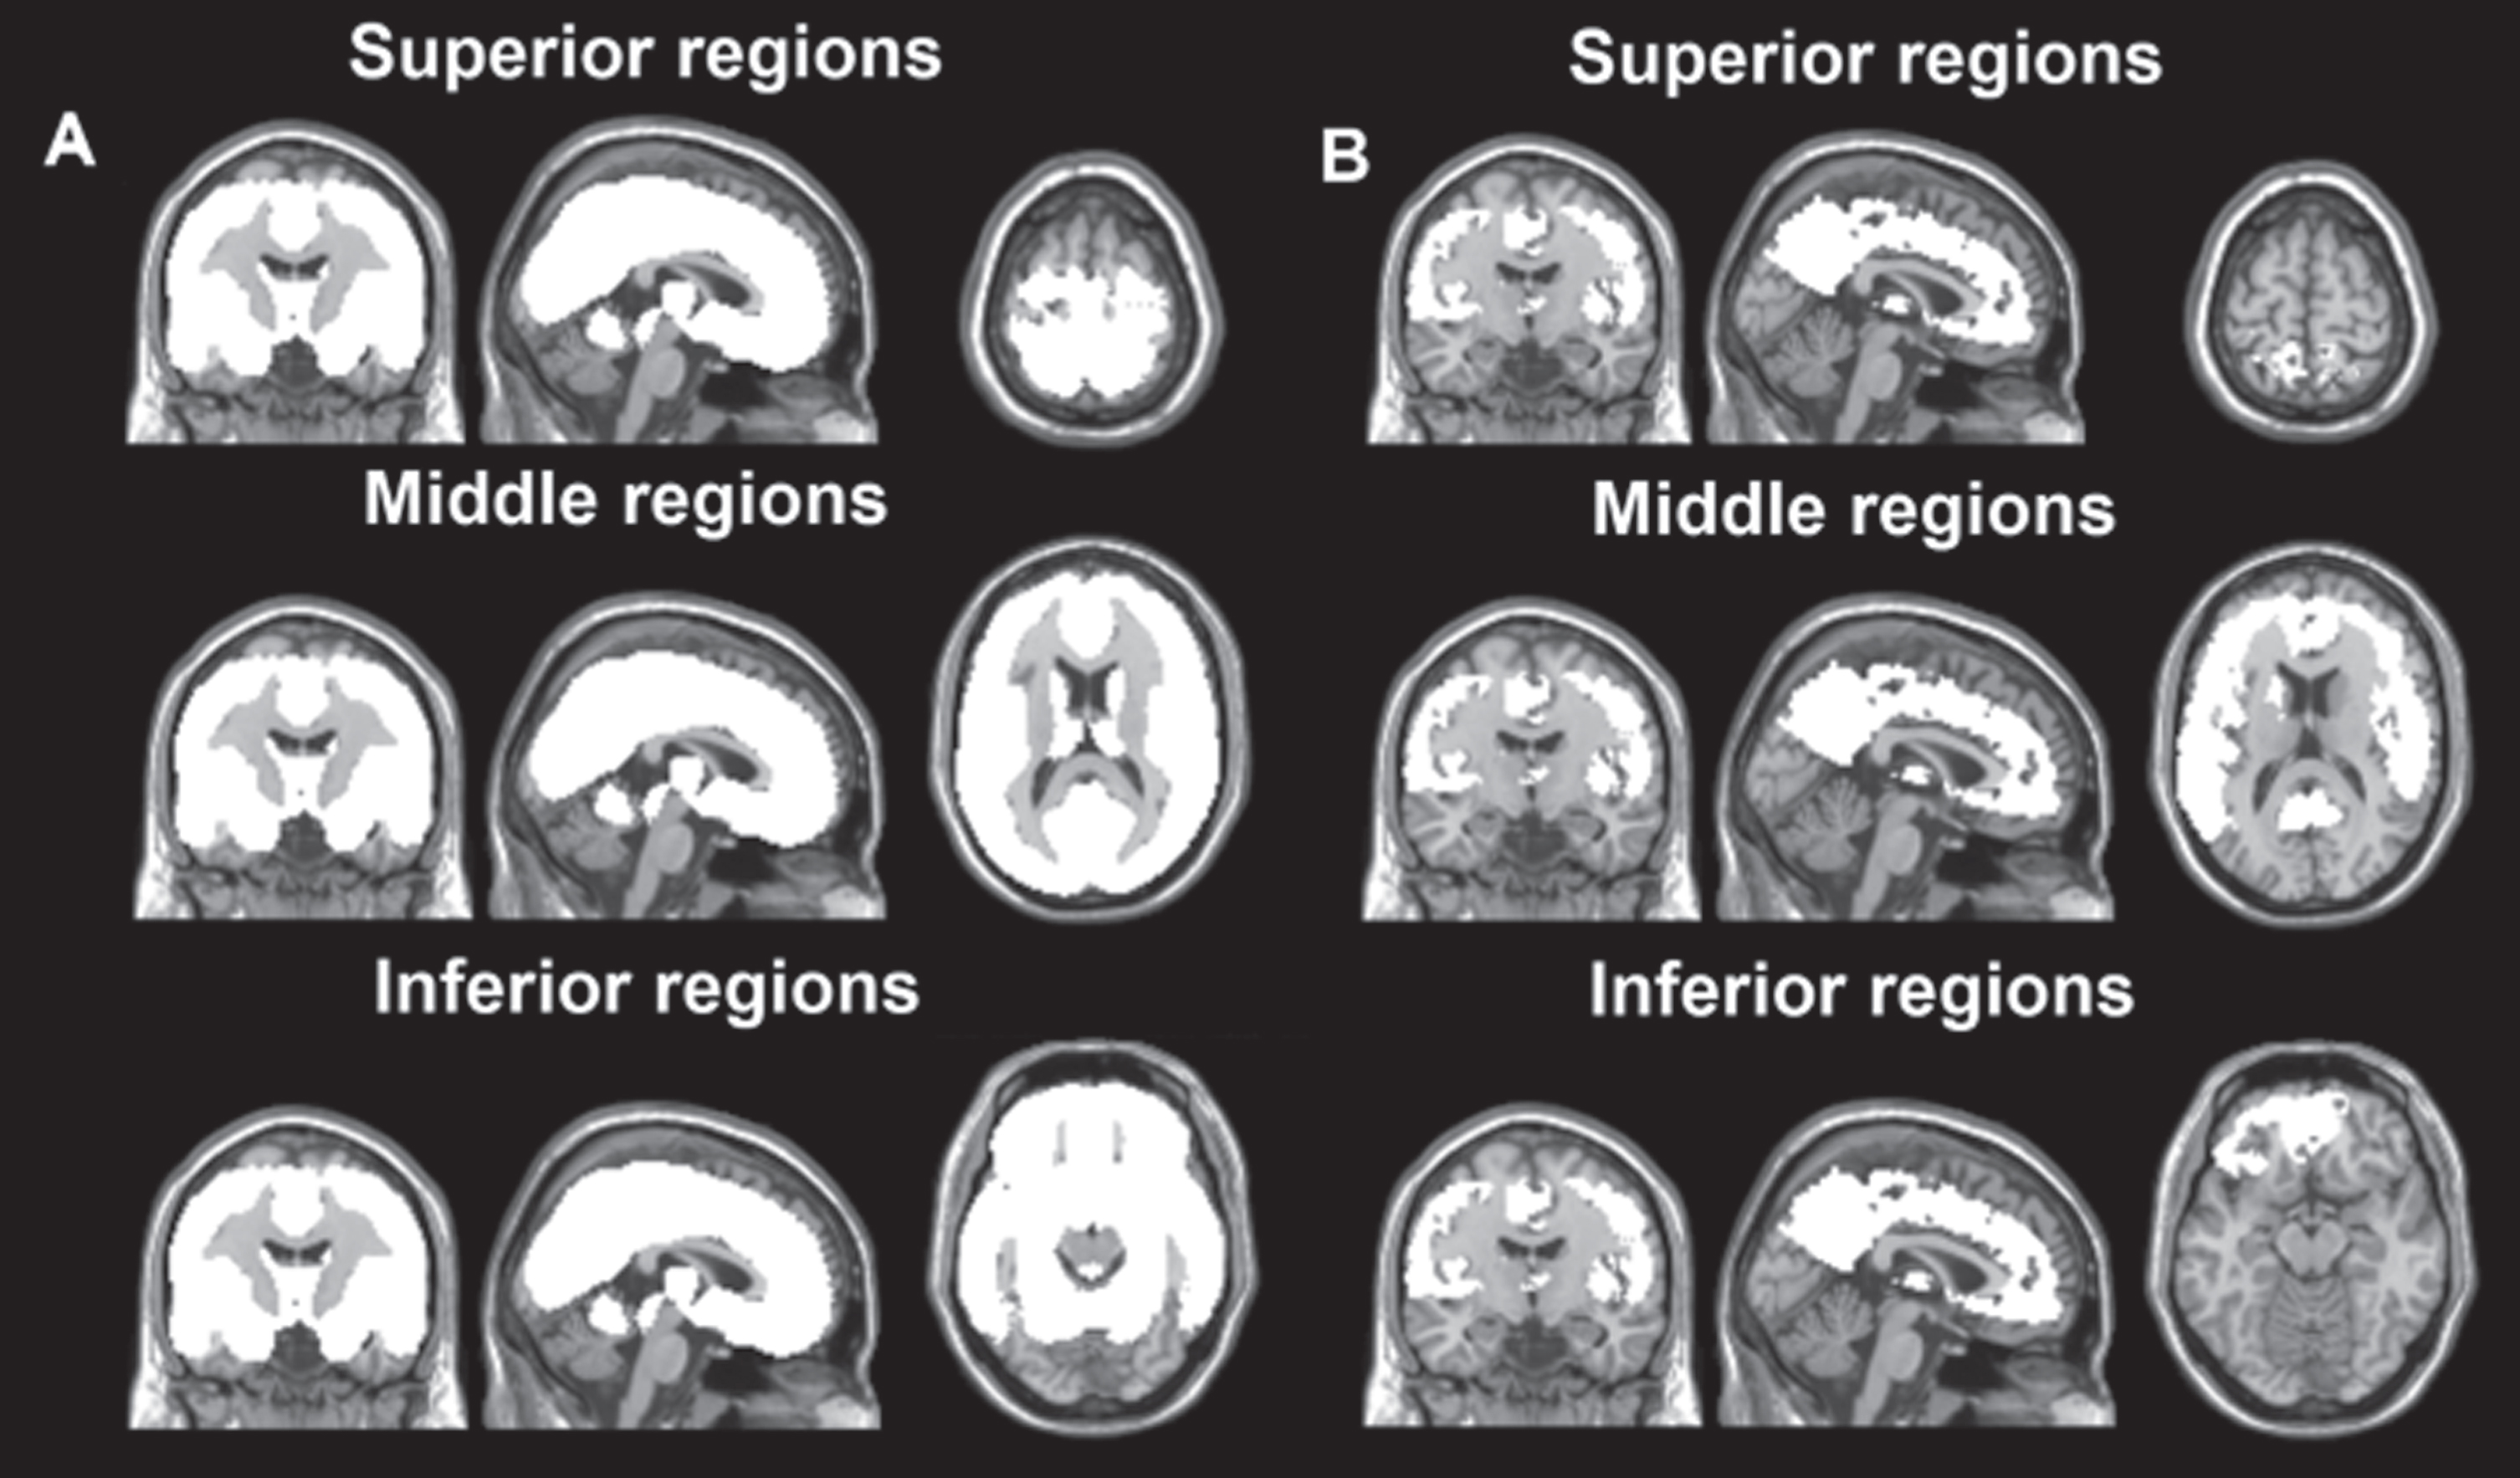
The white-color regions overlaid on the anatomical brain with the three orthogonal views from the superior, middle and inferior brain regions. The voxel-level maps analyzed by our customized general linear model (left side, in A) had more coverage than the conventional neuroimaging toolboxes (e.g., SPM, right side, in B).
Comparison of global CBF at baseline
The AD subjects had decreased global CBF (37.21±3.98 ml/100 g·min) as compared to MCI subjects (39.66±5.49 ml/100 g·min), after adjusting for age and gender (p = 0.012). No global CBF difference was observed between NC and MCI (NC: 38.41±5.15 ml/100 g·min, p = 0.17) and between NC and AD (p = 0.20). Greater global CBF was associated with female subjects (p = 0.049), but only marginally associated with younger age (p = 0.060). The AD subjects exhibited decreased global CBF as compared to MCI subjects, even before adjusting for age and gender (p = 0.022).
Comparison of CBF maps at baseline
The AD subjects had decreased CBF compared to NCs (Fig. 2) in the posterior cingulate extending to the precuneus (cluster 1), the right inferior parietal area (cluster 2), the left and right superior medial frontal area (clusters 3 and 4), the left inferior frontal and insular area (cluster 5), and the left hippocampus area (cluster 6). The MCI subjects had significantly increased CBF compared to the NC group (Fig. 3) in the right temporoparietal area (cluster 7) and the right hippocampus area (cluster 8). The AD subjects had significantly decreased CBF (Fig. 4) compared to the MCI group in the bilateral posterior and middle cingulate and parietal regions (cluster 9), the bilateral superior medial frontal area (cluster 10), the left and right temporoparietal area (clusters 11 and 12), the left and right inferior frontal and insular area (clusters 13 and 14), and the left and right hippocampus area (clusters 15 and 16). PVE-corrected CBF maps exhibited less pronounced but similar patterns in group comparisons of NC, MCI, and AD groups.
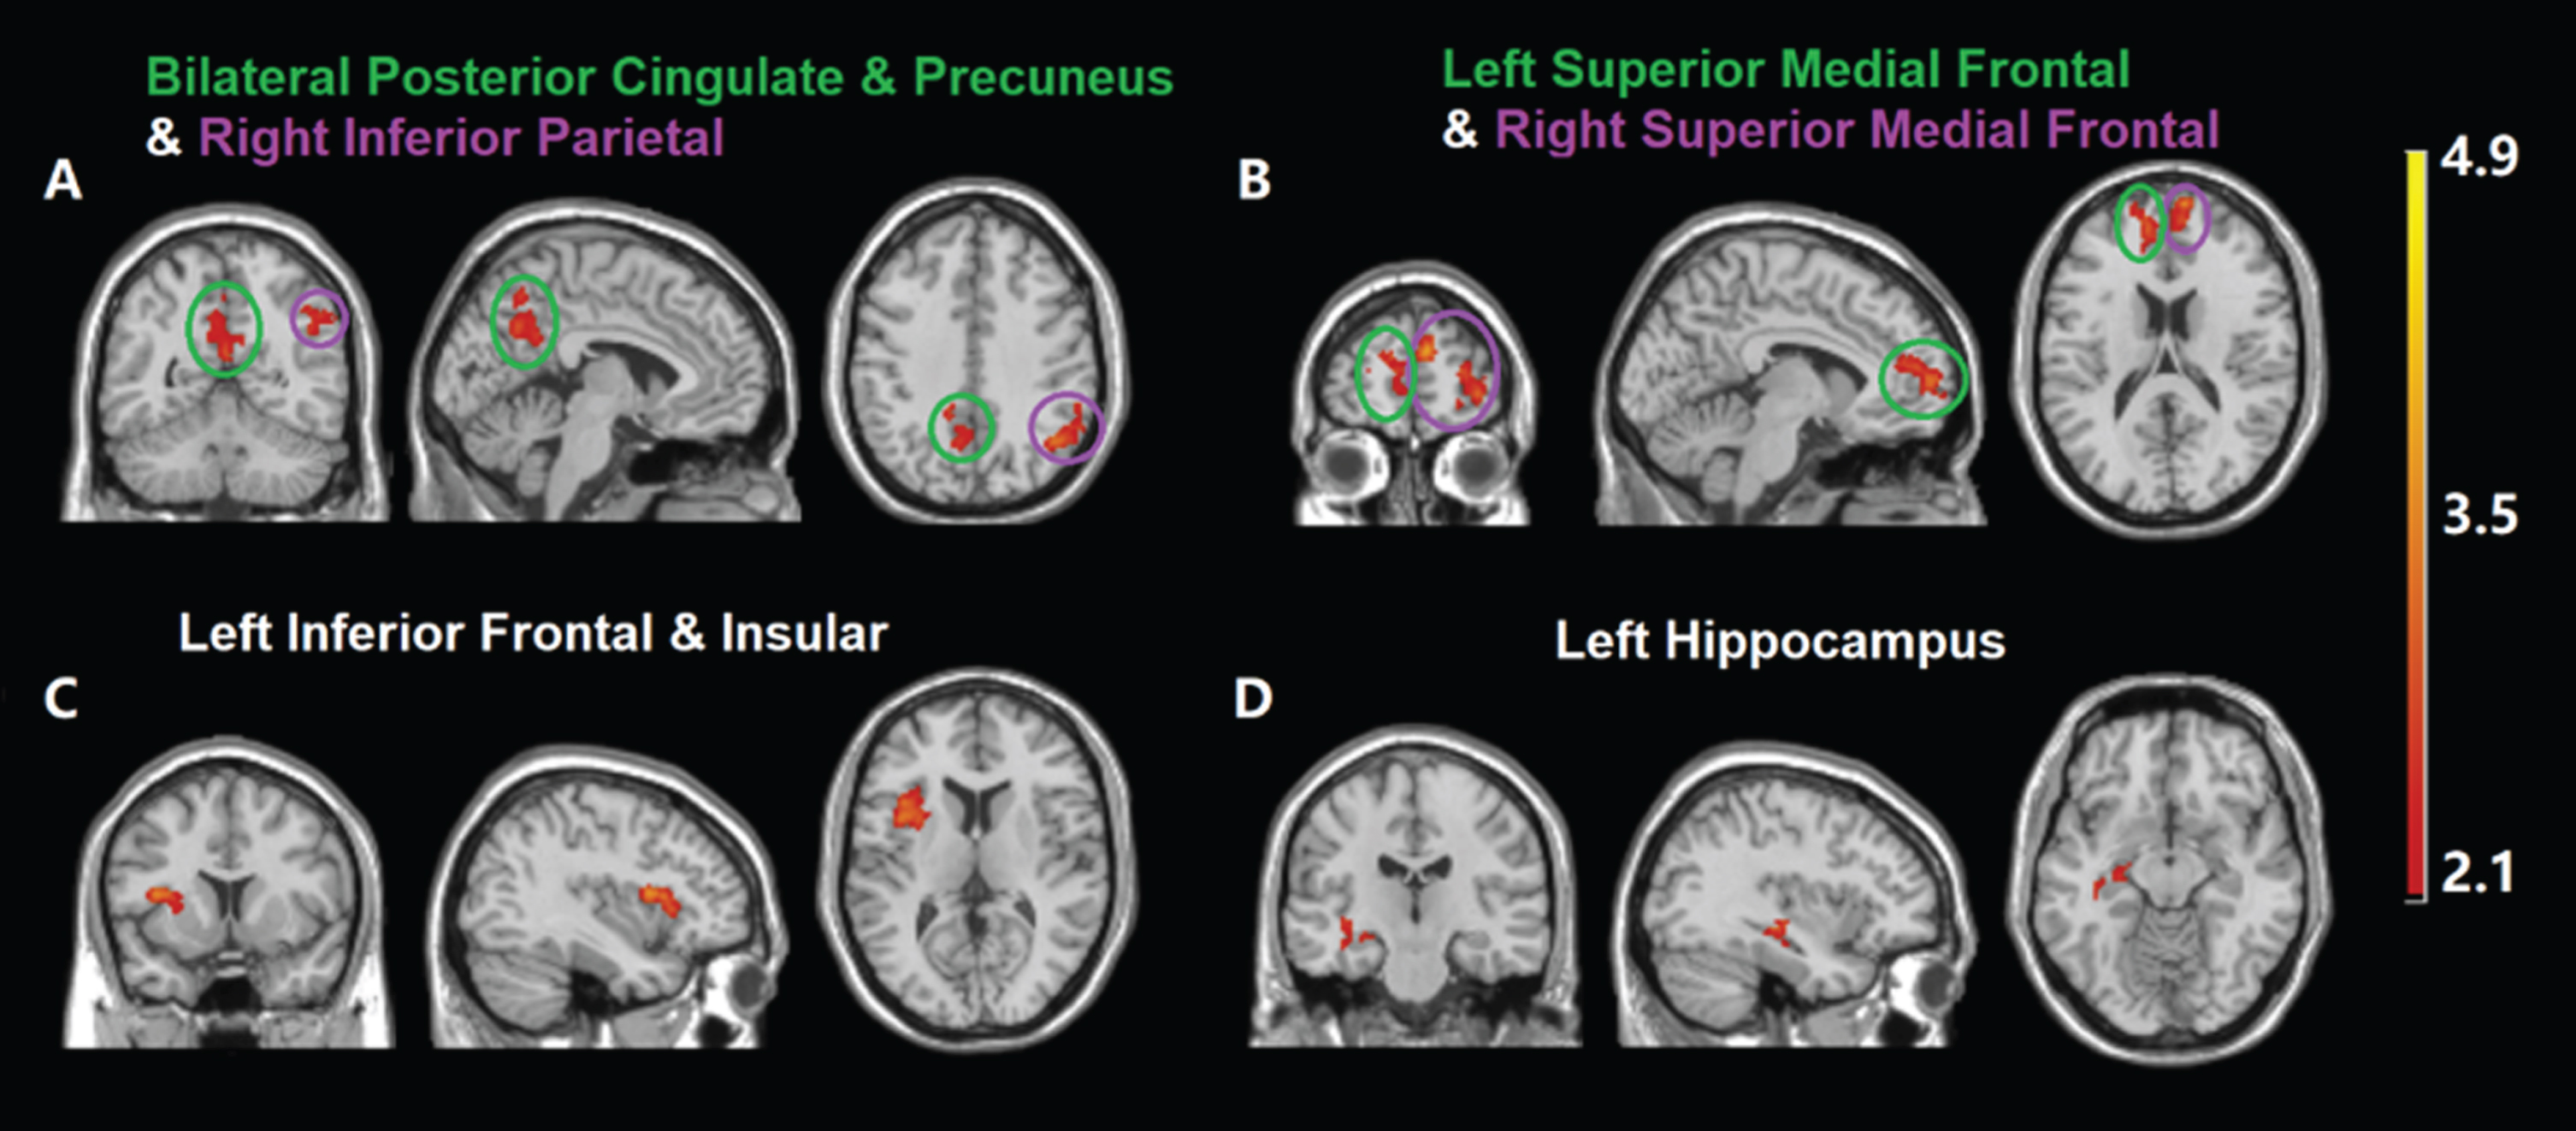
Compared with the NC group, the AD group had significant CBF decreases in six clusters after adjusting for age and gender effect: (A) bilateral posterior cingulate & precuneus regions (cluster 1 inside green circle) and right inferior parietal region (cluster 2 inside purple circle); (B) left and right superior medial frontal regions (cluster 3 inside green circle and cluster 4 inside purple circle, respectively); (C) left inferior frontal and insular regions (cluster 5); and (D) left hippocampus region (cluster 6).
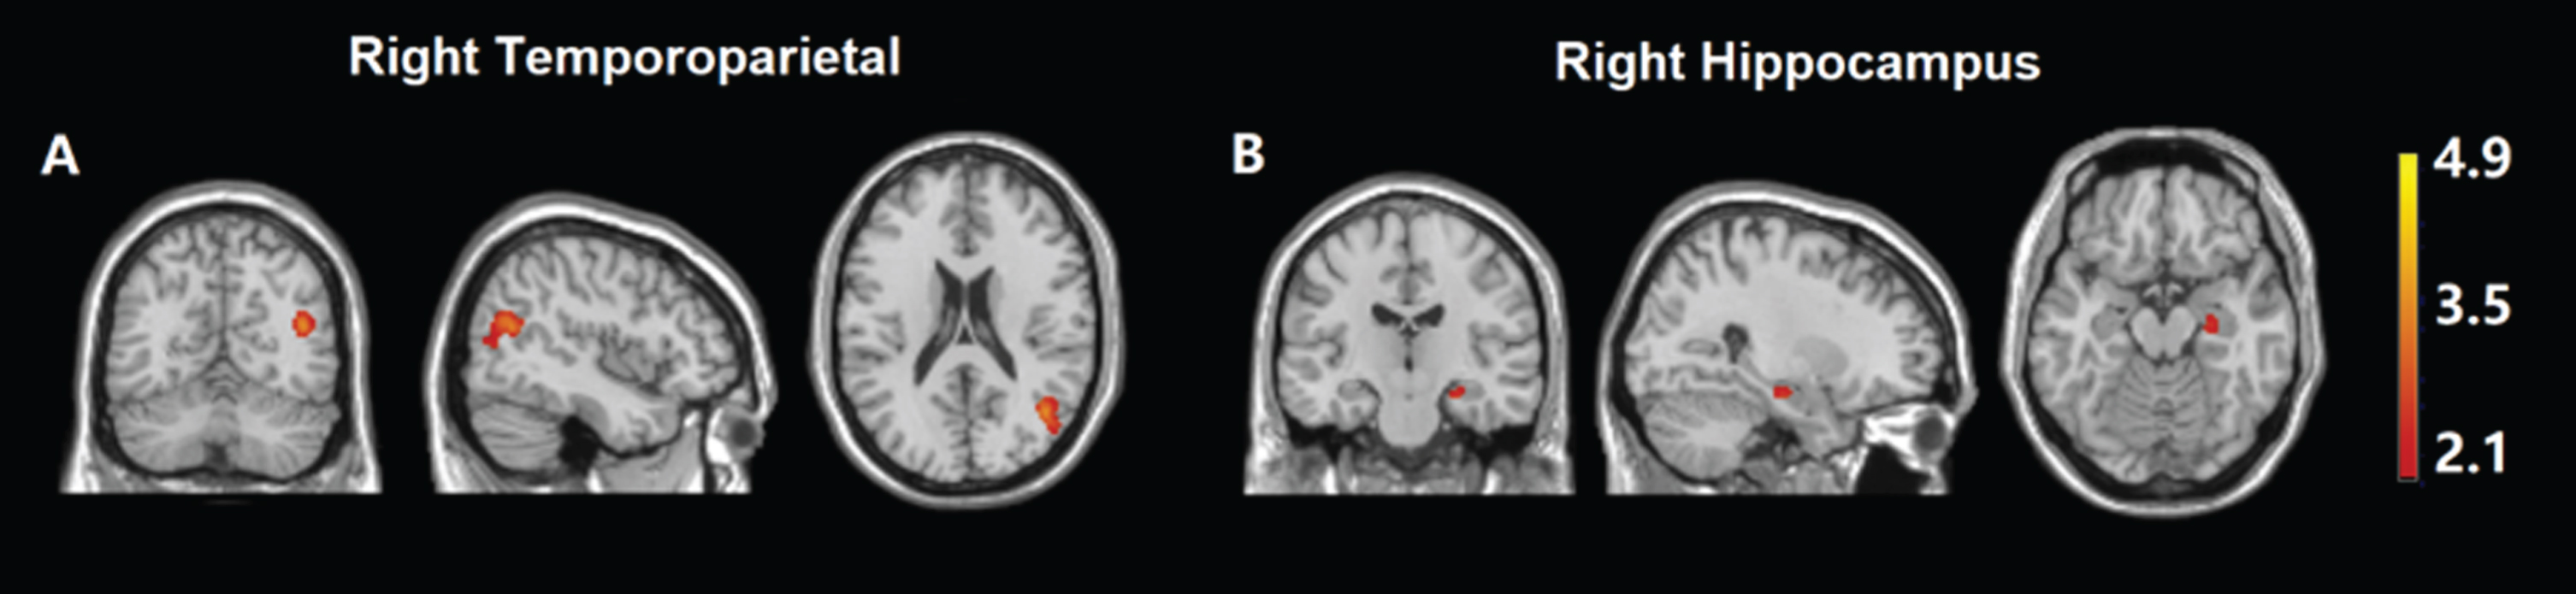
Compared with the NC group, MCI patients experienced significantly increased CBF in two clusters after adjusting for age and gender effect: (A) right temporoparietal region (cluster 7); and (B) right hippocampus region (cluster 8).
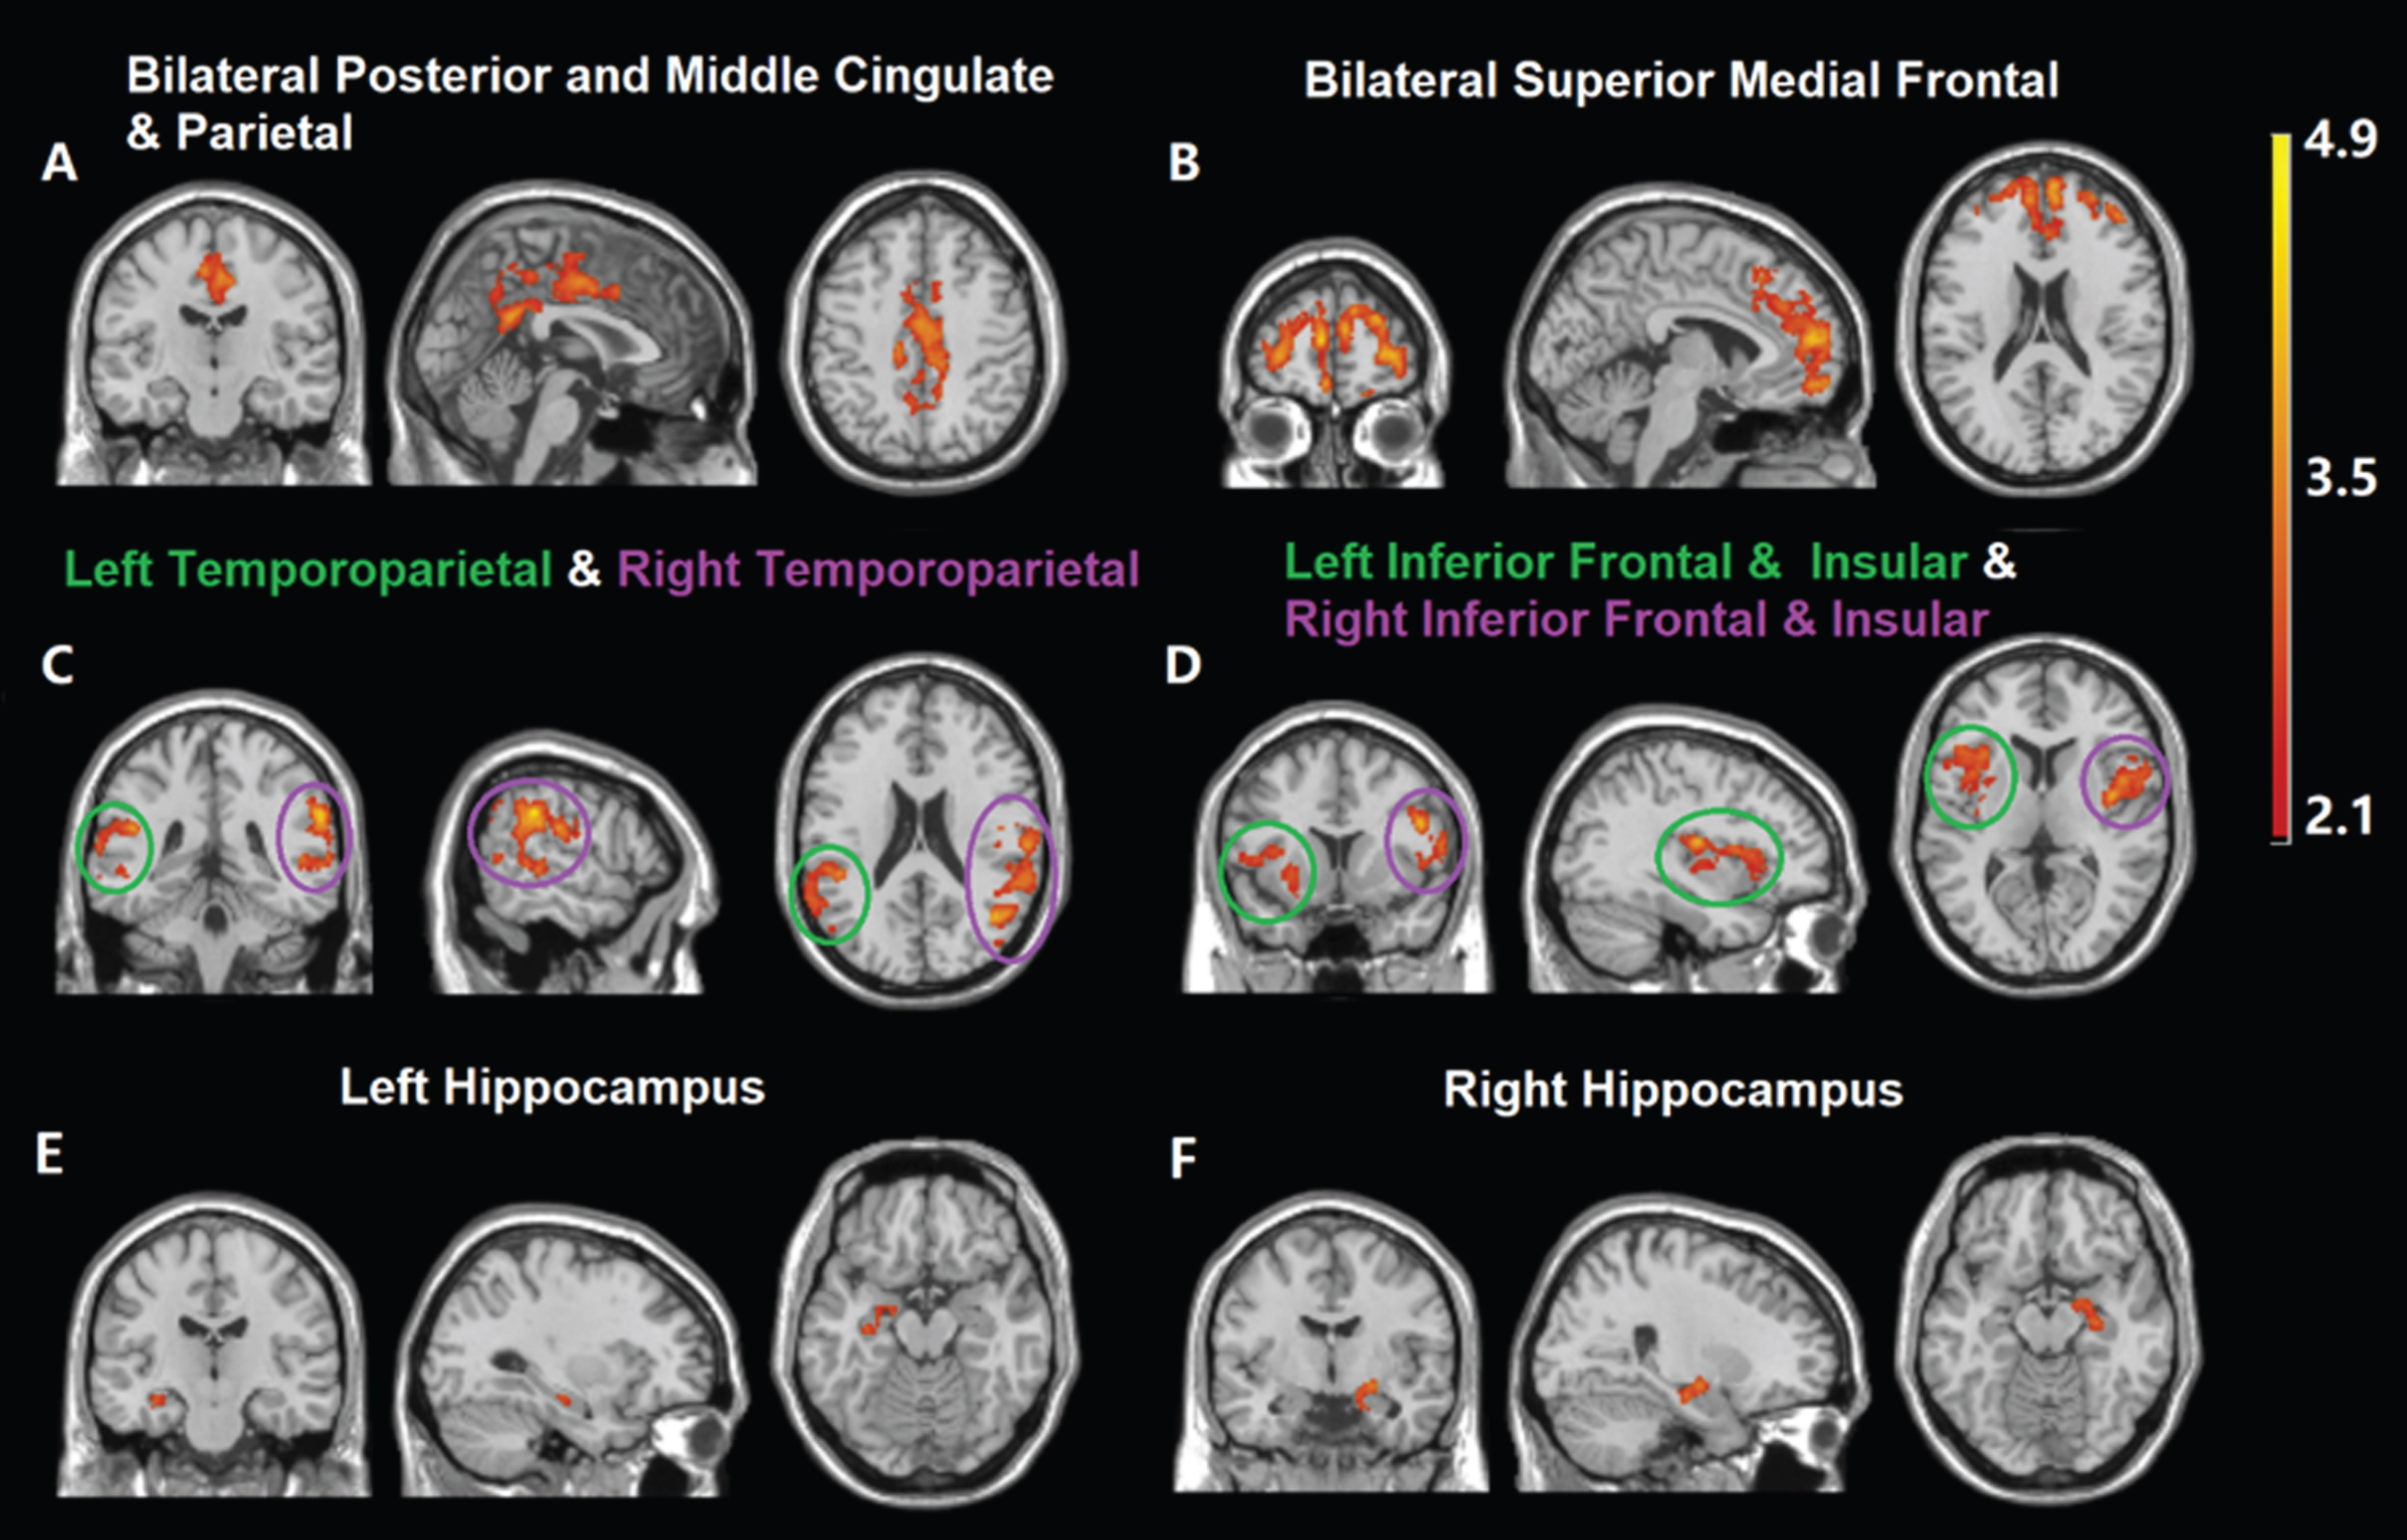
Compared to the MCI group, the AD group had significantly decreased CBF in eight clusters after adjusting for age and gender: (A) bilateral posterior and middle cingulate and parietal regions (cluster 9); (B) bilateral superior medial frontal regions (cluster 10); (C) left and right temporoparietal regions (cluster 11 inside green circle and cluster 12 inside purple circle, respectively); (D) left and right inferior frontal and insular regions (cluster 13 inside green circle and cluster 14 inside purple circle, respectively); (E) left hippocampus region (cluster 15); (F) right hippocampus region (cluster 16).
Cluster statistics are shown in Table 2. Due to the overlapped regions (NC > AD, MCI > NC, and MCI > AD) detected from the cross-sectional voxel-based analysis, we chose to concentrate on the region with the largest number of significant voxels for further regional analysis at similar anatomical locations. For instance, both cluster 7 and cluster 12 were located in the right temporoparietal area, and cluster 12 had a larger number of voxels than cluster 7. Therefore, we chose only cluster 12 for further analysis. Specifically, the regional CBF values at the following 12 regions of interests (ROIs) were calculated for further post-hoc analysis: right hippocampus (RH, cluster 16 above), left hippocampus (LH, cluster 6 above), right superior medial frontal (RSMF, cluster 4 above), left superior medial frontal (LSMF, cluster 3 above), bilateral superior medial frontal (BSMF, cluster 10 above), right temporoparietal (RTP, cluster 12 above), left temporoparietal (LTP, cluster 11 above), right inferior frontal and insular (RIFI, cluster 14 above), left inferior frontal and insular (LIFI, cluster 13 above), right inferior parietal (RIP, cluster 2 above), bilateral posterior cingulate extending to precuneus (BPCP, cluster 1 above), and bilateral posterior and middle cingulate and parietal regions (BPMP, cluster 9 above).
Clusters with significantly decreased CBF in the AD group relative to the NC and MCI groups (clusters 1–6 and 9–16); and significantly increased CBF in the MCI group relative to the NC group (clusters 7–8)
Comparison of the number of gray matter voxels at each ROI
Less than half coverage of the ROIs was observed in five subjects: one MCI subject with 1013 out of 2184 voxels in the RTP region; one AD subject with 44 out of 98 voxels in the LH region; one NC subject with 29 voxels and one MCI subject with 78 voxels out of 196 voxels in the RH region; and one MCI subject with the scan not covering both LH and RH. After excluding the subjects with less than half coverage for each ROI, the numbers of gray matter voxels were listed for each diagnostic group (see Supplementary Table 1). Compared to the NC/MCI group, the AD group exhibited markedly larger variance (at least 25% increase of standard deviation) in the number of voxels in the LSMF and LIFI regions. Significantly different numbers of voxels were observed in the BPCP and LSMF regions among the three groups (see p values in the F tests). These results suggest significant gray matter loss in these regions in AD, assuming negligible registration errors. The results also support the dynamically spreading wave of gray matter loss from medial temporal/limbic to frontal regions [33].
Comparison of regional CBF values at baseline
For mean regional CBF values in the LH and RH regions, one subject was excluded because these regions were not scanned in the subject. For mean regional CBF values in the other regions, all the subjects were included in the regional analysis. For absolute regional CBF values without and with the PVE correction, we observed CBF differences between the NC, MCI, and AD groups consistent with the voxel-level analysis. For the regional nCBF, we found some additionally significant differences besides those observed in the voxel-level analysis due to the increased signal-to-noise ratio (SNR). After normalizing the regional CBF values, additional significance between the NC, MCI, and AD groups offers a more complete view of the CBF changes during different clinical stages (Fig. 5). The increased sensitivity in nCBF because of normalization by global CBF suggests that the global CBF included some factors unrelated to AD pathology and the unrelated factors may be better removed by global normalization. We observed (1) the generally decreased CBF values in the LH, RIP, and BPCP regions from NCs to ADs and (2) increased CBF from NCs to MCIs and decreased CBF from MCIs to ADs in the BPMP, LTP, RTP, BSMF, and RIFI regions (regional nCBF without PVE correction, Fig. 5A). When the CBF maps were corrected for PVE, the changes of nCBF in the RIP, LTP, RTP, and RIFI regions had disappeared in some of the group comparisons (regional nCBF with PVE correction, Fig. 5B). This indicates that the atrophy contributes more to CBF changes in the regions. The atrophy in parietal, temporoparietal, and frontal regions is consistent with the significant lower brain volume across the whole brain in MCI and AD subjects from a multisite CHS structural imaging study with a much larger number of participants [34]. Additional corrections for risk factors (education levels, hypertension, diabetes, and the presence of heart disease) did not change the group differences except the difference in the RIFI region between ADs and NCs lost significance (Fig. 5C).
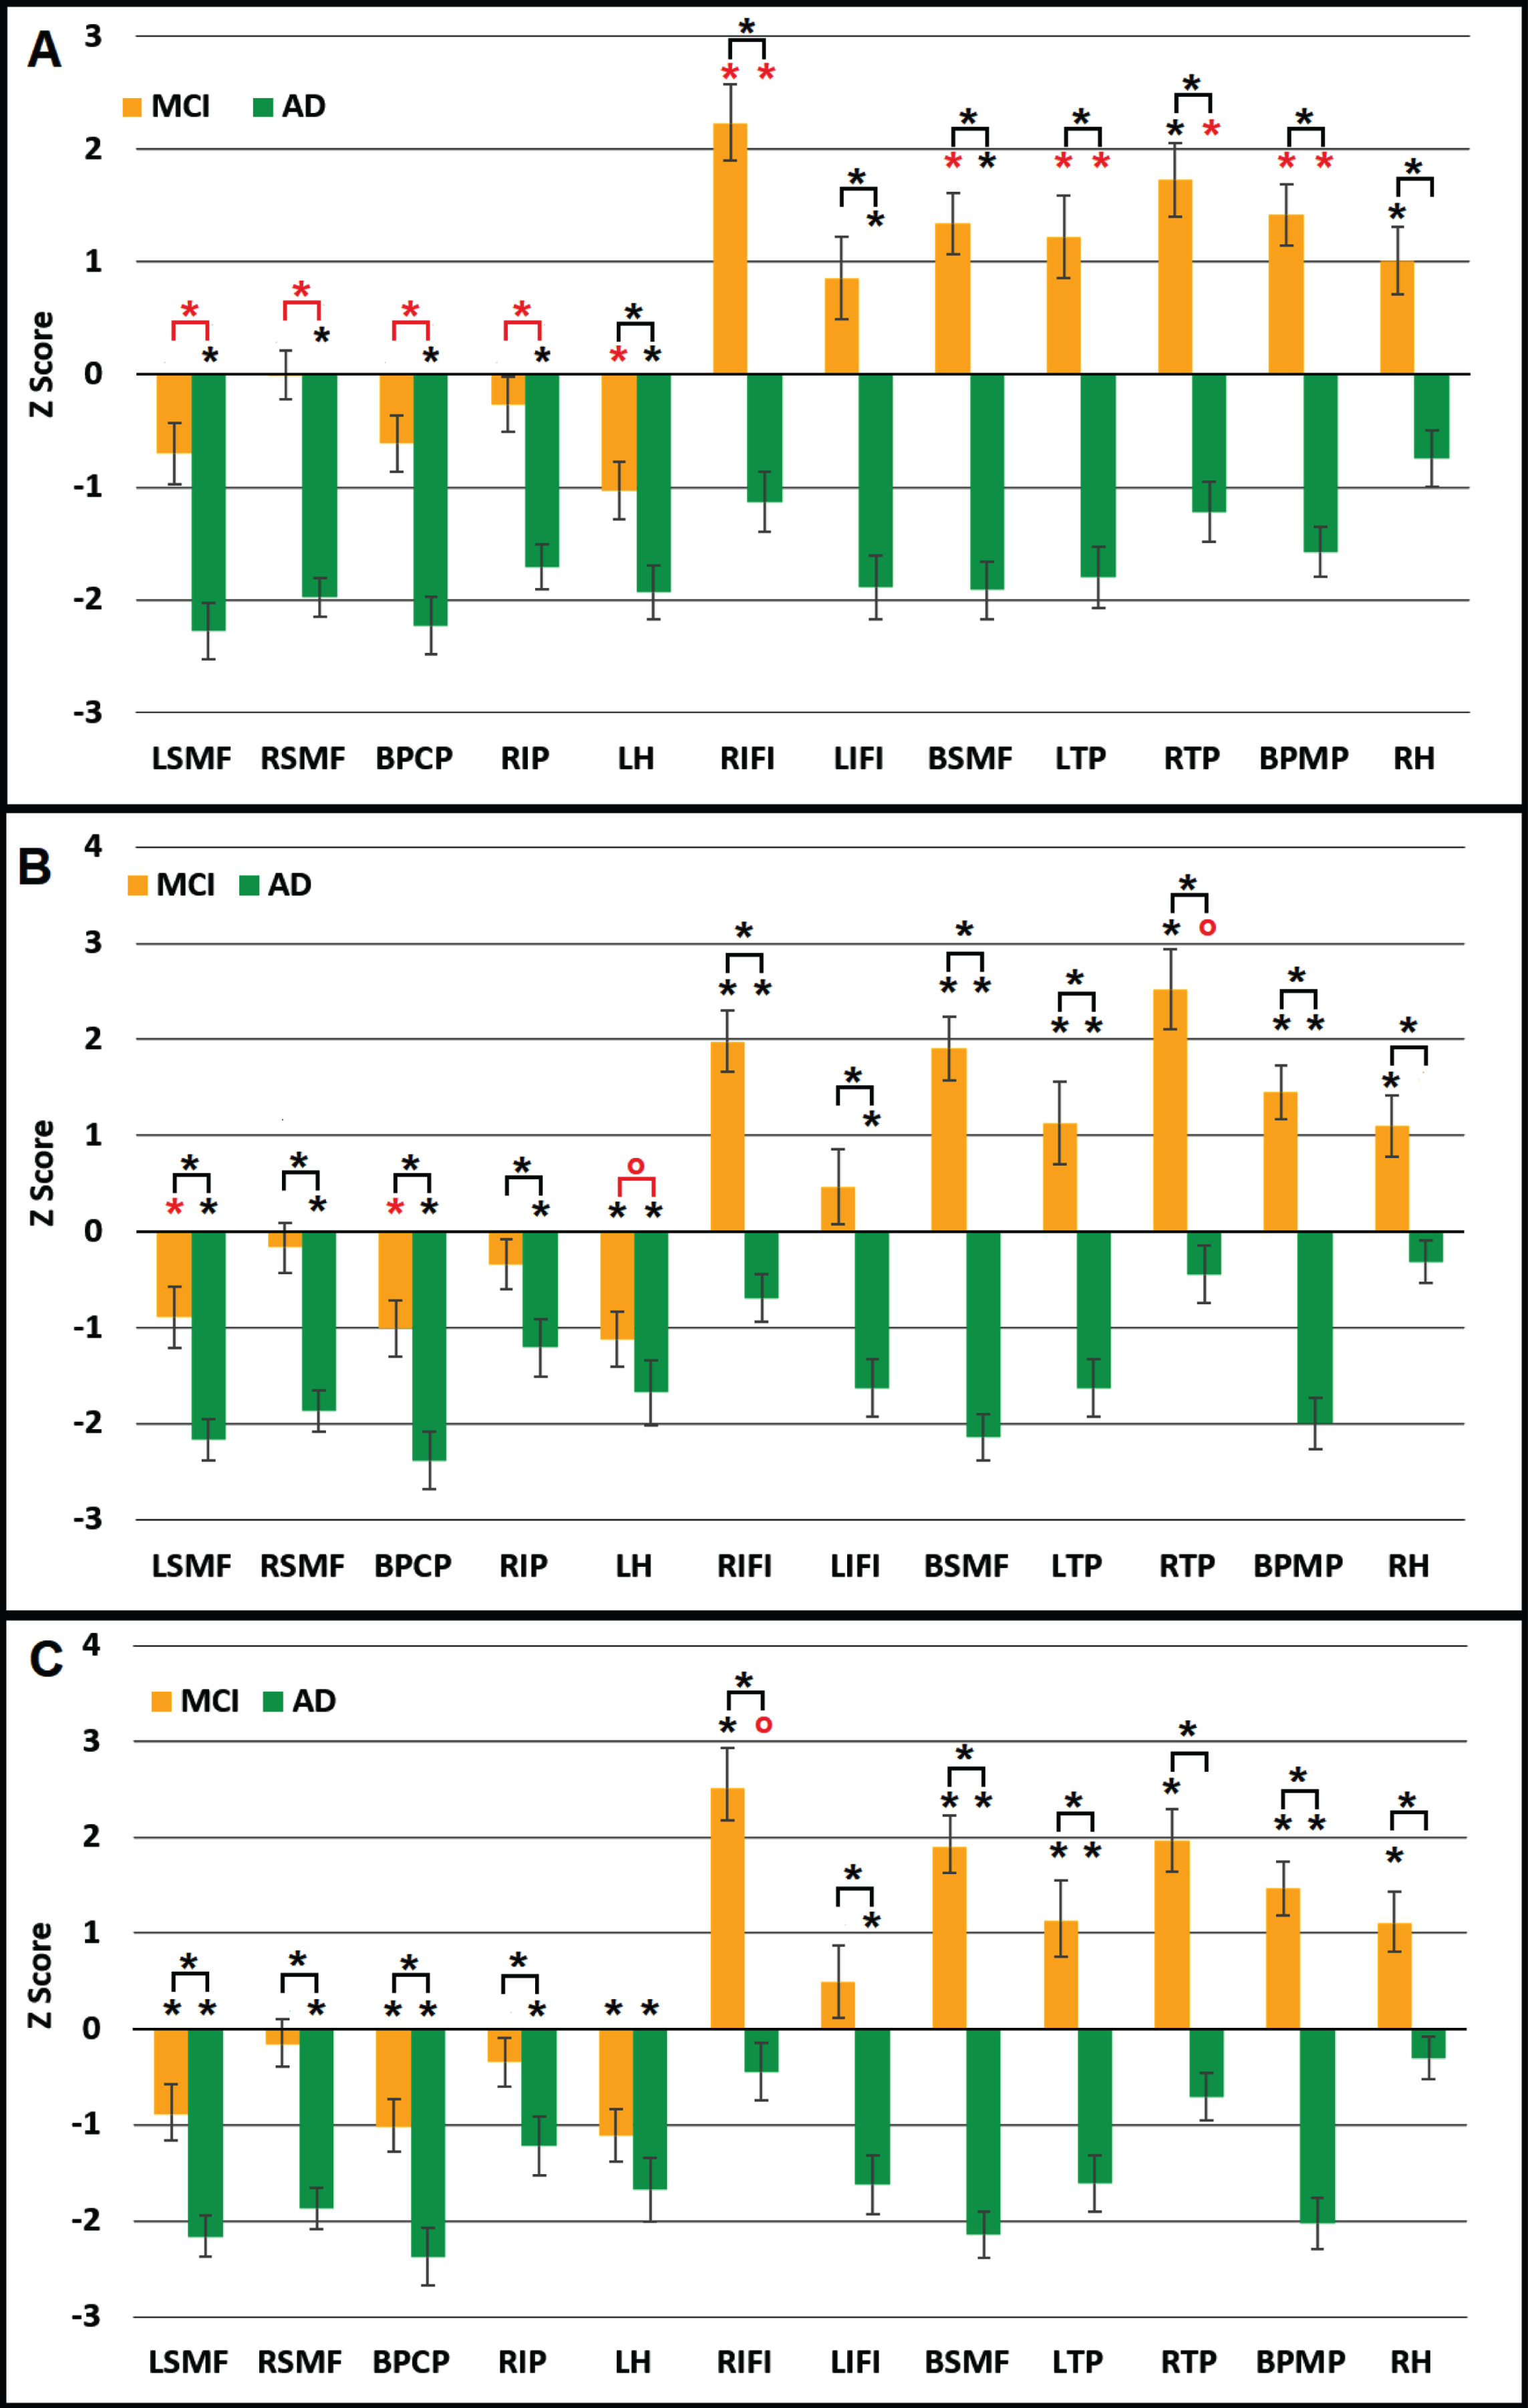
Regional CBF z scores in patients with MCI and AD subjects relative to control subjects: (A) without PVE correction; (B) with PVE correction; (C) with the correction of PVE, education, hypertension, diabetes and the presence of heart disease. Regional CBF is normalized to global CBF. * marks the p values significant after FWE correction. * on top of the bar stands for significance when comparing with NC group. Red star (*) in (A) stands for the additional changes observed compared to the voxel-level analysis; Red star (*) and red circle (o) in (B) respectively stand for the additional changes and disappeared changes observed compared to those without PVE correction (A); Red circle (o) in (C) stands for the lack of significance compared to those without the correction of four risk factors. RH, right hippocampus; LH, left hippocampus; RIP, right inferior parietal; BPCP, bilateral posterior cingulate and precuneus; RIFI, right inferior frontal and insular; LIFI, left inferior frontal and insular; RSMF, right superior medial frontal; LSMF, left superior medial frontal; BSMF, bilateral superior medial frontal; LTP, left temporoparietal; BPMP, bilateral posterior and middle cingulate and parietal.
Correlation of absolute regional CBF with 3MSE
Three subjects (1 MCI and 2 AD subjects) with very low 3MSE scores were considered as outliers because the 3MSE scores were more than three standard deviations lower and were removed from the rest of the analysis. For the remaining cohort, the 3MSE scores were positively associated with absolute regional CBF values in all of the 12 ROIs, associated with the PVE-corrected CBF in 10 of the 12 ROIs, and associated with the PVE-corrected CBF after 4 additional confounders (education and cardiovascular risk factors) in 9 of the 12 ROIs, after FWE correction (Table 3). For the symptomatic subjects, the 3MSE scores were positively associated with absolute regional CBF values in 10 of the 12 ROIs, associated with the PVE-corrected CBF in none of the 12 ROIs, and associated with the PVE-corrected CBF after 4 additional confounders in none of 12 ROIs, after FWE correction (Table 3).
The partial correlation coefficient between 3MSE scores and regional CBF values
aThe models calculated partial correlation coefficients between the regional CBF values before PVE and 3MSE and controlling for age and gender; bThe models calculated partial correlation coefficients between the regional CBF values after PVE and 3MSE and controlling for age and gender; cThe models calculated partial correlation coefficients between the regional CBF values after PVE and 3MSE and controlling for age, gender, and 4 additional variables (education level, hypertension, diabetes and the presence of heart disease). *stands for the significant correlation after family-wise error (FWE) correction.
Correlation of regional nCBF with 3MSE
For all of the subjects, the 3MSE scores were positively associated with nCBF in all of the 12 ROIs, associated with the normalized PVE-corrected in 9 ROIs, and associated with the normalized PVE-corrected after 4 additional confounders in 8 ROIs, after FWE correction (Table 3). For the symptomatic subjects, the 3MSE scores were associated with the nCBF values in 11 out of 12 ROIs, with normalized PVE-corrected CBF values in 8 out of 12 ROIs, and with normalized PVE-corrected CBF values after 4 additional confounders in 7 out of 12 ROIs, after FWE correction (Table 3). The representative association between the 3MSE scores and the normalized regional PVE-corrected CBF values after correcting for the risk factors is shown in Fig. 6.
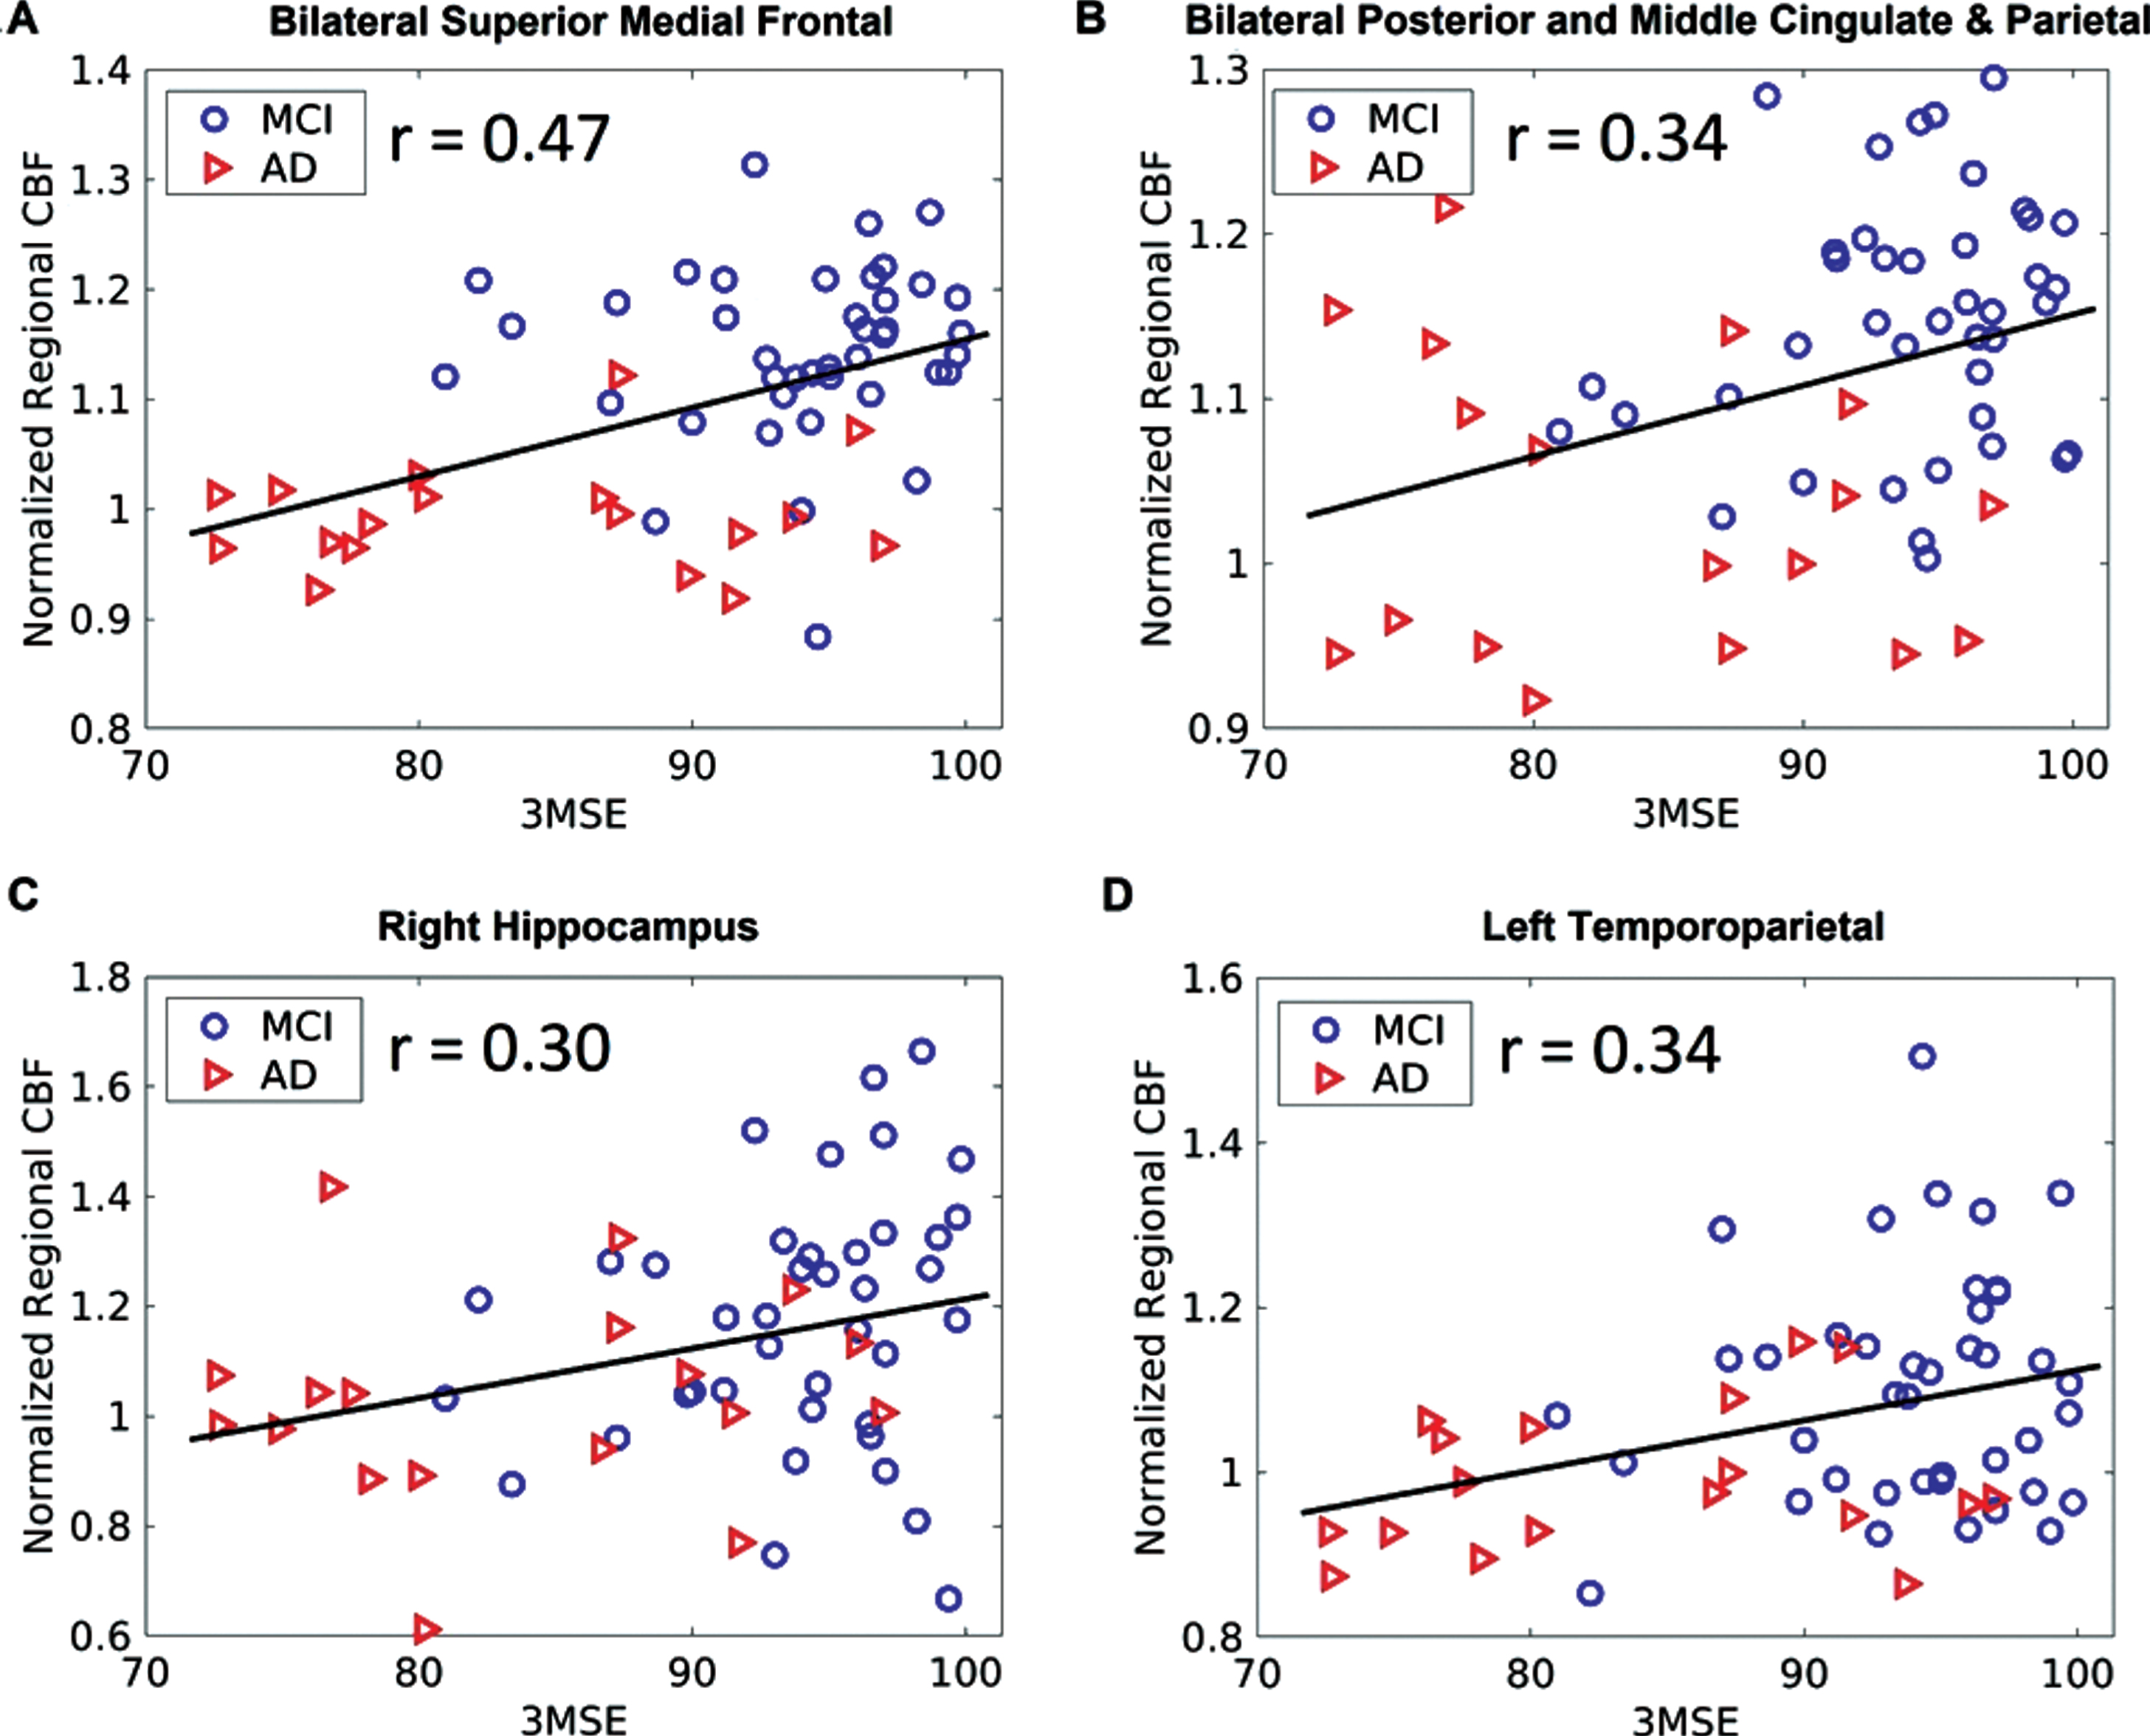
Association of 3MSE scores with normalized regional PVE-corrected CBF values for the symptomatic (MCI and AD) subjects only at the (A) bilateral superior medial frontal, (B) bilateral posterior and middle cingulate and parietal, (C) right hippocampus, and (D) left temporoparietal regions after FWE correction. 3MSE, Mini-Mental State Examination; CBF, cerebral blood flow; Normalized regional CBF, regional mean CBF divided by the global mean CBF.
Effects of risk factors on correlation of CBF with 3MSE
Hypertension was associated with the absolute PVE-corrected CBF values in the LH (p = 0.0059), RH (p = 0.0029), and LIFI (p = 0.0089) regions for all the subjects after FWE correction when adjusting the effects of education level, diabetes and the presence of heart disease. The other investigated risk factors (education level, diabetes, and the presence of heart disease) were found not significant for either all of the subjects or the symptomatic subjects. No risk factors were found to associate with normalized regional PVE-corrected CBF values.
DISCUSSION
Almost the entire cerebrum was analyzed for the CBF changes between the NC, MCI, and AD groups by the post-processing statistical analysis. The results of our study showed that AD was associated with impairment of resting CBF, even after correction of PVE and cardiovascular risk factors, in the posterior cingulate cortex, inferior parietal, hippocampus, temporoparietal, medial frontal cortex, inferior frontal and insular cortex. The resting normalized regional CBF values, even after correction of PVE and cardiovascular risk factors, in the right hippocampus, bilateral temporoparietal, bilateral posterior and middle cingulate and parietal, and bilateral superior medial frontal regions, were associated with 3MSE including the symptomatic subjects. Interestingly, the CBF-impaired regions in AD were co-localized with two brain resting-state networks: the default mode network (DMN) and the salience network (SN). The observed regions of CBF changes showed the greatest spatial overlap with the AD pathologically-affected regions in the literature [35]. Disrupted connectivity between the posterior cingulate and hippocampus were found in AD and amnestic MCI [36], and was suggested as a potential mechanism behind hypometabolism and hypoperfusion of the posterior cingulate region [37, 38]. Considering that the posterior cingulate region is the central hub of the DMN and the hippocampus is the initial site for AD pathology [39], our findings suggest that the impaired connectivity between the posterior cingulate region and hippocampus accounts for the observed DMN hypoperfusion, including hypoperfusion of AD in the inferior parietal, temporoparietal, and superior medial frontal regions. The hypoperfusion of AD in the frontal and temporoparietal associated regions has been observed in an earlier SPECT perfusion study [40]. The insular region, key hub of the SN, has been linked to neuropsychiatric symptoms, changes in cardiovascular and autonomic regulation, and mortality in the AD pathophysiology [41]. AD has been associated with disrupted functional connectivity in the SN although the direction of its change may depend on different stages of AD [42, 43]. Our results also indicate that impairment of resting CBF extends to more extensive regions after the MCI stage, which can be seen by comparing Fig. 4 with Figs. 2 and 3. These findings were independent of age, gender, education, and cardiovascular risk factors.
We observed a CBF increase in the right hippocampus in the MCI stage compared to NCs. The increased CBF in the hippocampus in the MCI stage was reported with a fewer number of subjects in our prior study [22]. The increased CBF in the hippocampus in the AD subjects or subjects with higher risk for AD (with APOEɛ4 genes) was also reported in other CBF studies [44–46]. We also found regional CBF increases in the bilateral middle cingulate and parietal, bilateral superior middle frontal, right inferior frontal and insular, and left temporoparietal regions in the MCI stage. The CBF increases in the medial frontal region in the MCI stage were supported by another study that found greater longitudinal increases in CBF in those who develop cognitive impairments compared to cognitively stable people [47]. These CBF increases during MCI and early AD further support the hypothesis of a compensatory process [22] in these regions during AD pathogenesis. These regions may increase their CBF levels to compensate for their altered metabolism [46] or increased demand for oxygen during disease progression in an effort to maintain cognitive function [45].
We investigated both absolute CBF and normalized CBF. We found increased sensitivity for the detection of group differences when using the normalized CBF that can compensate for the global CBF differences across subjects. We also investigated normalized CBF both with and without PVE correction. The disappearance of the CBF change in the right inferior parietal (from MCI to AD) and left temporoparietal (from NC to MCI) regions after PVE correction shows significant atrophy of the two regions during the progression of AD. Marked atrophy of the temporoparietal and inferior parietal regions were reported in MCI and AD in a larger multisite CHS study [34] and as a biomarker in preclinical AD [48, 49], which also confirms the effectiveness of the applied PVE correction method in filtering out the cortical atrophy.
We observed a CBF decrease in the posterior cingulate extending to the precuneus region from NC to MCI, from NC to AD, and MCI to AD stages after PVE correction, but not before PVE correction. The more sensitive CBF changes in the posterior cingulate region after PVE correction suggests very heterogeneous atrophy rates during different AD progression stages. Our results in the posterior cingulate and precuneus region agree with the literature findings that CBF in the MCI patients is intermediate between the NC and the AD groups [16, 50]. The CBF decrease in the posterior cingulate and precuneus region was observed in MCI, so this would appear a promising region for early detection. The CBF decrease in the posterior cingulate and precuneus region was also observed in AD compared to MCI, suggesting the CBF in this region as a potential predictor. Hence, CBF in the posterior cingulate region may be used for early detection (via decreased CBF in MCI relative to NC) and prediction of AD conversion (via decreased CBF in AD relative to MCI). We did not find an association between CBF in the posterior cingulate region and the 3MSE scores (although we found the association of 3MSE with CBF in its extended region, BPMP), indicating its closer association with diagnostic class than with cognitive performance.
We found the association between 3MSE and normalized CBF using the symptomatic subjects in the bilateral posterior and middle cingulate and parietal, bilateral temporoparietal, bilateral superior medial frontal, and right hippocampus regions, which are in good accordance with their metabolic association with cognitive performance using the PET and SPECT imaging modalities [51, 52]. It is worth noting that the CBF values in right hippocampus exhibit significant association with 3MSE only in the symptomatic subjects but not in the entire cohort. This indicates that the CBF in the region may be directly related to cognitive decline in MCI and AD subjects instead of in normal aging.This confirms that the normalized CBF values in the right hippocampus region using ASL can be used to evaluate the staging of cognitive status in the symptomatic subjects. In contrast, the association between 3MSE and absolute CBF was found within the entire cohort but not within the symptomatic group. The significant association of 3MSE with regional CBF can be derived from normalized CBF values, but not from absolute CBF values. This suggests that normalizing regional CBF by the global CBF can enhance the sensitivity for the staging of cognitive performance. We also noted that the association of 3MSE with absolute (not normalized) CBF within the symptomatic group changed dramatically after PVE correction, indicating the association was mainly driven by the much larger atrophy-caused CBF decrease in the AD stage.
To date, only a few ASL-related studies directly correlated CBF in NC, MCI, and AD groups with MMSE-related scores. Wang et al. [14] used the CBF values in a predetermined set of regions (meta-ROI) from the ADNI subjects (47 NC, 32 early MCI, 35 late MCI, and 15 AD) and reported that CBF values in the meta-ROI were correlated with MMSE for both the entire cohort and symptomatic subjects. Because the meta-ROI consists of several regions, including the precuneus, inferior parietal, and temporoparietal cortex, it is difficult to identify which specific regions contribute to the correlation. Mattsson et al. [15] used the CBF values in several regions (entorhinal, inferior temporal, hippocampal, inferior parietal, posterior cingulate, precuneus, and medial-orbitofrontal cortices) from the ADNI subjects (51 NC, 66 early MCI, 41 late MCI, and 24 AD) and found that the MMSE scores were associated with CBF in the entorhinal, hippocampal, and inferior temporal regions for the entire cohort. However, only the inferior temporal region would be significant if correction of multiple comparisons was performed in that study. No MMSE association was reported for the symptomatic subjects. The CBF values in the ADNI subjects were measured by pulsed arterial spin labeling (PASL) which may compromise the sensitivity of the CBF correlation compared to the CASL technique used in this study [53]. Binnewijzend et al. [16] measured CBF maps using the pseudo-continuous ASL (PCASL) technique in three groups (73 subjects with subjective complaints, 35 MCI, and 71 AD) and reported that the MMSE scores in AD patients only were associated with CBF in the posterior cingulate and precuneus, parietal cortex, and frontal cortex. In that study, the AD subjects were recruited from the referral clinic and hence in the late stage of AD compared to the early AD subjects in our study. This may be the main reason why their CBF values in the entire parietal cortex and entire frontal cortex were associated with MMSE and the same group observed no association between baseline CBF and MMSE within AD patients (totally 88 ADs) with slightly higher baseline MMSE scores [54].
Contrary to our expectation, our results showed that the association of 3MSE with the CBF values was affected only in the left inferior frontal and insula region by the cardiovascular risk factors. This is consistent with a large community-based cohort study [55] suggesting that cardiovascular risk factors do not confound the associations between whole-brain CBF and global cognition. The small effect of cardiovascular risk factors on the CBF-cognition association does not rule out the potential confounding effect of the cardiovascular risk factors on the association between MMSE and CBF values within late-stage AD patients. Therefore, the past studies, especially those with ADs from referral clinics, may require a revisit for whether the cardiovascular risk factors act as confounders for the association between CBF and cognition.
This study has some limitations. First, only the CBF images at the baseline are reported. Longitudinal analyses from the AD follow-up CBF images are needed to understand the CBF progression from normal cognition to AD. Second, the CBF images were acquired using the CASL technique at 1.5 T before the widespread availability of 3 T and PCASL [56]. Nevertheless, we were able to detect MCI and AD related CBF patterns from the large cohort and associate the regional CBF values with the patients’ cognitive status. Third, we observed asymmetrical patterns of CBF changes (e.g., missed left inferior parietal region in the voxel-based comparison between NCs and ADs). The exact cause is unclear but potentially contributed from asymmetrical labeling efficiency between the left and right carotid and vertebral arteries in the CASL technique. Fourth, subjects with a history of structural central nervous system lesions/small vessel diseases and stroke were excluded from the perfusion MRI study, although individuals with a history of stroke had a 59% increased risk of developing AD [57]. Therefore, our study cannot be extended to the broader population with vascular comorbidities. Further studies are needed to clarify whether vessel diseases and AD are more destructive to cognitive decline than they would be alone. Fifth, the regional CBF findings after normalization by the global CBF (i.e., nCBF results) should be interpreted with caution especially when global CBF values in ADs were lower compared to those in MCIs. nCBF values can be relatively higher after dividing by lower global CBF values in ADs and thereby change the directions of group comparisons or correlations with 3MSE findings. However, our findings were not affected by the global CBF normalization. After the global CBF normalization, we observed the results following the same directions with increased significance compared to those observed before normalization: decreases of nCBF in ADs and positive correlations of nCBF with 3MSE scores. Further data analysis revealed that the global CBF normalization largely increases the ratio of mean nCBF to its standard deviation in the AD group, indicating that the fluctuations of global CBF may be mainly contributed by the factors other than AD itself.
Conclusion
The significant PVE-corrected CBF decreases in the posterior cingulate extending to the precuneus and left superior medial frontal regions from NC to MCI and from MCI to AD suggest the regional CBF values are sensitive biomarkers to assess the staging of AD pathology. The significant association between PVE-corrected CBF in the right hippocampus and 3MSE only in the symptomatic subjects but not in the entire cohort indicates that the regional CBF is a sensitive biomarker to evaluate the staging of cognitive status in symptomatic subjects. The results strongly suggest that the noninvasive arterial spin labeling technique can add value to clinical diagnosis and objective cognitive evaluation of preclinical AD.
Footnotes
ACKNOWLEDGMENTS
This work was supported by grants AG20098 and AG15928 from the National Institute on Aging (NIA) and by contracts N01-HC-85239, N01-HC-85079 through N01-HC-85086, N01-HC-35129, N01 HC-15103, N01 HC-55222, N01-HC-75150, N01-HC-45133, and grant HL080295 from the National Heart, Lung, and Blood Institute (NHLBI), with additional contributions from the National Institute of Neurological Disorders and Stroke (NINDS). The research was also supported by the State University of New York at Binghamton, the Nevada Cancer Institute, the University of Pittsburgh, and Washington University in St. Louis.