



Abstract
Background
Detection of serum iron metabolism and peripheral blood ferroptosis indicators may to some extent reflect pathological changes in central nervous system iron deposition such as Alzheimer's disease and vascular cognitive impairment (VCI).
Objective
The study sought to establish the first clinical prediction model related to the iron metabolism model, which helps in the early detection and prevention of VCI.
Methods
The study included 255 patients at Hebei Provincial People's Hospital from January 2023 to November 2024. They were divided into two groups based on VCI diagnostic criteria, with 144 cases in the VCI group and 111 cases in the control group. The nomogram of the VCI diagnostic prediction model was built using logistic regression. The accuracy and discriminative ability of the model were confirmed in three areas: differentiation, calibration, and clinical practicability.
Results
A logistic regression model identified four significant independent predictors of VCI: ferritin (odds ratio (OR) = 1.003, 95% CI: 1.001∼1.006), education (OR = 0.929, 95% CI: 0.871∼0.992), cerebral small vessel disease total load scores (OR = 1.319, 95% CI: 1.039∼1.673), and cerebral microbleeds (OR = 2.020, 95% CI: 1.092∼3.736) after adjustment for potential confounding factors (p < 0.05). The predictive nomogram has good discriminatory ability, calibration ability, and clinical applicability.
Conclusions
Serum ferritin was a significant predictor of VCI in middle-aged elderly people. The predictive model developed for the risk of developing VCI has good clinical applicability, calibration, and discrimination for early VCI screening.
Keywords
Introduction
Vascular cognitive impairment (VCI) is cognitive impairment due to vascular factors alone or in combination with mixed pathology. 1 Common types of VCI include subcortical ischemic vascular dementia, post-stroke dementia, and other disorders with mild to severe cognitive impairment. 2 Common potential mechanisms focus on blood-brain barrier disruption, secondary inflammation, chronic cerebral under-perfusion, endothelial dysfunction, and cellular autophagy/apoptosis. 2 Unlike Alzheimer's disease (AD) and other neurodegenerative diseases, VCI can be diagnosed and prevented at an early stage. However, there is a lack of reliable biomarkers for VCI and there are no clinically specific interventions for VCI, which rely mainly on clinical assessment, magnetic resonance imaging, and neuropsychological testing. Therefore, it is important to search for novel biomarkers early to accurately identify diagnosis and formulate prevention and treatment strategies for cerebrovascular diseases.
Iron is a vital component in the synthesis of monoamine neurotransmitters, and serum iron metabolism is an important physiological process in the human body, which is closely linked to the production of ATP, the synthesis of myelin, and the stability of mitochondrial function. Dixon and colleagues 3 proposed the concept of ferroptosis, which is defined as a novel mode of cell death that differs from apoptosis, necrosis, and autophagy in terms of its morpho-biochemical characteristics. This form of cell death is primarily characterized by glutathione depletion or reduced glutathione peroxidase activity, lipid peroxidation induced by aberrant iron metabolism, and other factors. Ferroptosis is considered a potential target for the treatment of neurodegenerative diseases and cognitive impairment. Iron chelators (such as deferoxamine) and lipid-soluble antioxidants (such as ferrostatin-1 and vitamin E) can effectively inhibit ferroptosis. 4 The accumulation of lipid peroxides is one of the important mechanisms of ferroptosis. Levels of serum lipid peroxidation markers have been found to increase to some extent in populations with diseases such as VCI. In cerebral small vessel disease (CSVD), lipid peroxidation products may be overexpressed, leading to white matter lesions and cognitive dysfunction. In iron metabolism, ferritin is involved in the pathways associated with ferroptosis and cooperatively regulates cerebral iron homeostasis. In addition, disruption of iron homeostasis can lead to impaired mitochondrial morphology and function, including DNA damage, mitochondrial atrophy, loss of membrane potential, and impaired energy metabolism. Therefore, maintaining mitochondrial integrity and functionality is critical for cell survival in ferroptosis. 5 Large amounts of iron have been found at Aβ and tau protein aggregation sites. Iron may interact with pathological markers to induce ferroptosis and promote cognitive decline in AD.
More and more basic experiments are beginning to focus on the important role of ferroptosis in developing VCI. VCI has clear vascular injury factors that lead to some degree of blood-brain barrier destruction. The imbalance of intracellular iron influx, efflux, storage, and utilization leads to disruption of iron ion metabolism in neurons, which impairs cognitive function through oxidative stress and other pathways. Meanwhile, iron deposition has been detected in brain areas such as the hippocampus, putamen, and caudate nucleus. 6 Clinical studies have mainly focused on the relationship between serum iron metabolism in peripheral blood, iron deposition in the central nervous system, and clinical characteristics of VCI patients. Detection of serum iron metabolism and ferroptosis indicators in peripheral blood can reflect the pathological changes of iron deposition in the central nervous system to a certain extent. 7 Abnormalities in iron metabolism coexist with pathological mechanisms of neuroinflammation, aberrant protein aggregation, and neurocognitive behavioral decline are involved in the pathogenesis of VCI. 8 Serum ferritin, as an iron storage protein, is closely associated with risk factors for VCI such as type 2 diabetes mellitus (T2DM), hypertension, hyperlipidemia, and obesity. 9 As a biomarker for mild cognitive impairment (MCI) and the early stages of AD, ferritin may have a direct effect on the pathophysiological process of VCI or may indirectly influence the onset and development of VCI by influencing the risk factors for VCI. 10 In addition, transferrin is the main source of iron in neurons due to the high expression of transferrin in neurons.11,12 Ficiarà et al. 11 found that serum transferrin levels correlated with cognition in VCI patients. Currently, iron chelation therapy is used clinically to effectively reduce the toxic effects of iron on neurons and delay the progression of cognitive impairment. Therefore, exploring the process of serum iron metabolism to interfere with the progression of VCI may be an important direction. The relationship between serum ferritin or other indicators and VCI may provide new ideas for diagnosing, treating, and preventing VCI.
CSVD represents an important risk factor for VCI. One of its imaging markers is cerebral microbleeds (CMBs), which manifest as focal deposits of hemosiderin. 13 In most cases, the condition is caused by the leakage of blood from the walls of damaged micro-vessels, resulting in the formation of a small, circular, or elliptical lesion with a homogeneous signal intensity observed on T2-weighted imaging and susceptibility-weighted imaging. It has been shown in studies that CMBs may act as an independent predictor of new-onset cerebral infarction and cerebral cortical atrophy. 14 It is increasingly recognized that CMBs represent a significant etiological factor in cognitive decline and dementia in older people and are a prominent contributor to the occurrence and progression of VCI, which can indirectly reflect iron deposition in the central nervous system. 15 However, recent research investigating serum iron metabolism in VCI and its association with CMBs is limited. As a new statistical prediction model, the nomogram can transform risk factors into graphs of a continuous scoring system with a high degree of accuracy and flexibility of use. There are no effective guidelines or consensus on the selection of variables in the VCI diagnostic model. Although the clinical diagnostic system for VCI includes assessment of cerebral white matter lesions and luminal infarction, few experiments have investigated the impact of CMBs and CSVD total burden score on risk prediction of VCI, and no visual scoring system has been established that includes laboratory or imaging indicators of serum iron metabolism. Over-inclusion of variables can cause diagnostic prediction models to over-fit and reduce clinical applicability. Therefore, it is challenging to identify clinical characteristics that include laboratory or imaging measures related to serum iron metabolism for predictive models for diagnosing VCI.
Based on the above research, we collected relevant serum iron metabolic indicators in the VCI population to investigate the presence of iron metabolic disturbances, identified independent predictors of VCI risk through statistical analysis, and established the first clinical predictive model related to iron metabolism. This model provides a valuable reference for the clinical assessment, management, and intervention of VCI patients, offers a comprehensive tool for healthcare professionals, and provides clinical ideas for intervening in the iron metabolism pathway to diagnose, treat, and prevent VCI.
Methods
Study design and participants
Data were retrospectively examined in this cross-sectional study from January 2023 to November 2024. Participants were included in this study if they met the following inclusion criteria: (1) aged between 50 and 85 years; (2) no acute cerebrovascular events within 3 months before enrolment; (3) complete medical history, imaging, and neuropsychological assessment. Exclusion criteria included: (1) any other type of dementia or diseases that may affect the results of the assessment of cognitive function such as central nervous system demyelinating diseases, head trauma, tumors, psychiatric disorders, epilepsy, intracranial infections, Parkinson's disease, and other systemic disorders or metabolic abnormalities (hypothyroidism); (2) history of anxiety, depression or other psychiatric disorders affecting cognitive outcome; (3) a history of intoxication or drug or alcohol abuse or dependence, such as carbon monoxide poisoning and sedative-hypnotics in the 3 months before the first diagnosis of cognitive impairment; (4) malnutrition, hemoglobin <90 g/L or/and red blood cell count <3.5 × 10¹²/L and use of iron supplements in the last 3 months; (5) comorbidities of coagulopathy, hematologic disorders, severe liver or kidney disease, malignancy, infection, organ failure; (6) severe vision, hearing, aphasia, dysarthria, or severe paralysis of the dominant upper limb that prevents completion of the cognitive assessment and contraindications that prevent completion of the imaging examination. The specific selection flow chart of research objects was shown in Figure 1. This study was approved by the Ethics Committee and conducted in accordance with the Declaration of Helsinki (No.2024391).
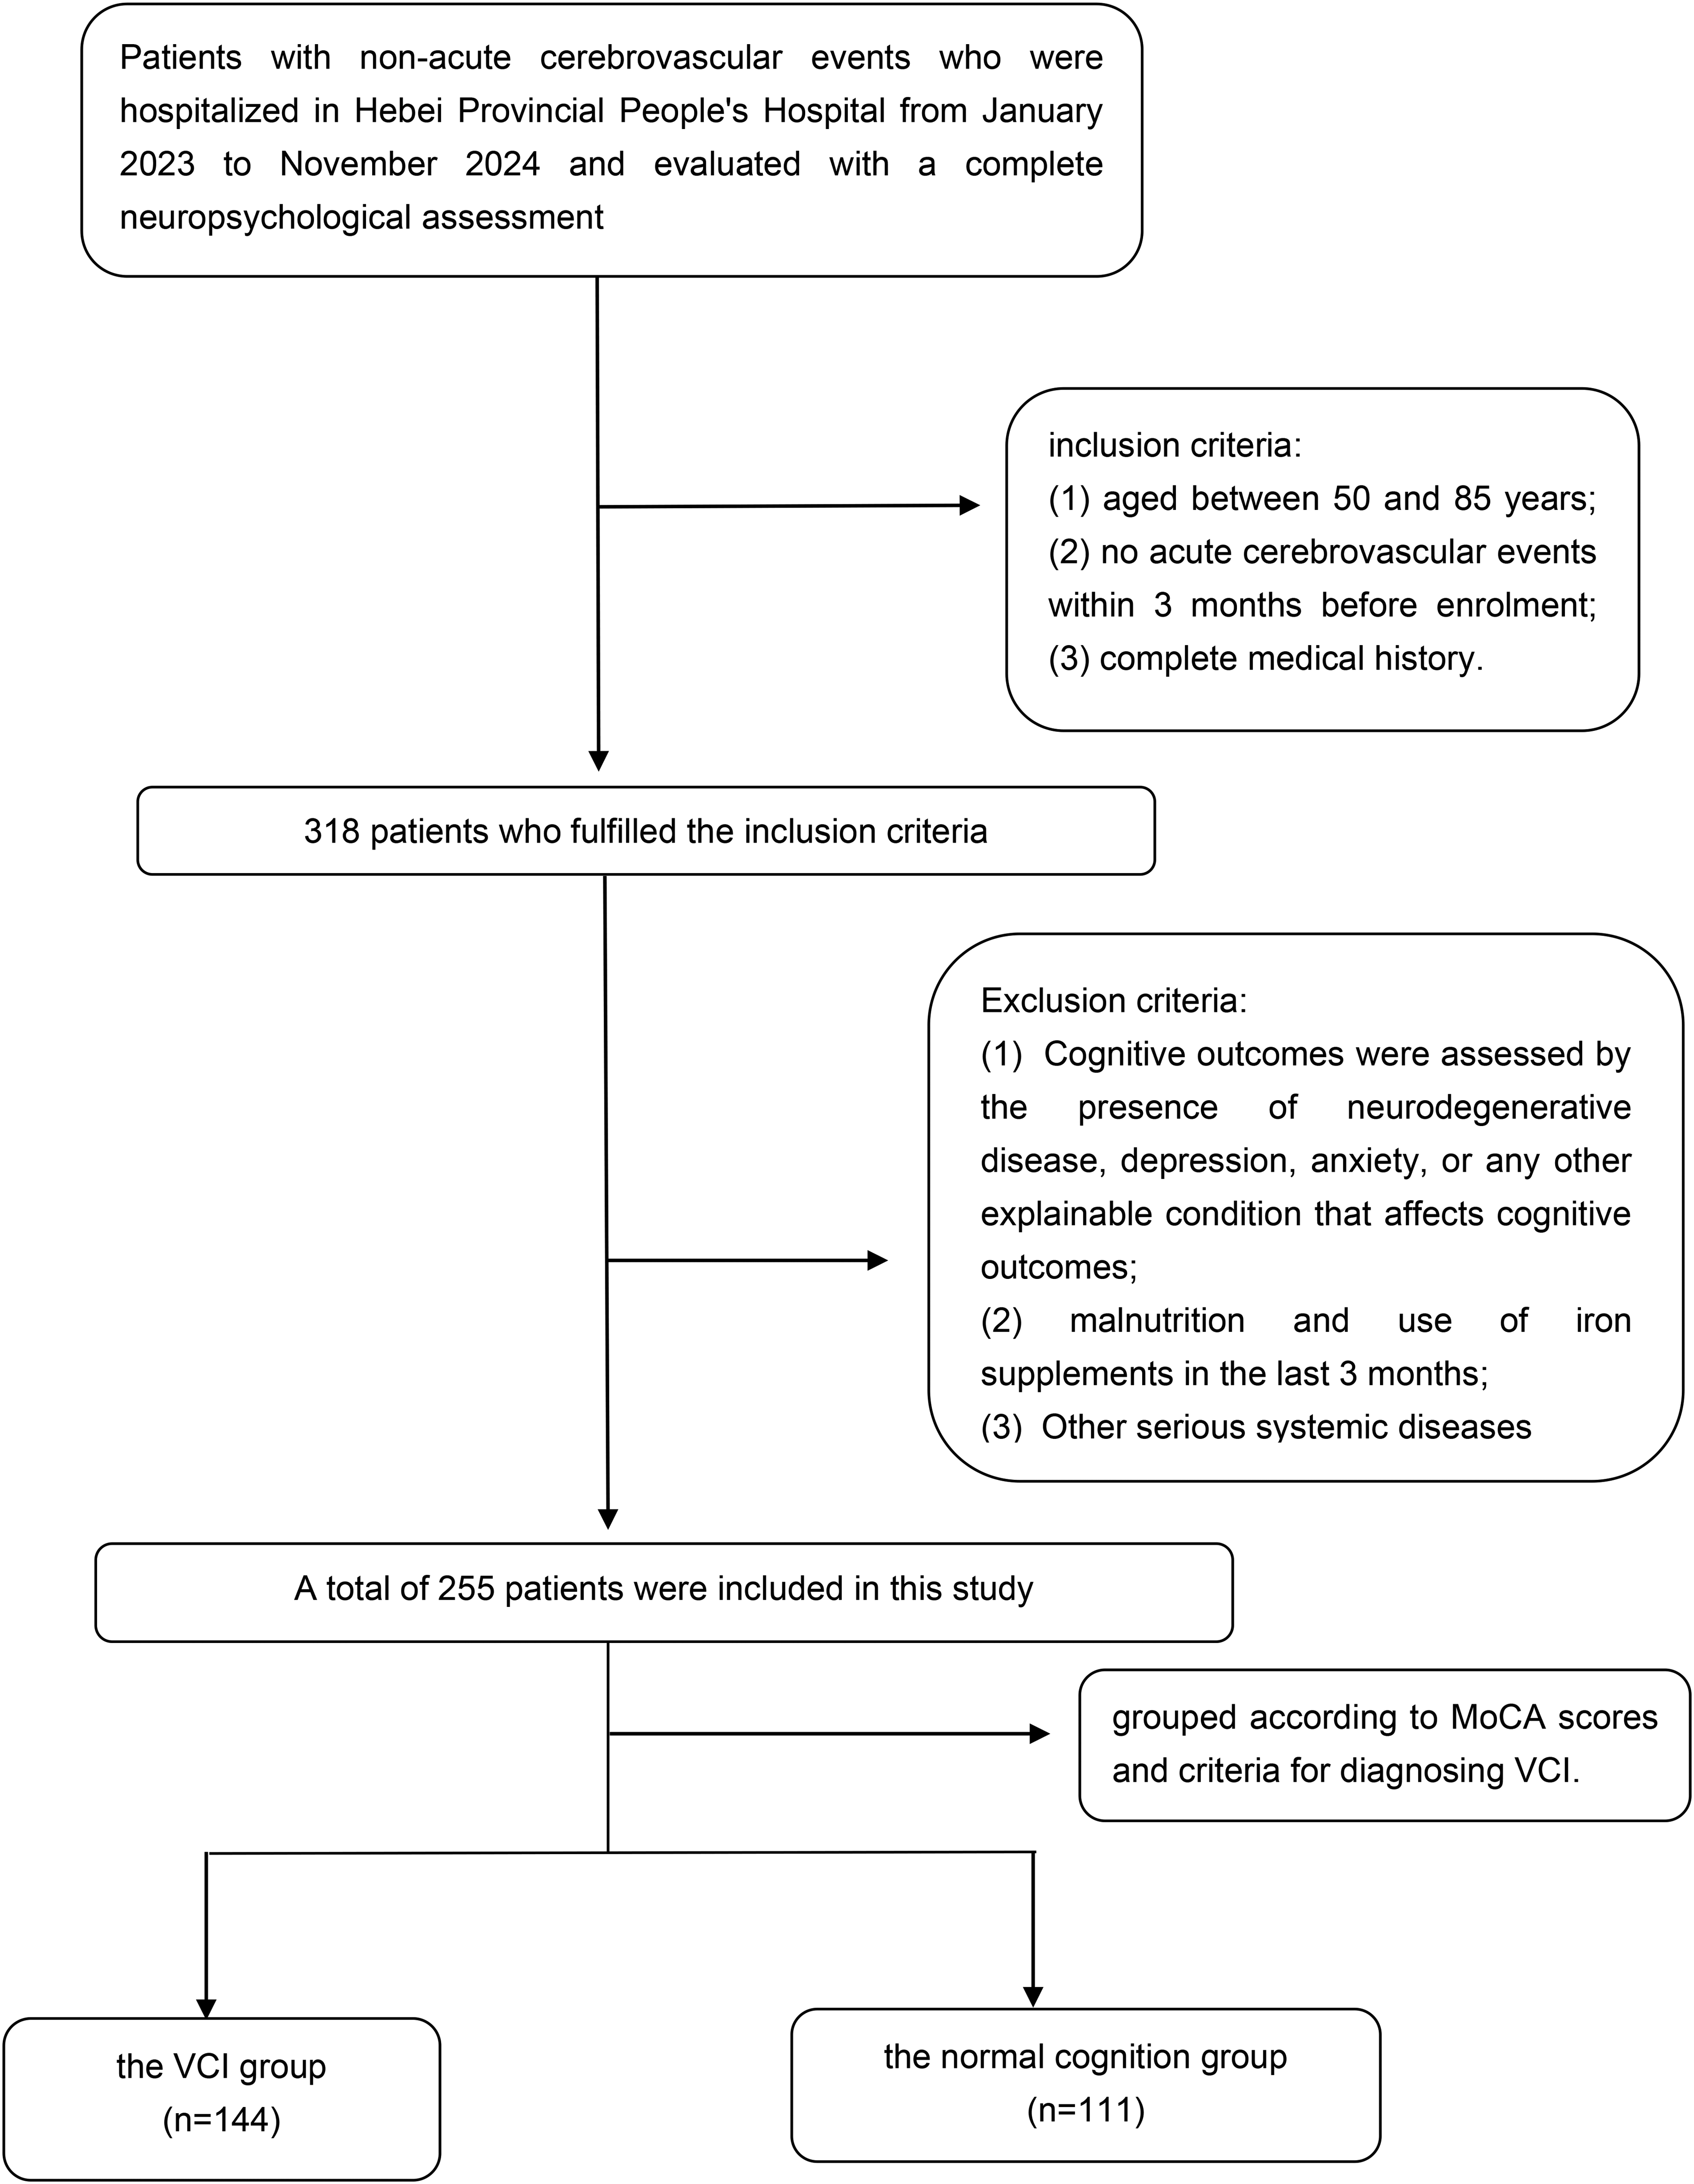
Flow chart of participant selection.
Collecting clinical data
The following factors were collected: age, gender, education, history of smoking and alcohol consumption, past medical history (hypertension, diabetes mellitus, cerebral infarction, cerebral hemorrhage, and coronary heart disease), height, weight, serum albumin, lymphocyte count, hemoglobin, triglycerides, total cholesterol, high-density lipoprotein cholesterol (HDL-C), low-density lipoprotein cholesterol (LDL-C), very-low-density lipoprotein cholesterol (VLDL-C), lipoprotein a, homocysteine, uric acid, fibrinogen, ferritin, serum iron, serum total iron binding capacity (TIBC), transferrin, unsaturated iron binding capacity (UIBC), monoamine oxidase, and superoxide dismutase. These were collected from veins within 48 h of admission. Body mass index (BMI) was calculated as the weight (kg) divided by the square of height (m2). Transferrin saturation (TS) was the ratio of serum iron to TIBC. Calculation of relevant nutritional indices: The Geriatric Nutritional Risk Index (GNRI) is mainly based on the ratio of serum albumin, body weight, and ideal body weight, which is calculated using the following formula (1):
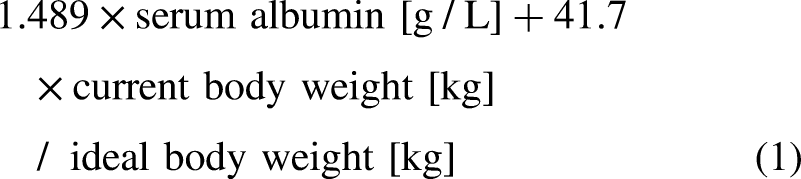
The ideal body weight is calculated according to the Lorenz equation as follows (2) and (3):


The Prognostic Nutritional Index (PNI) is based on lymphocytes and serum albumin and is a more objective tool for assessing nutritional status, which is calculated using the following formula (4):

New Simple Calculated Nutritional Index (TCBI) is a new simple calculated dietary index divided into low, medium, and high TCBI groups by tertiles using the following formula (5):

Neurocognitive assessment
In our study, cognition was assessed using the standardized translation of the Montreal Cognitive Assessment (MoCA) Beijing edition (www.mocatest.org), and anxiety or depression was assessed using the 14-item Hamilton Anxiety Scale (HAMA) and the 24-item Hamilton Depression Scale (HAMD). Maintain independence of functional ability based on basic and instrumental activities of daily living (ADL). VCI was defined as a clinical syndrome of impaired cognitive function due to cerebrovascular disease and its risk factors. Results of neuropsychological tests were used as objective evidence of cognitive impairment as follows: MoCA (≤13 for illiterate, ≤ 19 for 1–6 years of education, ≤ 24 for 7 or more years of education), and both HAMA <6 and HAMD <8. 15 The previously defined criteria for diagnosing VCI were as follows: (a) objective evidence of cognitive impairment; (b) clinical characteristics that were consistent with a vascular etiology; and (c) evidence of cerebrovascular disease that was deemed adequate to explain cognitive impairment.16,17
MRI acquisition and assessment
All enrolled subjects were perfected within 72 h of admission using 3.0 Tesla MRI scanners (Signa, GE of USA) with multiple sequences of magnetic resonance imaging (MRI). The detailed acquisition parameters were described in detail in our previous research. 18
The CSVD imaging markers were interpreted separately by two experienced physicians who were unaware of the history, the specific criteria for CSVD imaging markers are as follows: (1) White matter hypersignal (WMH) was primarily detected in T2WI and FLAIR sequences. The Fazekas scale was used for assessment, scoring deep and periventricular WMH. An additional point is added to the total CSVD load if deep WMH is scored at 2 or higher, or if periventricular WMH is scored at 3; (2) Lacune: This condition presents as a round or oval cavity, 3–15 mm in diameter, visible on T1W1 and T2W1. In FLAIR imaging, it appears as a central low-signal area with a high-signal perimeter, resembling cerebrospinal fluid in all sequences; (3) Enlarged perivascular spaces: high signal changes <3 mm in diameter that are consistent with small vessel alignment, primarily at T2W1, were evaluated by visually quantifying. When there are more than 10 in the basal ganglia region, one point is added to the CSVD total load scores; (4) CMBs: SWI showed a well-defined round or round-like low signal lesion with a diameter of 2–10 mm. The presence of a deep cerebral microbleed added 1 point to the CSVD total burden scores. Each marker received a maximum score of one point, which was then added up to determine the overall CSVD load score, which ranged from 0 to 4.19,20
Statistical analysis
SPSS 27.0 (IBM, Armonk, NY, USA) and R4.4.1 (version 4.4.1; R Foundation for Statistical Computing, Vienna, Austria) software were used for data processing and analysis. Quantitative data were expressed as mean ± standard deviation (x̅ ± SD) for normal distribution, and independent samples t-test was used for between-group comparisons; non-normally distributed data were expressed as median and quartile [M(Q1, Q3)], and non-parametric rank sum test (Mann-Whitney U test) was used for between-group comparisons; Categorical variables were expressed as frequency, percentage, or constitutive ratio n(%), and the chi-square test was used for between-group comparison. p < 0.05 was considered a statistically significant difference.
Least absolute shrinkage and selection operator (LASSO) regression was employed to identify potential predictor variables between groups, construct a multifactor logistic regression model, and utilize the ‘rms’ and ‘regplot’ packages of the R language to generate a visual representation of the VCI prediction model. Furthermore, the R language's ‘rms’ and ‘regplot’ packages were employed to generate a visual nomogram of the VCI prediction model. The accuracy and clinical applicability of the constructed prediction model were verified using R software packages “pROC”, “ResourceSelection” and “rmda”. The differentiation of the models was evaluated by plotting receiver operating characteristic (ROC) curves and calculating the area under the curve (AUC). Calibration curves were plotted to determine the calibration of the models by the Hosmer-Lemeshow (HL) test. Bootstrap self-sampling was used to validate and assess the clinical applicability of the models by using decision curve analysis (DCA).
Results
Participants characteristics
This study finally included 255 patients, who were divided into 144 patients in the VCI group and 111 patients in the normal cognition (NC) group according to the criteria of vascular cognitive impairment. The prevalence of VCI in participants was 56.5%. A comparison of the baseline data between the two groups was presented in Table 1. Compared to patients without cognitive impairment, those with VCI were older, with lower levels of education, and a higher incidence rate of stroke (p < 0.05). The VCI group had lower levels of hemoglobin and serum iron and high levels of ferritin, CSVD total load scores, and the presence of CMBs (p < 0.05).
Characteristics of the participants between VCI and normal cognition (NC) groups.

p < 0.05.
T2DM: type 2 diabetes mellitus; CHD: coronary heart disease; ICH: intracerebral hemorrhage; GNRI: geriatric nutritional risk index; TCBI: triglycerides, cholesterol, body weight index; PNI: prognostic Nutritional Index; HDL-C: high-density lipoprotein cholesterol; LDL-C: low-density lipoprotein cholesterol; VLDL-C: very-low-density lipoprotein cholesterol; TIBC: serum total iron binding capacity; UIBC: unsaturated iron binding capacity; TS: transferrin saturation; CMBs: cerebral microbleeds.
Development of the predictive model
Baseline variables were included in the LASSO regression analyses for variable screening using the occurrence of VCI as the outcome variable, and Figure 2 showed the 10-fold cross-validation curves for the LASSO regression. λ1-se was chosen to keep the variables in the equation more concise, resulting in a simpler model with excellent performance. A total of four independent variables were included: ferritin, education, CSVD total load scores, and CMBs.
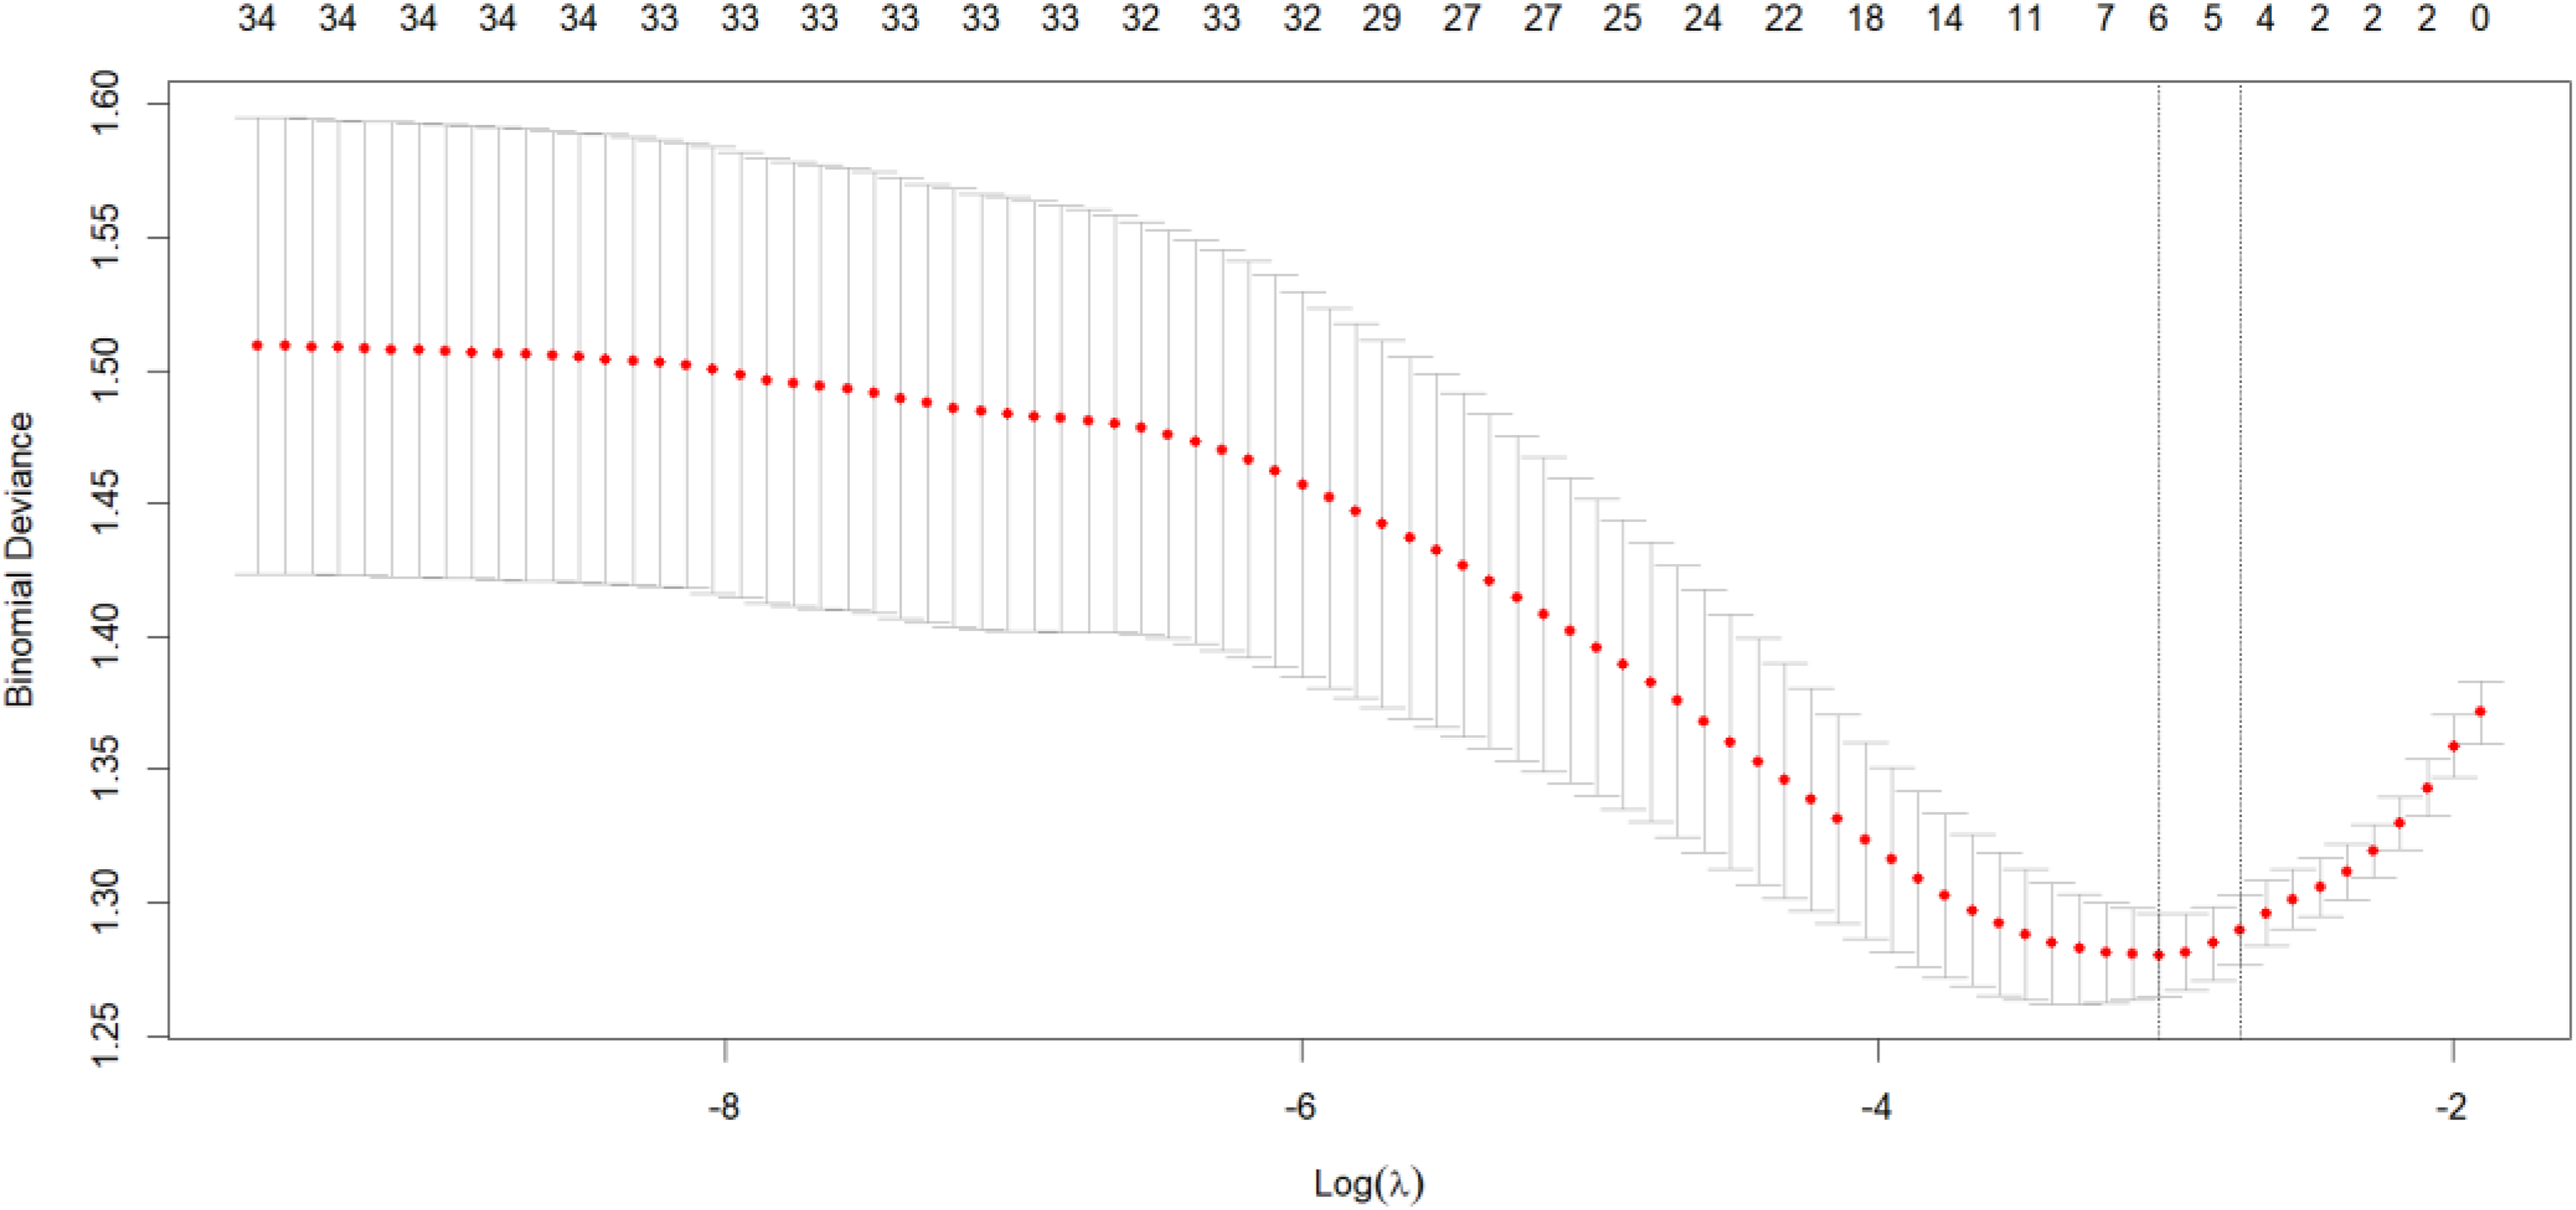
The 10-fold cross-validation curves for the LASSO regression.
The four variables screened by LASSO regression were included as independent variables in a multifactorial logistic regression model with the occurrence of VCI as the dependent variable, and the results showed that ferritin (odds ratio [OR] = 1. 003, 95% confidence interval [CI]: 1.001∼1.006), education (OR = 0.929, 95% CI: 0.871∼0.992), CSVD total burden scores (OR = 1.319, 95% CI: 1.039∼1.673) and CMBs (OR = 2.020, 95% CI: 1.092∼3.736) were significant independent predictors of VCI (p < 0.05) (Table 2).
Multifactorial logistic regression analysis of the associated factors for the risk of VCI.

p < 0.05.
CMBs: cerebral microbleeds.
A nomogram of the predictive model for the risk of developing VCI was plotted and is detailed in Figure 3. To further illustrate the clinical applications, a specific nomogram model was plotted in Figure 4. For example, a patient with a ferritin of 300 ng/ml, education of 6 years, CSVD total burden score of 1, without the presence of CMBs, which gave a predictive probability of the patient developing a VCI of 60.4%.
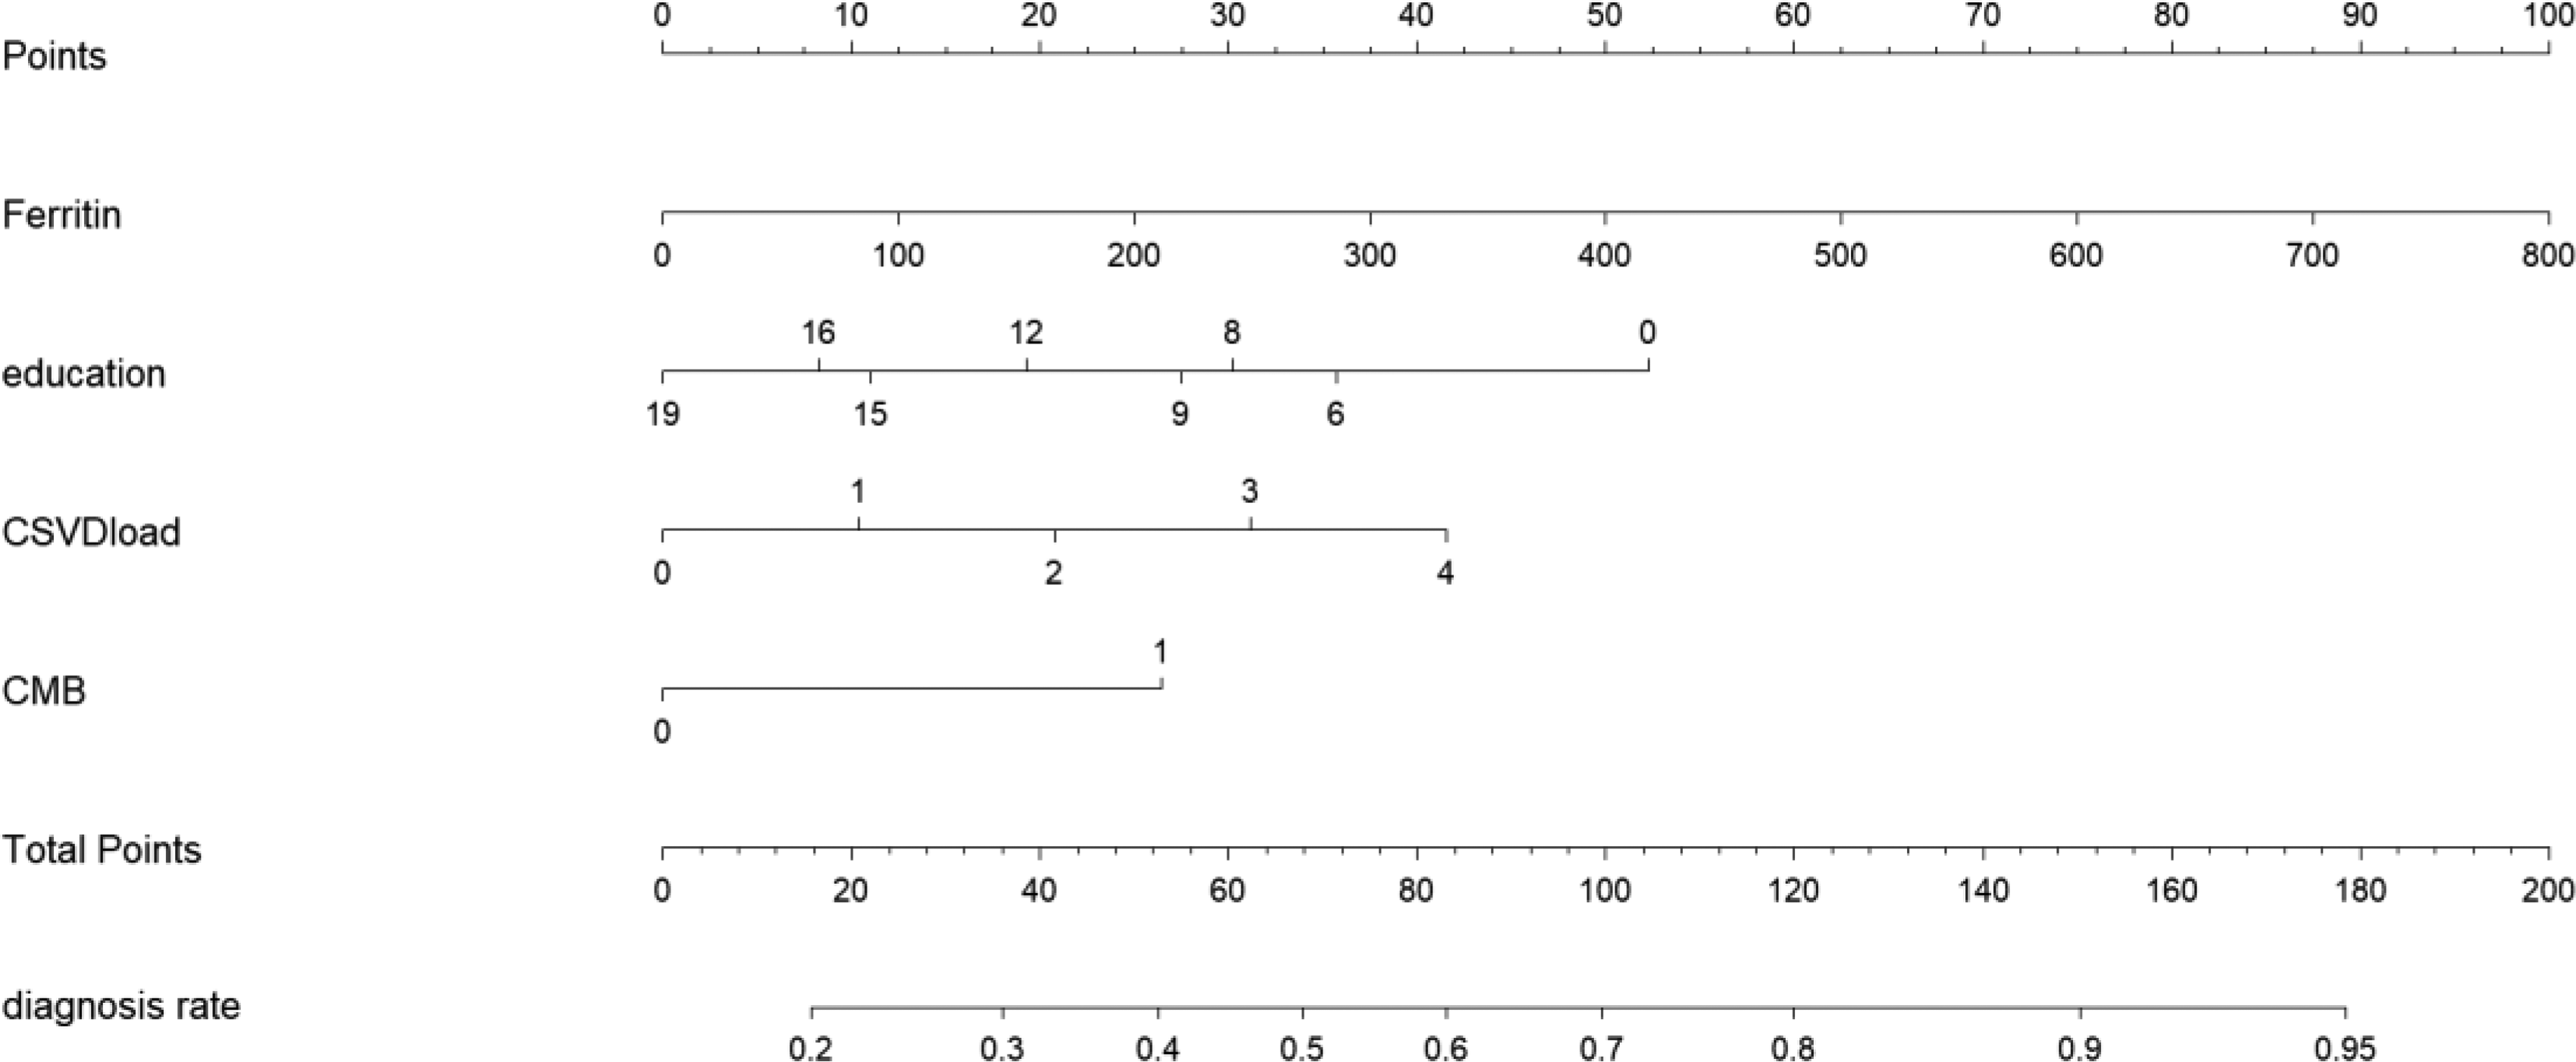
Nomogram for the prediction of the probability of VCI risk. The nomogram was developed by incorporating the following four parameters: ferritin, education, education, CSVD total load scores, and CMBs.
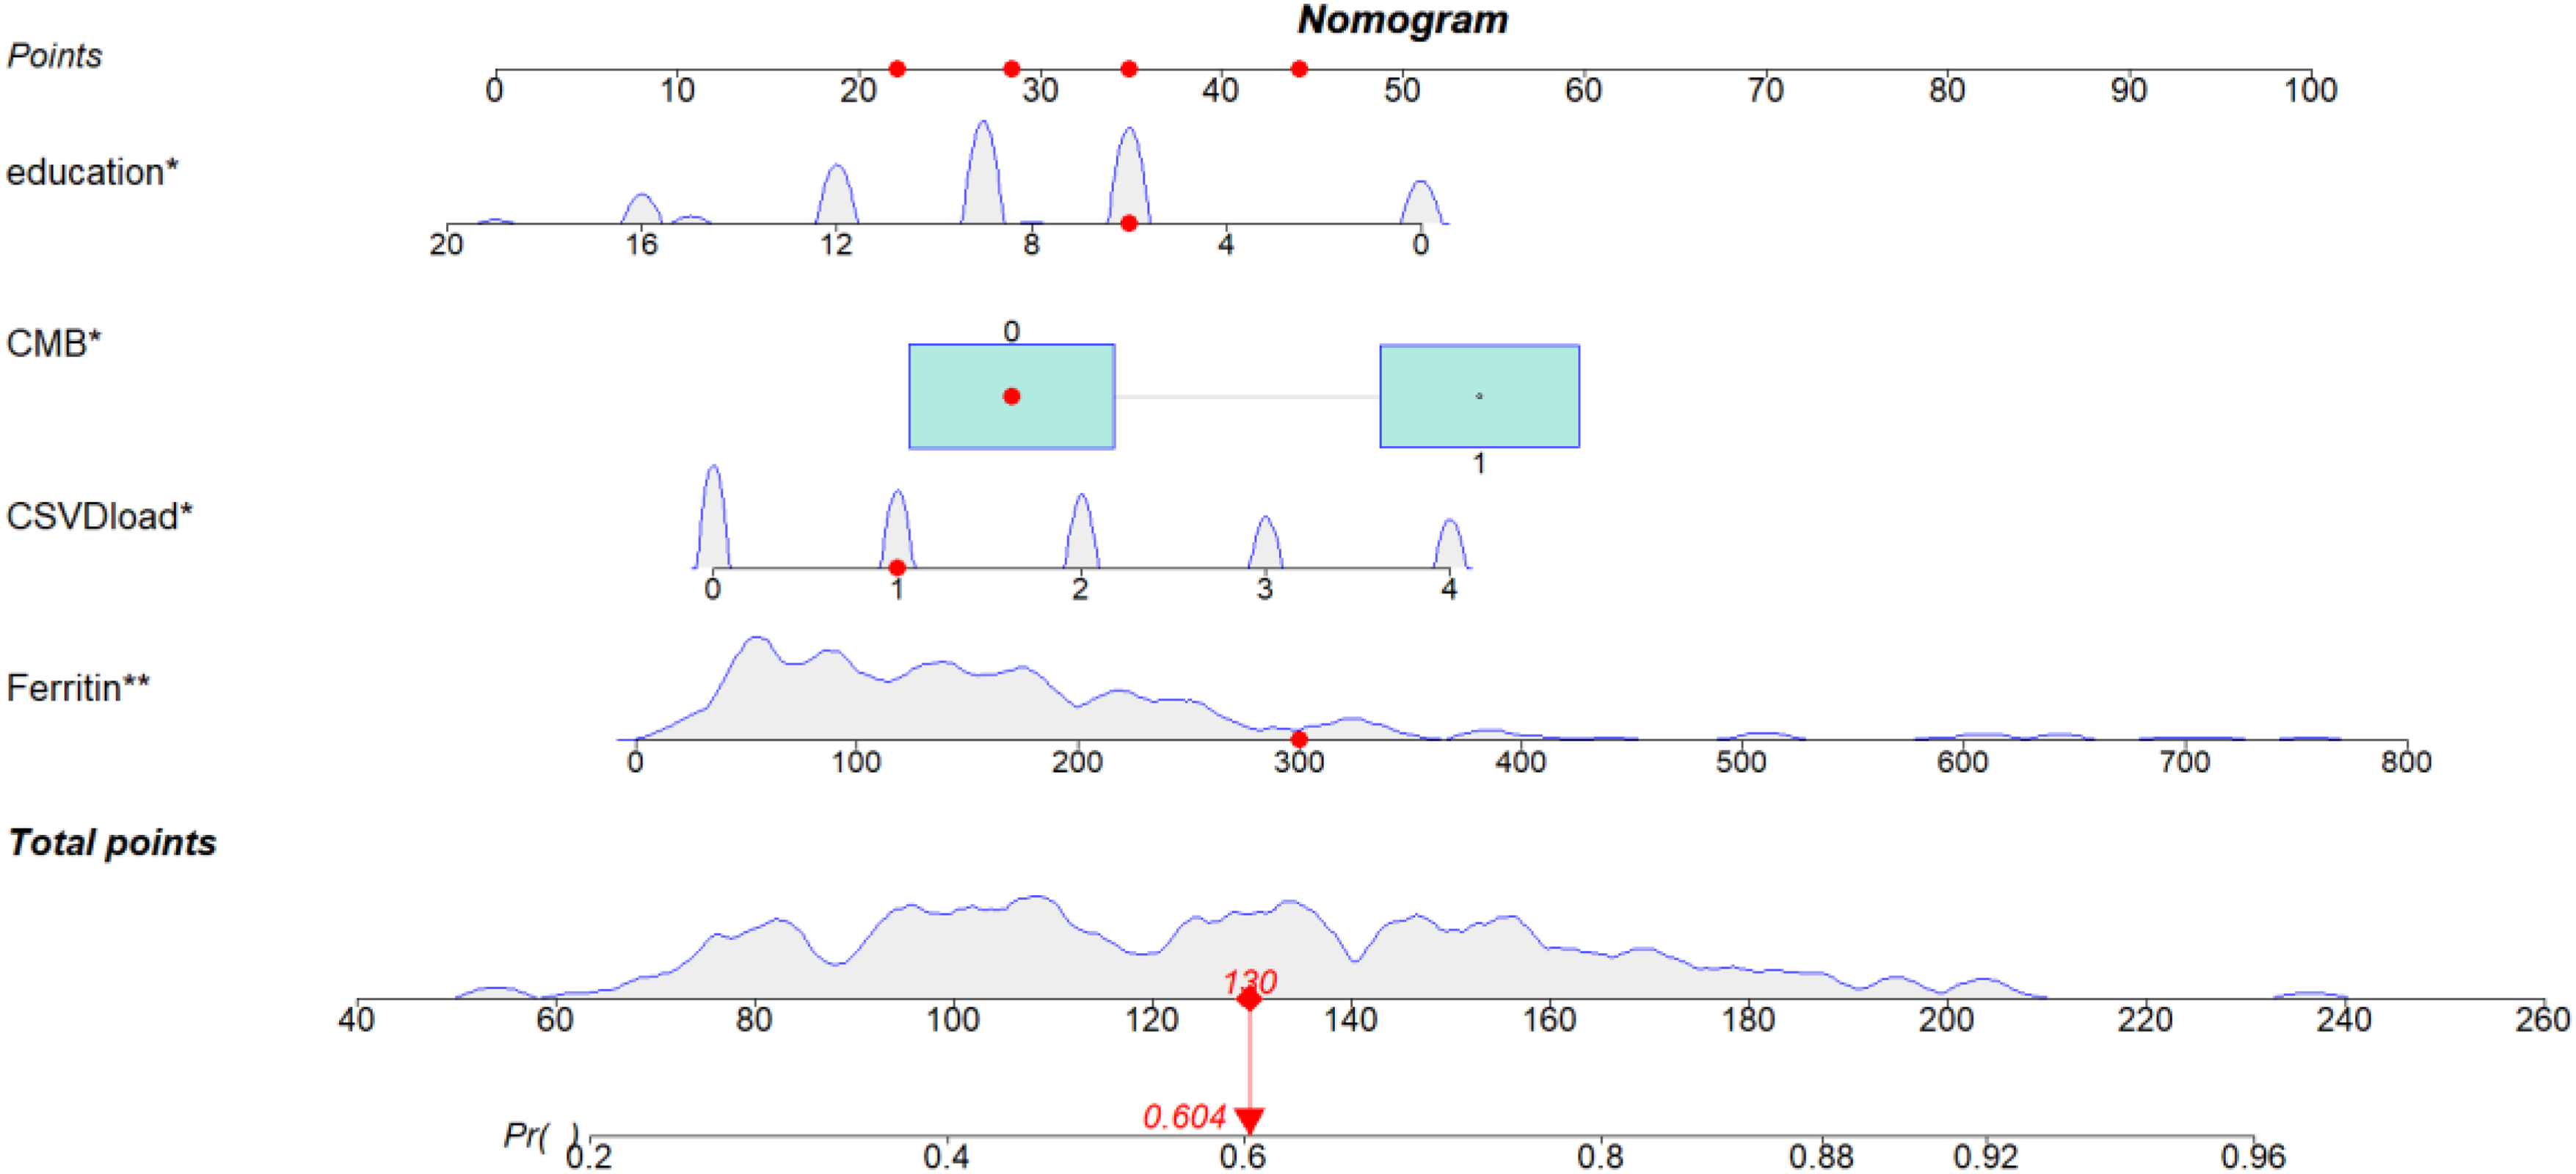
A specific nomogram model was plotted. The patient with a ferritin of 300 ng/ml, education of 6 years, CSVD total burden score of 1, without the presence of CMBs, and the red arrow indicates that the total score of each predictor for this patient is 130, corresponding to a probability of developing VCI of 0.604.
Validation of the predictive model
The differentiation of the prediction model and the clinical diagnostic ability were evaluated by plotting the ROC curve and calculating the AUC value of the area under the curve. As shown in Figure 5, the AUC value of the model was 0.725 (95% CI: 0.665–0.788). The model was internally validated using the bootstrap method, and the model AUC was 0.727 (95% CI: 0. 664∼0.786) after 1000 times self-sampling, which indicated that the VCI risk prediction model had good discriminatory ability for clinical predictive diagnosis.
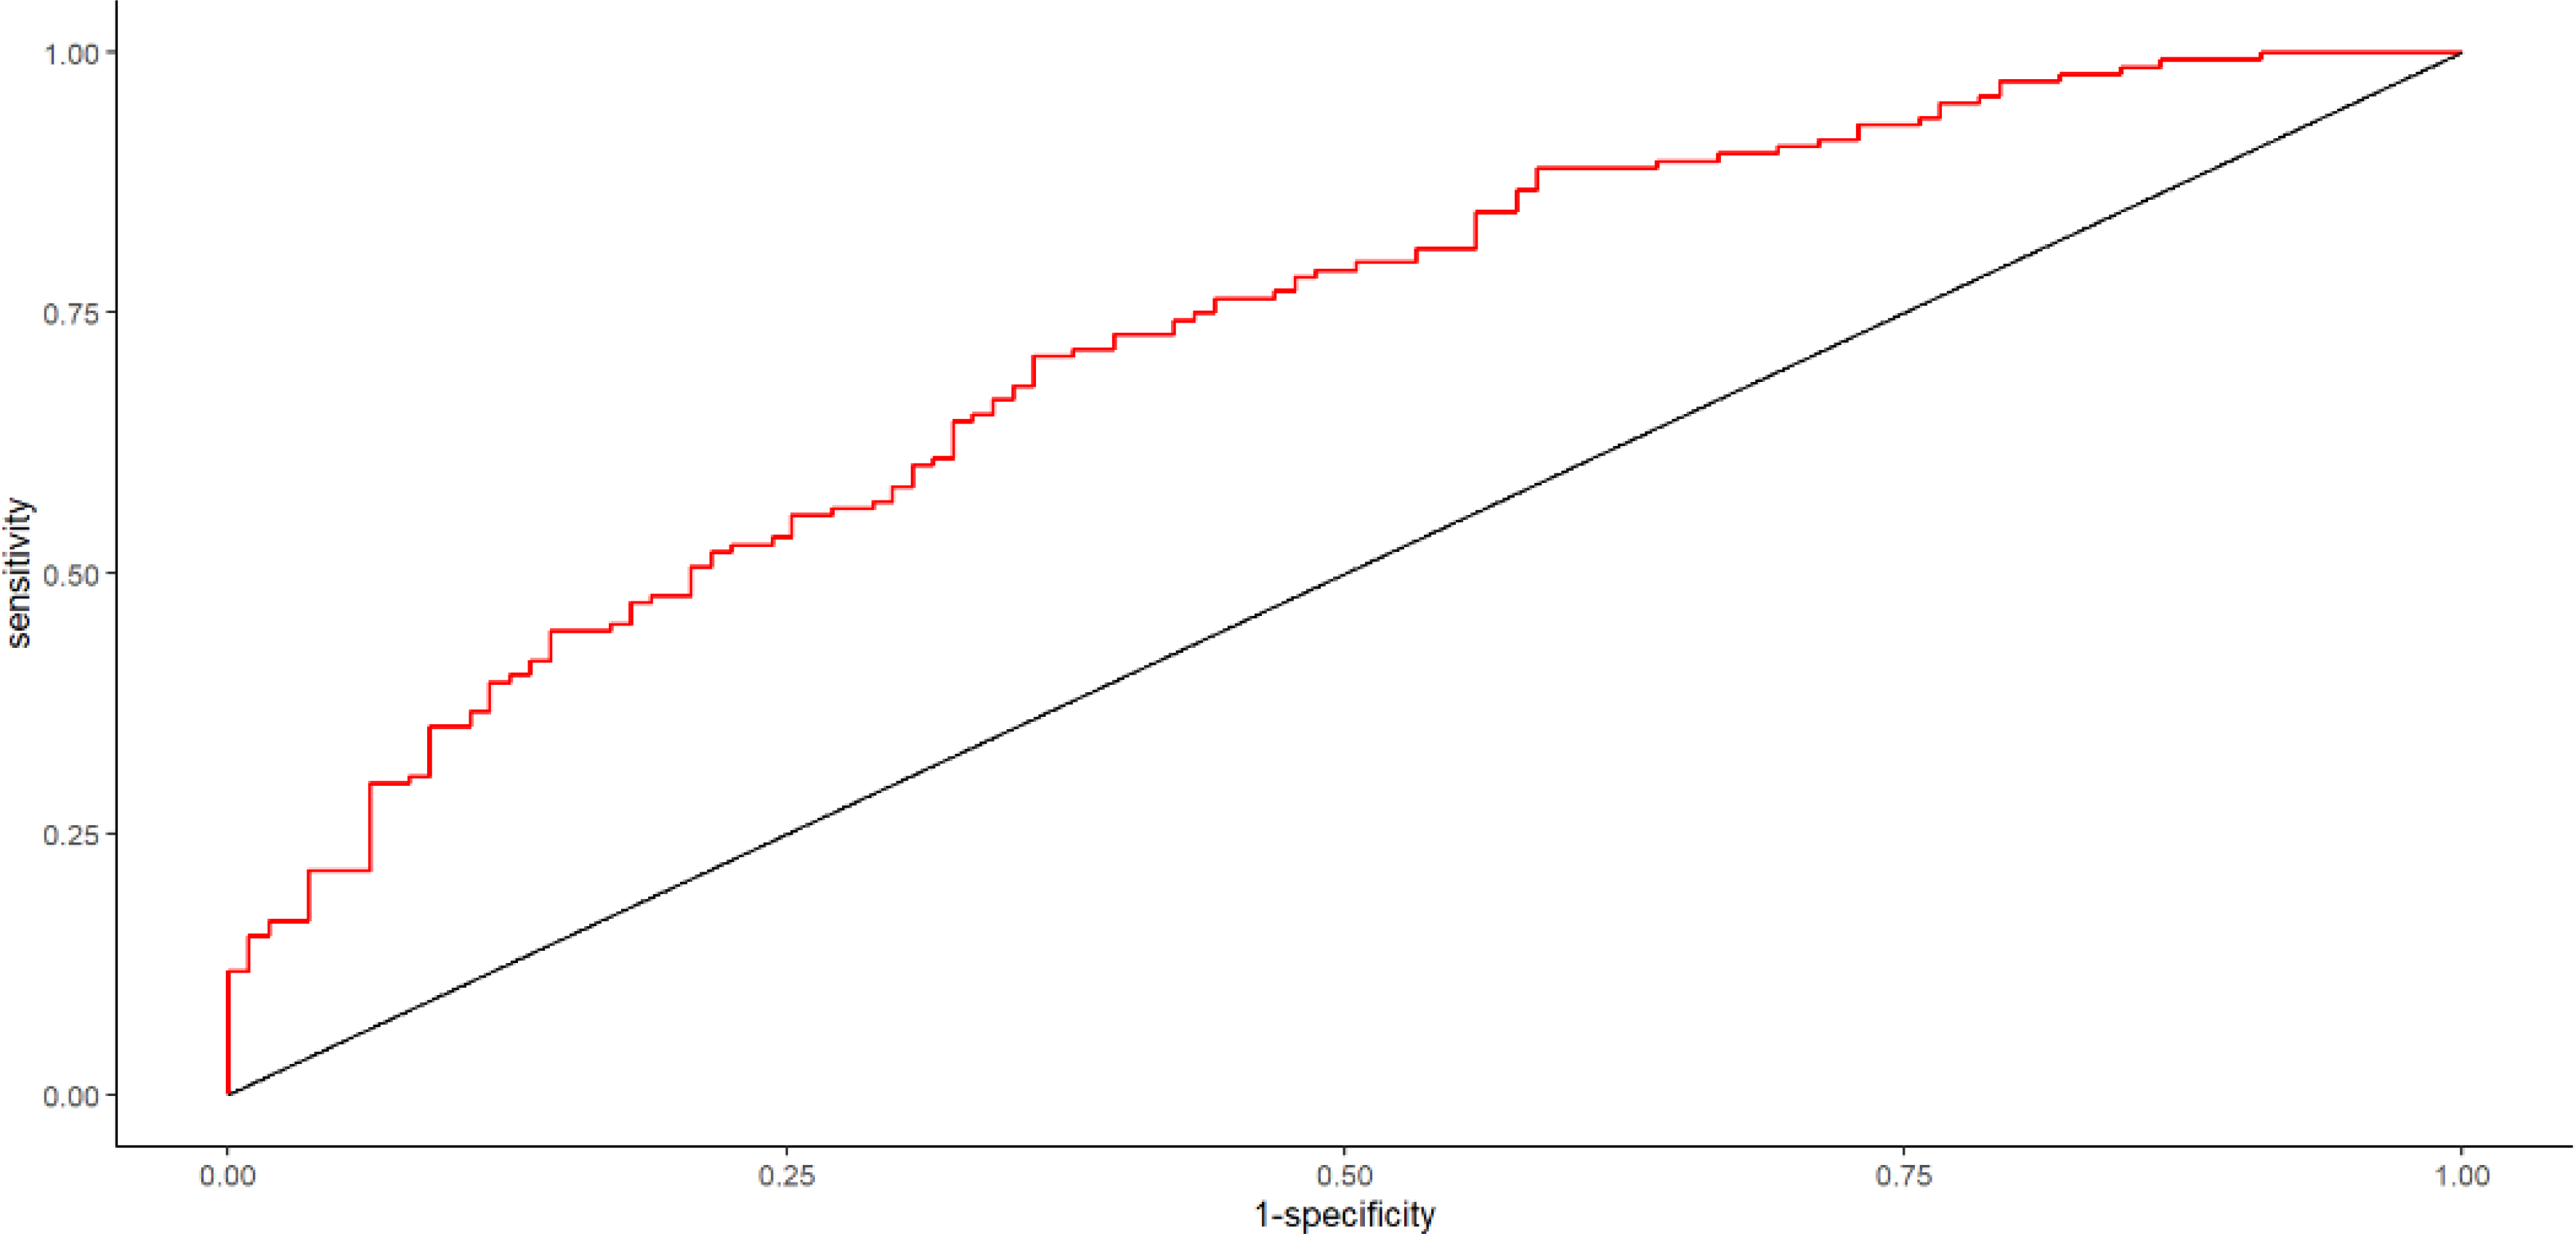
The horizontal axis represents specificity and the vertical axis represents sensitivity, and the model was considered to have positive predictive ability when the AUC value was between 0.5 and 1.0. The AUC value of the model was 0.725 (95% CI: 0.665–0.788).
The bootstrap-corrected method was used to self-sample 1000 times and draw calibration curves to assess the accuracy of the nomogram. As shown in Figure 6, the prediction model constructed in this study has an optimal agreement between the predicted probability and the actual probability. The result of the Hosmer-Lemeshow test was χ2 = 4.592, p = 0.800 (p > 0.05), which suggests that the prediction model has good predictive accuracy.
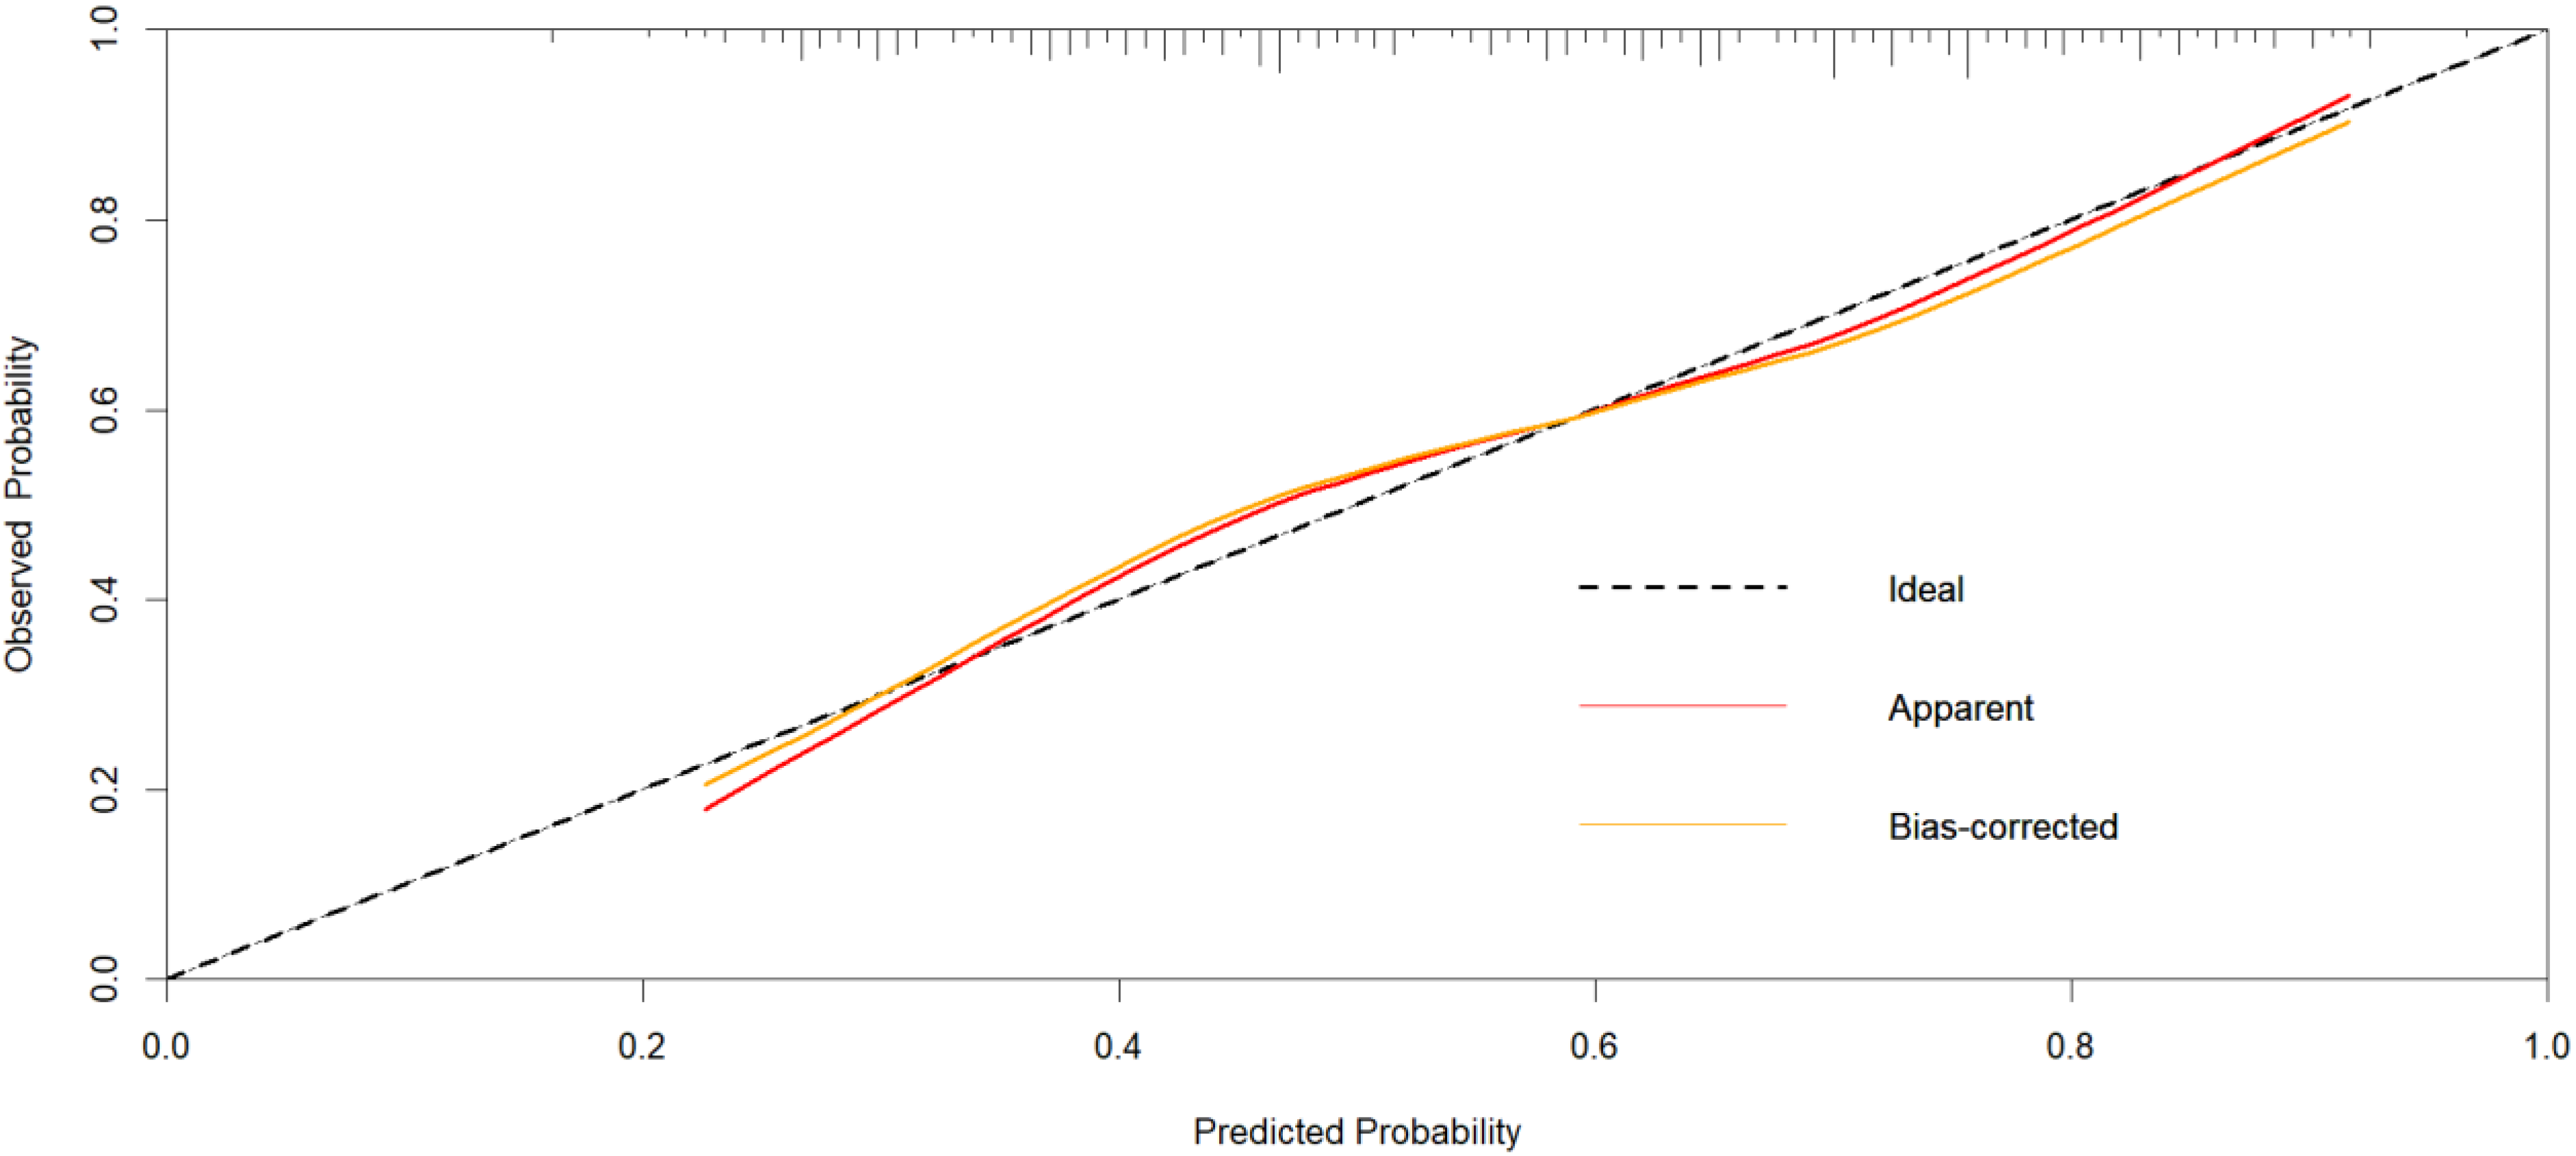
The Ideal curve represents the ideal curve, the Apparent curve represents the prediction model curve, and the Bias-corrected curve represents the model curve obtained in this study after resampling, and the closer the two lines are to the ideal curve indicates that the model prediction effect is better and the accuracy is higher. The result of the Hosmer-Lemeshow test was χ2 = 4.592, p = 0.800 (p > 0.05).
The DCA indicated that when the threshold probability of the occurrence of VCI ranges from 21% to 92%, the net clinical benefit of the application of the model is obviously higher, which suggested that the VCI risk prediction model constructed in this study had a high practical value in clinical application (Figure 7).
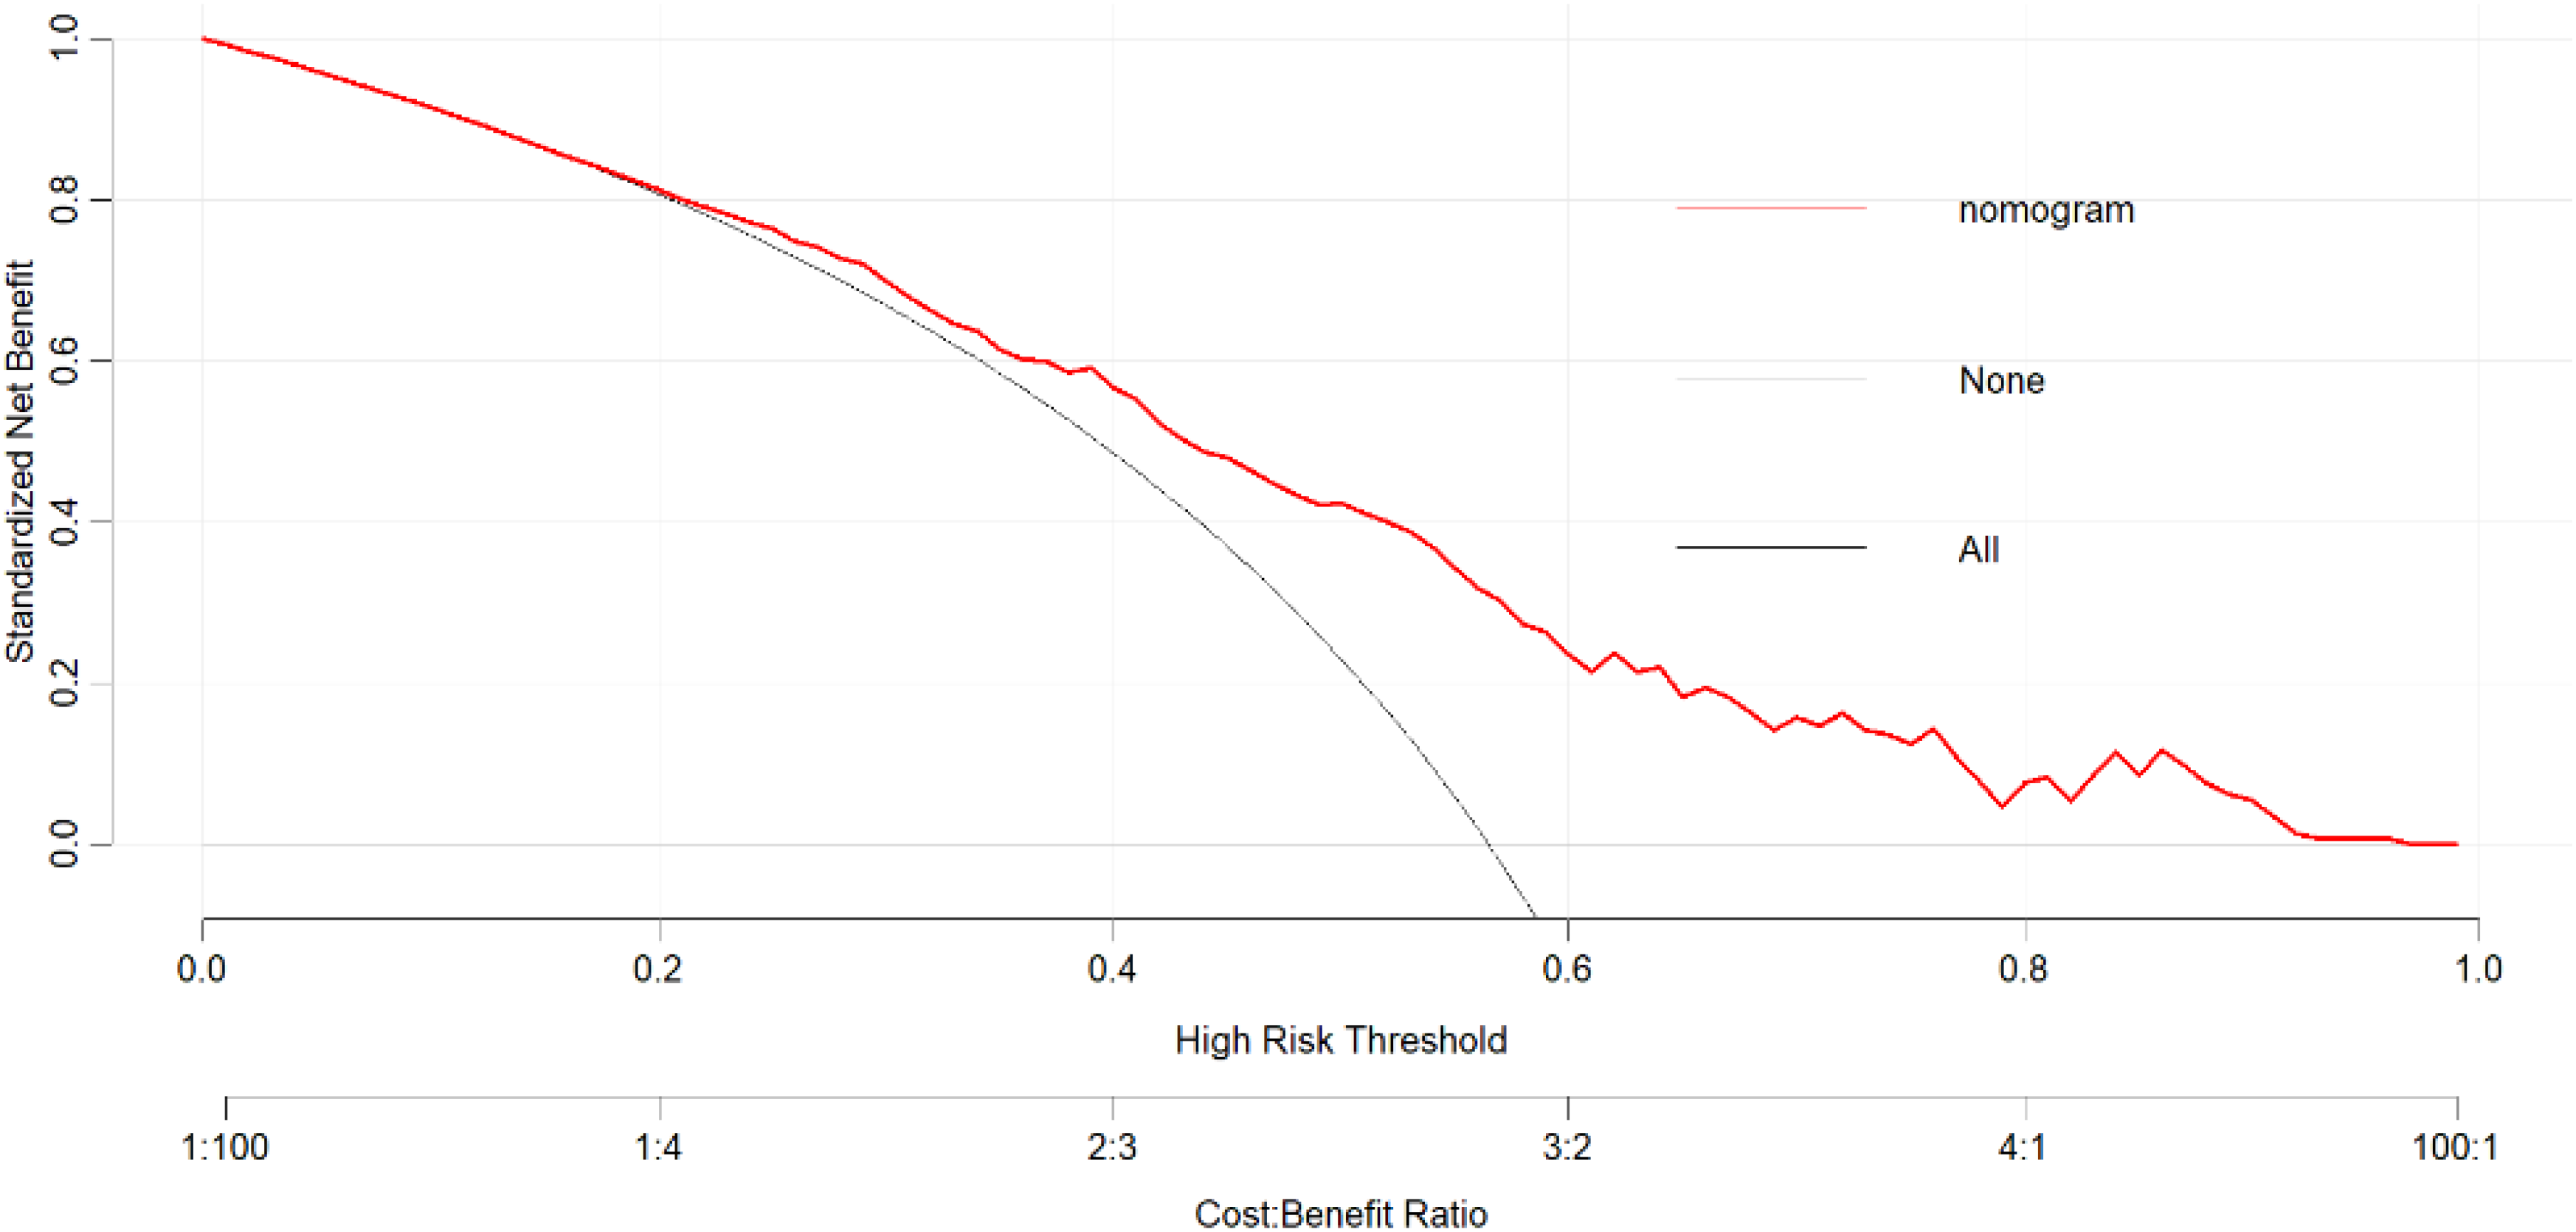
The results showed that the red curve was the DCA curve of the prediction model of this study, which indicated that the higher the red line was than the two extreme lines, the higher the benefit was. when the threshold probability of the occurrence of VCI ranges from 21% to 92%, the net clinical benefit of the application of the model is obviously higher.
Discussion
In this study, ferritin, serum iron, serum total iron binding capacity, transferrin, unsaturated iron binding capacity, and transferrin saturation were measured by ELISA and iron colorimetry to investigate iron metabolic disorder in the VCI population. We found that there were statistically significant differences between the VCI group and the normal cognitive group in terms of age, education, history of stroke, hemoglobin, ferritin, serum iron, CSVD total load scores, and the presence of cerebral microbleeds (p < 0.05). Compared with the control group, serum iron levels were significantly reduced and ferritin levels significantly increased in the VCI group. The risk of VCI was found to increase significantly with increasing serum ferritin levels, indicating the presence of an iron metabolic disorder among the VCI population, which is consistent with the hypothesis. We developed and internally validated the nomogram based on serum ferritin, CMBs, education, and CSVD total load scores to predict the probability of diagnosis of VCI. Calibration curves, ROC curves, and DCA curves were employed to assess the differentiation and accuracy of the model. The results demonstrated that the model exhibited excellent accuracy and discriminative ability, as well as clinical applicability. A personalized nomogram has been used to provide individualized diagnostic and treatment strategies for VCI.
Ferritin and VCI
Disorders of serum iron metabolism have been linked to the onset of oxidative stress, mitochondrial dysfunction, and inflammatory processes, which can subsequently lead to alterations in neurological, vascular, and endothelial function, thereby accelerating the pathological changes in CSVD and VCI. 21 Although only serum ferritin had a significant correlation with the diagnosis of VCI and was an independent predictive factor, iron metabolism appears to be involved in the pathogenesis of VCI. In addition to being an iron storage protein, serum ferritin is also a protein of the acute phase response. 11 Therefore, the presence of inflammatory, malignant, or malnutritional conditions can elevate ferritin, and it is necessary to combine inflammatory markers like procalcitonin and CRP to rule out an inflammatory state. Patients with serious infectious diseases were excluded from this study. In an experiment to investigate whether elevated ferritin in AD is related to inflammation including CRP. It was found that there was no significant correlation between the two. Moreover, after adjusting for CRP variables, the increase in ferritin levels remained significant in the early stages of AD, suggesting that changes in serum ferritin in the early stages of AD may occur before overt hippocampal atrophy and cognitive impairment, and may not only be involved in the inflammatory mechanism. As inflammatory indicators were not directly included in this experiment, and SOD and MAO did not have significant statistical significance.
Serum and cerebrospinal fluid (CSF) ferritin levels can indirectly reflect cognitive impairment. 22 Several studies have shown that ferritin can dynamically regulate brain iron levels and prevent neurotoxicity from excessive iron deposition. For example, serum ferritin is significantly elevated in AD and can track the disease changes with Aβ and tau proteins. 23 Davalos and colleagues 24 found a strong correlation between elevated serum ferritin within the first 24 h and poor prognostic outcomes in acute ischemic stroke patients. As an independent risk factor for the development of VCI, serum ferritin may be related to nutritional status, neuroinflammatory activation, and endothelial cell dysfunction, suggesting that it can be used as a clinical indicator. To explore the ability of the MoCA scale to differentiate between different stages of dementia, the correlation between different cognitive domains and ferritin needs to be further analyzed. There is a U-shaped risk curve for iron. 25 Whether serum ferritin has a dose-dependent relationship in the prediction of VCI risk and its optimal diagnostic threshold is still unclear. Therefore, we suspected that there may not be a simple linear relationship between serum ferritin and VCI, and statistical analyses such as trend testing should be required by using larger sample sizes. Cicero et al. 26 assessed the iron concentration in different biological samples (serum, plasma, and CSF) and found significant differences between the three groups. Ferritin in CSF is regarded as a valuable alternative marker for the assessment of cerebral iron deposition and can predict the progression of diseases such as AD and VCI. 22 Because of the invasive procedures of CSF sampling, this study focused on the use of conveniently collected serum samples and discovered that serum ferritin was a key predictor in the VCI diagnostic model.
Elevated serum ferritin is associated with risk factors for VCI such as hypertension, lipid disorders, and elevated blood glucose. 27 There is a significant positive correlation between ferritin and insulin resistance and the progression of T2DM, suggesting that elevated levels of serum ferritin can be used as a predictor of the risk of developing T2DM.28–31 By influencing cholesterol levels through the induction of insulin resistance, interfering with lipid oxidative stress, and increasing the expression of proinflammatory cytokines, 32 Insulin has a role in the regulation of serum ferritin transcription and iron utilization in peripheral tissues. 33 A study has demonstrated that ferritin can also serve as a predictor of dyslipidemia. Li et al. 34 found that increased triglyceride levels and decreased HDL-C levels were associated with higher serum ferritin levels, after adjusting for other confounders such as age and BMI. Elevated ferritin levels release ROS to cause lipid peroxidation, leading to triglyceride accumulation and increased free fatty acid levels. Simultaneously, excessive lipid accumulation also produces excessive ferritin, exacerbating abnormal lipid levels.35,36 Hypertension is usually characterized by chronic inflammation and damage due to oxidative stress. Serum ferritin levels cause vascular endothelial inflammation and damage through the oxidative stress response. It is an independent risk predictor of atherosclerosis and indirectly increases the risk of hypertension. 37 Although stratified analysis was not performed in this study to explore the relationship between serum ferritin and glycolipid-related indicators, iron metabolism, may be involved in the pathophysiological mechanism of the above risk factors as a key factor in energy metabolism disturbances. At present, indicators related to serum iron metabolism have not been widely used in predictive models for the diagnosis of VCI. We hypothesized that increased VCI risk is associated with serum ferritin levels. The possible explanation is that increased oxidative stress, and mitochondrial dysfunction cause the broken of the blood-brain barrier, cerebral microvascular endothelial dysfunction, and activation of the neuroinflammatory response, which directly or indirectly influence the pathological changes of VCI through VCI risk factors.
Other iron metabolism indicators and VCI
Extensive research has been conducted into the predictive value of serum iron in adverse events. A cross-sectional study of 8682 individuals discovered a significant negative association between serum iron levels below 131 μg/dL and the risk of atherosclerotic cardiovascular disease.38,39 Previous studies have shown that iron deficiency in the serum and brain is associated with cognitive dysfunction. 8 Although there was a significant difference in serum iron levels between the two groups in this study, the established predictive model did not include serum iron. This may be related to confounding factors of peripheral blood iron ion concentration and sample size. Serum iron deficiency has also been found in AD, suggesting that serum iron may have been reduced in the prodromal stage of AD.40,41 A study examined the relationship between serum iron levels and cognitive impairment in acute ischemic stroke, they found that serum iron levels were significantly lower in the stroke group, and lower serum iron levels were independently associated with an increased incidence of post-stroke cognitive Impairment. 42 These results suggested that an increase in serum iron levels may act as a protective factor and delay cognitive decline in VCI. Furthermore, elevated unsaturated iron-binding capacity has been identified as a potential predictor of T2DM. In a model of cerebral ischemia/reperfusion injury, it was observed that the cerebral ischemia-hypoxia state resulted in the overexpression of DMT1 and upregulation of transferrin and the transferrin receptor leading to deposition of iron content in the brain. 43 Ficiarà et al.11,22 found some correlation between serum transferrin levels and cognitive performance in MCI and AD patients. In this experiment, no statistical difference was found in the VCI group. This may be related to the different stages of dementia in the subjects. Iron metabolism in the peripheral may serve as a valuable biomarker of the development of neurological disorders according to these results.
CMBs, iron metabolism, and VCI
CMBs indicate cerebral microvascular injury, which increases the risk of cognitive impairment and neurodegeneration in the pathogenesis of VCI. 44 The incidence of CMBs and luminal infarcts in the cerebellum and other regions is significantly increased in VCI patients.45,46 The severity of cognitive impairment is closely related to the location, size, and number of CMB lesions, and the specific mechanism may be related to damage to the conduction fibers of the deep and cortical-to-white matter. 47 A study of 3979 normal older adults revealed a significant association between the number of CMBs over five and MMSE scores in multiple cognitive domains, especially in the region related to processing and motor speed. 48 This highlights the important role of CMBs in the pathogenesis of cognitive impairment independently of other CSVD imaging markers. VCI has been documented to occur in up to 21%–70% of cases between three months and one year after ischemic stroke. A five-year follow-up study focused on 4759 elderly individuals aged 45 years or older indicated that the occurrence, number, and location of CMBs were associated with an increased risk of secondary ischemic stroke and cognitive impairment. 49 These findings suggest that the presence of CMBs may serve as a prognostic indicator for long-term cognitive outcomes in patients who have experienced ischemic stroke. 48 Consistent with the previous results, we discovered statistically significant variations in the frequency, location, and value of CMBs as an independent predictor for VCI patient diagnosis between the two groups. It has been demonstrated that the presence of imaging changes such as cerebral white matter hyperintensities and CMBs, in conjunction with the vascular risk factors, is predictive of a significant increase in the risk of VCI.
Studies of the relationship between serum iron metabolism and CSVD imaging are limited. There is a significant relationship between CMBs and iron content in the frontal and basal ganglia regions associated with executive functioning and iron levels.50,51 It was found that an increase in iron content after disruption of brain iron metabolism in the CSVD population and there was no significant correlation between ferritin, iron, TIBC, and the severity of CMBs compared to the control group. 46 The discrepancy between the results of this study and previous studies may be related to different inclusion criteria of subjects. We speculated that the risk of CMBs is increased by the elevated level of serum ferritin. We also found that there was a statistically significant difference in hemoglobin levels between the two groups. Low hemoglobin not only reflects anemia but can also easily cause the brain to be in a state of ischemia and hypoxia, leading to dementia, especially in the areas related to executive function most severely affected. MRI imaging showed that white matter structural connectivity, cerebral hypoperfusion, and CMBs are the pathophysiological basis of the relationship between hemoglobin, iron metabolism, and cognitive function. 52 Increased brain iron content in specific regions may result from inflammation, blood-brain barrier permeability, iron redistribution, and changes in peripheral iron metabolism. 8 These factors can cause excessive iron uptake and improper release from cells, potentially damaging neurons and cerebral micro-vessels. 53 We hypothesized that it might be more likely to show signs of CMBs on MRI, which would worsen cognitive dysfunction. In a study with more than 4 years of follow-up, more than 4 CMBs were found to be significantly associated with cognitive decline, with an OR score of 2.02 after adjustment for age, sex, and education.44,49 This study also found that CMBs were an independent risk factor for VCI after adjustment for confounders (OR = 2.020), indicating that CMBs have become an important risk factor for the early stage of AD and the occurrence of VCI. Another study found that CMBs did not have a significant effect on patients with AD, which may be related to the inclusion of the population. 54
The detection rate of CMBs depends on the MRI technology. 3TMRI can be used to assess CMBs in SWI sequences to differentiate between the abilities of normal elderly people, MCI, and AD. It has been reported that approximately 40% of patients with MCI may have CMBs on SWI, while 65% of cases have CMBs detected on post-mortem histopathological examination. This suggests that clinical MRI underestimates the number of CMBs on pathology (with a false negative rate of 18%-48%). This study utilized 3 T SWI, which might have certain errors in the detection of CMBs. High-field strength MRI, such as 7 T, optimizes the echo time of nuclear magnetic resonance, avoids artefacts that reduce image characteristics, and is more sensitive to iron deposition in blood and brain. One study evaluated the intrinsic contrast and resolution of 7 T MRI and determined the value of high field strength SWI sequences in patients with AD by detecting CMBs. 55 In addition, magnetic sensitivity mapping (QSM) can accurately and quantitatively measure the volume of cerebral microbleeds, especially in deep white matter nuclei (in the basal ganglia). One study compared the noise properties, image uniformity, and structural contrast of CMBs quantified in QSM images acquired at 3 T and 7 T MRI and found that the noise level of 7 T QSM is low. 56 Excess iron was detected in the putamen, hippocampus, and thalamus of VCI patients with CMBs by using quantitative magnetic sensitivity mapping. 57 Therefore, we speculated that the increase in serum ferritin levels may increase the risk of VCI and CMBs. CMBs may indirectly reflect the imbalance of iron homeostasis in the brain, which requires statistical methods such as mediation analysis and expands the sample size to further analyze the relationship between brain iron deposition, CMBs, and VCI.
Other prediction factors and VCI
Enhancing diagnostic accuracy in VCI patients requires the integration of multimodal imaging and other clinical variables, such as age and vascular risk factors, because of the complex and diverse character of VCI pathophysiology and clinical. Although age was not found to be an independent risk factor for VCI in this study, there is increasing evidence that age as an uncontrollable factor can gradually impair brain iron homeostasis and cognitive impairment. 8 As menopause occurs and serum estrogen levels fall, iron loss in older women is relatively low and serum ferritin levels gradually rise. 53 Selecting middle-aged and older people may help to avoid this and make the results more accurate. Additionally, low educational attainment represented an independent risk factor for the development of patients with VCI in our study. This finding aligned with previous evidence indicating a positive correlation between higher levels of education and cognitive performance on tests of cognitive function. 58 Moreover, individuals with higher levels of education may possess a superior capacity for neural reserve within the brain network, enhancing resistance to brain damage within impaired neural pathways including inflammatory processes. This capacity serves an important protective function, potentially delaying the onset of cognitive decline. 59
Since VCI is a global brain disease, different imaging markers are associated and it is not comprehensive to consider only one specific marker. Therefore, when developing a predictive model for VCI patients, the total CSVD burden score should be considered, which can better represent the severity of cerebral microvascular dysfunction in VCI patients. Previous studies have demonstrated a significant positive correlation between CSVD total load scores and VCI. 60 In our study, we found that the CSVD total load scores were a significant predictor of patients with VCI, suggesting that it may be a potential biomarker for patients with VCI. Our findings supported the significant contribution of cerebral microvascular dysfunction to VCI and offered suggestions for further research into early diagnostic imaging indicators of the condition.
Strengths
To our knowledge, there have been no experimental studies on the role of serum ferritin as a potential hematological marker for the detection of cognitive impairment in the normal elderly population. Our research suggested the value of serum ferritin in the diagnosis of cognitive impairment in VCI, which may help to identify the preclinical stage of AD and is more economical and feasible than the detection of pathological markers by PET and CSF. Our research results also revealed the disorder of metal, especially iron ion balance in the body during the VCI stage, providing a deeper understanding of the clinical pathogenesis of VCI. In the meantime, the relationship between ferritin and the CMBs was discussed in depth in our research. We proposed that the disturbance of iron homeostasis in the brain is also manifested in the peripheral area during the VCI stage. Compared to the control group, serum ferritin was significantly increased. This reflected the destruction of tissue iron stores. In summary, this study first included relevant indicators of serum iron metabolism and constructed and internally validated a clinical prediction model. The factors in the model are less subject to subjective factors and collected through simple blood tests, imaging data, and a brief questionnaire format, thus enhancing the reliability of the established predictive model. This model was constructed not only to explore the correlation between serum ferritin and the probability of VCI but also to examine the relationship between serum ferritin and the incidence of CMBs. The nomogram had excellent discriminative ability, accuracy, and clinical applicability, which is beneficial for the early identification and management of risk factors for VCI.
Limitations and future directions
However, there are some limitations to this study: firstly, the prediction model conducted in this study was internally validated using bootstrapping in the absence of an external dataset. This can be solved by the establishment of sub-centers for external verification. Secondly, the sample size included in this study was relatively small, which may have resulted in differences in the results for different geographic populations. Given the established link between inflammation, iron metabolism, and VCI, the statistical analyses did not fully consider the role of inflammatory markers as covariates. Unknown confounding factors such as lifestyle and genetic background also affect the risk of developing VCI. For example, APOE ε4 carriers may be associated with cognitive decline in VCI through increased ferritin levels. 23 In the future, we need to expand the enrolled population and include indicators that can directly reflect the inflammatory state (such as CRP) and the status of susceptible genes to minimize the interference of confounding factors. Imaging techniques such as QSM will need to be incorporated to achieve quantitative measurement of cerebral iron deposition, thereby discovering the relationships between peripheral indicators of iron metabolism, cerebral iron deposition, and VCI, and identifying other clinical predictive factors for VCI patients.
Perspective for future studies and practical implications
This was the first nomogram model to include serum iron metabolism indicators in VCI patients, taking into account CMBs and CSVD total burden score. Our study suggested that there is some disturbance in peripheral iron metabolism in the VCI population, which is closely associated with CMBs. The clinical diagnostic model developed provides clinical insight into the early detection and management of VCI and is a powerful tool for identifying individuals at risk and developing tailored intervention strategies. It is extremely important to find safe, effective, and widely applicable treatments for the clinical management of VCI. Some small clinical trials have suggested that iron supplementation is a potential therapeutic strategy to improve cognitive function. The correlation between abnormally elevated brain iron and diseases such as VCI provides a rationale for the utilization of iron chelators as a second-line therapeutic modality. 22 For instance, the efficacy and safety of deferiprone in mild AD and the early stages of VCI have been demonstrated, with high-dose oral administration proving to delay cognitive decline in patients. 2 However, iron chelating agents are characterized by high dose requirements and non-specific tissue distribution, which may affect pharmacokinetics and metabolism. Further clinical trials are needed to determine the optimal therapeutic dose. In the future, the new iron chelator is being developed as a new therapeutic strategy for diseases associated with metal deposition in the central nervous system, such as VCI.
Conclusion
In conclusion, the significant increase in peripheral ferritin indicates the presence of iron metabolism disorders in the VCI population and provides a theoretical basis for identifying specific therapeutic targets for VCI. The nomogram based on serum ferritin, CMBs, education level, and total CSVD burden scores can predict the risk of VCI in middle-aged and elderly people. The predictive nomogram has good discriminatory ability, calibration ability, and clinical applicability. Prospective research and external validation are needed in the future to improve the stability of the model.
Footnotes

Ethical considerations
This study was approved by the Ethics Committee of Hebei General Hospital and conducted in accordance with the Declaration of Helsinki (No.2024391).
Consent to participate
All participants gave informed consent. According to the national legislation and the institutional requirements, this study did not require written informed consent.
Author contributions
Funding
The authors disclosed receipt of the following financial support for the research, authorship, and/or publication of this article: We thank the grants from Scientific and Technological Innovation 2030-Major Project Subject of “Brain Science and Brain-inspired Research” (grant number 2021ZD0201807) and Natural Science Foundation of Hebei Province (grant number H2020307042).
Declaration of conflicting interests
The authors declared no potential conflicts of interest with respect to the research, authorship, and/or publication of this article.
Data availability statement
The data supporting the findings of this study are available on request from the corresponding author. The data are not publicly available due to privacy or ethical restrictions.