




Abstract
Background
We have previously reported that a subset of nuclear-encoded mitochondrial genes involved in mitochondrial biogenesis was differentially expressed in Alzheimer's disease (AD) brains. These were associated with compromised biological pathways of mitochondria such as mitochondrial morphology, fragmentation, transmembrane potential and neuronal cell death.
Objective
To use an array of energy production genes to determine whether expression changes compromise mitochondrial function and other important biological processes or pathways impacting the development of AD.
Methods
RT2-PCR arrays were used to assess expression of mitochondrial energy production genes in AD brains. A subset of genes of interest was identified using Ingenuity Pathway Analysis. Expression values from this filtered group of genes were included in a mathematical model being developed to identify potential therapeutic targets for AD.
Results
A majority of these genes was downregulated in AD brains. These AD-related gene expression changes were seen to affect a number of biological functions and pathologic conditions, including synthesis of ATP, generation of reactive oxygen species (ROS), and nerve cell viability. Most importantly, UQCRC1, an essential component of RCIII that is also involved in efficient assembly of the mitochondrial respirasome, was identified by our array analysis and, subsequently implicated by inclusion in our mathematical model to be a potential therapeutic target.
Conclusions
There are significant gene expression changes in a small number of nuclear-encoded mitochondrial genes involved in energy production in AD brains. These affect ROS and nucleotide synthesis and pro- and anti-inflammatory pathways and reflect the mitochondrial dysfunction associated with neuronal cell death and AD.
Keywords
Introduction
Alzheimer's disease (AD) is the most frequent cause of adult dementia, affecting 6.7 million people 65 years of age and older in the US alone in 2023. 1 This represents a 27% increase since 2010. Although the pathophysiological mechanisms responsible for AD have not been fully elucidated, it is clear that AD has both genetic and behavioral roots. 2 At the genetic level, three genes—APP (amyloid precursor protein),3–7 PSEN1 (presenilin 1),8,9 and PSEN2 (Presenilin 2) 10 —have been shown to cause AD and a fourth, APOE (Apolipoprotein E), has been shown to be a major risk factor in the development of AD.11,12 In fact, the amyloid precursor protein and its improperly processed products, e.g., amyloid-β (Aβ)42, have been at the center of efforts to find effective therapeutics for the treatment of AD.13–15 However, an alternative hypothesis related to mitochondrial dysfunction has become an active area of inquiry for development of additional therapeutic approaches.
The role of dysfunctional mitochondria in the development of AD has been, in part, suggested by defects in respiratory complex activities and expression. In 1990, Parker et al. 16 reported that cytochrome c oxidase (Respiratory Complex IV or RCIV) activity was 30% lower in platelets isolated from AD patients than in controls. This reduction in COX activity was confirmed in AD brains in a subsequent study by Kish et al. 17 and others.18,19 In 2008, Liang et al. 20 reported that AD cases had significantly lower expression of 70% of the nuclear genes encoding subunits of the mitochondrial electron transport chain (ETC) in the posterior cingulate cortex, 65% of those in the mid temporal gyrus, and 61% of those in the hippocampus.
More recently, in a single nuclei RNA seq study, Mathys et al. reported alterations in the expression of the RCI component NDUFAB1 21 while Wan et al., using a meta-analysis of the human brain transcriptome from AD patients, found gene expression changes in multiple genes involved in the ETC and the TCA cycle. 22 These and related observations of mitochondrial dysfunction have led to a “mitochondrial cascade” hypothesis for sporadic AD.23–25
Further evidence for a role of mitochondria in AD pathogenesis comes from studies of the interactions of Aβ within mitochondria of AD brains. In brain tissues of AD affected subjects, Aβ protein precursor localized with the mitochondria fraction, associated to TOM40 and TIM23, 26 in a translocation-arrested manner, that may prevent import of de novo synthesized nuclear-encoded mitochondrial proteins, such as subunits of the ETC. Using APP/PS1 mice, de la Cueva et al. 27 showed that defective mitochondrial dynamics in the brains of the mice reflected early events in the disease progression. These authors used a transgenic mouse model of AD to show that mitochondrial Aβ accumulation increased mitophagy and increased gene expression and oxidative damage. This and other studies suggest that the risk for developing AD is linked to expression of mitochondrial and metabolism-relevant genes. 24 Together these observations suggest that dysfunctional mitochondria are more consistent with a causative role rather than a consequential role in AD. This further strengthens the belief that a mitochondrial cascade features prominently in AD. With this in mind, we have undertaken the analysis of expression of a focused set of nuclear-encoded mitochondrial genes related to specific, essential mitochondrial functions in the brains of AD patients.
We have used RT2-Profiler PCR Arrays containing 84 nuclear-encoded genes that are directly or indirectly associated with energy production by the mitochondrion. Using bioinformatics analysis, we have identified a short list of five genes of interest (GOIs). This small group of genes affects the generation of energy (ATP), the production of reactive oxygen species (ROS), pro- and anti-inflammatory signaling pathways, and the vitality of neurons and neurologic disease. Although these observed gene expression changes and associations found via pathway enrichment analyses do not demonstrate a causative relationship between altered mitochondrial gene expression and phenomena such as ROS generation, ATP synthesis, and altered NADH oxidation, they provide strong rationale to speculate that these observed changes are linked. In a companion paper, 28 these expression data were incorporated into a mathematical model for AD that is being developed by our group. One of these genes, UQCRC1, was found to be critical to the proper assembly of the mitochondrial respirasome in AD brains, identifying UQCRC1 as a possible therapeutic target for AD treatment.
Methods
Reagents
All primers used in the qPCR analysis were purchased from OriGene Technologies (Rockville, MD, USA). The sequences of all qPCR primers are listed in Supplemental Table 1.
Sample acquisition
Autopsy-confirmed brain samples were kindly supplied by Dr W. W. Tourtelotte of the National Neurological Research Specimen Bank (NNRSB), VAMC, Los Angeles, CA 90073. Tissue/fluid specimens obtained from the NNRSB are sponsored by NINDS/NIMH, National Multiple Sclerosis Society, Hereditary Disease Foundation, Comprehensive Epilepsy Program, Tourette Syndrome Association, Dystonia Medical Research Foundation, and Veterans Health Services and Research Administration, Department of Veterans Affairs; Dr Peter Davies of the Department of Pathology at Albert Einstein College of Medicine, New York, NY; Dr Deborah C. Mash, University of Miami Brain Endowment Bank, Miami, FL; and the NIH NeuroBioBank at the University of Maryland, Baltimore, MD, the University of Miami, the Harvard Brain Tissue Resource Center, the Mt. Sinai Brain Bank, and the University of Pittsburgh.
The Eastern Virginia Medical School Institutional Review Board (IRB) has determined that use of these autopsy frozen brain samples is exempt from IRB review.
Brain mRNA isolation and assessment
Total RNA was isolated from approximately 150–225 mg of frozen brain tissue from the parietal cortex of 12 age-matched samples—6 control and 6 AD subjects—as described. 29 The control and AD samples had average ages of 69.3 and 73.2 years, respectively. Total RNA was isolated using RNeasy Plus Universal Mini kits per manufacturer's instructions. The twelve brain samples used for the array analyses are described in Table 1. Isolated RNA was quantitated by UV absorbance at 260 nm. The integrity of the isolated RNA was defined by RNA Integrity Numbers (RINs) determined by capillary electrophoresis using Agilent Nano1000 Bioanalyzer chips or by agarose gel electrophoresis. One AD sample, 4420, had a poor RIN. It was an important sample because it possessed a mtDNA mutation of interest to our lab. Although the RIN was low, that sample passed quality testing for subsequent RNA seq analysis and so we included it in our array analysis as well.
AD and control brain samples used for array analysis.
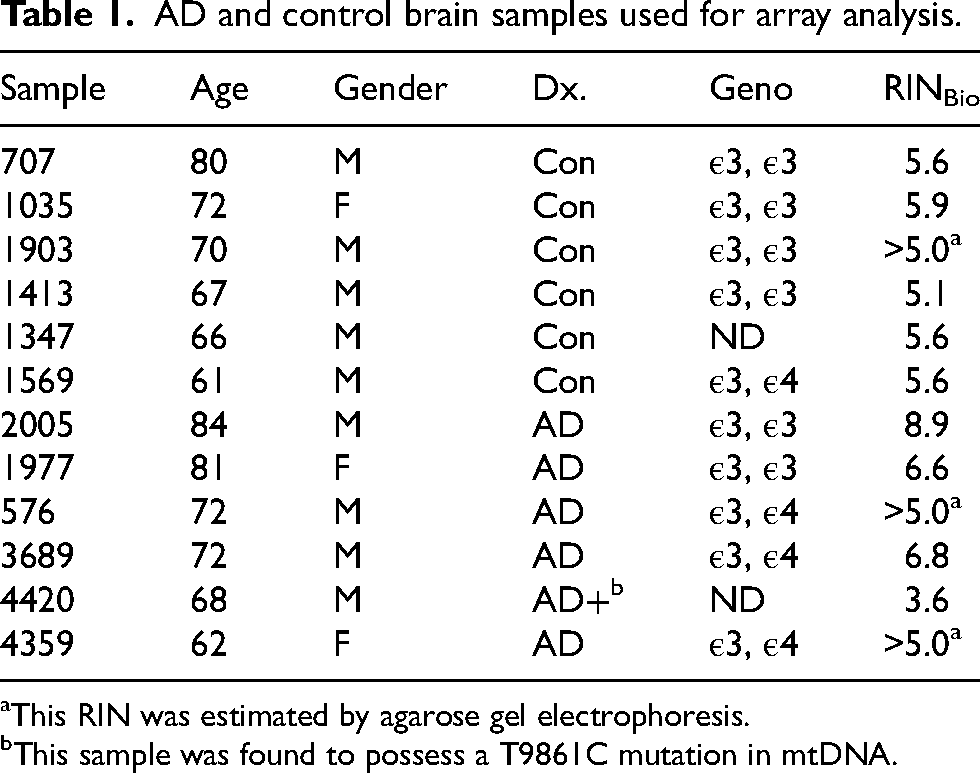
This RIN was estimated by agarose gel electrophoresis.
This sample was found to possess a T9861C mutation in mtDNA.
Mitochondrial energy producing gene expression analysis
The Qiagen RT2-Profiler Human Mitochondrial Energy Production PCR Array consisting of 12 controls and 84 nuclear encoded genes used sequence specific primers to amplify the corresponding cDNA strands in a 96-well plate configuration. A list of the genes in the array is shown in Supplemental Figure 1. Relative changes in SYBR green fluorescence were used to assess levels of gene expression using a Bio-Rad CFX96 thermocycler. All arrays were run in triplicate.
qPCR analysis
Verified qPCR primers for each of the GOIs and several housekeeping genes were obtained from OriGene Technologies along with that company's reverse transcription and PCR amplification kit. These GOIs were identified by Qiagen and IPA analysis to have gene expression changes of ±2.5 or greater. In addition, the GOIs had to be associated with multiple disease pathways and dysfunctions. Following the manufacturer's recommended protocol, qPCR reactions were performed in triplicate using 10 ng input total RNA in each reaction. Due to limited sample quantity, we prepared a pool of RNA isolated from 8 AD (average RIN = 6.2) and 10 control (average RIN = 6.2) brain samples. In order to demonstrate the broader relevance of the gene expression changes observed, none of the brains used for these control and AD pools were from the group of brains used to generate the RT2-PCR Array data. A list of the brains used to constitute these pools along with their individual RIN scores is shown in Supplemental Table 2.
The concentration of each RNA pool was adjusted to 200 ng/µl with equal representation of each sample in each pool. Triplicate reactions were run in a Bio-Rad CFX96 thermocycler using SYBR green fluorescent dye incorporation to monitor real-time PCR product formation. Cts were obtained for genes of interest and our housekeeping gene (HPRT1) and ΔΔCt ratios were calculated. Primer efficiencies were determined for each primer pair for both the control and AD-RNA pools. These were used in the Pfaffl equation
30
to calculate fold changes in expression, where
In the above equation, EGOI is the amplification efficiency of the gene of interest; EHPRT1 is the amplification efficiency of the HPRT1 housekeeping gene; ΔCt, GOI (control –AD) is the Ct of the gene of interest in the control sample minus the Ct of the gene of interest in the AD sample, and ΔCt, HPRT1 (control –AD) is the Ct of the housekeeping gene HPRT1 in the control sample minus the Ct of the housekeeping gene HPRT1 in the AD sample.
Assay for DNA damage by ROS
ROS levels in our frozen brains were indirectly assessed using an assay of ROS-induced DNA damage that results in production of 8-OHdG (an oxidized form of deoxyguanine). We used a kit from Epigen Tek and followed the manufacturer's recommendations. Total DNA was isolated from 5 control and 4 AD brain samples using a Qiagen DNA Isolation kit according to manufacturer's instructions. The recovered DNA was quantitated using a Nanodrop spectrophotometer. Aliquots of 200 ng of DNA were used for each assay, which was performed in duplicate. The assays were performed in a 96 well plate per manufacturer's instructions. After a 30-min incubation at 37 °C, the assays were read at 450 nm using a plate reader. The relative percentages of 8-OHdG in the control and AD samples were calculated according to manufacturer's instructions.
Assessment of pro- and anti-inflammatory pathway markers
We utilized qPCR to assess expression levels of inflammatory and anti-inflammatory pathway markers. Preparation of pools of RNA from control and AD brains were prepared as described above, as were the qPCR assays themselves. Two markers of the inflammatory pathway, IL1β and CCL2, and two markers of the anti-inflammatory pathway, CD163 and IL1R2, were selected and qPCR-tested primers for these genes were obtained from OriGene. cDNA, prepared from our RNA pools described above, was used as template for these qPCR reactions run in triplicate. Fold-changes were determined by the ΔΔCt method.
Statistical and IPA analysis
Qiagen software was used to generate data on fold-changes in expression and p-values when AD and control brain expression levels were compared. Further analyses of networks, biological processes, and disease associations were performed using Ingenuity Pathway Analysis (IPA) software. IPA fold change calculations (gene expression ratios) were calculated using the classic, well-established, and widely adopted ΔΔCT method originally published. 31 The p-value is calculated based on a Student's t-test of the replicate 2–ΔCT values (or linearized normalized gene expression levels) for each gene in each Control and AD Group comparison. The p-value calculation used is based on parametric, unpaired, two-sample equal variance, two-tailed distribution. No statistical analysis was performed on the qPCR data since sample pools were used.
The networks, functional analyses, etc. were generated through the use of QIAGEN IPA using published algorithms. 32 Canonical pathways analysis identified the pathways from the QIAGEN IPA library of canonical pathways that were most significant to the data set. The significance of the association between the data set and the canonical pathway was measured in two ways: (1) A ratio of the number of molecules from the data set that map to the pathway divided by the total number of molecules that map to the canonical pathway is displayed; and (2) A right-tailed Fisher's Exact Test was used to calculate a p-value determining the probability that the association between the genes in the dataset and the canonical pathway is explained by chance alone. In many cases, a z-score was also calculated to indicate the likelihood of activation or inhibition of that pathway. Similarly, the right-tailed Fisher's Exact Test-generated p-values and a z-score were calculated for disease and functional analyses of the entire data set. Finally, graphical representations of the molecular relationships between molecules were generated in which molecules are represented as nodes, and the biological relationship between two nodes is represented as an edge (line). All edges are supported by at least one literature reference or from canonical information stored in the QIAGEN Knowledge Base. The intensity of the node color indicates the degree of up-(red) or down-(green) regulation.
Results
Isolation and evaluation of total RNA from frozen AD and control brains
Total RNA was isolated from six control brains (five males, one female; avg. age 69.3) and six AD brains (four males, two females; average age 73.2) (Table 1). The integrity of the RNA samples was assessed using agarose gel electrophoresis or Bioanalyzer capillary electrophoresis. The RINs were estimated by Bioanalyzer software to range from 3.6 to 8.9 (Average RIN for control and AD brain RNA being 5.5 and 6.0, respectively).
Gene expression changes in AD samples compared to controls
Examination of the gene expression data by software provided by Qiagen for analysis of RT2-Profiler Arrays indicates expression of a number of the 84 genes queried is altered when AD brains are compared to controls. All of the genes that were up- or downregulated by more than 2.5-fold are included in Table 2.
Top up- and downregulated genes in AD brain samples.
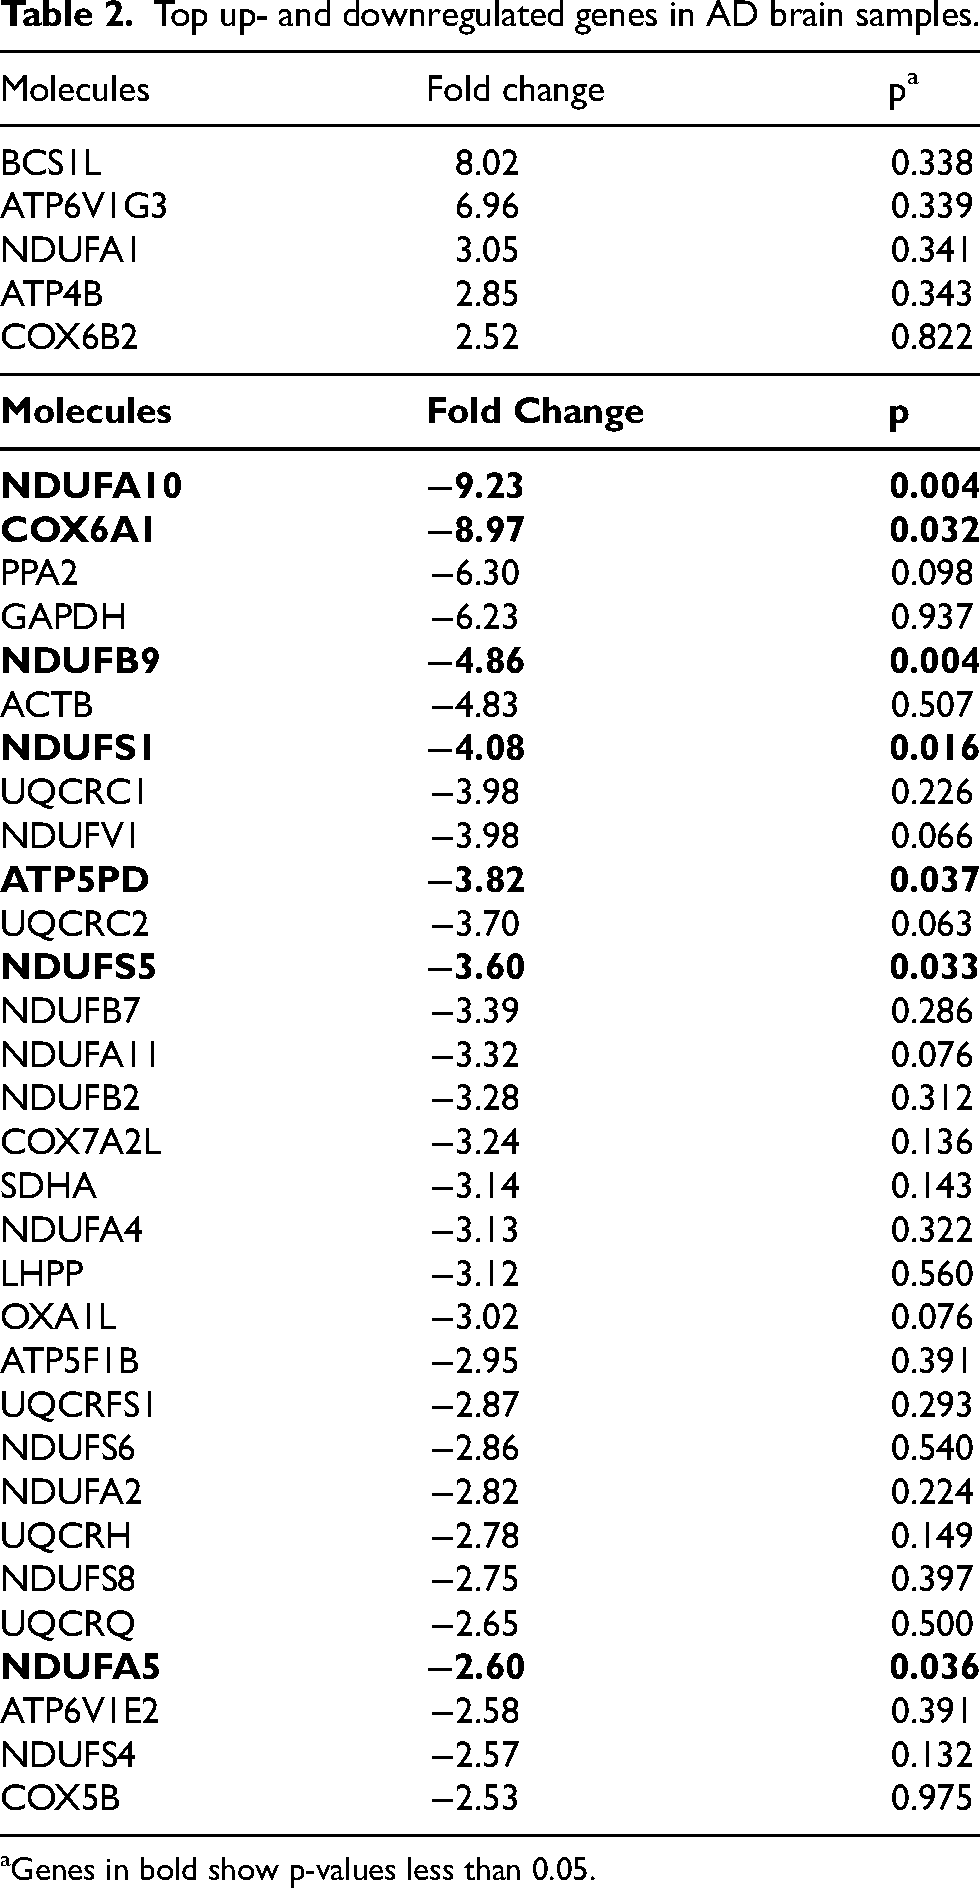
Genes in bold show p-values less than 0.05.
The greatest changes in gene expression were seen with the downregulated genes. A group of RCI subunits showed a significant downregulation, ranging from −2.57-fold for NDUFS4 to −9.23-fold for NDUFA10. In addition, the RCIV subunit, COX6A1, showed the second greatest reduction in gene expression within the electron transport chain in the AD samples, being downregulated −8.97-fold. ATP5PD, also identified as ATP5H, a subunit of RCV, the ATP synthase, was downregulated by −3.82-fold. Finally, the important carbohydrate metabolism enzyme, GAPDH, showed a downregulation of more than 6-fold. Due to the limited number of brain samples included in this study, the majority of the genes in Table 2 did not achieve p-values of statistical significance. Of the 31 downregulated genes in the AD brain cohort, seven had p-values less than 0.05. These were NDUFA10 (p = 0.004), COX6A1 (p = 0.032), NDUFB9 (p = 0.004), NDUFS1 (p = 0.016), ATP5PD (p = 0.037), NDUFS5 (p = 0.033), and NDUFA5 (p = 0.036) (these are highlighted in red font in Table 2). Other genes not reaching statistical significance, had p-values ranging from 0.975 (COX5B) to 0.063 (UQCRC2).
Five genes showed an upregulation greater than 2.5-fold. One is a subunit of RCI (NDUFA1; 3.05-fold), two are subunits of RCV (ATP6V1G3 and ATP4B, 6.96 and 2.85-fold, respectively) and one is a subunit of RCIV (COX6B2, 2.52-fold). Interestingly, the ubiquinol-cytochrome c reductase RCIII chaperone BCS1L was the most upregulated of the genes in this subset (8.02-fold).
Canonical pathways
The five most significant canonical pathways related to our differentially expressed gene (DEG) set are shown in Figure 1(a). The primary canonical pathway impacted by the DEGs in this study was Oxidative Phosphorylation (OXPHOS) with a Z-score of −6.38, and a p-value of 4.67 × 10−154. Sixty-nine or 62.2% of the genes queried in our energy array were found to be among the 111 genes identified in this canonical pathway. As seen in Figure 1(b), there is a general inhibition of the entire ETC (pale green color) with reductions in RCI and RCV activity resulting in a significant reduction (dark blue color) in the oxidation of NADH (decrease in NAD+ production) and ATP generation, respectively.
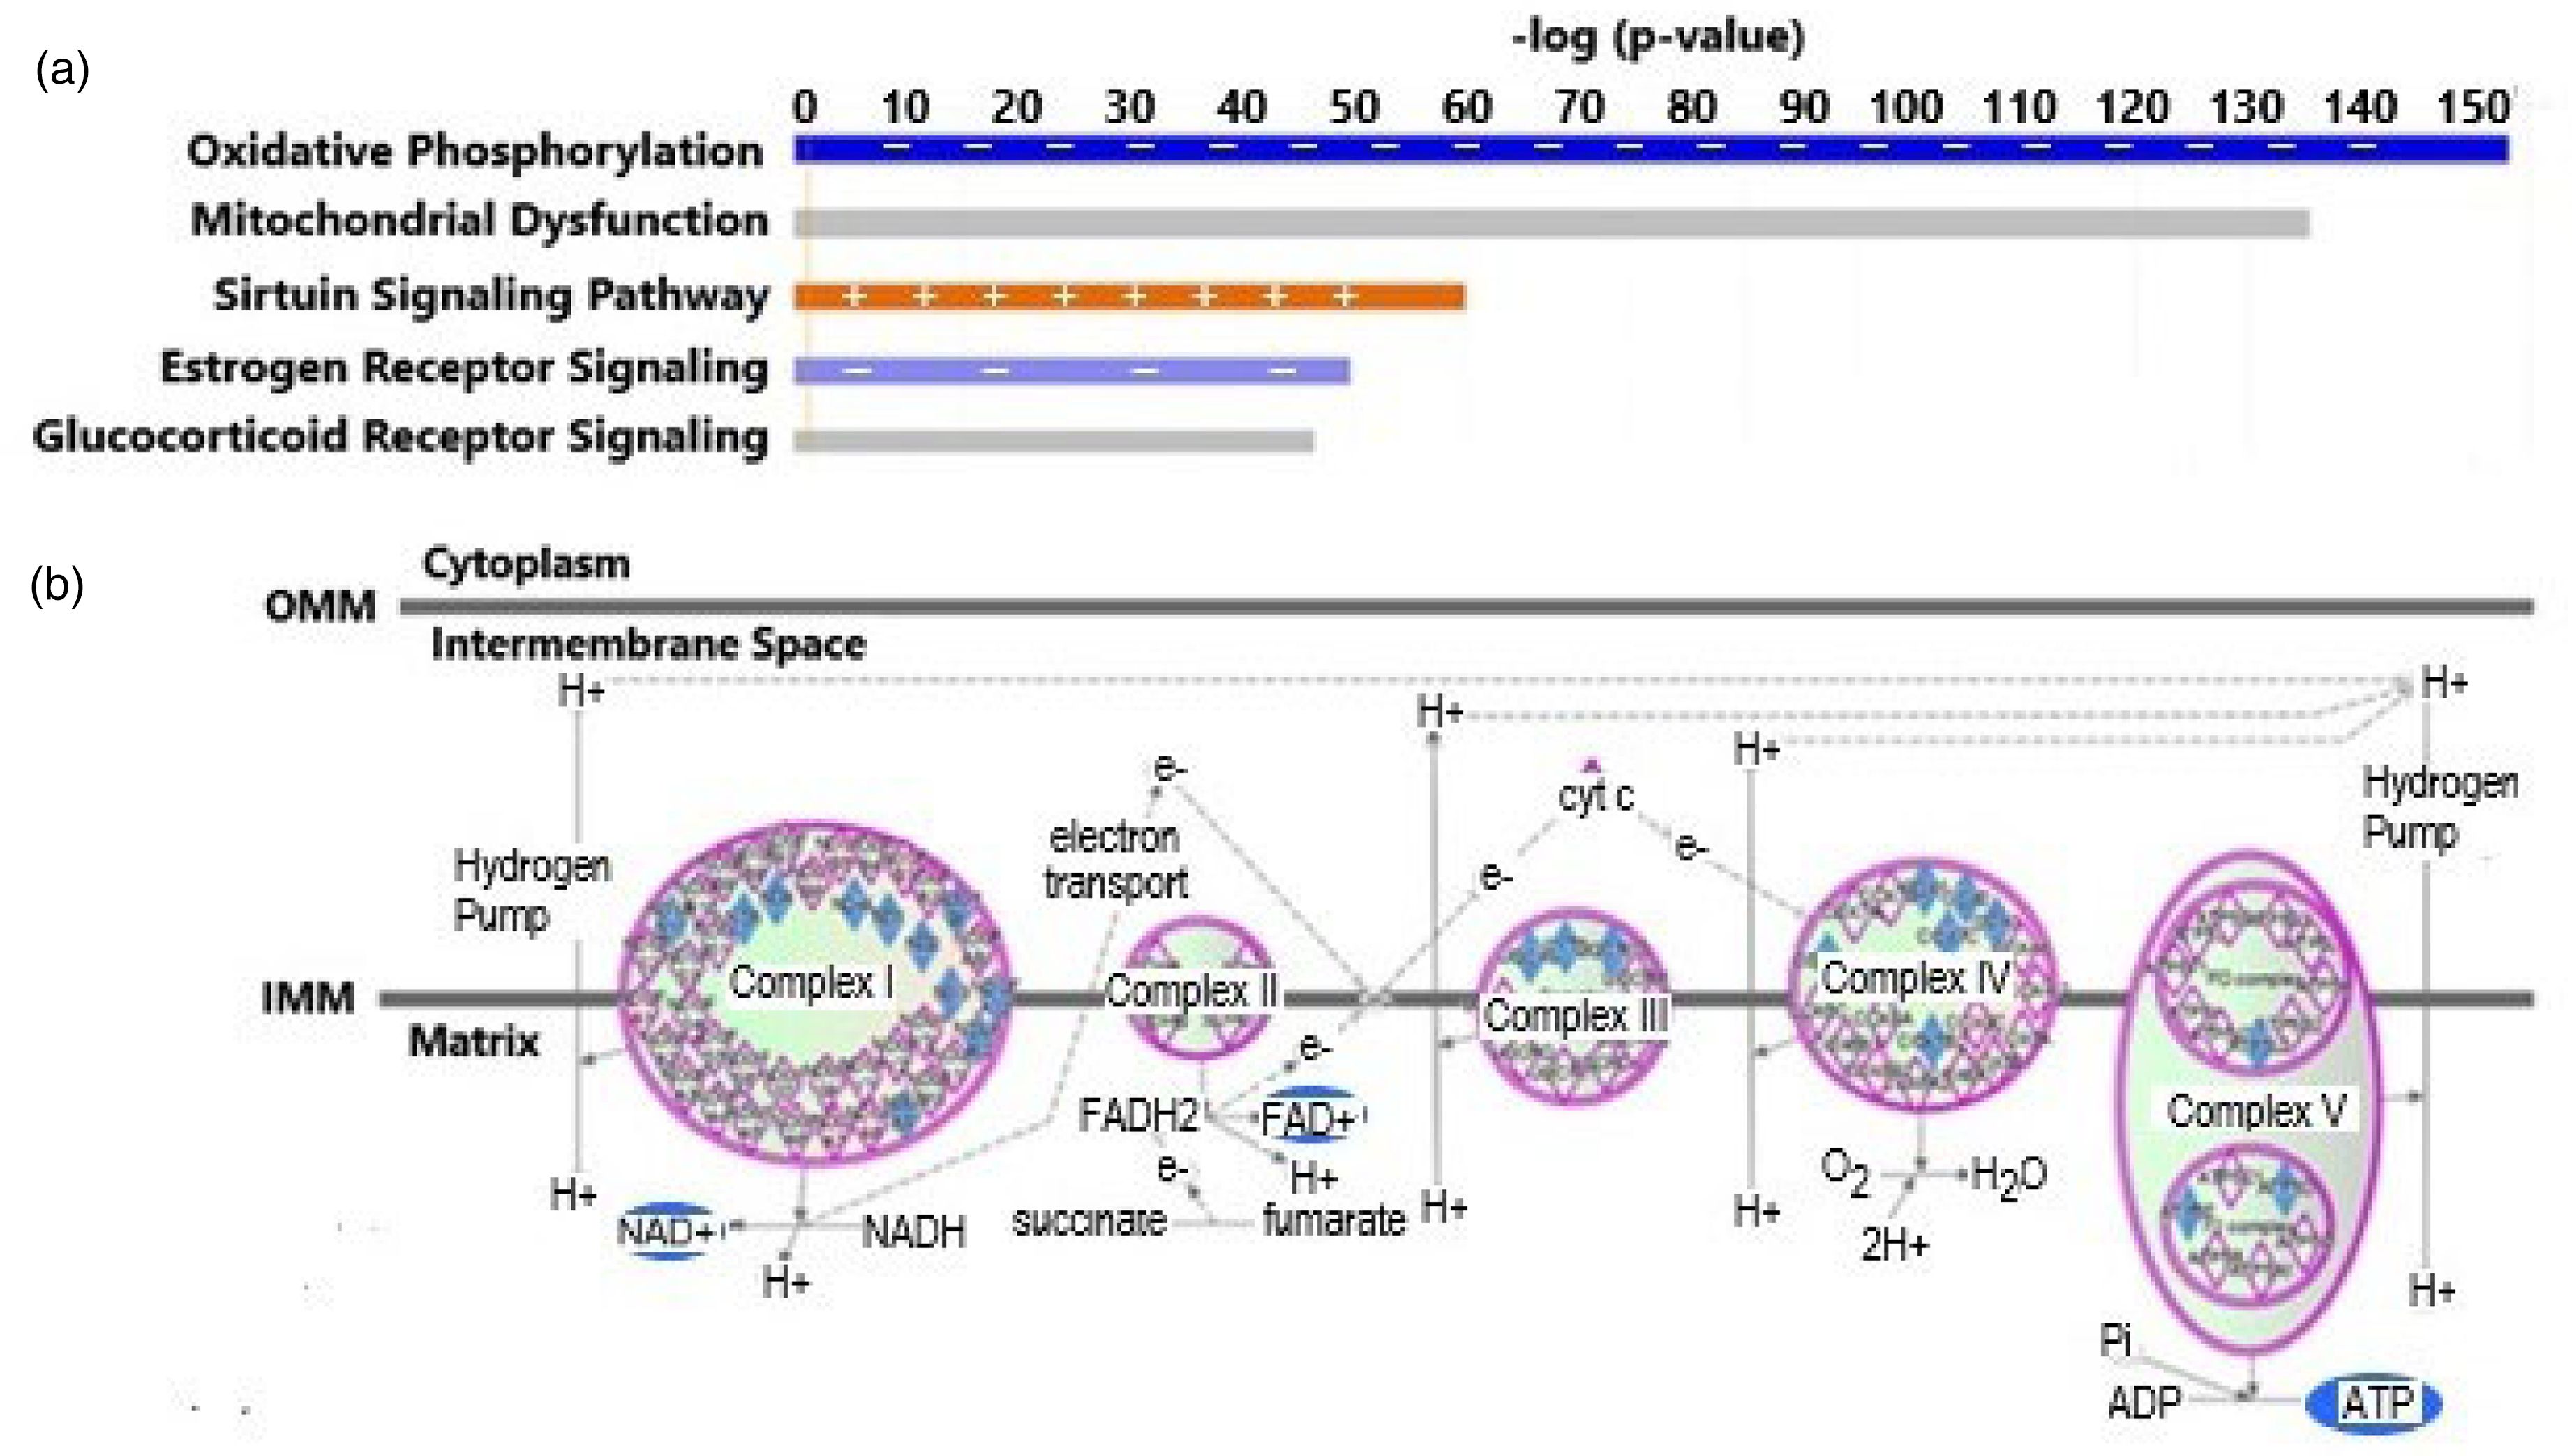
(a) Top 5 canonical pathways associated with our dataset. The horizontal bar shows the significance of the pathway as determined by –log (p-value). The orange (with +'s) and blue (with -‘s) colored bars indicate predicted pathway activation or predicted inhibition, respectively, via another statistic: the z-score. Gray bars indicate pathways that are constructed in such a way that no activity prediction can be made. (b) Schematic diagram of the top canonical pathway, Oxidative Phosphorylation, associated with our gene set. The green (light) and blue (dark) colors reflect an inhibition of the activities of each of the respiratory complexes or their subunits to a lesser or greater extent, respectively. Colors are visible in the online version. OMM: outer mitochondrial membrane; IMM: inner mitochondrial membrane.
In agreement with the negative impact on oxidative phosphorylation, the next most significant canonical pathway was Mitochondrial Dysfunction which had a p-value of 4.57 × 10−136 with 40.4% (69 of 171) genes associated with mitochondrial dysfunction being among those queried in our energy array. In our previously published study of genes related to mitochondrial biogenesis, 29 we also found OXPHOS and mitochondrial dysfunction as highly ranked canonical pathways.
Two other pathways with very significant associations to DEGs in our mitochondrial energy array were the Estrogen Receptor Signaling (ERS) and Glucocorticoid Receptor Signaling (GRS) pathways. The ER signaling canonical pathway had a p-value of 1.77 × 10−50, Z-score of −3.000 and a ratio of genes of 10.8% (42/409). In addition, the GR signaling pathway had a p-value of 3.8 × 10−47, with a ratio of 7.6% of our DEGs associated with pathway-linked genes (44/581).
Reconfiguring the display of the canonical pathway results as a bubble diagram in Figure 2, we found that there were strongly significant relationships (p-values > 10−130) of pathways involved in the generation of precursor metabolites and energy (NAD+, ATP) as well as to disease-specific and toxicity pathways. There were also strong associations (p-values 10−40 to 10−65) of our DEGs to intracellular and second messenger signaling, nuclear receptor signaling, and transcriptional regulation.

Bubble chart showing pathway categories (Y-axis) versus the negative log of the Fisher's exact right-tailed p-value (x-axis). The blue (with -‘s) and orange (with +’s) bubbles represent negative and positive values (by z-scores), respectively, while gray bubbles reflect no activity pattern determined. Colors are visible in the online version.
Does our dataset influence signaling pathways linked to mitochondrial function and AD?
With major impacts on mitochondrial dysfunction and OXPHOS, our DEGs would be expected to also influence signaling pathways that are sensitive to mitochondrial function and energy (ATP) production. As indicated in Figure 1(a), the Estrogen Receptor Signaling Pathway (ERSP) is inhibited by gene expression changes in our dataset. Estrogens can bind to estrogen receptors ERα and ERβ as well as the G-protein coupled receptor GPER1 to modulate transcriptional control of mitochondrial activity. 33 Our dataset impacts the ERSP resulting in a significant decrease in mitochondrial biogenesis via depression of OXPHOS, as seen in Figure 3.

The estrogen receptor signaling pathway. This is a partial display of the pathway that focuses on the most direct impact on the process of oxidative phosphorylation and mitochondrial function and biogenesis. The pale green color reflects the moderate down regulation of the OXPHOS pathway, while the darker blue color reflects the strong inhibition of mitochondrial biogenesis. Colors are visible in the online version.
Similarly, the genes in our dataset stimulate a pro-inflammatory response in the AD brains so as to impact the Glucocorticoid Receptor Signaling Pathway, which strongly influences the inflammatory response. Conversely, our dataset also acts to significantly decrease the anti-inflammatory response. The major effect of these DEGs on mitochondria in this pathway is to reduce OXPHOS, which results in a decreased mitochondrial biogenesis. This result agrees with our previously published study on the effect of altered mitochondrial gene expression on mitochondrial biogenesis in the AD brain. 29
Figure 4 shows that our mitochondrial energy production DEGs are associated with an activation of the inflammatory response as well as an inactivation of the anti-inflammatory response in AD brains, as mediated via the Glucocorticoid Receptor Signaling Pathway. It should be noted that, although the canonical pathway depiction of the GRSP in Figure 1(a) indicates that expression data for our geneset could not predict an activated or inhibited canonical pathway, that conclusion is based upon a calculation utilizing z-scores. The Pathway view shown in Figure 4 does not necessarily use z-scores but a molecule activity predictor (MAP) algorithm that calculates activity predictions on individual nodes based on neighboring molecules, thus giving rise to predictions of activation or inhibition of pathway constituents.
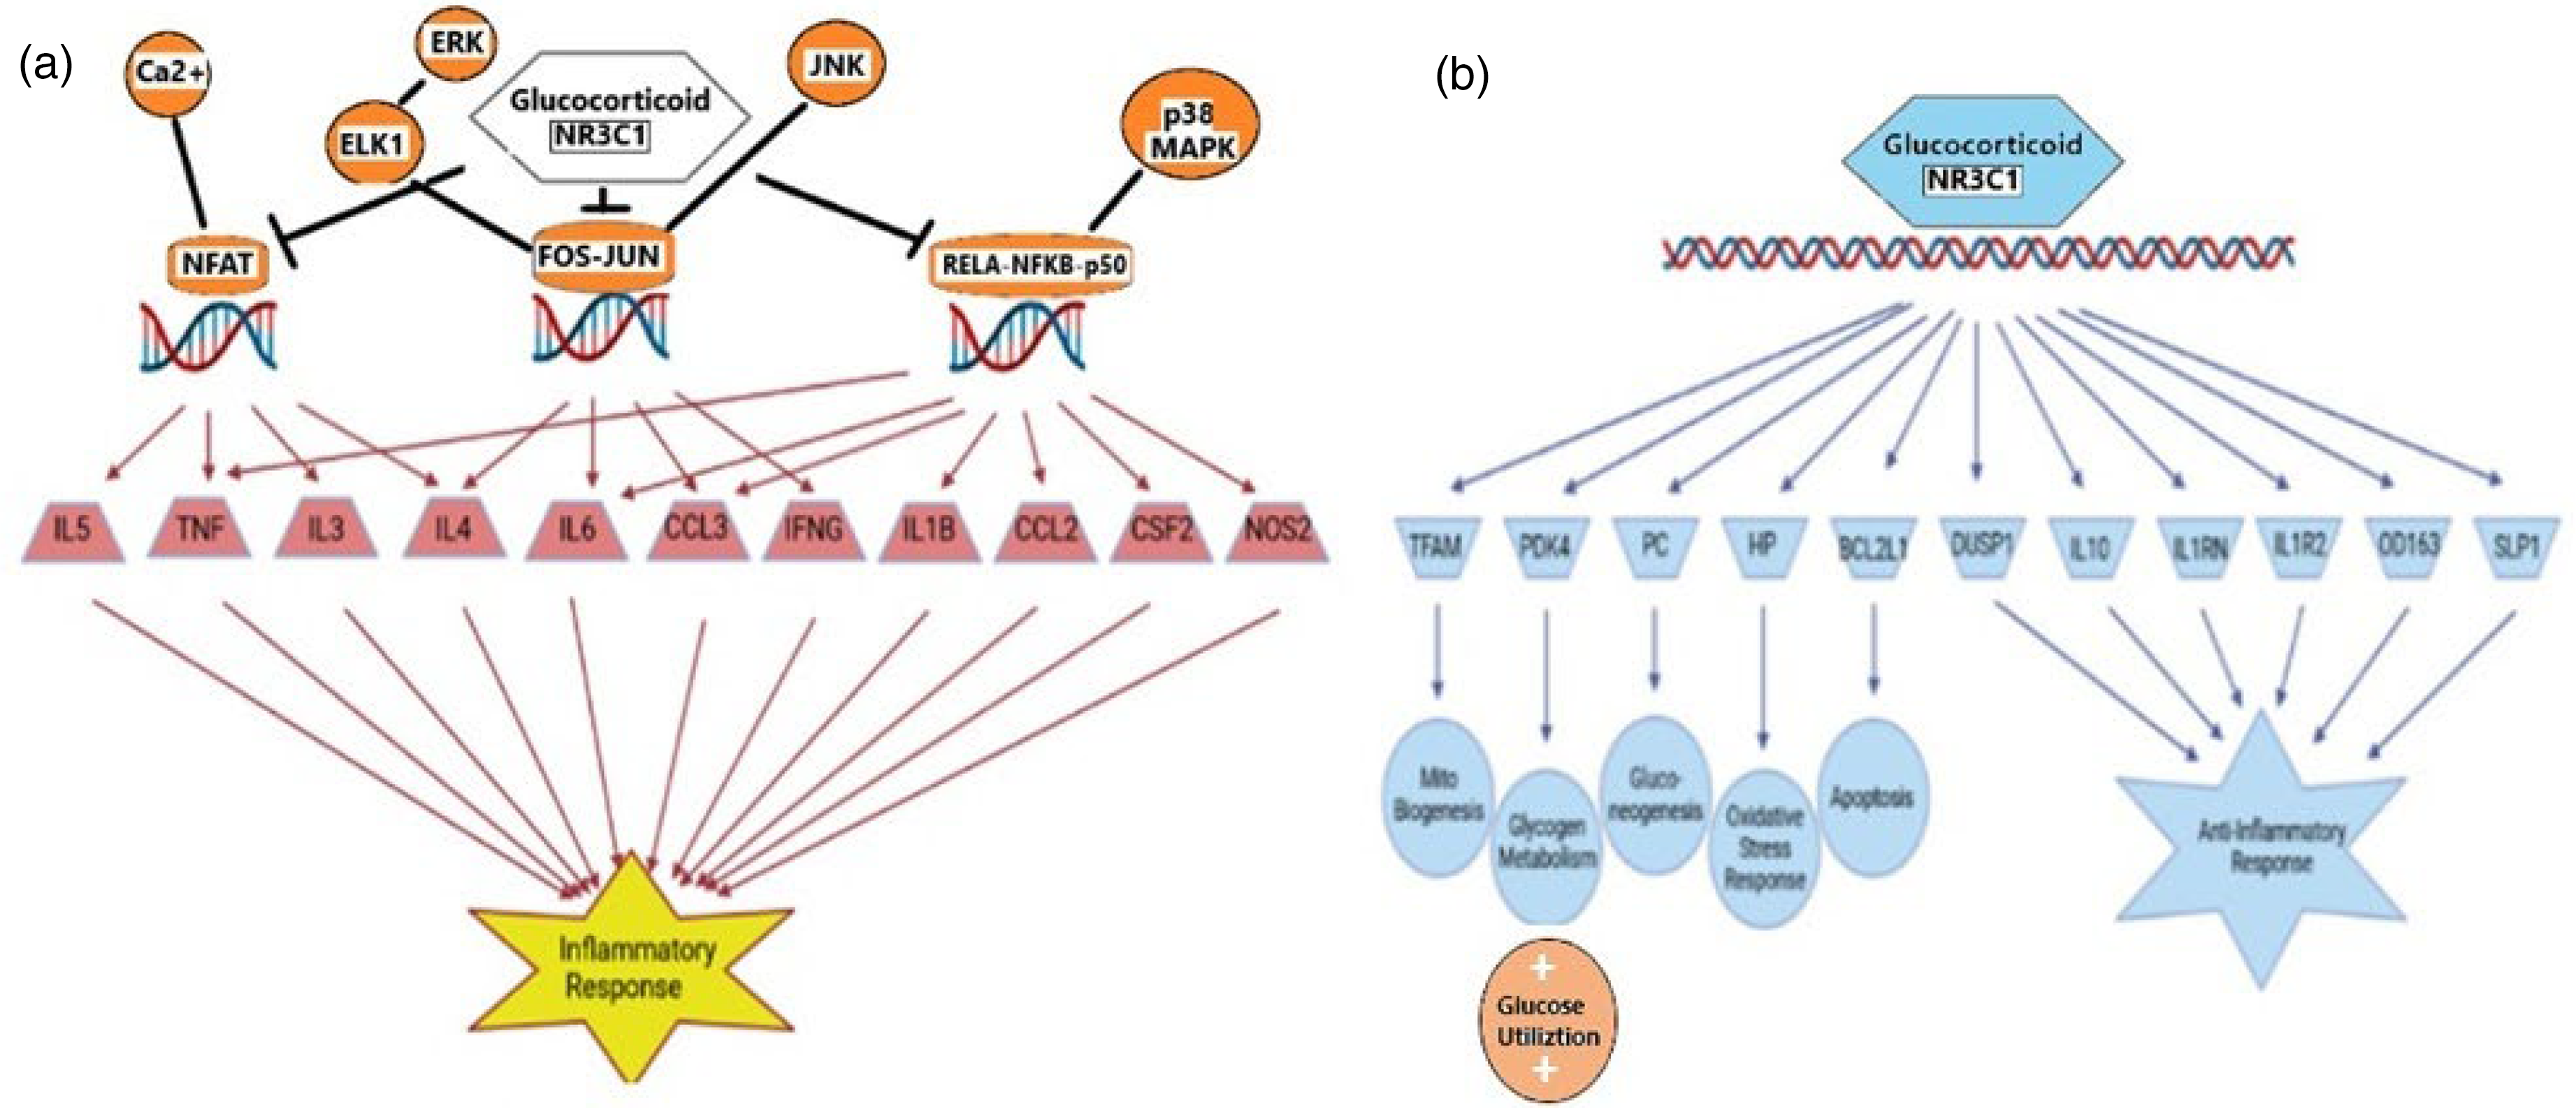
Effect of expression differences in our gene set on the
Furthermore, as seen in Figure 4(b), there is a general decrease in OXPHOS leading to significant decreases in mitochondrial respiration with other reductions in expression of specific genes decreasing mitochondrial biogenesis, glycogen metabolism, and gluconeogenesis. At the same time, there is a shift to increased glucose utilization, resembling changes seen with the Warburg effect. In addition to the reduced anti-inflammatory response genes, there is a reduction in the oxidative stress response in AD brains.
Do these gene expression changes result in increased pathological changes in mitochondrial or cellular functions?
These gene changes not only affect the canonical pathways above, but they also can lead to pathologic changes in a variety of biological processes and to various diseases. Our analysis identifies a number of diseases and biological processes linked to our DEGs, where an activation Z-score of 2 or greater (2 or more standard deviations from the mean) is considered significant. Eight of the top diseases/biological functions linked to our DEGs are shown in Table 3. The synthesis of ROS and the metabolism of ROS are the two most positively activated processes (activation scores of 2.360 for each process). Given the samples in this study are AD brains, and given the observed impact of our DEGs on oxidative phosphorylation and mitochondrial dysfunction canonical pathways, it is not unsurprising to see that these DEGs lead to an increase in ROS synthesis and metabolism. Similarly, the most significantly decreased functions are cell viability of nervous tissue and stem cell lines (z-score of −2.333), synthesis of purine nucleotides (z-score, −2.219) and ATP (z-score −2.000) and infection of cells and infection by RNA viruses (activation score −2.038). Decreases in these processes would be expected with mitochondrial dysfunction and defective oxidative phosphorylation.
Top diseases/biological functions linked to our dataset by Z-score.

Table 4 catalogs the top diseases with which our DEGs correlate, according to p-value. It can be seen that energy production, nucleic acid metabolism, and neurological disease are among the most associated disorders/functions. In addition, our DEGs strongly correlate with cell signaling (as indicated by the ranked canonical pathways and bubble chart shown above), organismal injury, and psychological disorders. There is also an implication that the immune system is activated in these AD patients as indicated by the significant negative z-scores for Infection of cells and Infection by RNA viruses.
Top diseases/biological functions linked to our dataset by p-value.

What regulatory molecules impact the expression of the genes in our dataset?
There are a number of upstream regulatory molecules that can play major roles in the above-highlighted processes by influencing the expression of the molecules in our DEG subset. Table 5 contains 14 upstream regulators with z-scores greater than 3.0 plus p-values smaller than 10−25. TEAD1 has the greatest negative impact on its downstream targets (z-score −5.88, p-value 1.36 × 10−101) while RICTOR is the most positively affected regulator with a z-score of 6.04 and p-value of 3.17 × 10−137.
Upstream regulators with high activation scores and p-values.

Figure 5 shows the interaction of 5 of the 14 regulators in Table 5 with a subset of 10 DEGs identified by our array analysis. RICTOR is the most influential regulator of these genes as it directly impacts the levels of 9 of these 10 DEGs. All but two of the 10 DEGs were regulated by 3 or more of the upstream regulators in Table 5. NDUFA2, NDNUFB7, and COX6A1 were modulated by 4 of these regulators, while ATP5PD and NDUFB9 were impacted by 5. By far, UQCRC1, with 8 interactions, was influenced by the greatest number of these regulatory factors.
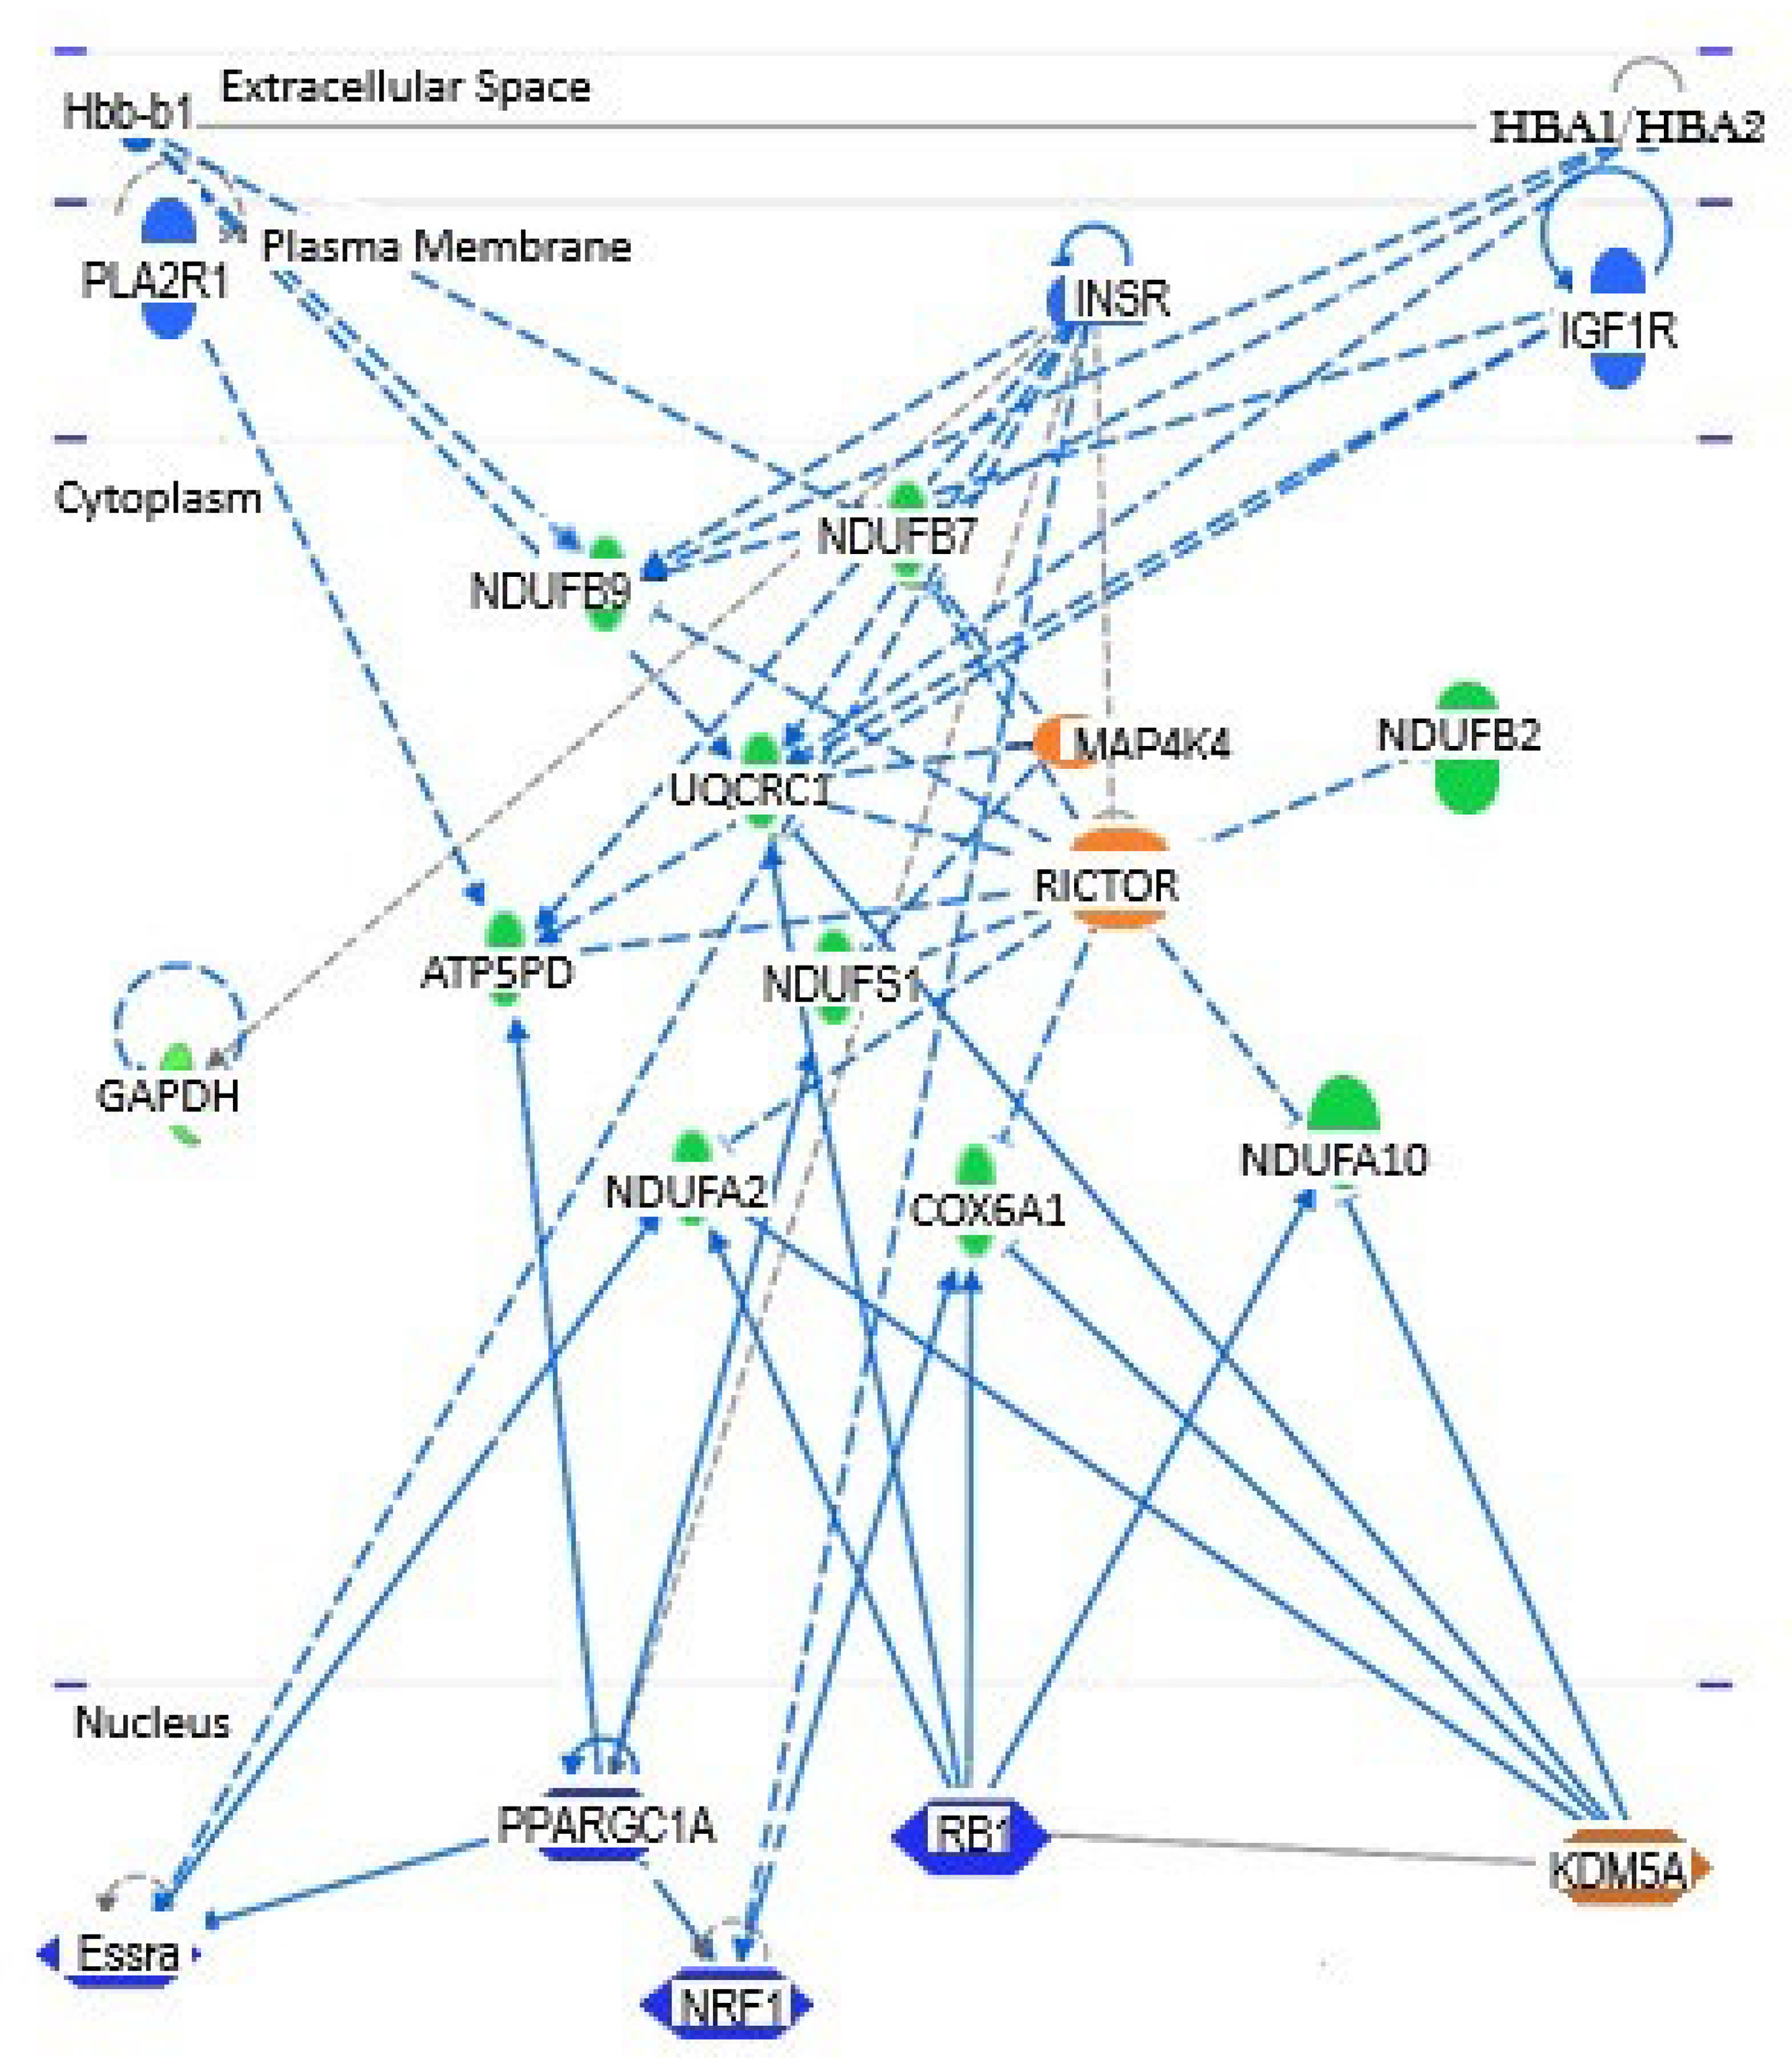
The major regulators influencing the expression of 10 DEGs identified by our PCR array analysis. Five of the regulators in Table 5 are involved in this network. Colors are visible in the online version.
Further filtering our dataset by IPA and qPCR analysis
Based upon the occurrence of our GOIs in different metabolic and disease pathways as well as their participation in multiple biological pathways, we were able to use IPA analysis to filter our GOIs to a subset of five genes: BCS1L, ATP5HD, UQCRC1, NDUFA10, and COX6A1. The predominant functions affected by the observed expression changes in these genes indicate that synthesis and metabolism of ROS, synthesis and metabolism of ATP, and neuroinflammation are three prominent processes that are impacted in a negative way to contribute to the development of AD.
To confirm the observed array expression changes and to possibly filter the list of genes further, we performed individual qPCR analyses on these five genes. The results in Figure 6(a) show that the direction of expression changes (up or down) observed in the array analysis are confirmed in the qPCR analysis. Comparing the array to qPCR data (Figure 6(b)) shows that, except for UQCRC1, the expression changes assessed by qPCR are reduced in affect by 59–80% compared to the fold-change levels found in the array analyses. For example, by PCR array analysis COX6A1 is seen to be downregulated in AD brains by almost 9-fold while qPCR analysis detects approximately a 3-fold downregulation for COX6A1. This is a 67% lower fold-change detected by qPCR. On the other hand, UQCRC1 is the only gene in this comparative analysis that shows a greater reduction of expression by qPCR, a more than 5 times greater reduction of expression than observed by array analysis. A caveat to the comparison of the array and qPCR analyses is that the array gene primers and the qPCR gene primers were not identical as the array primer sequences were proprietary to Qiagen.

Comparison of gene expression changes by RT2 PCR array and qPCR. (a) Bar graph Comparing fold-change of the 5 GOIs seen in RT2 PCR arrays to individual qPCR analysis. Blue Bars are fold-changes from array analysis and orange bars are from qPCR. (b) Tabular comparison of the quantified data in (a).
Although this information did not lead to a significant filtering in our list of GOIs, the large expression change seen with UQCRC1 did heighten our interest in this RCIII component as a potential therapeutic target.
To demonstrate the effects of our gene set on inflammatory and anti-inflammatory pathways more directly, we prepared tissue lysates from control and AD brain samples and measured the expression levels of markers of inflammatory (IL1β and CCL2) and anti-inflammatory (CD163 and IL1R2) pathways, in each. As seen in Figure 7(a), there was an upregulation in the inflammatory markers IL1β and CCL2 (2.17-fold and 7.36-fold, respectively). In response to this upregulation of the inflammatory pathway, two members of the anti-inflammatory pathway were also upregulated – IL1R2 (18.25-fold) and CD163 (2.79-fold). Both these genes are involved in regulating the levels of inflammatory cytokines and so their expression levels would be expected to be increased in response to upregulation of the inflammatory pathway as signaled by the increase in IL1β and CCL2. As a positive control for AD-related gene expression changes, we found that, as expected, MAPT gene expression was downregulated in AD brains relative to controls.

Gene expression changes and oxidative DNA damage in AD brains. (a) Changes in gene expression of cytokines in AD brains relative to control brain samples. IL1β and CCL2 are cytokines that regulate the inflammatory pathway, while IL1R2 and CD163 regulate anti-inflammatory pathways. MAPT codes for tau protein and is down-regulated in AD. (b) An increase in ROS and oxidative DNA damage is indicated by the increased relative amounts of 8-OHdG in DNA from AD compared to control brain samples. Data reflect triplicate determinations from 10 brain samples (5 AD and 5 controls).
With the inflammatory pathways activated in AD brains, a state of oxidative stress would be expected to challenge and compromise mitochondrial function leading to an increase in the generation of ROS. We looked at the impact of ROS in AD and control brains. It was not possible to directly measure ROS levels in samples that had been stored frozen for years in some instances. However, if, in fact, AD brains had been exposed to higher levels of ROS, it would be expected that more ROS-related damage would be found in the macromolecules within the neurons of AD brains. We chose to assess this by measuring the levels of 8-OHdG, an indicator of ROS-damaged (oxidized) DNA. Figure 7(b) shows the result. There is approximately a 250% increase in 8-OHdG in the DNA of our AD brains compared to the levels within control brain samples.
Discussion
It has been clearly established that mitochondrial dysfunction plays an important role in the development of AD. Our current observations related to DEGs involved in mitochondrial energy production suggest that a small group of these genes may play important roles in the development of AD, either by stimulating biological pathways that promote mitochondrial dysfunction or by inhibiting those pathways that play a protective role. Analysis of the 84 genes on the RT2 Energy Production Profiler array led to identification of 37 up and downregulated genes associated with AD brains. These were subsequently filtered, in part, based upon the number of times they were found associated with a multiple number of pathways related to AD, the size of the fold-change, the p-value, the biological or disease pathways, and interactions with upstream regulators, and individual qPCR assessments. The small set of mitochondrial energy production related genes resulting from our filtering process consists of five GOIs: ATP5PD, BCS1L, COX6A1, NDUFA10, and UQCRC1. Within this smaller group, there is a gene from each of the RC's that are composed of nuclear and mitochondrial encoded subunits – NDUFA10 (RCI), UQCRC1 (RCIII), COX6A1 (RCIV), and ATP5PD (RCV). This smaller, filtered group also contains a chaperone protein (BCS1L).
When ranked according to p-values, the top biological processes affected by our gene set (Table 4) were cell signaling, post-translational modification and protein synthesis. The processes of cell signaling and post-translational modifications are most evident in their effect on the assembly of RCI. It is interesting to note that of the thirty molecules in our PCR array that are contributors to this association, all but two are genes coding for NADH dehydrogenase (RCI) subunits. These two gene exceptions are BCS1L and OPA1. BCS1L is seen to be one of the most upregulated genes in our array. Interestingly, it has been recognized as an important component in the assembly of RCIII. 34 In our present study, we see that BCS1L may play an important role in assembly of RCI as well. As discussed below, an evolving model for AD that we are developing involves the assembling and functioning of the mitochondrial respirasome. It is tempting to consider the observed upregulation of BCS1L seen in this study as a protective response to help foster the connections between RCI and RCIII in the respirasome. Whether the chaperone function of BCS1L plays a significant role in this respirasome assembly in the AD pathological state is under investigation.
On the other hand, OPA1 mediates inner mitochondrial membrane fusion and as such is critically important to the maintenance of the proper balance between mitochondrial fusion and fission. It is interesting to note that our previous study using PCR arrays composed of genes involved in mitochondrial biogenesis to identify DEGS in AD brain also indicated that OPA1 was an important gene downregulated in AD brains. 29
The canonical pathways most affected by expression changes in our gene set include signaling pathways. In particular, as shown in Figure 3, the changes in gene expression of our gene set affect the ERSP, leading to a decrease in oxidative phosphorylation and mitochondrial biogenesis. Estrogens are known to be critically important in brain function; however, the role of estrogens in the development of AD is primarily unresolved. As mentioned earlier, estrogens can bind to estrogen receptors ERα and ERβ as well as the G-protein coupled receptor GPER1 to modulate transcriptional control of mitochondrial activity. 33 ERα and ERβ stimulate NRF-1, a nuclear transcription factor that mediates mitochondrial transcription primarily through regulation of the mitochondrial transcription factor TFAM. 35 Estrogens also regulate the expression of genes involved in mitochondrial fusion, such as OPA1, and fission. 36 One could speculate that reductions in the ERSP not only directly affect glucose metabolism and oxidative phosphorylation but these reductions compromise mitochondrial morphology through reductions in OPA1 leading to disruptions in mitochondrial fusion-fission homeostasis. We are pursuing the impact of the changes in OPA1 as they may relate to the development of AD.
As part of our ongoing strategy to identify and evaluate potential mitochondrial gene therapeutic targets for AD treatment, our gene expression data was incorporated into a testable mathematical model we are developing.28,37 Inclusion of our energy production expression data in this model served to highlight one of our GOI's, the RCIII component UQCRC1. As a subunit of RCIII, UQCRC1 plays an important role in the proper functioning of this important respiratory complex responsible for transfer of electrons moving down the ETC to cytochrome c. UQCRC1 is also involved in the formation and stability of the mitochondrial respirasome, a supercomplex designed to organize the mitochondrial respiratory complexes in such a way as to maximize supercomplex stability and electron transport efficiency as well as to minimize the escape of reactive oxygen species that could increase oxidative stress in the organelles. 38 We examined these GOIs further by incorporating their expression levels into our mathematical model for AD. The details of our mathematical model and its use to analyze this data to further filter the potential short list of possible therapeutic targets is the subject of our companion paper in this issue. 28 The conclusion from this modeling analysis is that UQCRC1 plays the most significant role in formation and stability of the (RCI)(RCIII)2(RCIV)n supercomplex as it serves as an essential bridge between RCI and RCIII.39,40
The picture unfolding from our expression studies combined with our mathematical modeling is summarized in Figure 8. As indicated above (Table 2 and Figure 6(b)), after filtering, there are four genes in our gene set—NDUFA10, UQCRC1, COX6A1, and ATP5PD—that are each associated with a different respiratory complex. The top portion of Figure 8 indicates that reduced expression of each of these four genes in our gene set decreases oxidative phosphorylation that will contribute to a reduced capacity for ATP synthesis, with concomitant compromise in neuronal cell function and survival. In our qPCR analysis, UQCRC1 stood out as the DEG with the greatest expression change between AD and control samples. UQCRC1 also is a homologue of the mitochondrial-processing peptidase (MPP) subunit β and has been linked to the post-translational processing of another RCIII subunit, UQCRFS1, into the mature Rieske iron-sulfur protein. 41 As shown in the lower portion of Figure 8, reduced expression of UQCRC1 would also compromise maturation of the Rieske protein further contributing to reduced oxidative phosphorylation and ATP production. Finally, UQCRC1 plays a significant role in the assembly and stability of the mitochondrial respirasome, forming a bridge between the two subunits NDUFB4 and NDUFB9 of RCI and RCIII. 42 Therefore, reduced expression of UQCRC1 decreases the formation and efficiency of the respirasome as a machine designed to effectively protect against the release of ROS while at the same time maintaining high throughput of electrons, pumping of protons across the IMM, and ATP production (lower portion of Figure 8). This disruption of respirasome assembly and function leads to increased release of ROS, increased apoptosis, increased inflammation and decreased ATP production, all of which contribute to neuronal cell death, neurodegeneration and, ultimately, to AD. Defective UQCRC1 has recently been linked to another neurodegenerative disease (Parkinson's disease) 43 and in our current study we suggest that it plays an important role in the pathogenesis of AD.
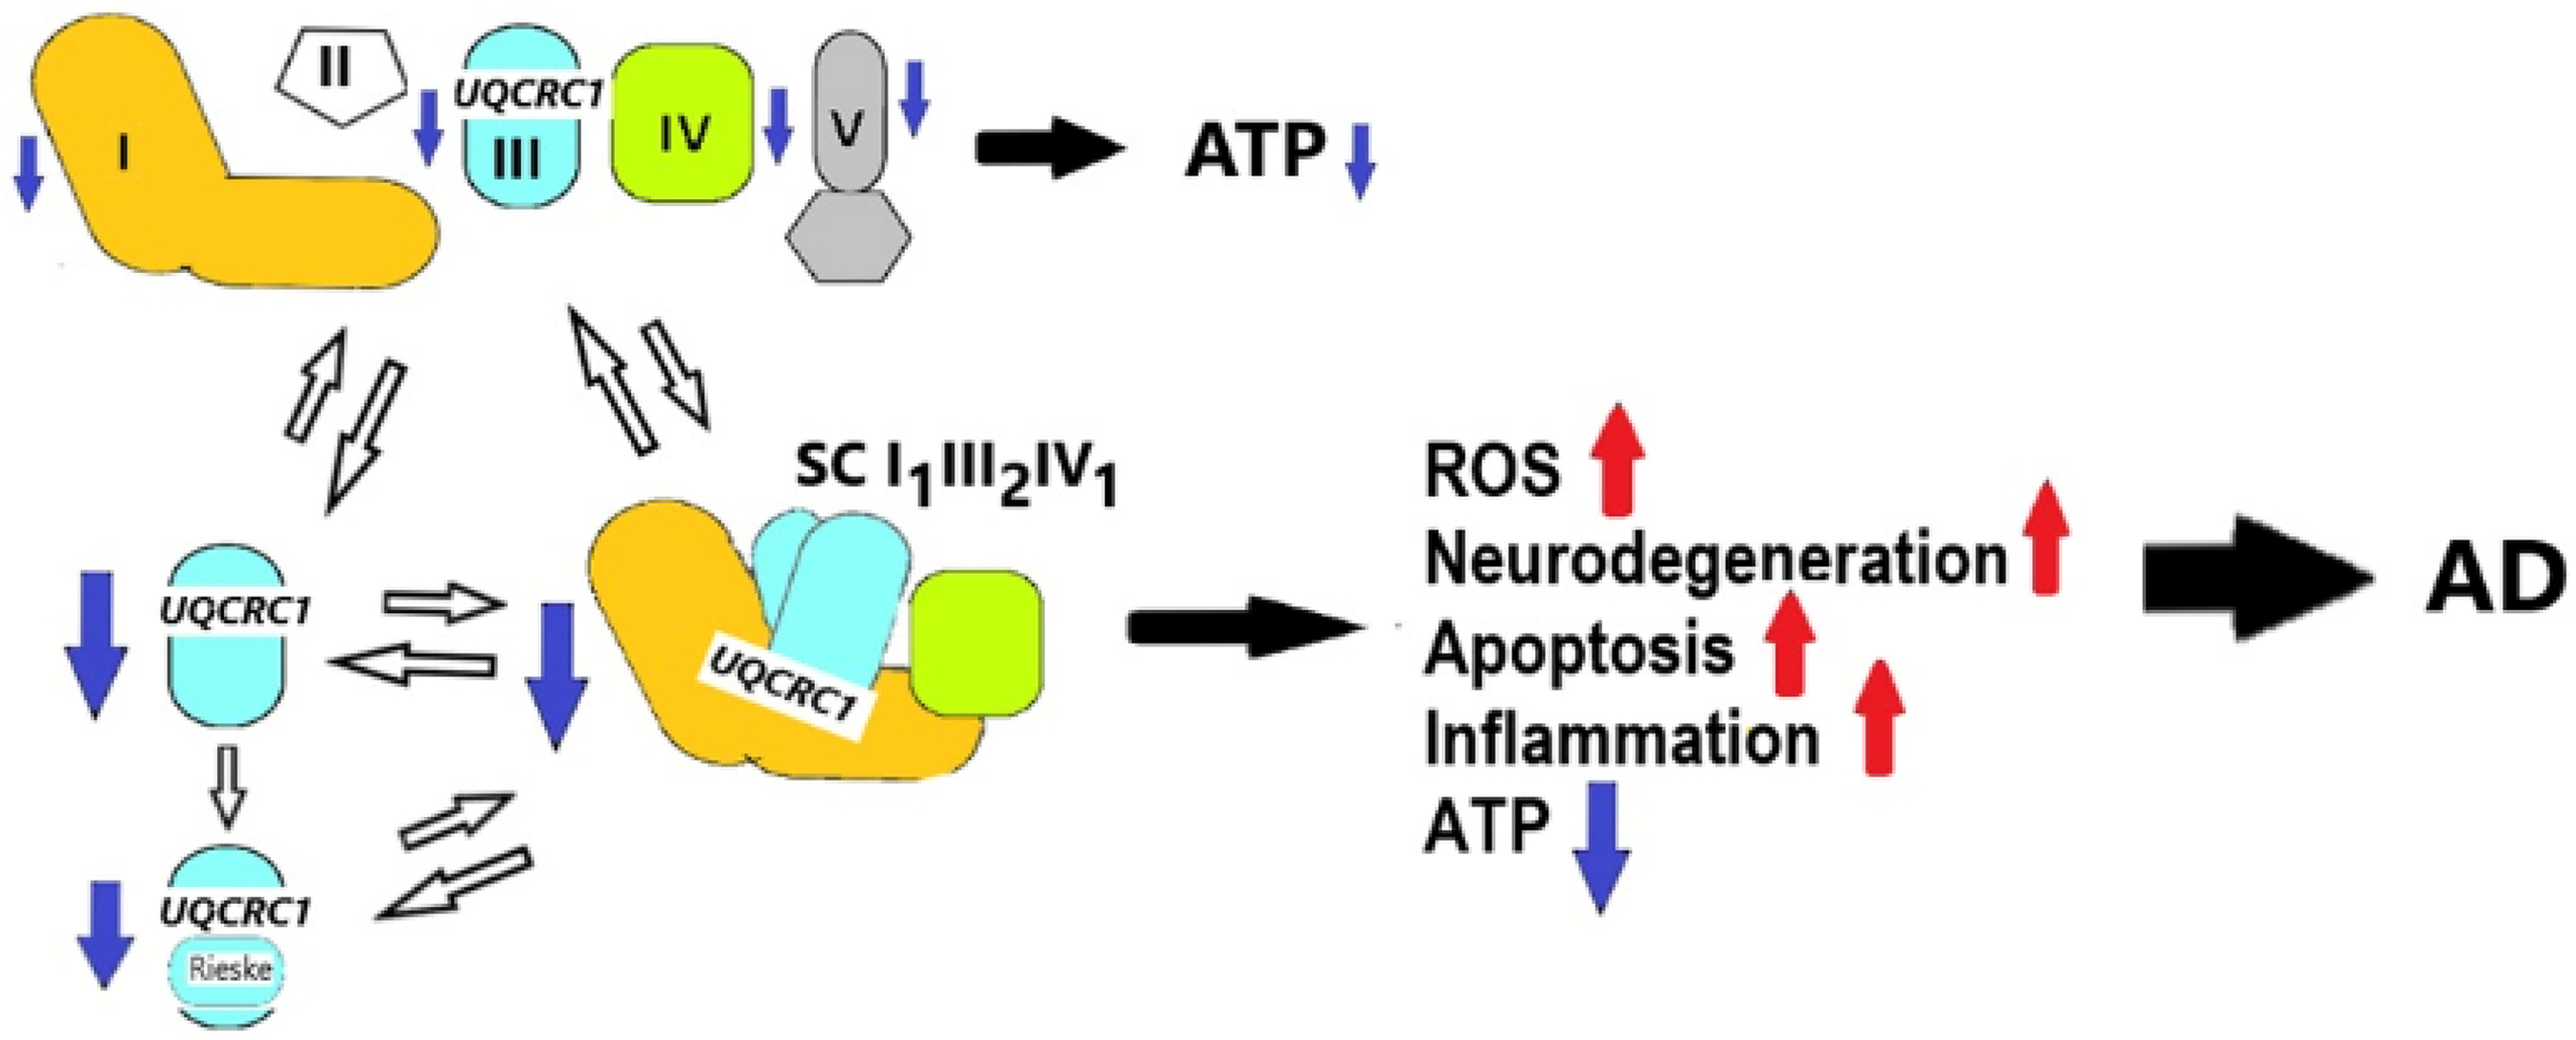
Diagrammatic representation of the proposed consequence of reduced UQCRC1 on assembly/stability of the mitochondrial supercomplex I1III2IV1 and resulting changes leading to AD. Red (upwards pointing) arrows reflect increased amounts; blue (downward pointing) arrows reflect decreased amounts of product or process. Electron chain complexes are RCI (orange), RCII (white), RCIII (aqua), RCIV (light green), and RCV (gray). The most prominent (by blue native gel electrophoretic studies) super complex composed of (RCI)1(RCIII)2(RCIV)1 is shown. Colors are visible in the online version.
In conclusion, our defined focus on a group of 84 genes involved in mitochondrial energy production has identified a subset of five genes of interest that are linked to ROS synthesis, ATP metabolism, and neuronal inflammation, all conditions that can be provoking mitochondrial dysfunction contributing to the onset or progression of AD. Although these observed gene expression changes and associations found via pathway enrichment analyses do not demonstrate a causative relationship between altered mitochondrial gene expression and phenomena such as ROS generation, ATP synthesis, and altered NADH oxidation, they provide strong rationale to suggest that these observed changes are linked. Finally, our combined approach of gene expression analysis and mathematical modeling implicates one of these mitochondrial genes, UQCRC1, with potential as a therapeutic target. The detailed results and discussion of the modeling analysis are provided in the companion paper by Shelton et al. 28
Supplemental Material
sj-docx-1-alz-10.1177_13872877251362884 - Supplemental material for Mitochondrial energy production genes affecting reactive oxygen species and ATP synthesis, inflammatory pathways, and neuron viability are differentially expressed in brains of Alzheimer's disease patients
Supplemental material, sj-docx-1-alz-10.1177_13872877251362884 for Mitochondrial energy production genes affecting reactive oxygen species and ATP synthesis, inflammatory pathways, and neuron viability are differentially expressed in brains of Alzheimer's disease patients by Haley Pflanzer, Kimberly A Kerns, Joseph Knoble, Blake S Gershon, Jason Shugoll, Morgan Shelton, Randolph A Coleman and Frank J Castora in Journal of Alzheimer's Disease
Footnotes
Acknowledgments
The authors have no acknowledgments to report.

Ethical considerations
This study received ethical approval from the Eastern Virginia Medical School Institutional Review Board (IRB), which has determined that use of these autopsy frozen brain samples is exempt from IRB review.
Author contributions
Funding
The authors disclosed receipt of the following financial support for the research, authorship, and/or publication of this article: This work was supported by grants from the Virginia Center of Aging Alzheimer's and Related Diseases Research Award Foundation (22-097) and from the Commonwealth Health Research Board (274-08-17).
Declaration of conflicting interests
The authors declared no potential conflicts of interest with respect to the research, authorship, and/or publication of this article.
Data availability statement
Supplemental material
Supplemental material for this article is available online.
References
Supplementary Material
Please find the following supplemental material available below.
For Open Access articles published under a Creative Commons License, all supplemental material carries the same license as the article it is associated with.
For non-Open Access articles published, all supplemental material carries a non-exclusive license, and permission requests for re-use of supplemental material or any part of supplemental material shall be sent directly to the copyright owner as specified in the copyright notice associated with the article.
