
Abstract
Background
Capacity to deliver intravenous Alzheimer's disease (AD) treatments could constitute an obstacle to access in addition to AD specialist and PET scan capacity.
Objective
We aim to estimate the overall capacity for AD treatment infusions compared to expected demand in the United States.
Methods
We used published data and a survey of infusion sites to estimate the capacity to deliver AD treatments in physician offices, hospitals, standalone centers and at patients’ homes from 2024 to 2033 relative to demand.
Results
Capacity for intravenous AD treatments is predicted to increase from 370,000 in 2024 to 5.2 million infusions in 2033. Nevertheless, a significant shortfall of over 13 million infusions remains in 2033, which would imply delayed access for 2.2 million patients.
Conclusions
Limited infusion capacity could impede AD treatment access and result in avoidable disability progression. Expansion of capacity is needed in the short run until treatments with alternative routes of administration become available.
Keywords
Introduction
In the United States (US), approximately 5.7 million and 2.5 million individuals are currently living with mild cognitive impairment (MCI) and mild dementia due to Alzheimer's disease (AD), respectively. 1 A substantial proportion of these individuals might be eligible for recently approved disease-modifying AD treatments: lecanemab, approved by the FDA in July 2023, and donanemab, approved in July 2024.2,3 Both therapies require administration by intravenous infusion. Several studies have investigated how well the health systems in the US and other countries are prepared to handle the expected influx of patients.4–9 In England, capacity constraints are expected to result in overall wait times of over 17 months for specialist visits following referral, even after considering implementation of blood-based biomarker tests for triage in primary care. 10 Although the situation in the US is projected to be less severe, wait times could still extend to 10 months in 2030. 11
These studies have largely focused on availability of AD specialists and confirmatory biomarker testing, and have assumed that infusion capacity to deliver these treatments would adapt to demand in a timely manner. The only study that considered infusion capacity as a potential obstacle projected a contribution of 2 months to average wait times. 4 This optimistic view drew on the experience with the introduction of biologic response modifiers for inflammatory diseases. Despite the large population—approximately 1.3 million cases of autoimmune diseases such as Crohn's disease, ulcerative colitis, rheumatoid arthritis and systemic lupus erythematosus in the US—the volume was successfully accommodated in this therapeutic area. 12
However, delivery systems were able to gradually adapt to demand in this case, as oral and injectable disease-modifying drugs allowed for a gradual transition to infusion treatment. In the case of AD, the absence of disease-modifying treatments until now means that such gradual adaptation could lead to wait times and avoidable disease progression for patients. Against this background, in this study we aimed to estimate the current and projected capacity of infusion sites in the US and compare it to the projected demand stemming from the introduction of new AD treatments. In contrast to the above-mentioned study, which only considered capacity in physician offices and hospital outpatient departments, we also accounted for stand-alone infusion centers and home infusion services.
Methods
Overview
We leveraged publicly available data on US infusion volume across therapeutic areas and a quantitative survey of infusion center managers to approximate current and future capacity of infusion sites and future allocation of capacity to AD treatments (Table 1).13–15 The survey of infusion centers was conducted in November-December 2023 and consisted of a convenience sample of 50 infusion site managers who oversaw 404 office-based, hospital-based or free-standing infusion centers across the US. It was conducted in 2023 with a response rate of 96%. Details of the survey and its results are published elsewhere. 13 Demand was estimated based on a model to project the maximum number of patients diagnosed and treatment eligible in the US each year, 11 published data on uptake of newly introduced drugs, 16 and discontinuation rates of lecanemab and donanemab.17–21 We analyzed the 10-year period from 2024 to 2033.
Input parameters.
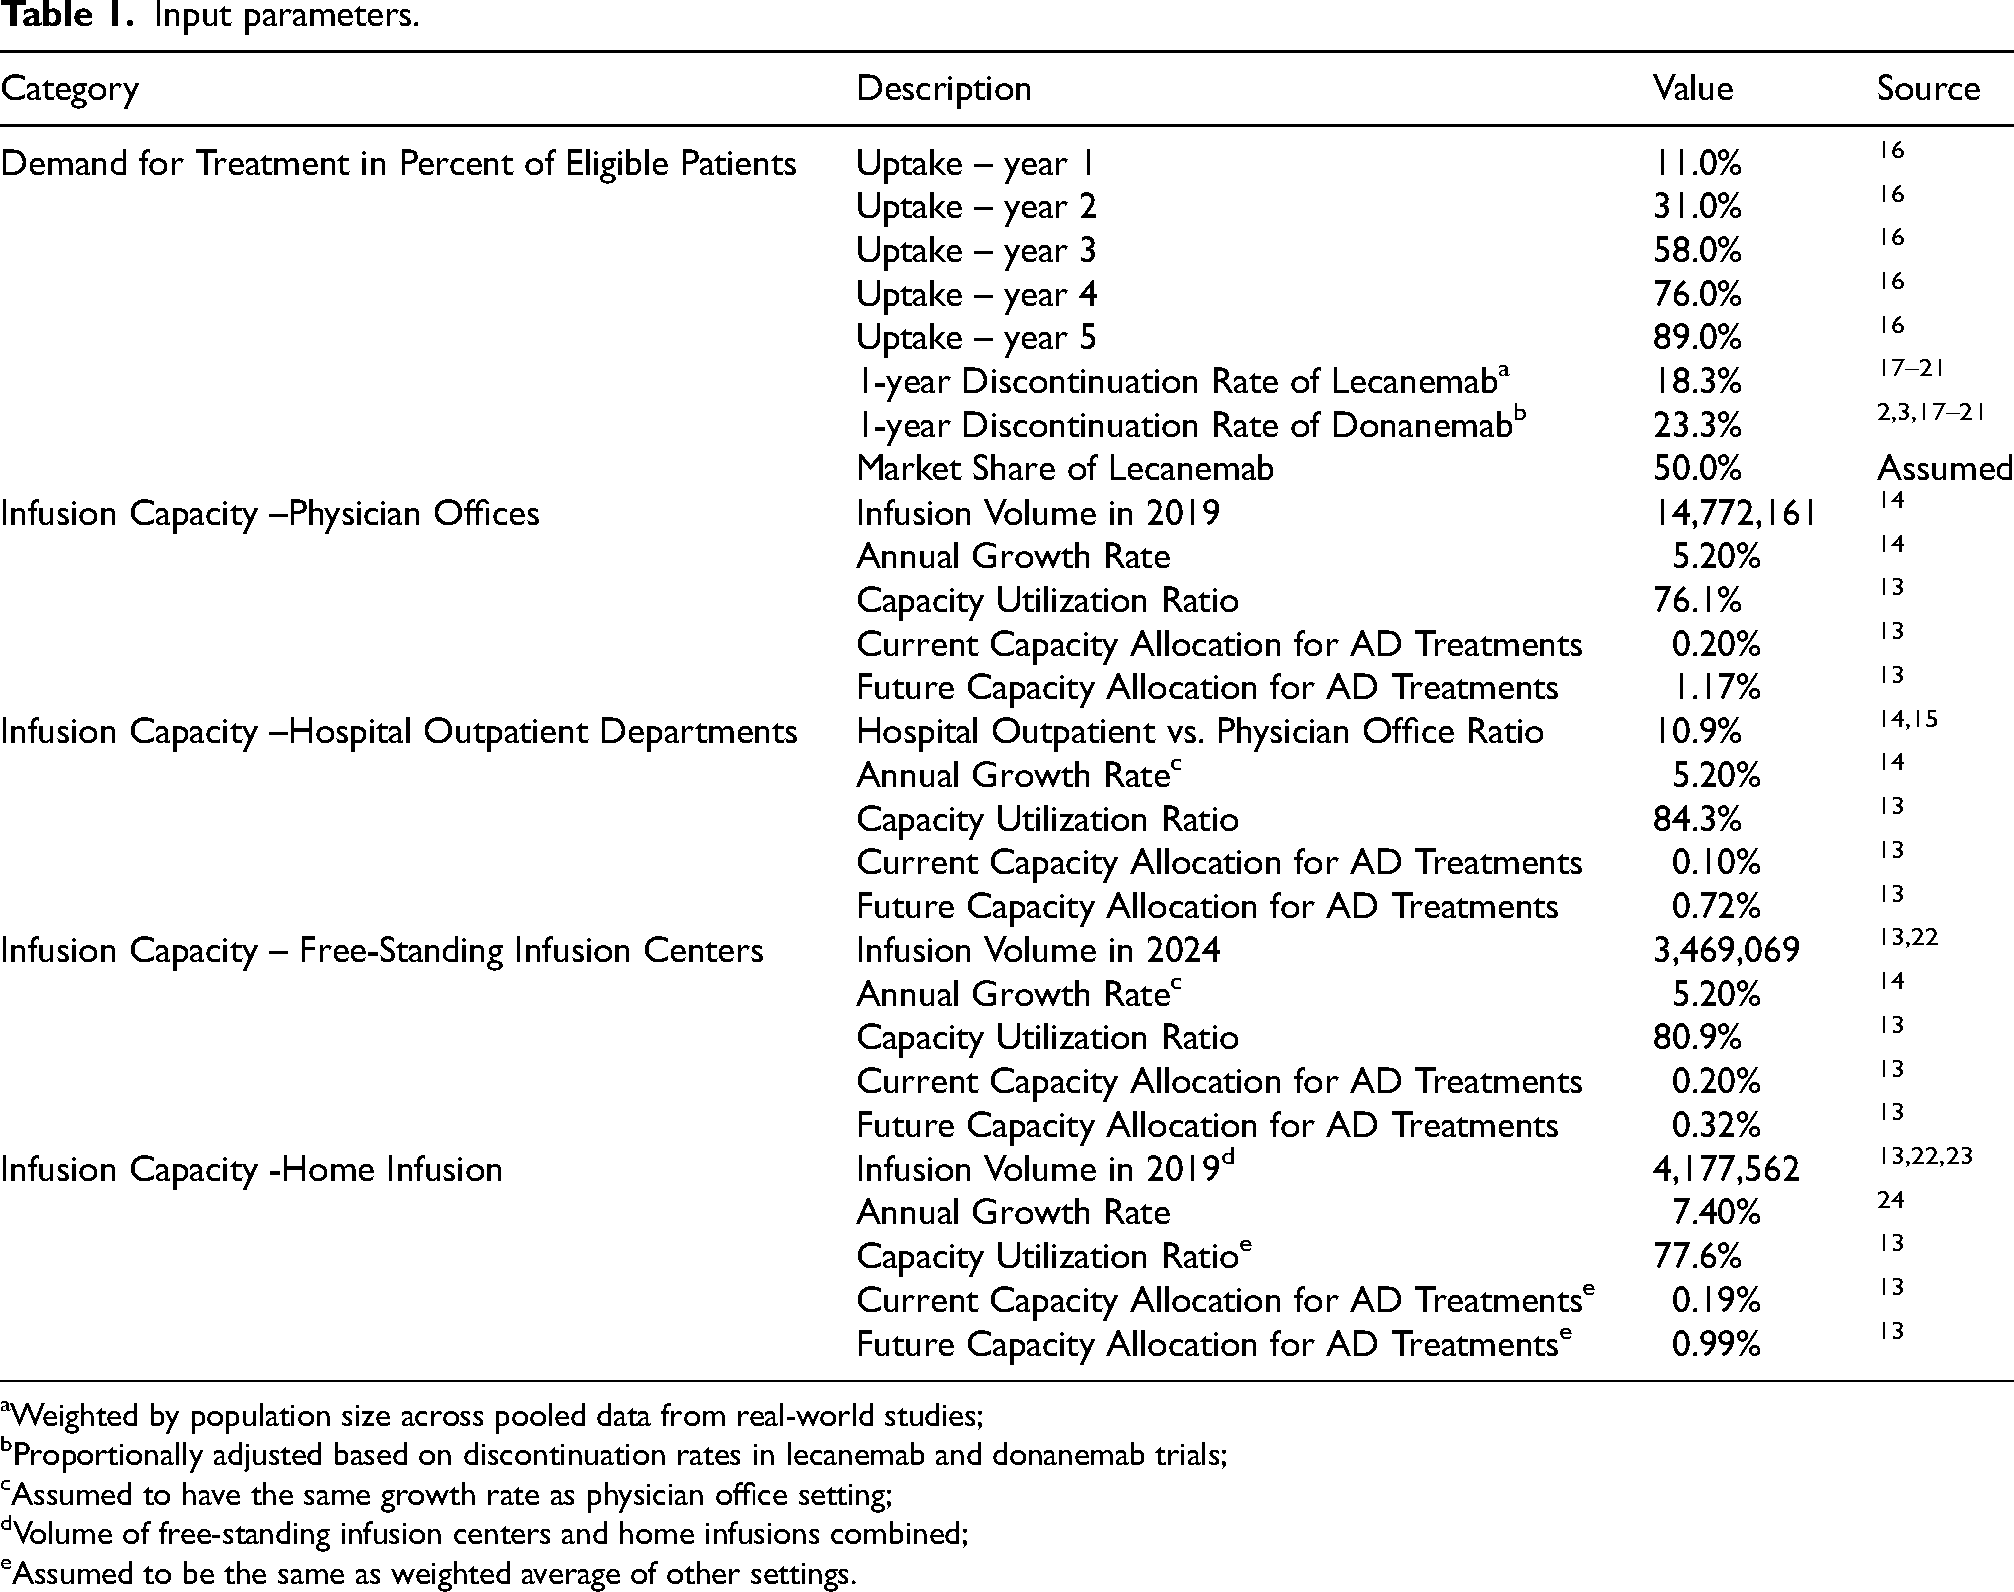
Weighted by population size across pooled data from real-world studies;
Proportionally adjusted based on discontinuation rates in lecanemab and donanemab trials;
Assumed to have the same growth rate as physician office setting;
Volume of free-standing infusion centers and home infusions combined;
Assumed to be the same as weighted average of other settings.
Projection of current infusion volume
Physician offices and hospital outpatient departments
We used the National Ambulatory Medical Care Survey (NAMCS) and the National Hospital Ambulatory Medical Care Survey (NHAMCS) to estimate the current number of infusion-related procedures administered in physician offices and hospital outpatient departments, respectively. Both are nationally representative surveys conducted by the National Center for Health Statistics (NCHS), a division of the Centers for Disease Control and Prevention (CDC) that collects data on ambulatory medical services provided by non-federally employed office-based and hospital outpatient department-based physicians, who are primarily engaged in direct patient care.14,15 For NHAMCS, we included only infusions delivered in outpatient departments and excluded those delivered in emergency departments, as the latter would not schedule infusion visits for elective care and thus are unlikely to administer AD treatments.
Infusion volume in physician offices was calculated from procedure codes in the NAMCS from 2009 (N = 5.1 million) to 2019 (N = 14.7 million), the most recent year available (Supplemental Table 1). Future volume was projected as a linear trend, growing constantly at an annual rate of 5.2%. Data for hospital outpatient departments were only available in the NHAMCS from 2009 (N = 0.45 million) to 2011 (N = 0.66 million); data after 2011 have not been publicly released. We used the ratio between number of infusions in physician offices from the NAMCS and in hospital outpatient departments from the NHAMCS from 2009 to 2011 (10.9%) to project future volume in outpatient departments as a linear trend (Supplemental Figure 1 and Supplemental Table 2).
Free-standing infusion centers
As there are no known nationally representative data for number of infusions provided by free-standing infusion centers available, we obtained the current number of infusion chairs in free-standing centers (N = 8404) as of June 24, 2024 from the National Infusion Center Association (NICA) website using their national site locator (Supplemental Figure 2). 22 We then estimated current infusion volume based on monthly average number of infusions (N = 34.4) administered for each chair based on data from the above-mentioned infusion center survey. 13 Future volume growth was assumed to correspond to that of physician office-based sites at 5.2% annually.
Home infusion delivery
We were unable to identify robust, national data on the current and future volume of home infusions, as the aforementioned CDC and infusion center surveys were limited to fixed sites. Estimates were therefore derived from a 2020 industry report by the National Home Infusion Association (NHIA), a trade association of home infusion companies and free-standing infusion centers in the US. 23 The report contains data from 227 such companies and estimated that over 3.2 million unique patients were served by their services in 2019. We estimated this translates to 4.2 million infusions by multiplying the number of patients served with the average number of infusions (1.31) per patient per month, which was informed by data from the infusion center survey. To estimate the number of infusions delivered in the home setting alone, we then subtracted from this number our estimate of number of infusions delivered in free-standing infusion centers to arrive at an estimate of 1.5 million infusions administered in patients’ homes in 2019. Future growth was approximated at 7.4% annually based on a commercial report forecasting the growth of the home infusion market. 24
Estimation of capacity available for delivery of AD treatments
The operational capacity of infusion centers, i.e., the maximum number of infusions that sites can deliver per year, was estimated based on data from the infusion center survey (Table 1). Survey participants reported that their sites utilized 77.6% of total capacity on average, with over one-third (36%) operating at 90% or more of their available capacity. Assuming that observed infusion volumes also reflect a national average of 77.6% capacity utilization, we estimated the theoretical infusion volume at 90% of total capacity, and considered it as the maximum infusion capacity, as centers are unlikely to achieve 100% capacity utilization under real-world conditions. The capacity available for AD treatments was further estimated based on the current proportion (0.2%) of the overall volume used for AD treatments (Table 1). Survey respondents indicated a projected annual increase of 1.0 percentage point each year, which we used to project the future capacity dedicated to AD treatments.
Demand for infusions to deliver AD treatments
Demand for infusion of AD treatments was estimated with an existing model that projects the maximum number of individuals who can be identified as treatment-eligible each year, given the capacity of the US healthcare system to support the diagnostic pathway, assuming use of blood testing for AD pathology as a triage tool. 25 We combined these projections with data on the speed of uptake of newly introduced treatments that projects average peak uptake to occur in year six following regulatory approval. 16 It was assumed that half of the patients seeking treatment would receive donanemab every four weeks (Q4W) for an average duration of 52 weeks, while the other half of the patients were assumed to receive lecanemab every other week (Q2W) during the first 18 months, followed by every four weeks (Q4W) until progression to moderate dementia. We assumed a discontinuation rate of 18.3% for lecanemab and 23.3% for donanemab based on a synthesis of real-world and clinical trial data in the first year of treatment (Supplemental Table 3). We assumed that discontinuation occurs at month 6 in the first year of treatment. We assumed 100% market share for lecanemab in 2024 and equal market share for lecanemab and donanemab for the remaining of the time horizon in the model. Based on prevalence data for stages of AD by Gillis et al. 1 and treatment effect projections by Prados et al., 26 we assumed that two-thirds of patients would start treatment at MCI for a duration of 7.24 years on average, and one-third would initiate treatment at the mild AD dementia stage for a duration of 2.0 years on average for a weighted average of 5.5 years of treatment per patient.
Scenario and probabilistic sensitivity analyses
Several scenario analyses were conducted to investigate the impact of key assumptions in the model. First, we varied the input parameters for physician office-based infusion center capacity to identify the changes in assumptions that would align AD infusion capacity with demand in 2033. The capacity in other settings was not varied in this scenario due to their small shares and were held at base case values. Second, we explored the effect of transitioning utilization of intravenous lecanemab to subcutaneous delivery, a formulation in development and not yet FDA approved or commercially available, by testing two scenarios. We tested the assumption that the transition would occur after 18 months, and we sought to find the maximum duration of intravenous delivery that would allow capacity to match demand in 2033. Third, we evaluated whether infusion capacity insufficiency would persist if all additional capacity added after 2024 were devoted exclusively to AD treatments. Moreover, the robustness of the results was explored through a probabilistic sensitivity analysis with 1000 Monte Carlo simulations, in which all parameters were allowed to vary simultaneously according to their respective distributions (Supplemental Table 4). The ranges and distributions were derived from available data or based on assumptions.
Ethics statement
As the study did not constitute human subjects research per US federal regulations (45 CFR 46, 102(f))20), it was exempt from IRB review, consent requirements and registration. The study did not involve animals.
Results
Estimated current and future infusion volume by site
The total infusion volume available for all treatments in the US in 2024 is estimated to be 27 million infusions (Figure 1). Most of the infusions are administered in physician offices, accounting for 71% of the total volume, followed by free-standing infusion centers at 13%. Home infusions and hospital outpatient departments constitute the smallest portions, with 8.0% and 7.8% respectively in 2024. Over the next decade, the total infusion volume is projected to grow to 43 million, with an average annual growth rate of 5.4%. In 2033, the majority of capacity continues to be provided in physician offices (70%) and free-standing sites (13%). Home infusions (9.4%) are expected to grow faster than other settings, while hospital-based sites contribute the least, with 7.6% of the total volume.
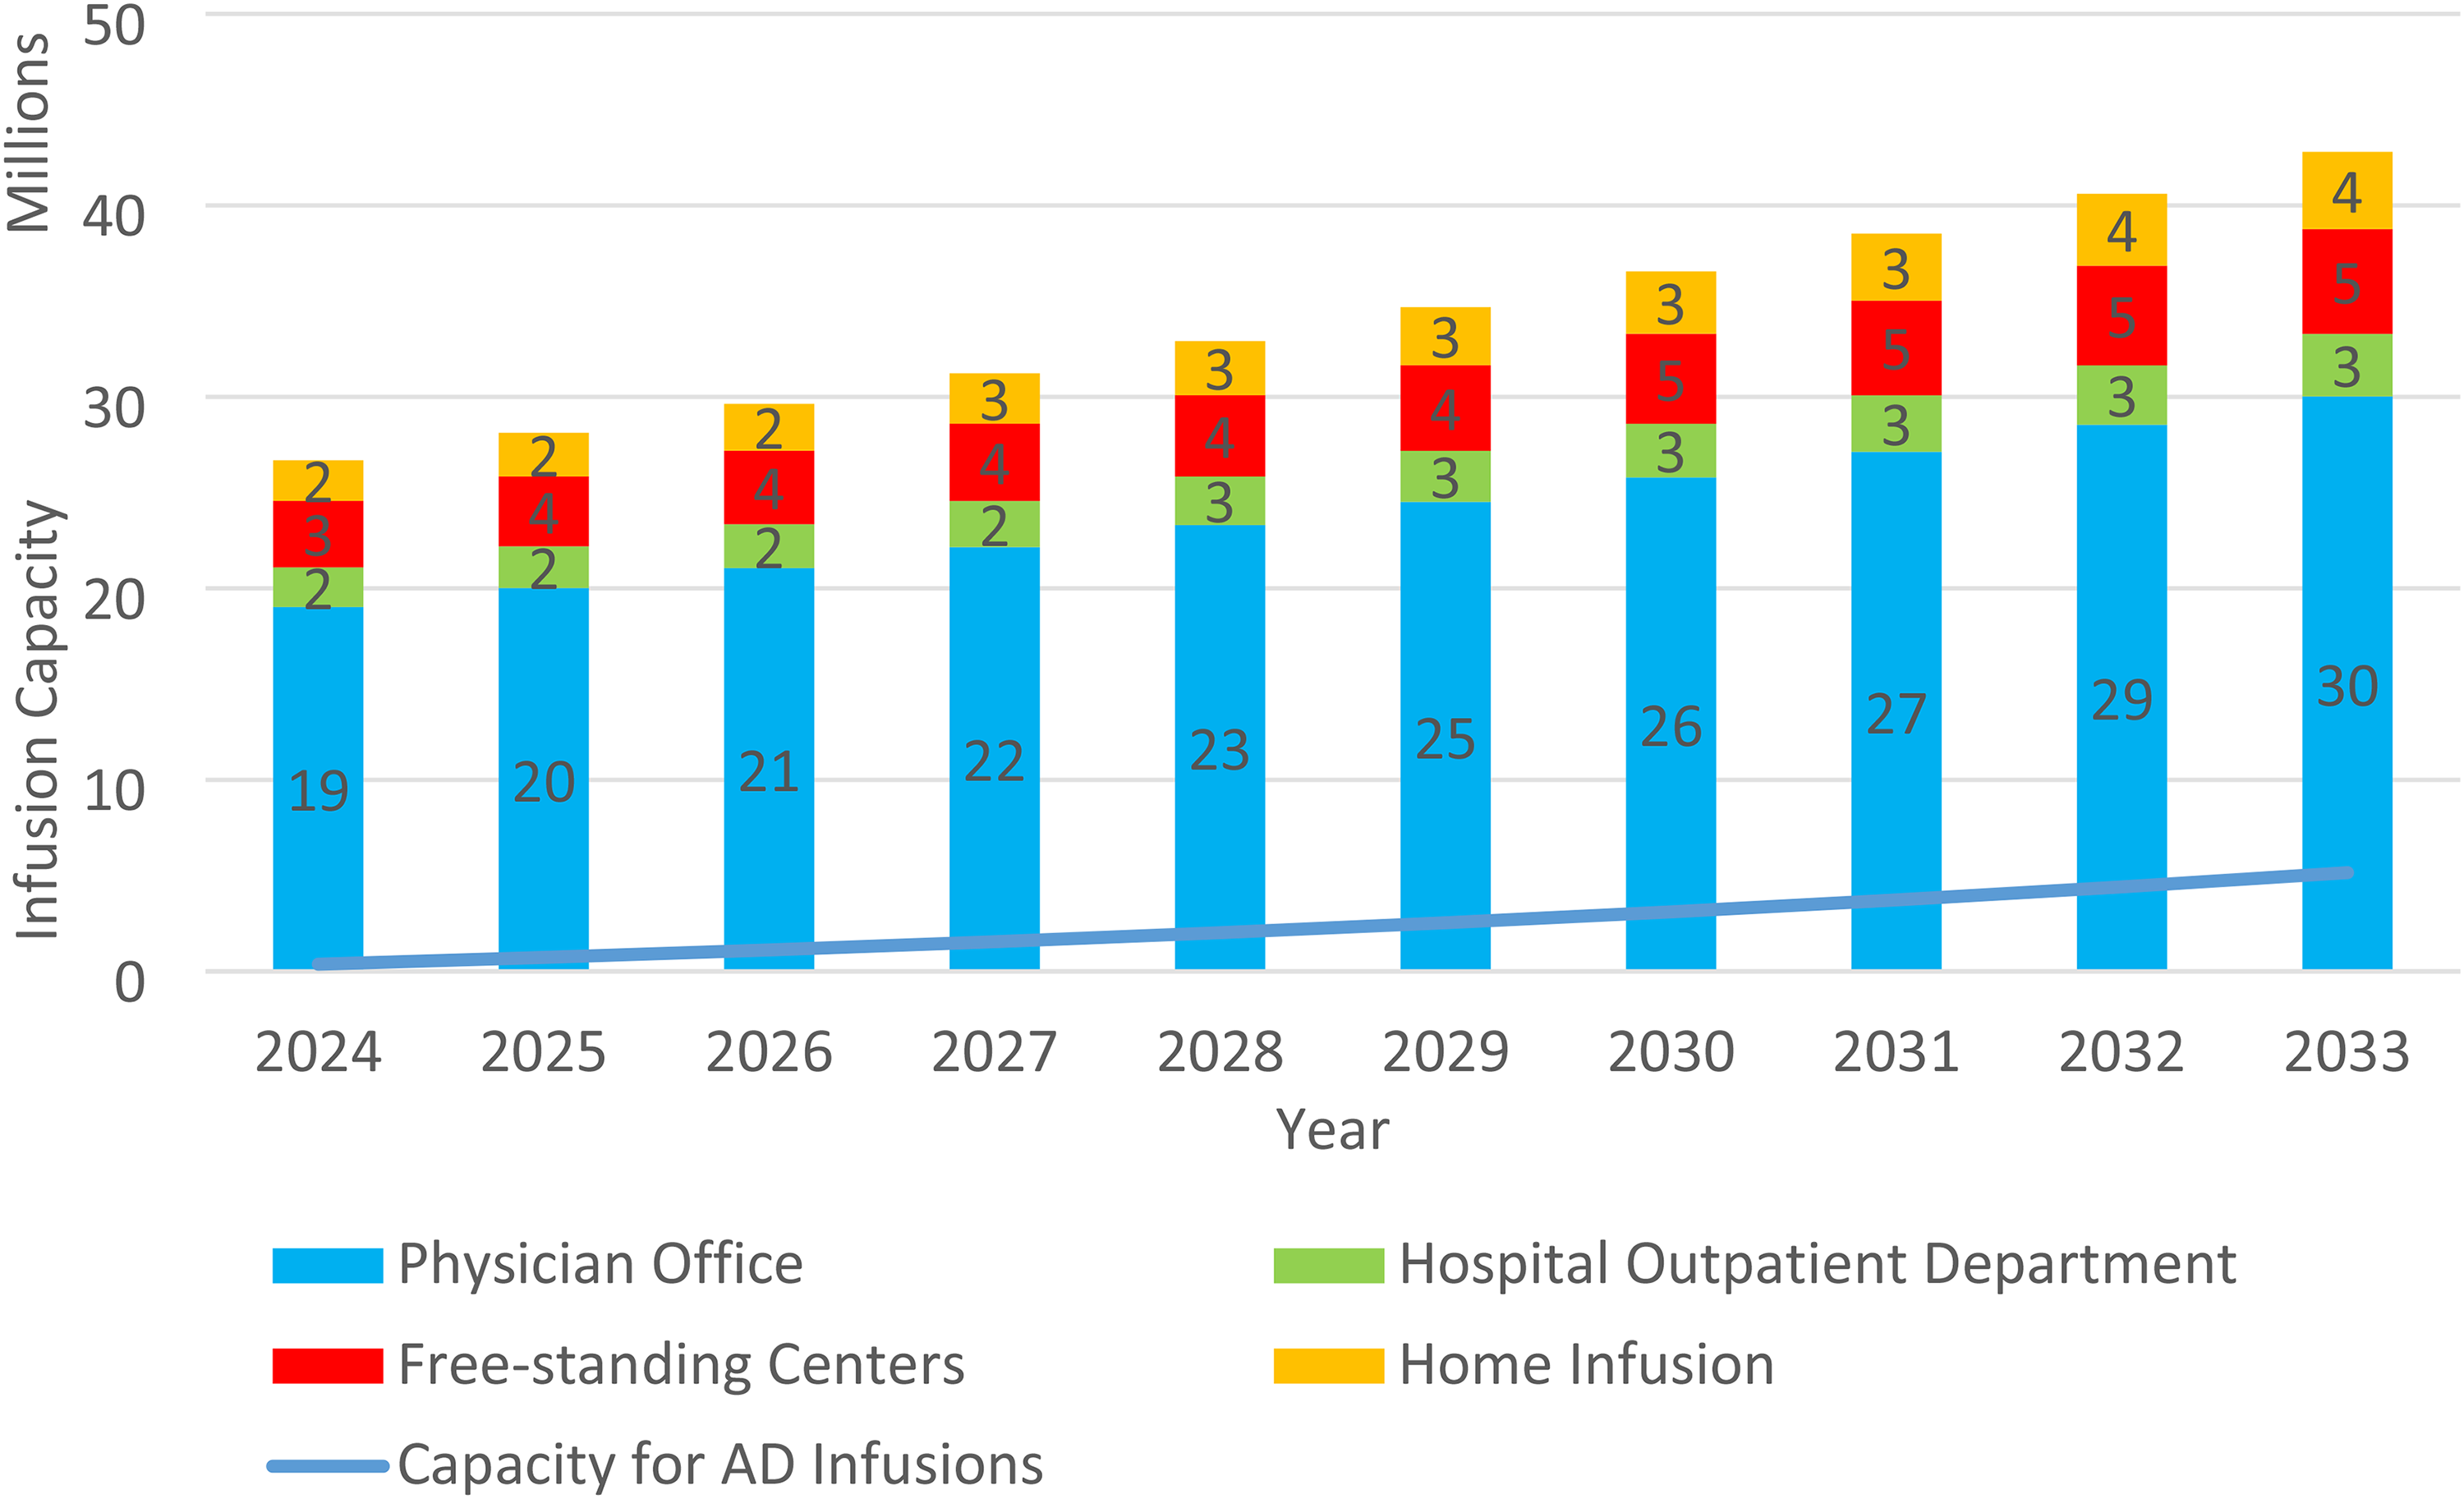
Predicted infusion Volume by Setting.
Predicted infusion capacity and demand for AD treatment delivery
The capacity for AD treatments is estimated to increase from 370,000 infusions in 2024 to 5.2 million infusions in 2033, having an average annual growth rate of 34% (Figure 2). Assuming an equal market share for donanemab (Q4W for 52 weeks) and lecanemab (Q2W for 18 months, followed by Q4W until progression), the demand for AD treatment infusions is predicted to be 1.0 million infusions in 2024, resulting in a gap of 640,000 infusions. As the demand grows to 18 million infusions in 2033, the gap between capacity and demand is projected to reach 13 million infusions. The number of patients on the waitlist for treatment continues to increase, reaching 2.2 million patients with an average wait time of 27 months by 2033. The probabilistic sensitivity analysis consistently demonstrates insufficient capacity persists after accounting for the uncertainty in the input parameters.

Demand and capacity for AD treatments.
Scenario analyses
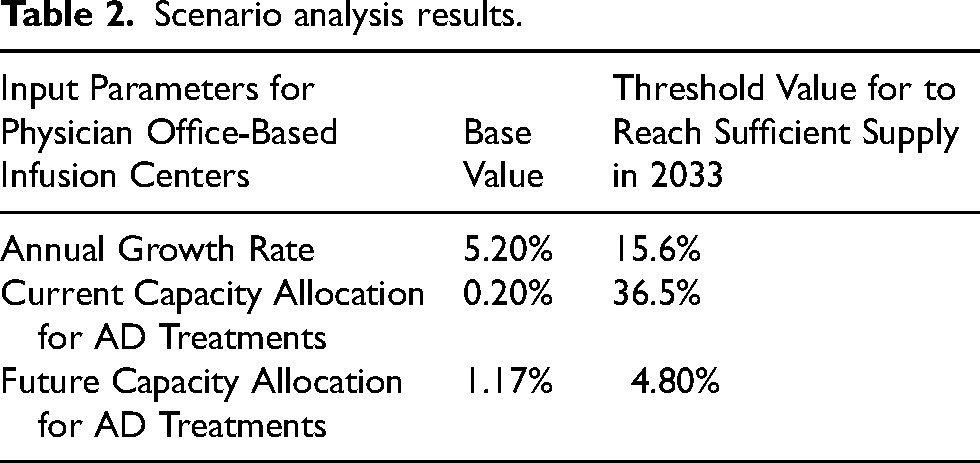
The first scenario analysis suggests that to match capacity with demand in 2033, the annual growth of total infusion capacity in physician office-based infusion centers needs to reach 16%, nearly three times the estimated growth (Table 2). Alternatively, achieving sufficiency in 2033 would also be possible if at least 37% of total infusion capacity in 2024–2033 is allocated to AD treatments, or if the portion allocated to AD treatments increases by more than 4.8 percentage points each year.
Scenario analysis results.
Limiting the initial IV treatment duration for lecanemab to 18 months significantly reduces demand in 2033 from 18 million to 10 million infusions. However, a gap of 4.6 million infusions between capacity and demand for AD treatment delivery is still predicted to exist. Alternatively, demand could be further decreased to 5.2 million infusions in 2033 if patients on lecanemab were switched to a subcutaneous form after 24 weeks, thereby eliminating the gap.
Lastly, the third scenario analysis shows that the mismatch between infusion capacity and demand may be avoided by reducing capacity allocated to other therapeutic areas. Dedicating all newly added infusion capacity exclusively to AD treatments allows for 19 million AD infusions in 2033, meeting the 18 million infusions expected to be in demand that year.
Discussion
This study is, to our knowledge, the first assessment of infusion capacity for disease-modifying AD treatments considering all potential settings in the US. Despite accounting for increases in infusion center capacity and increased allocation of capacity to the treatment of AD, the results show a considerable gap of more than 13 million infusions between projections of capacity and demand in 2033, suggesting that limited capacity for delivery of AD treatments could become an obstacle to patient access, in addition to capacity limitations around availability of AD specialists and PET scanners. Although this gap could theoretically be addressed by reallocating infusion capacity from other therapies, other challenges might limit such shifts. For example, cognitively impaired patients might need more assistance than infusion center staff is used to provide, and coordination of safety monitoring with the treating physician and neuroradiology is far more complex than what infusion sites have to provide for other indications. This finding contradicts a previous study from Liu et al., who recently estimated sufficient infusion capacity for the US even when only considering capacity in physician offices and hospital outpatient departments. 27 However, their capacity estimate was based on assumed ability of the nursing workforce to provide infusions rather than infusion volume data. They also assumed that 20% of infusion capacity would be allocated to delivery of AD treatments, whereas the survey results used in this study suggest less than 2% of infusion capacity would be allocated to AD treatments in 2024, with this figure projected to increase to only 10% by 2033. Other studies assumed that infusion capacity can adapt to demand as it did in the case of immunomodulating drugs 11 or did not consider it as a possible constraint. 8
Two factors could dampen the relevance of insufficient infusion capacity. The first is the slower than anticipated uptake of AD treatments. Eisai, the manufacturer of lecanemab, reported that only an estimated 2000 to 3000 patients were started on lecanemab in the first six months after it received traditional FDA approval, 28 whereas the historic uptake data used for our model would suggest adoption of between 9300 and 38,900 patients. 16 However, with a second amyloid-targeting therapy now available in the US, it is also possible that demand for infusions will accelerate and outstrip capacity before non-infused treatments become available, and infusion providers need to prepare for this scenario.
The second is the emergence of AD treatments that do not require intravenous infusions. Specifically, subcutaneous administration of lecanemab as a maintenance treatment is under consideration by the FDA as of August 2025 29 and numerous other oral and subcutaneous disease-modifying treatments are being studied in clinical trials.30,31 The results of the scenario analyses highlight that adoption of alternative AD treatments that do not require intravenous administration would be the most viable path to avoid obstacles to treatment access due to lack of infusion capacity.
An attractive alternative would be to scale up home infusion delivery, which the 2020 CARES Act 32 added as a Medicare benefit, because it does not require investment into fixed infrastructure, and a previous study has estimated that sufficient nursing staff would be available to meet demand. 27 However, home infusion accounts for only an estimated 8%–9% of the overall capacity in 2024–2033, and it would be difficult to increase capacity sufficiently from such a small base.
As around three-quarters of infusions are administered in physician offices, this setting would be the logical choice to expand capacity dedicated to AD treatments. However, the prevailing reimbursement model for physician-administered drugs in the US might act as a deterrent to rapid expansion: Medicare pays practices based on the average sales price of a drug plus a 6% markup, which is meant to cover patient navigation and care management services, and private payers use similar models albeit with substantially higher rates. As a result, the business model of oncology and immunology practices, which tend to have a large proportion of privately insured patients 33 that cross-subsidize publicly insured patients, has become heavily reliant on infusion delivery. 34 With AD patients being overwhelmingly covered by Medicare, there may be limited economic incentives for oncology and immunology practices to allocate capacity for AD treatments, and less incentive for other practices, such as neurology practices, to expand quickly before demand accelerates.
Another option, which is used in Canada, is to have pharmaceutical companies operate infusion centers to increase capacity, 35 but it is unclear whether this approach would be legally viable in the US. Lastly, temporary facilities, as used successfully during the COVID-19 pandemic, could provide short-term capacity expansion.
Limitations
The results should be viewed in the context of their limitations. We use linear volume and capacity projections, which may mis-estimate actual growth. Volume estimates for physician offices and hospital outpatient departments are based on nationally representative data, but estimates for home infusion volume are based on a non-peer reviewed market research report, and those for free-standing centers from a site finder with voluntary participation. However, we expect participation of free-standing centers to be high on this site due to the benefits of being listed, and note that physician offices account for around three-quarters of infusion volume, i.e., the impact of imprecise estimates for the other sites is comparatively small. The uptake rates after approval are extracted from literature based on the historical performance of drugs in other therapeutic areas. The actual uptake of lecanemab and donanemab may differ from this estimated curve. Estimates for available capacity for AD treatments are derived from a national convenience sample and uptake projections from historical data, both of which may imperfectly estimate actual capacity and demand today and in the future. Volume estimates from the NAMCS and the NHAMCS do not include infusions delivered in VA and other government facilities, which biases our capacity estimates slightly downward.
Conclusions
The study represents the first comprehensive assessment of the capacity to deliver AD infusion treatments in the US, and the magnitude of the gap between projected capacity and demand suggests confidence in the conclusion that the existing and projected infrastructure for AD infusion treatments will be insufficient. Delivery systems, manufacturers and policymakers need to collaborate to reduce the gap until treatments with alternative routes of administration become available in order to avoid wait times and possibly disease progression.
Supplemental Material
sj-docx-1-alz-10.1177_13872877251372129 - Supplemental material for Prediction of infusion capacity to deliver Alzheimer's disease treatments in the United States relative to expected demand
Supplemental material, sj-docx-1-alz-10.1177_13872877251372129 for Prediction of infusion capacity to deliver Alzheimer's disease treatments in the United States relative to expected demand by Jiahe Chen, Beatrice Lin, Evans Seow, Sarah Kim, Preeti S Bajaj and Soeren Mattke in Journal of Alzheimer's Disease
Footnotes
Ethical considerations
As the study did not constitute human subjects research per US federal regulations (45 CFR 46, 102(f))20), it was exempt from IRB review, consent requirements and registration.
Author contributions
Funding
The authors disclosed receipt of the following financial support for the research, authorship, and/or publication of this article: The study was supported by a research contract from Prothena Biosciences Inc to the University of Southern California. The sponsor reviewed and earlier draft of the manuscript but the authors had full control over design, analysis, writing and decision to submit.
Declaration of conflicting interests
The authors declared the following potential conflicts of interest with respect to the research, authorship, and/or publication of this article: Soeren Mattke serves on the board of directors of Senscio Systems and the scientific advisory board of ALZpath, and Boston Millennia Partners. He has received consulting and/or speaker fees from Biogen, C2N Diagnostics, Eisai, Eli Lilly, Novartis, Novo Nordisk, and Genentech/Roche. He is an Associate Editor of this journal but was not involved in the peer-review process of this article nor had access to any information regarding its peer-review. Preeti S. Bajaj is an employee of Prothena. The remaining authors declared no potential conflicts of interest with respect to the research, authorship, and/or publication of this article.
Data availability statement
The data supporting the findings of this study are available on request from the corresponding author. These data were derived from the following resources available in the public domain: NAMCS (https://www.cdc.gov/nchs/namcs/about/index.html); NHAMCS (https://www.cdc.gov/nchs/nhamcs/about/index.html); NICA Infusion Center Locator (![]() ).
).
Supplemental material
Supplemental material for this article is available online.
References
Supplementary Material
Please find the following supplemental material available below.
For Open Access articles published under a Creative Commons License, all supplemental material carries the same license as the article it is associated with.
For non-Open Access articles published, all supplemental material carries a non-exclusive license, and permission requests for re-use of supplemental material or any part of supplemental material shall be sent directly to the copyright owner as specified in the copyright notice associated with the article.