



Abstract
Background
Though mid-life obesity is a known risk factor for dementia, how obesity in late life impacts brain health is not well understood, especially in the presence of comorbid risk factors like hypertension (HTN) and impaired glucose tolerance (IGT).
Objective
We investigated associations between obesity, neuroimaging measures, and cognition in middle aged and older adults, specifically testing whether higher body mass index (BMI), waist circumference (WC), and waist-to-hip ratio are associated with brain health independent of HTN and IGT.
Methods
A total of 599 participants with brain MRI, cognitive testing, and anthropometric measurements were examined. Chi square and one-way ANOVA tests were performed to compare participant characteristics across BMI categories. Linear regression models assessed relationships between anthropometric, neuroimaging, and cognitive outcomes with and without adjustment for relevant covariates. We also explored interactions between anthropometric measures and APOE ε4 status and cognitive status.
Results
Higher BMI was associated with higher cerebral blood flow (CBF) in both white matter (β = 0.2294 ± 0.0431, p < 0.001) and gray matter (β = 0.0872 ± 0.0405, p = 0.032), higher free water (β = 0.0906 ± 0.0425, p = 0.034), lower fractional anisotropy (β = -0.0891 ± 0.0433, p = 0.040), and better global cognition (β = 0.022 ± 0.007, p = 0.002) and cognitive composite scores (ps < 0.01), independent of IGT and HTN. Similar associations were observed for waist circumference. Evidence of effect modification by APOE ε4 carrier status and cognitive status were found for white matter CBF, white matter hyperintensities, fractional anisotropy, and cognition.
Conclusions
Obesity measures are positively associated with better brain structure, function, and cognition in aging adults, highlighting the importance of managing body weight in older age to maintain optimal brain health.
Keywords
Introduction
Obesity during mid-life is one of the most prevalent risk factors associated with dementia in the United States, 1 with higher body mass index (BMI) and waist to hip ratio (WHR) being associated with worse brain imaging outcomes.2–5 In addition, mid-life obesity, high systolic blood pressure, and high total cholesterol all increase the risk for developing late-life dementia, highlighting the role cardiometabolic risk factors may play in dementia risk. 6 With overall prevalence rates of 41.9% for obesity, 45.1% for hypertension (HTN), and 14.8% for diabetes among adults over the age of 20 in the United States in 2020, there is cause for concern that these risk factors will negatively impact cognitive performance, gray matter perfusion, and white matter microstructure, contributing to an increased risk for dementia with advancing age.6–8 Moreover, because these risk factors often co-occur, it is not clear if obesity is an independent risk factor for dementia or if the association is driven by the presence of other comorbid conditions (e.g., HTN, impaired glucose tolerance (IGT)).
Much of the literature investigating the relationships between brain health, obesity, HTN, and diabetes focus on explicitly middle-aged adults. However, the relationships between these risk factors in mid to late life are not well understood. An “obesity paradox” between BMI and brain health or dementia risk has long been seen in older adults, suggesting that obesity in late life may confer some protection, although these findings are controversial.9–13 Apart from age and cardiometabolic risk factors, apolipoprotein E (APOE) genotype has also been shown to influence dementia risk, such that APOE ε4 carriers have worse metabolic and cognitive function and a significantly increased risk of late onset Alzheimer's disease (AD) compared to APOE ε4 non-carriers. 14 In addition, both APOE genotype and cognitive status may modify associations between obesity and brain health in late life. 9 These findings are likely confounded by the development of neuropsychiatric and behavioral symptoms with cognitive decline which negatively impact appetite and eating behaviors and may contribute to unintentional weight loss, a preclinical sign of AD.15–17 Thus, understanding these dynamic relationships will be crucial in providing weight recommendations throughout the lifespan to promote optimal cognitive and brain health.
We recently investigated associations between cardiometabolic health and brain outcomes in a cohort of older adults in the Winston-Salem, NC area, where over 50% of the cohort had HTN, IGT, or were either overweight or obese. In that cross-sectional study we found that HTN, and HTN co-occurring with IGT were associated with lower global cognitive performance, reduced gray matter perfusion, and impaired white matter microstructure as measured using magnetic resonance imaging (MRI). 8 Associations with obesity, however, were not reported, and there was no examination of potential effect modification by APOE genotype. Thus, in the present study we aimed to evaluate associations between obesity, neuroimaging measures, and cognition in this cohort, specifically testing whether higher BMI, waist circumference (WC), and WHR are protective of brain health independent of HTN and IGT. We also evaluated interactions between anthropometric measures and both APOE ε4 status and cognitive status to better understand these complicated relationships in an aging population.
Methods
Participants
Middle-aged and older adults were recruited into the Clinical Core of the Wake Forest Alzheimer's Disease Research Center (ADRC) from the surrounding area between 2016 and 2023. Participants underwent a standard evaluation in accordance with the National Alzheimer's Coordinating Center (NACC) protocol for clinical data collection, including: clinical exams, neurocognitive testing, neuroimaging, and APOE genotyping. APOE genotype was dichotomized based on the presence or absence of one or more ε4 alleles as described previously. 8 Sex and race were self-reported. Inclusion and exclusion criteria for this cohort have been described previously. 8 Written informed consent was obtained for all participants and/or their legally authorized representative. All activities described were approved by the Wake Forest Institutional Review Board (IRB00025540) and conducted in accordance with the Declaration of Helsinki. For the present analysis, all available data on the key outcomes of interest were included. The initial sample included 737 participants. A total of 138 participants were excluded due to missing BMI (N = 4), being underweight (N = 12), missing WC and/or WHR (N = 23), missing one or more covariates (N = 44), and missing all 7 of the MRI outcomes listed (N = 55). After removing these participants, a total of 599 participants were included in this analysis (Figure 1).
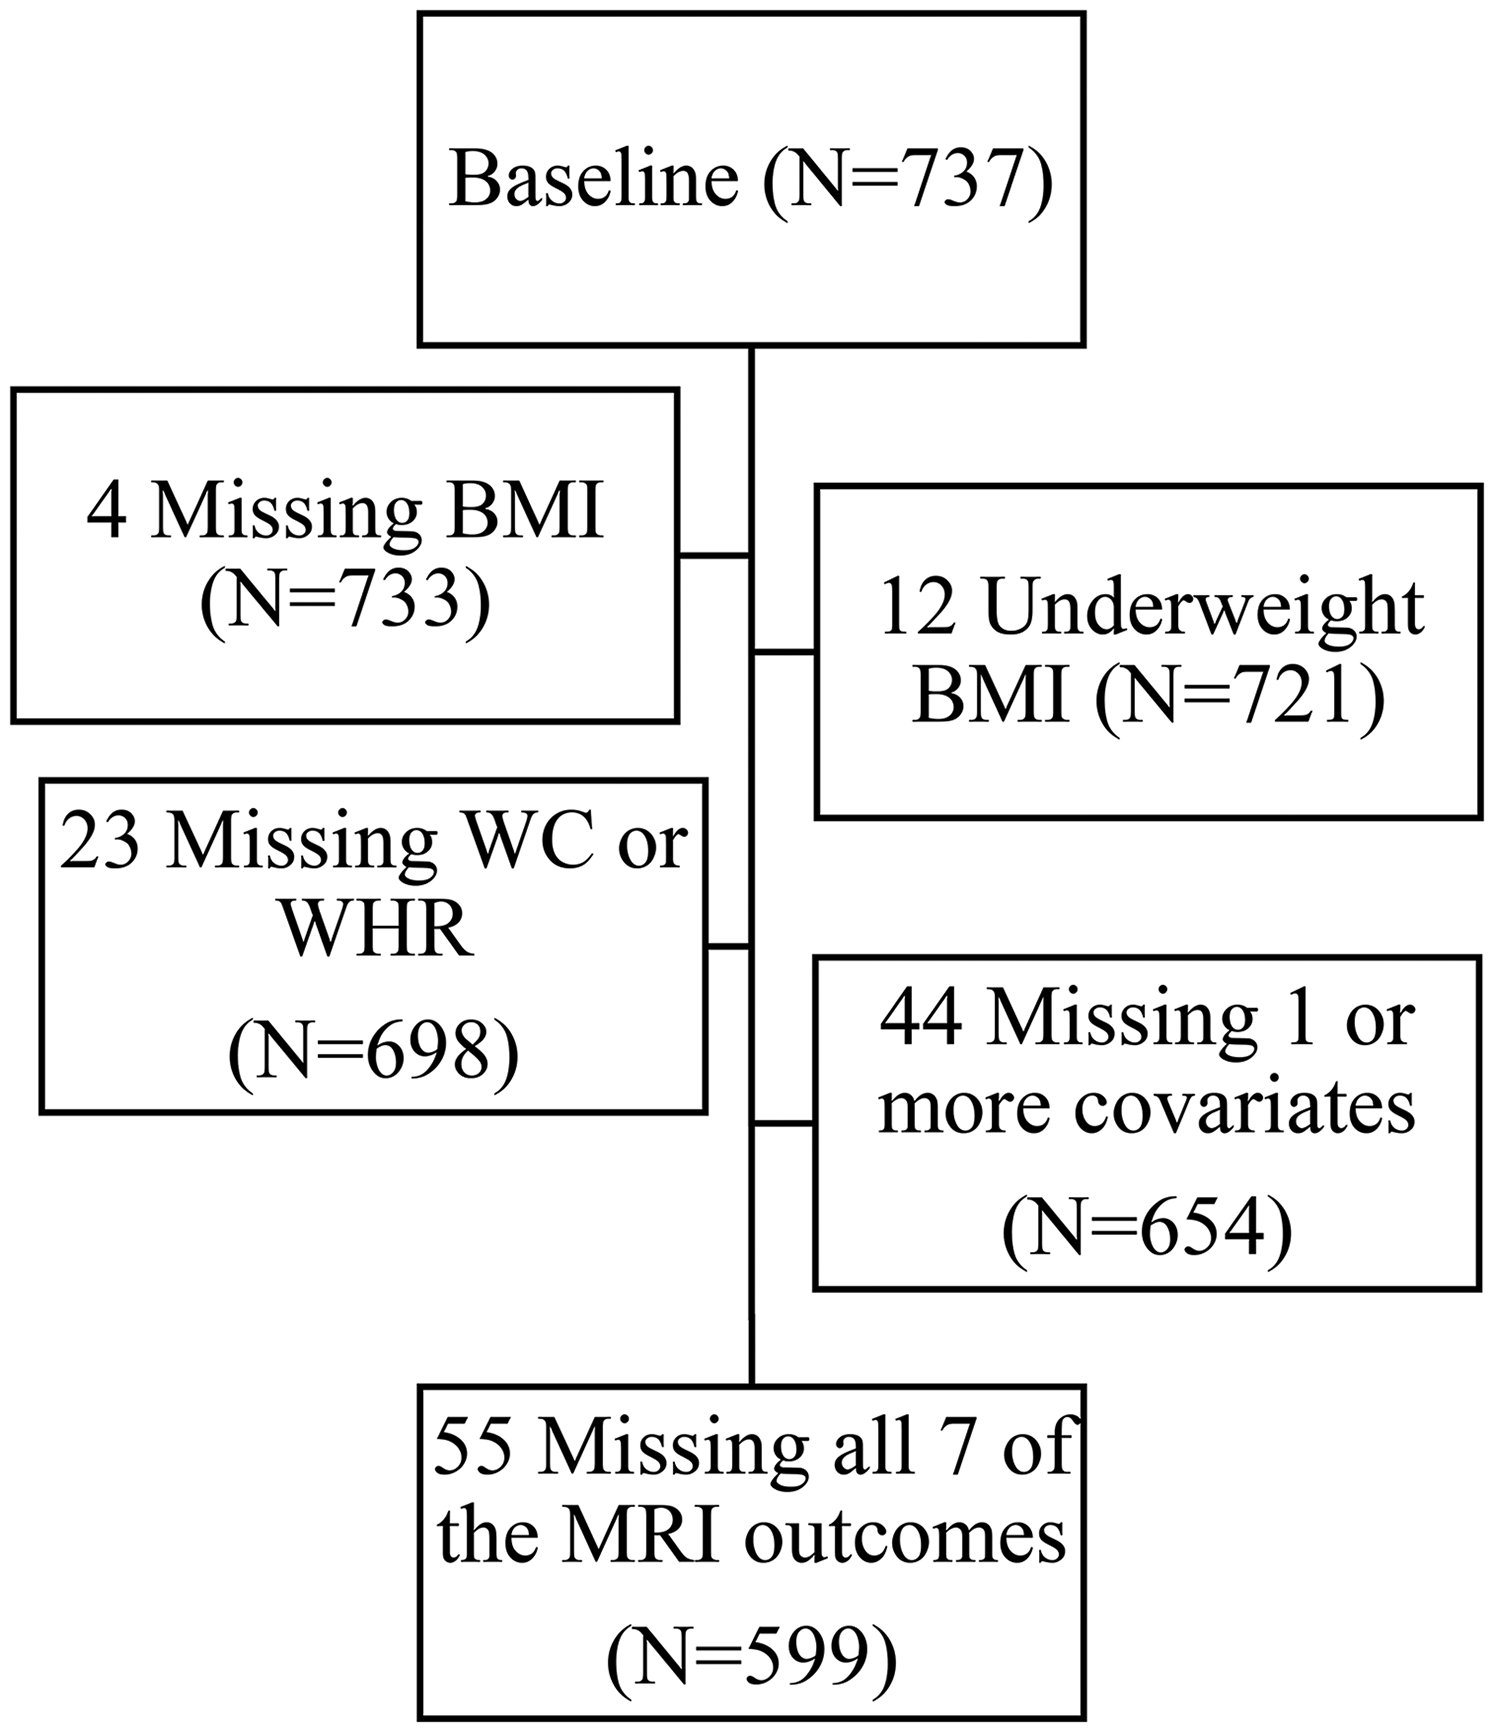
Participant selection. Sample selection process, excluding those with incomplete data. BMI: body mass index; underweight BMI: less than 18.5 BMI; WC: waist circumference; WHR: waist to hip ratio; covariates: hypertension status, impaired glucose tolerance status, or cognitive status; MRI outcomes: white matter cerebral blood flow, gray matter cerebral blood flow, neurite orientation dispersion and density imaging free water, total brain volume, white matter hyperintensities, diffusion tensor imaging DTI fractional anisotropy, and cortical thickness.
Oral glucose tolerance test and impaired glucose tolerance
Upon study entry, participants free from diabetes completed an oral glucose tolerance test (OGTT) with serial blood draws in the morning after an overnight fast. Participants ingested a 75-gram glucose solution. Blood was sampled before ingestion (time 0) and at 15-, 30-, and 120 -min post-ingestion. Blood glucose was determined using the Hemocue whole blood glucose analyzer. For those that did not complete the OGTT (i.e., participants with a diagnosis of diabetes, severe cognitive impairment, and non-compliance) fasting blood was drawn to measure hemoglobin A1c. IGT was defined by 2-h glucose ≥ 140 mg/dL or fasting hemoglobin A1c ≥ 5.7%. 8
Anthropometric and blood pressure measures
BMI was calculated by dividing the participant's measured weight (in kg) by their height (in m2). BMI was further categorized into obese (BMI ≥30), overweight (BMI: 25-<30), or normal (BMI 18.5–24.9). 18 WC was measured at the level of the umbilicus and hip circumference was measured at the level of the maximal gluteal protuberance to calculate WHR.
Brachial blood pressure was measured in a seated position after a 5-min rest in a quiet and dark room using a DINAMAP™ automated blood pressure device (GE Healthcare). Blood pressure was categorized according to the Seventh Report of the Joint National Committee on Prevention, Detection, Evaluation, and Treatment of High Blood Pressure Guidelines 19 and HTN was defined as SBP ≥ 130 mm Hg, DBP ≥ 80 mm Hg, and/or the current use of antihypertensive medications including antiadrenergic agents, angiotensin converting enzyme inhibitors, beta-blockers, calcium channel blockers, diuretics, vasodilators, angiotensin II inhibitors, or antihypertensive combination therapy agents. 8
Cognitive outcomes
Cognitive testing was completed using the Uniform Data Set Version 3 (UDSv3) 20 test battery, including the Montreal Cognitive Assessment (MoCA), Craft Story, and category fluency, as well as supplemental tests commonly used to estimate current and past cognitive status: Mini-Mental State Exam (MMSE), American National Adult Reading Test, Digit Symbol Substitution Test (DSST), Free and Cued Selective Reminding Test (FCSRT), Rey Auditory Verbal Learning Test, and multilingual naming test.20–22 UDSv3 cognitive test scores were normalized to create z-scores based on age, race, sex, and education. 23 Z-scores were combined to create composite scores for domain-specific cognitive performance for executive function, memory, language, attention, and visuospatial performance. 20 A modified Preclinical Alzheimer's Cognitive Composite (PACC5) 24 was created from five cognitive tests: the MMSE, FCSRT, Craft Story verbatim recall, DSST, and category fluency to assess cognitive differences in clinical assessments. 8 The Cognitive Change Index (CCI), a 20-item scale assessing self-reported and informant perception of cognitive decline in domains of memory, executive function, and language, was also used. 25
Adjudication and cognitive status
Cognitive status was adjudicated by an expert panel consisting of investigators with extensive experience assessing cognitive status and identifying cognitive impairment in older adults. 8 Consensus occurred following review of all available clinical, brain imaging, and cognitive data in accordance with current National Institute of Aging-Alzheimer's Association guidelines for the diagnosis of mild cognitive impairment (MCI) and dementia due to AD and related disorders.26,27
MRI measures
MRI data acquisition and processing procedures have been described previously. 8 28–30 Brain MRI scans were acquired on a 3 T Siemens Skyra with a 32-channel head coil (Erlangen, Germany). Anatomical T1-weighted (T1w), T2-Fluid Attenuated Inversion Recovery (FLAIR), diffusion weighted (for simultaneous diffusion tensor imaging [DTI] and neurite orientation dispersion and density imaging [NODDI]), and pseudo-continuous arterial spin labeling (pcASL; for whole-brain cerebral blood flow [CBF]) sequences were obtained. Structural T1w image processing included normalization and tissue segmentation using SPM12 (www.fil.ion.ucl.ac.uk/spm) CAT12 toolbox. Thickness and volume data on T1w images were generated using FreeSurfer v7.2 (http://surfer.nmr.mgh.harvard.edu/). Cortical thickness in AD-vulnerable regions was extracted from a temporal lobe meta region of interest (Temporal Meta ROI) by averaging cortical thickness of bilateral entorhinal, inferior/middle temporal, and fusiform regions. 31 Total brain volume was assessed as gray matter (GMV) plus white matter (WMV) and normalized to head size. White matter hyperintensities (WMH) were segmented by the Lesion Segmentation Toolbox (LST) v2.0.15 (https://www.applied-statistics.de/lst.html). Diffusion image preprocessing was performed as described previously to generate DTI fractional anisotropy (FA) and NODDI isotropic volume fraction (Free Water; FW) maps which were transformed to MNI space. 8 The Johns Hopkins University (JHU) DTI atlas was overlaid on template-space FA and FW maps to extract mean signal across all supratentorial white matter tracts. 32 GM and WM CBF maps were generated from pcASL processing and normalized to MNI space. 8 Automated Anatomical Labeling (AAL) 33 GM ROIs were overlaid on GM CBF images to calculate mean GM CBF in hippocampal, frontal, and temporal meta-ROI (parahippocampus, fusiform, middle, and inferior temporal cortex) regions. Additionally, a set of all supratentorial JHU WM tracts were overlaid on WM CBF images to calculate mean global WM CBF.
Statistical analysis
Chi square and one-way ANOVA tests were performed to test for differences in demographic and neurocognitive characteristics across BMI groups. Three independent linear regression models assessed the relationships between BMI, WC, and WHR with respect to neuroimaging and cognitive outcomes: Model 1 was unadjusted; Model 2 was adjusted for age, sex, race, and education; Model 3 additionally adjusted for the presence of HTN and IGT. To test if the association between obesity and each outcome differed by APOE status, we also generated models containing all Model 3 covariates plus an interaction term between obesity and APOE. Similarly, to test if the association between obesity and each outcome differed by cognitive status, we constructed models containing all Model 3 covariates plus an interaction term between obesity and cognitive status. All analyses were performed using SAS v9.4 (SAS Institute Inc, Cary, NC). The sample was restricted to the 599 participants with all 3 anthropometric measures, all Model 2 covariates, and at least one of the 7 MRI measures reported (WM CBF, GM CBF, NODDI FW, total brain volume, WMH, DTI FA, and cortical thickness). Anthropometric and MRI measures were standardized to facilitate interpretation across models. WMH was log-transformed and adjusted for FreeSurfer total intracranial volume. 8 A significance level of 0.05 was used for all statistical tests. A Bonferroni correction was applied separately for the neuroimaging outcomes (using an alpha of 0.05/7 = 0.00714) and the cognitive outcomes (using an alpha of 0.05/8 = 0.00625).
Results
Participant demographics
As shown in Table 1, the mean age of participants was 70 ± 8.2 years, 19% were African American, 48% had cognitive impairment (35% MCI and 13% dementia), 68% were overweight or obese, 76% had HTN, and 69% had IGT. On average, compared to the normal weight and overweight groups, the obese group had a higher proportion of African Americans, fewer years of education, a higher prevalence of HTN and IGT, and a larger WC and WHR. In addition, a smaller proportion of obese individuals were APOE ε4 carriers and had dementia.
Demographics and neurocognitive assessments overall and stratified by BMI category.

Final sample used for all analyses, restricted to participants with all 3 anthropometric measures, all 6 Model 2 covariates (age, gender, race, education, HTN, IGT), and at least one of the 7 MRI measures reported (see Methods). Hypertension defined as being on HTN med or Stage 1 or Stage 2 HT according to blood pressure. mPACC5 version FCSRT96 is reported. SBP: systolic blood pressure; DBP: diastolic blood pressure; IGT: impaired glucose tolerance; MoCA: Montreal Cognitive Assessment; CDR: Clinical Dementia Rating, sum of boxes.
Obesity measures and neuroimaging outcomes
BMI, WC, and WHR were all positively associated with WM CBF in fully adjusted models accounting for demographics and cardiometabolic risk factors (Table 2). BMI (p = 0.032) was also positively associated with GM CBF, while both BMI (p = 0.034) and WC (p = 0.039) were positively associated with NODDI FW. Negative associations were seen between BMI (p = 0.04) and FA in the fully adjusted models. After applying the Bonferroni correction, only the associations between BMI and WC with WM CBF remained significant.
Associations between obesity and brain imaging.

Model 1 is an unadjusted model, Model 2 is adjusted for age, gender, race, and education, and Model 3 is further adjusted for the presence of both HTN and IGT. B: beta; SE: standard error score; p: p-value, statistical significance set at 0.05.
To better understand the nature of these relationships, we evaluated interactions between the three anthropometric measures and both APOE genotype and cognitive status. Further investigation showed that APOE ε4 carrier status modified several associations (Supplemental Table 1). Specifically, both BMI and WC were positively associated with GM CBF and whole brain volume in APOE ε4 carriers (ps < 0.05), whereas no significant associations were observed in APOE ε4 non-carriers (interaction p < 0.05). In addition, we observed a negative association between BMI and WMH in APOE ε4 carriers, but a positive association in non-carriers (interaction p < 0.01). Among APOE ε4 non-carriers, BMI was also negatively associated with FA, an association that was not observed in APOE ε4 carriers (interaction p < 0.01). Cognitive status also modified relationships between anthropometric and neuroimaging measures (Supplemental Table 2). Specifically, WHR was positively associated with whole brain volume among those categorized as MCI, while negative associations were observed in individuals with normal cognition and those with dementia (interaction p < 0.05). We also observed positive associations between BMI and WMH in individuals with MCI and normal controls, whereas a negative association was observed in dementia patients (interaction p < 0.05).
Obesity measures and cognitive outcomes
BMI was positively associated with global cognition (MoCA) (p = 0.002), mPACC5 (p = 0.006), and memory (p < 0.001) in fully adjusted models (Table 3). WC was also positively associated with memory (p = 0.015), whereas WHR was negatively associated with language (p = 0.045) in fully adjusted models. After multiple comparisons correction, the associations between BMI, MoCA, mPACC5, and Memory Domain scores remained significant. No other statistically significant associations were seen between BMI, WC, WHR, and cognitive measures in fully adjusted models (Table 3). Interactions between anthropometrics, APOE genotype, and cognitive status were also examined in relation to cognitive outcomes. APOE ε4 genotype was found to significantly modify relationships between BMI and mPACC5 (p = 0.035) and BMI and memory (p = 0.039) (Supplemental Table 1). When exploring effect modification by cognitive status, we observed statistically significant interactions with all three anthropometric measures for both the mPACC5 and visuospatial domain scores (Supplemental Table 2). Cognitive status was also found to modify associations between both BMI and WC and memory (interaction p-values <0.001) and between WC and attention (interaction p < 0.05). Although the individual results varied across outcomes, in general, anthropometric variables and cognition were inversely related among those with normal cognition, while associations were less consistent for individuals with MCI and dementia.
Associations between obesity and cognitive measures.
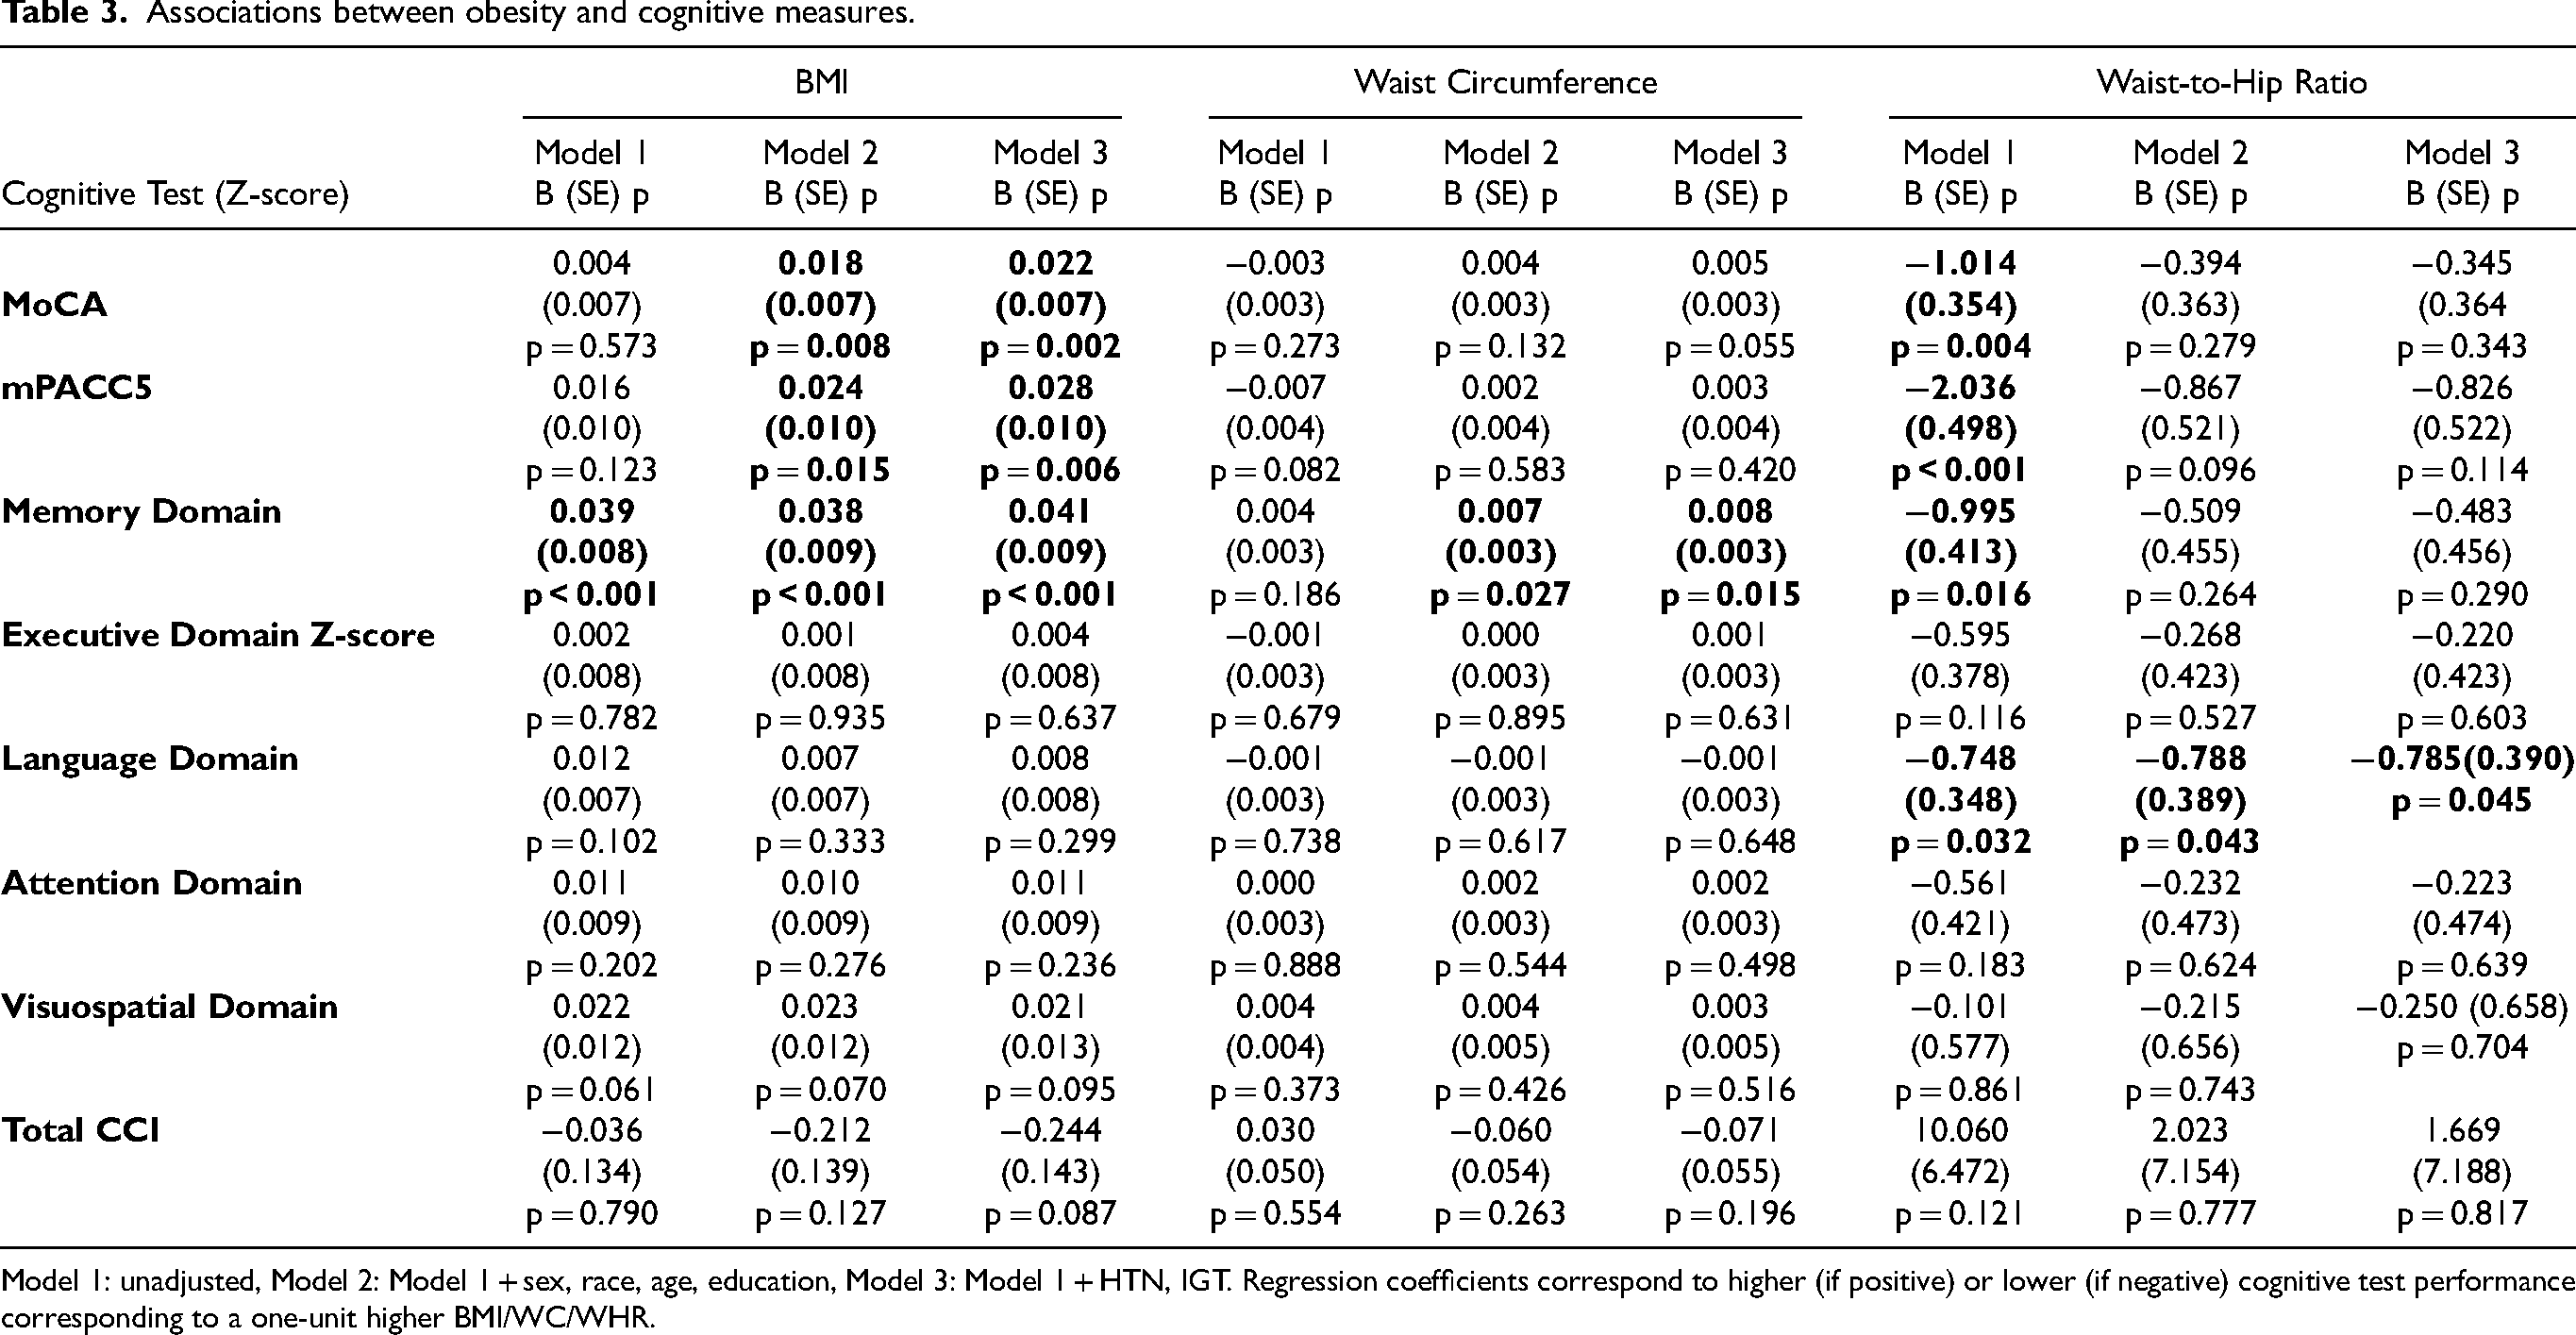
Model 1: unadjusted, Model 2: Model 1 + sex, race, age, education, Model 3: Model 1 + HTN, IGT. Regression coefficients correspond to higher (if positive) or lower (if negative) cognitive test performance corresponding to a one-unit higher BMI/WC/WHR.
Discussion
In this study, we sought to determine whether associations between anthropometric measures (BMI, WC, WHR) and brain outcomes (neuroimaging biomarkers and cognitive measures) are independent of cardiometabolic health status in older adults. Within the Wake Forest ADRC Clinical Core, those with higher BMI, WHR, and WC had higher WM CBF values independent of the presence of IGT and HTN. Positive associations between anthropometric and cognitive variables were also observed, and in some cases, the associations were significantly modified by APOE ε4 genotype and cognitive status. These results demonstrate that having a higher BMI and WC in mid to late-life is not entirely driven by obesity-related HTN and IGT.
We are not the first to report positive associations between anthropometric measures and brain health outcomes in older adults. The obesity paradox in later life has long been documented, with some literature even suggesting a U-shaped relationship between brain health and obesity over the lifespan.10,11,34,35 The landmark Whitehall II study found that in people younger than 65, being obese was associated with a greater incidence of dementia, while being obese at the age of 65 years or older was associated with less risk. 36 Data from recent systematic reviews and meta-analyses also report conflicting evidence on the relationship between anthropometric measures, cognition, and dementia risk, illustrating that the debate continues.37–40 A study by Sun et al. investigating both fluid and imaging biomarkers in non-demented older adults from the Alzheimer's Disease Neuroimaging Initiative (ADNI) database found that higher baseline BMI was associated with a more favorable AD risk profile including higher CSF Aβ42, lower t-tau and t-tau/Aβ42, less amyloid pathology in the brain, and larger brain volumes in AD-vulnerable regions. 41 In longitudinal analyses, they also found that higher late-life BMI was associated with less cognitive decline and a lower risk of AD over six years of follow-up. 41 Research from the UK Biobank also demonstrated that baseline BMI was positively associated with changes in brain volume. 42 Specifically, BMI was positively associated with subsequent changes in regional GM volume in numerous areas, regional WM volume in widespread white matter tracts, and FA changes in multiple tracts. 42 However, some negative associations were also observed between BMI and GM volume in the bilateral areas around the medial temporal lobe. 42 Higher cognitive performance among overweight and obese individuals as compared to their normal weight counterparts has also been seen in adults over 65, even after controlling for sex, blood pressure, and diabetes mellitus. 35
Some studies have described the presence of an inverse relationship between increasing BMI, WHR, or WC measured in mid to late life and brain volume,43–49 as well as GM CBF 50 and overall CBF. 51 Others found no statistically significant associations between obesity measures and brain imaging markers in older adults. 52 We found positive associations between all three obesity measures and CBF, specifically in the WM. While WM CBF has been associated with WM microstructure in several studies,53,54 the physiological relevance of higher WM CBF in obesity remains unclear. In the context of WM, it has been reported that CBF is lower within WMH than in normal appearing WM and that higher WMH volume in older patients with hypertension is associated with lower CBF within WMH, suggesting WMH represent areas of focal perfusion deficits which are more severe than global hypoperfusion. 55 However, it is not clear if compensatory changes in CBF occur in response to neurodegeneration and whether these changes are transient or sustained with further disease progression.
Our findings are consistent with the literature on relationships between anthropometrics and brain health outcomes being modified by APOE status. A longitudinal study also examining the relationship between BMI and brain health outcomes in APOE ε4 carriers and noncarriers found evidence that weight maintenance, rather than weight loss or gain, in late life can decrease the risk of dementia, especially for APOE ε4 carriers. 56 Another study found that among Aβ negative, APOE ε4 carriers, faster BMI decreases were associated with increased Aβ accumulation. 57 The same increased Aβ accumulation was found longitudinally for Aβ positive, APOE ε4 noncarriers, inciting concern for those experiencing rapid BMI changes over the age of 70. 57 Similar BMI by APOE genotype interactions have been observed for cognitive decline, with a lower effect of the ε4 allele on cognitive decline in obese participants compared to normal weight participants. 58 Our study adds the novel findings that among APOE ε4 carriers, higher BMI is associated with higher GM CBF, lower WMH, and better memory, associations that are weaker or even reversed in APOE ε4 non-carriers. Additionally, there was some suggestion that the associations with BMI were stronger in those with cognitive impairment. Collectively, these data point to the clinical relevance of body weight changes in the pathophysiology of AD and related disorders, particularly in those at higher genetic risk and those further along the disease spectrum. 17
The positive relationship between BMI and various neuroimaging outcomes observed in late-life is a controversial one. The results here may be driven by age-related changes in body composition, especially since no evidence of a U-shaped relationship was found among our models. Diminished BMI in later life has been established as an indicator of reduced muscle mass, bone mineral density loss, and increased fracture risk.59–62 The present study adds to the narrative that diminished BMI in later life may contribute to worse brain health. As loss in muscle mass, strength, and function has been linked to brain atrophy and cognitive decline in older adults,63–65 the totality of evidence suggests the existence of shared mechanisms in both sarcopenia and dementia. 63 Indeed, studies investigating associations between sarcopenia (i.e., low muscle mass and strength), obesity, and dementia indicate that individuals with both conditions (i.e., sarcopenic obesity) have the greatest risk for dementia, followed by those with sarcopenia alone.66–68 In the absence of body composition measurements in the current study, it stands to reason that sarcopenic obesity is prevalent in this population and that lean muscle mass is a driving factor underlying the positive relationships observed between BMI and brain outcomes.
It is important to note that many of the studies describing inverse relationships focused on younger participants than those in the Wake ADRC. In addition, many of these studies only included cognitively normal individuals, whereas nearly half of our cohort had MCI or dementia. Our work suggests that obesity may have different associations with brain health depending on the stage of disease (e.g., cognitive status). Our study was cross-sectional, preventing the examination of changes in BMI, WC, or WHR and their impact on associations between brain health and cognitive outcomes in the presence of HTN and IGT. Additionally, we only investigated anthropometric measures of obesity. This limited our ability to assess lean mass, body fat distribution, and their potential relationships with brain health measures. Imaging-based methods such as dual energy x-ray absorptiometry could provide these measures for additional analysis. Collectively, these limitations also impacted our ability to assess potential mechanisms underlying the observed obesity paradox, such as reverse causation (due to unmeasured variables related to recent weight loss or pre-existing health conditions) and misclassification bias (due to the limitations of BMI as a measure of obesity). The lack of diversity in this cohort is also a limitation as the analysis performed here consisted of predominantly older White females, limiting our generalizability. Although ∼20% of our population was African American, the relatively small sample precluded our ability to examine racial and ethnic differences.
Despite these limitations there were important strengths, including the incorporation of HTN and IGT analysis coupled with anthropometric measures. This study was the first to investigate the relationships between brain health, obesity measures, and cardiometabolic health factors in the Wake ADRC cohort. This unique cohort has well-established procedures for diagnosing dementia and MCI, developed by the National Alzheimer's Coordinating Center for use at ADRCs. With 50% of our study population being 70 and older, the age of this cohort is also a notable strength. Much of the literature examining relationships between adiposity measures and brain health outcomes in older adults focus on those below the age of 70. This understudied population is unique and growing rapidly, making it vital to better understand what health recommendations are in their best interest. In the future, investigating the presence of metabolic syndrome in the presence or absence of obesity (i.e., obesity phenotypes) in this group may provide additional insight into the dynamic relationships between brain health, cognitive measures, and metabolic risk factors in older adults over 70.
In conclusion, our findings demonstrate that in older community-dwelling adults, higher BMI, WHR, and WC are related to better brain health, independent of the presence of IGT and HTN. This was particularly true for WM CBF, APOE ε4 carriers, and those with cognitive impairment. Taken together, these findings highlight the importance of maintaining a healthy BMI and WC with advancing age, calling for a need for better weight management recommendations in older adults, with a focus on optimizing body composition and minimizing unintentional weight loss. From a clinical and public health perspective, it is imperative that we adequately measure risk factors for dementia across the life course to better prevent the onset and progression of AD and other neurodegenerative diseases. With respect to obesity, the growing recognition of the heterogeneity in obesity risk and related health outcomes, coupled with the emergence of new anti-obesity medications, will require researchers and healthcare providers to utilize innovative approaches to address obesity and dementia prevention in the context of an aging population.
Supplemental Material
sj-docx-1-alz-10.1177_13872877251393500 - Supplemental material for Obesity, cardiometabolic health status, and brain health in community-dwelling older adults
Supplemental material, sj-docx-1-alz-10.1177_13872877251393500 for Obesity, cardiometabolic health status, and brain health in community-dwelling older adults by Kathryn H Alphin, Cynthia K Suerken, Marc D Rudolph, Sarah Gaussoin, Samuel N Lockhart, Suzanne Craft and Tina E Brinkley in Journal of Alzheimer's Disease
Footnotes
Acknowledgements
This project would not be possible without the commitment and support of our valued ADRC staff and participants.
ORCID iDs

Ethical considerations
All procedures carried out by the Alzheimer's Disease Clinical Core Study (ADCC, IRB00025540) are approved by Wake Forest University's institutional review board (IRB; FWA00001435). ADCC was initially approved by the IRB on 10/24/2013 and is reviewed for continuation by the IRB annually. All participants complete informed consent prior to the initiation of study procedures. Consent capacity is evaluated using the University of California, San Diego Brief Assessment of Capacity to Consent (UBACC). If participants do not have consent capacity, a legally authorized representative is engaged to consent on behalf of the participant, and assent is obtained from the study participant.
Consent to participate
Written informed consent was obtained for all participants and/or their legally authorized representative. All activities described were approved by the Wake Forest Institutional Review Board and conducted in accordance with the Declaration of Helsinki.
Consent for publication
Not applicable
Author contribution(s)
Funding
The authors disclosed receipt of the following financial support for the research, authorship, and/or publication of this article: This work was partially supported by the Wake Forest University Alzheimer's Disease Research Center (grant number P30AG072947), which is funded by the National Institute on Aging.
Declaration of conflicting interests
The authors declared no potential conflicts of interest with respect to the research, authorship, and/or publication of this article.
Dr. Lockhart is a full-time employee of Perceptive, Inc.
Data availability statement
Supplemental material
Supplemental material for this article is available online.
References
Supplementary Material
Please find the following supplemental material available below.
For Open Access articles published under a Creative Commons License, all supplemental material carries the same license as the article it is associated with.
For non-Open Access articles published, all supplemental material carries a non-exclusive license, and permission requests for re-use of supplemental material or any part of supplemental material shall be sent directly to the copyright owner as specified in the copyright notice associated with the article.
