



Abstract
Background
Alzheimer's disease (AD) and age-related macular degeneration (AMD) are two common neurodegenerative diseases with many similar pathological features, but their shared metabolic characteristics have not been fully elucidated.
Objective
This study aims to explore the shared metabolic pathways between AD and AMD using an integrated multi-omics strategy.
Methods
We incorporated Mendelian randomization (MR), bulk and single-cell transcriptomics, and targeted metabolomics to investigate the metabolic links.
Results
Through MR, we found elevated genetically inferred glutamine concentrations were correlated with a lower likelihood of AD but a higher likelihood of AMD. Using transcriptomic profiling, we detected 19 common differentially expressed genes associated with glutamine and glutamate metabolism, such as GLS. Analysis of single-cell RNA sequencing data revealed that GLS displays distinct cell-type expression patterns. Targeted metabolomic profiling in APP/PS1 mice at 5 months of age provided additional evidence for alterations in glutamine metabolism. The degree of metabolic changes in the eyes was higher than that in the cortex and hippocampus, and the prominent eyes may be an early indicator of neurodegenerative metabolic dysfunction.
Conclusions
Overall, these findings suggest that glutamine metabolism disorders represent a convergent mechanism between AD and AMD. Our findings shed light on the overlapping metabolic pathways linking AD and AMD, underscoring the value of ocular biomarkers as promising tools for early disease detection.
Keywords
Introduction
Alzheimer's disease (AD) represents the leading cause of dementia worldwide, with more than 34 million people currently affected. 1 The condition manifests as gradual deterioration in cognition, including deficits in memory and behavioral regulation, and imposes substantial challenges not only for patients but also for caregivers and healthcare infrastructures across the globe.2,3 AD is pathologically defined by the accumulation of amyloid-β (Aβ) deposits outside neurons, the formation of intracellular tangles of hyperphosphorylated tau, and widespread disturbances in synaptic integrity and neuronal survival, particularly within the hippocampus and cortex.4,5 Although intensive research efforts have spanned several decades, its underlying causes remain poorly understood and disease-modifying therapies have yet to be realized. 6 Due to the interaction of multiple molecular and cellular events involved in AD, identifying new biomarkers and elucidating their potential mechanisms is crucial for enhancing early diagnosis, prognostic assessment, and development of treatment strategies.
Age-related macular degeneration (AMD) ranks among the predominant causes of irreversible central vision impairment in people over 60, currently affecting nearly 200 million individuals worldwide, with prevalence expected to escalate alongside global population aging.7,8 The disease primarily involves pathological changes in the retinal pigment epithelium (RPE), photoreceptors, and the choriocapillaris, resulting in progressive macular degeneration.9–11 Its etiology is multifactorial, encompassing oxidative injury, dysregulated mitochondrial activity, complement system abnormalities, lipid deposition, and persistent inflammation. 12 More and more evidence also suggests that metabolic disorders, especially lipid and amino acid pathways, contribute to the development of AMD.13,14
Although AD primarily compromises the brain while AMD affects the retina, increasing data suggest that the two disorders converge on similar pathogenic pathways. Shared mechanisms include Aβ accumulation, persistent inflammatory signaling, oxidative stress, mitochondrial dysfunction, and metabolic dysregulation. 15 Evidence further indicates that Aβ aggregates are detectable not only in the brains of AD patients but also in the retinas of both AD and AMD cases. 16 In addition, the two conditions exhibit overlapping risk factors such as aging, smoking, dyslipidemia, hypertension, atherosclerosis, obesity, and poor dietary habits. 17 Given that the retina represents a direct outgrowth of the central nervous system, structural or molecular alterations in retinal tissue may mirror neurodegenerative changes in the brain. This conceptual link has heightened interest in identifying common biomarkers and molecular pathways that could connect AD and AMD, particularly those related to metabolic homeostasis, synaptic impairment, and neuroinflammation.
Growing evidence suggests that disturbances in metabolic regulation contribute significantly to both AD and AMD. Early manifestations of AD include impaired cerebral glucose metabolism, while disruptions in lipid homeostasis further exacerbate disease progression by promoting abnormal aggregation of Aβ and tau proteins.18–21 Similarly, lipid metabolism disorders are associated with functional impairment of RPE in AMD patients. 22 More importantly, new evidence suggests that amino acid metabolism disorders may be a common feature of these two diseases. The development of AD is accompanied by metabolic changes in various amino acids such as valine and arginine.23,24 Similarly, glutamate, glutamine, alanine, and phenylalanine show significant changes in AMD patients.25,26 These research results suggest that amino acid metabolism may become a biochemical hub connecting the brain and retinal neurodegenerative diseases.
Building on the concept of the retina as a reflective indicator of cerebral pathology, we propose that shared metabolic disturbances, especially in amino acid pathways, may contribute to both AD and AMD, providing a biochemical connection between retinal changes and neurodegeneration. To test this hypothesis, we conducted an integrated multi-omics study combining Mendelian randomization (MR), bulk transcriptomics, single-cell RNA sequencing, and targeted metabolomics (Figure 1). We conducted MR analyses to explore whether variations in circulating amino acid levels might causally influence the risk of developing AD and AMD. Then, transcriptomic analyses were carried out to identify differentially expressed genes related to amino acid metabolism in both disorders. To investigate candidate genes at single-cell resolution, we applied single-cell RNA sequencing to examine their expression patterns across distinct cell types in both brain and retinal tissues. Finally, targeted metabolomics was performed to assess regional differences in amino acid levels within the brain and eye. This integrative analysis sought to identify common metabolic pathways and molecular features underlying both AD and AMD. By revealing these shared mechanisms, it supports the potential application of ocular biomarkers for early detection and monitoring, while also informing the development of therapeutic strategies targeting shared metabolic processes.
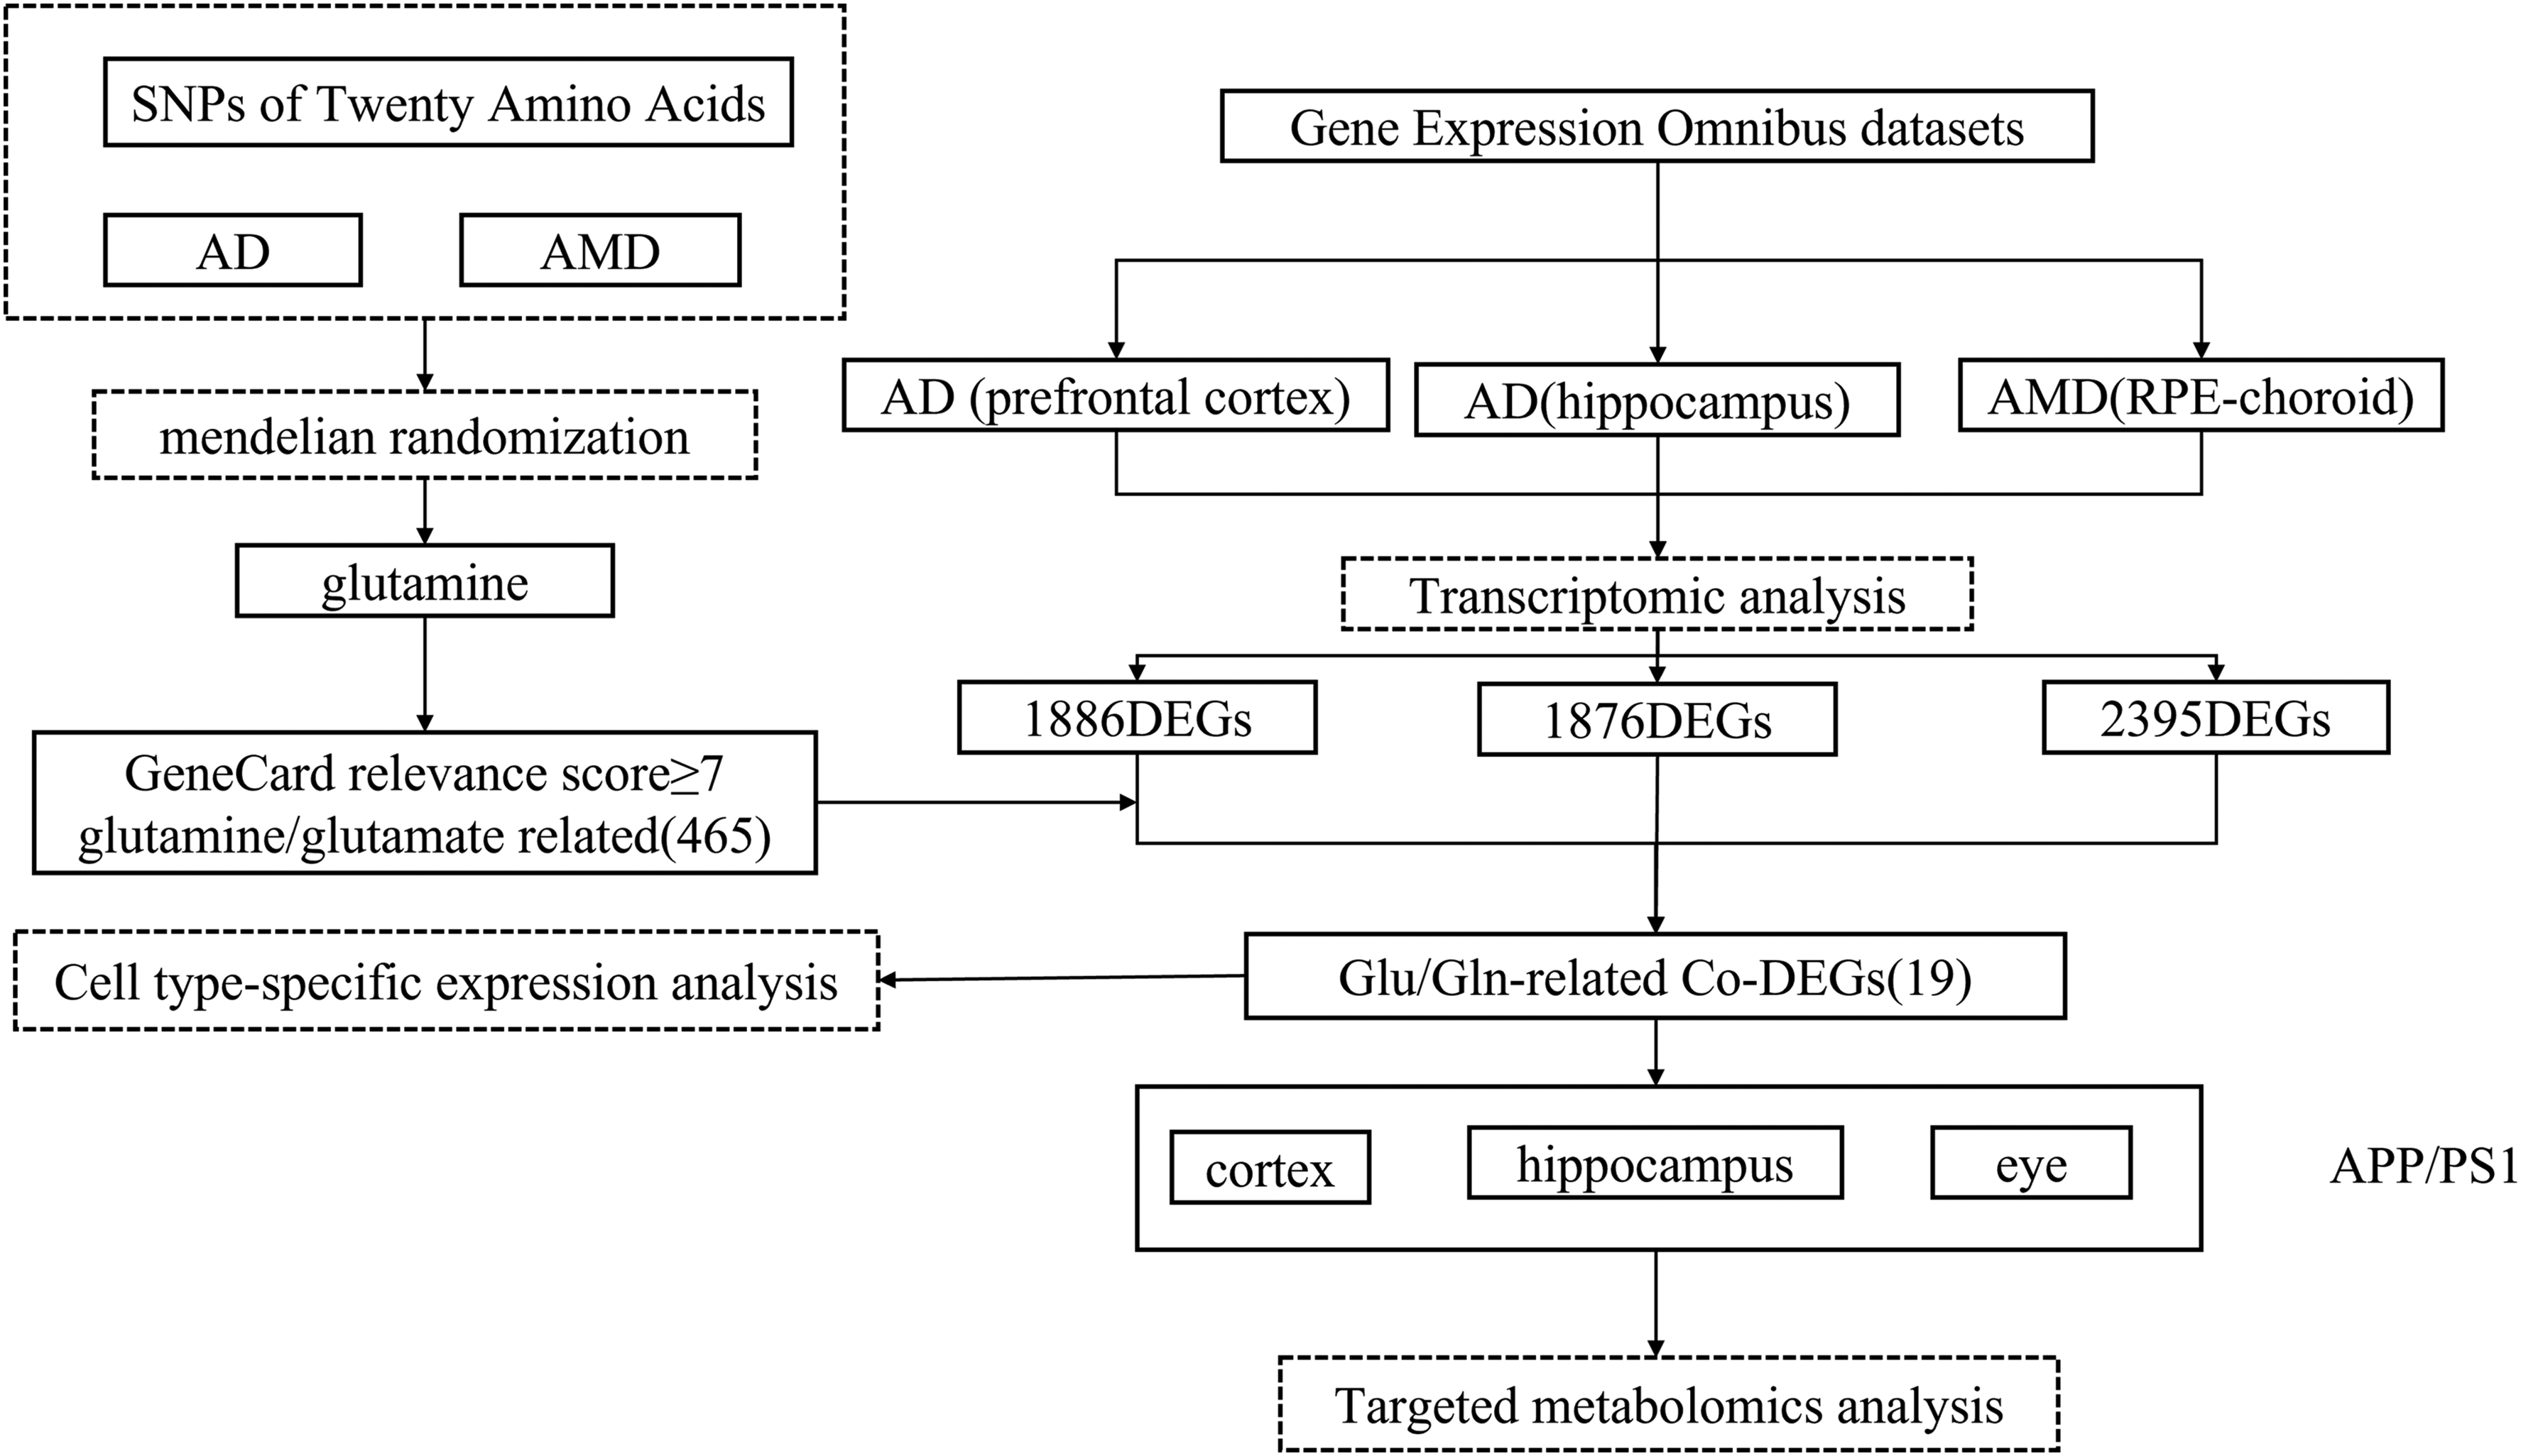
Research technology roadmap.
Methods
MR analysis
We applied two-sample MR to explore whether variations in circulating amino acid concentrations might causally influence the susceptibility to AD and AMD. MR is an established epidemiological method that relies on three key premises to infer causality between an exposure and a disease outcome. (1) The instrumental variables, represented by single-nucleotide polymorphisms (SNPs), must be robustly associated with amino acid levels, which serve as the exposure in the present analysis of AD and AMD. (2) These genetic variants should not be related to potential confounders. (3) The influence of the selected SNPs on AD and AMD risk should operate solely through their effect on amino acids. 27 We obtained summary-level genetic association data for 20 amino acids from Lotta et al.'s comprehensive genomic atlas of the plasma metabolome, which prioritized metabolites linked to human diseases and provided genome-wide association study (GWAS) results across European cohorts. 28 Corresponding GWAS datasets for AD and AMD were retrieved from the IEU OpenGWAS Project, with dataset identifiers ieu-b-2 (AD) and ebi-a-GCST010723 (AMD), respectively. Supplemental Table 1 provides detailed information on the exposure and outcome data sources used for MR analysis.
For each amino acid, instrumental variables were defined as SNPs meeting a significance threshold of p < 1 × 10⁻⁵. To maintain independence among the selected variants, clumping was performed using a linkage disequilibrium criterion of r2 < 0.001 within a 10,000 kb region. The strength of each instrument was evaluated using the F statistic, calculated as F = [R2(N−2)/(1−R2)], and only SNPs with F values greater than 10 were retained for further analysis.
MR analyses were primarily carried out using the inverse variance weighted (IVW) approach, complemented by MR-Egger, weighted median, and weighted mode methods to ensure robustness. Sensitivity analyses evaluated heterogeneity via Cochran's Q test and horizontal pleiotropy using the MR-Egger intercept. The influence of individual instrumental variables was further assessed with leave-one-out analysis. All analyses were performed in R using the TwoSampleMR and MRPRESSO packages.
Transcriptomic analysis of AD and AMD
Gene Expression Omnibus (GEO) databases were used to explore transcriptional alterations associated with AD and AMD. AD-related datasets were obtained from two key brain regions: the prefrontal cortex and the hippocampus. The prefrontal cortex datasets included GSE33000 (310 AD patients and 157 controls), GSE44770 (129 AD and 101 controls), and GSE150696 (9 AD and 9 controls). Hippocampal datasets included GSE5281 (10 AD and 13 controls) and GSE48350 (19 AD and 43 controls). Due to the limited availability of datasets, only two datasets were used for the hippocampal region. The limma package was employed to detect differentially expressed genes (DEGs) between groups. Quantile normalization followed by log2 transformation were carried out prior to analysis for non-processed databases. Genes were considered differentially expressed if they exhibited a false discovery rate (FDR) adjusted p-value below 0.05. No threshold for log2 fold change (log2FC) was applied. AD-associated DEGs were determined by identifying genes common to all three prefrontal cortex datasets, and separately, those shared across the two hippocampal datasets.
Gene expression data from the retina and RPE-choroid region of GSE29801 database was used for AMD analyses. The dataset included participants with ages spanning from 9 to 94 years. To reduce confounding due to age, we performed age matching using the MatchIt package in R, resulting in 38 matched AMD patients and 38 controls. Unadjusted p < 0.05 as the cutoff was used for identifying DEGs.
GeneCards database was used to obtain genes involved in glutamine- and glutamate-related pathways with a relevance score greater than 7. The intersection was further carried out between the DEGs from AD and AMD tissues and glutamine- and glutamate-related genes to identify shared dysregulated genes potentially involved in glutamine or glutamate metabolism of AD and AMD.
Single-cell RNA sequencing analysis
Single-cell RNA sequencing data were processed with the Seurat package (v5.2.1) in R. The study incorporated three publicly available datasets: GSE157827 (cortex), GSE175814 (hippocampus), and GSE135922 (retina and RPE-choroid related to AMD).
For the prefrontal cortex dataset (GSE157827), quality control filtering excluded cells with over 10% mitochondrial gene expression, fewer than 1000 or more than 20,000 total RNA counts, or with detected gene counts outside the 500–6000 range. The SCTransform function was applied for normalization and scaling. Dimensionality reduction was performed using the first 25 principal components, followed by UMAP-based clustering. Cell types were annotated manually according to canonical marker genes and guidance from previously published studies.
For the hippocampus dataset (GSE175814), cells were filtered to exclude those with over 5% mitochondrial gene expression, total RNA counts outside 1000–20,000, or detected gene counts outside 500–6000. SCTransform was used for normalization and scaling, and the Harmony algorithm was applied to correct for batch effects. Two thousand highly variable genes were selected for integration. PCA was performed, with the top 20 principal components used for subsequent clustering. Dimensionality reduction and visualization were carried out using UMAP, and cell types were manually annotated based on canonical markers and previously published studies.
For the AMD retinal dataset (GSE135922), quality control filtering removed cells with mitochondrial gene expression exceeding 5%, total RNA counts below 1000 or above 20,000, or detected gene numbers outside the 500–6000 range, following the same criteria as applied to the hippocampus dataset. Normalization and scaling were conducted using SCTransform, and Harmony was used to correct batch effects across samples. Integration was based on 2000 highly variable genes, followed by PCA. Clustering was performed using the top 20 principal components, and UMAP was applied for dimensionality reduction and visualization. Cell types were manually annotated using established retinal markers and reference studies.
Experimental material
Materials. A total of 24 male mice were included in this study: six 5-month-old APP/PS1 transgenic mice, six age-matched wild-type controls, six 12-month-old APP/PS1 mice, and six corresponding wild-type littermates. All mice were obtained from the Zhejiang Animal Experiment Center. Animals were housed in ventilated cages under controlled conditions (temperature 18–22°C, relative humidity 55–65%) with a 12-h light/dark cycle, and provided with food and water ad libitum.
All chemicals and solvents were of analytical grade. Reference standards including glutamate (>99%), glutamine (>99%), urea (>99%), ornithine (>99%), histidine (>99%), phenylalanine (>99%), arginine (>99%), citrulline (>99%), and aspartate (>99%) were obtained from Alta Scientific Co., Ltd Formic acid was sourced from Sigma-Aldrich (St Louis, MO, USA), while methanol and acetonitrile were obtained from Merck (Darmstadt, Germany). Ultrapure water was generated using a Milli-Q purification system (Millipore, Billerica, MA, USA).
Sample preparation. Mice were deeply anesthetized with isoflurane before being euthanized via cervical dislocation. Brain regions (cortex and hippocampus) and ocular tissues, including the retina and left eye, were harvested. The preparation of samples followed the procedures described in our previous study. 29
Targeted metabolomics analysis
Chromatographic separation was performed on an Acquity UPLC HSS T3 column (1.8 µm, 2.1 mm × 100 mm, Waters, Eschborn, Germany) maintained at 40°C, with a flow rate of 0.25 mL/min. The mobile phase consisted of solvent A (water containing 0.1% formic acid) and solvent B (acetonitrile). Gradient elution was carried out as follows: 0–1.0 min, 1% B; 1.0–2.0 min, 1–10% B; 2.0–7.0 min, 10–95% B; 7.0–10 min, 95% B; 10.0–10.1 min, 95–99% B; 10.1–13.0 min, 99% B. Each sample (5 µL) was injected for analysis.
Ion detection was achieved using a Xevo TQ Absolute triple quadrupole mass spectrometer operating in fast positive/negative ion switching mode. Multiple reaction monitoring (MRM) was employed. Source parameters were set as follows: temperature 150°C, capillary voltage 2.0 kV, cone voltage 10 V, cone gas flow 150 L/h, desolvation temperature 400°C, and desolvation gas flow 1000 L/h.
Statistical analysis
Statistical analyses were performed in R software (version 4.3.2). Prior to testing, metabolite concentrations were log2-transformed to approximate a normal distribution. For pairwise comparisons, an independent two-tailed t-test was applied. A p-value below 0.05 was considered indicative of statistical significance.
Results
Variations in circulating amino acid levels are linked to altered risks of both AD and AMD
Our MR analysis highlighted distinct roles of amino acids in AD susceptibility. Genetically predicted higher glutamine levels were associated with a reduced risk (OR = 0.90, 95% CI: 0.84–0.97, p = 0.008, Figure 2). Conversely, higher genetically predicted glutamate levels were associated with an increased AD risk (OR = 1.11, 95% CI: 1.00–1.23, p = 0.041). In addition, genetically predicted tyrosine levels showed a negative association with AD risk (OR = 0.89, 95% CI: 0.82–0.97, p = 0.007). Other amino acids that did not reach statistical significance are presented in Supplemental Table 2.
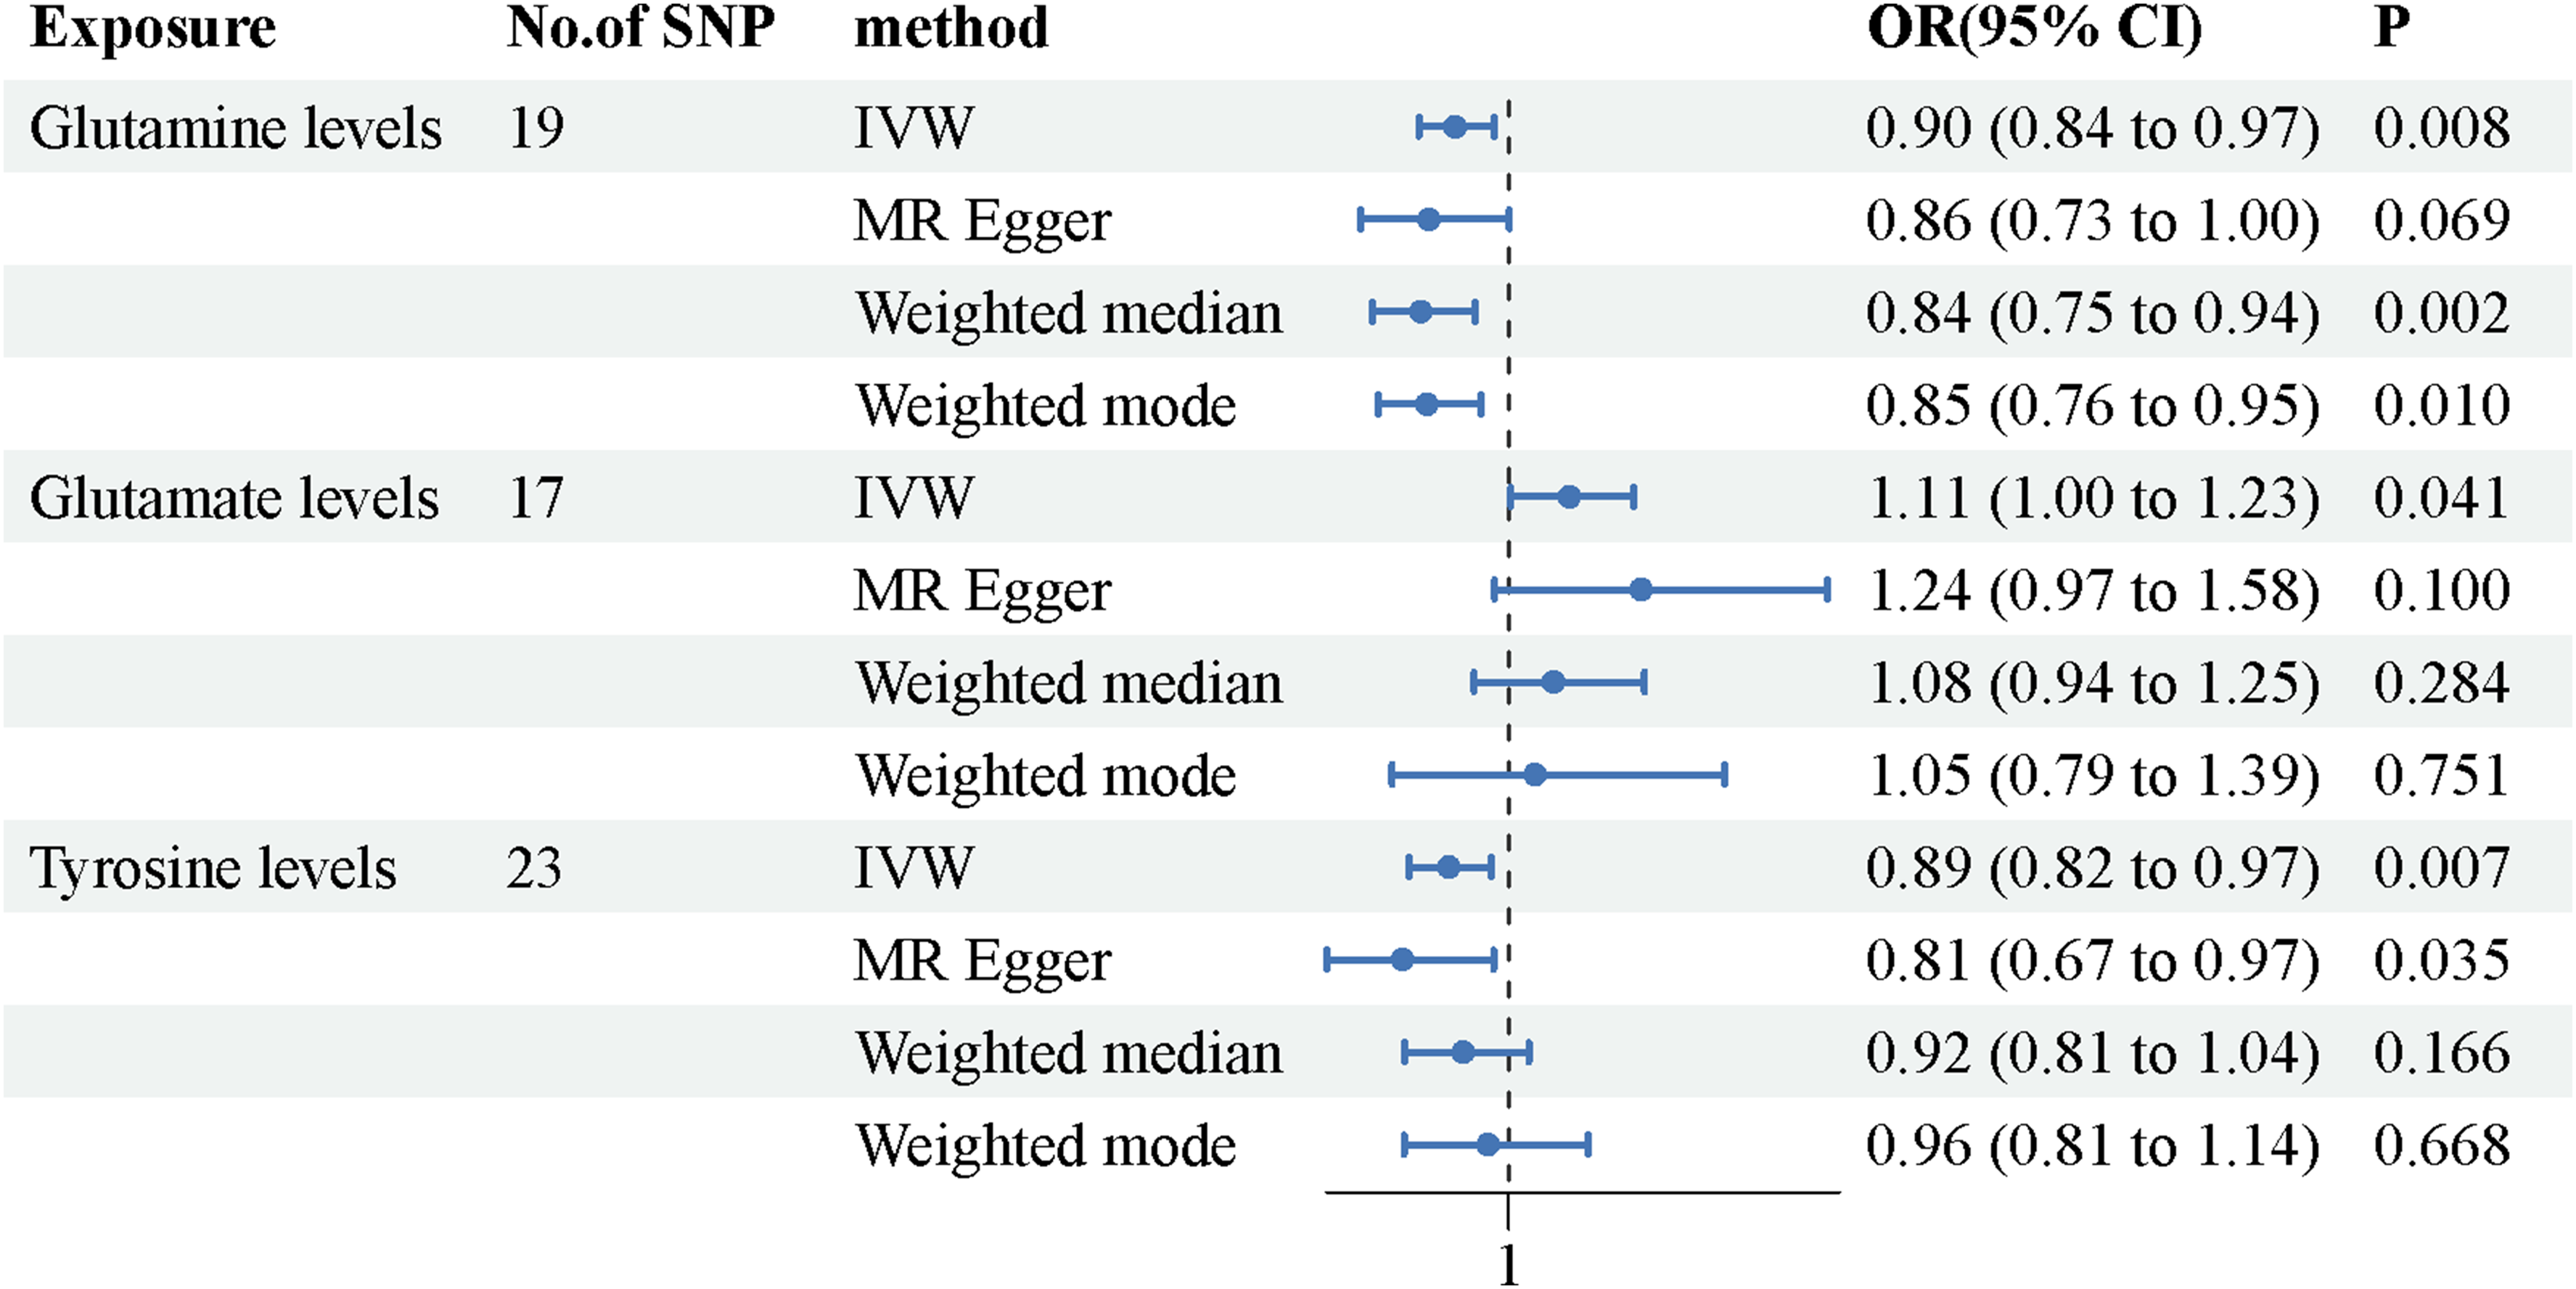
Forest plot summarizing the association between circulating amino acid concentrations and AD based on MR analyses.
Analysis using the IVW approach indicated that genetically inferred glutamine concentration was linked to an increased likelihood of AMD (OR = 1.07, 95% CI: 1.00–1.15, p = 0.046; Figure 3). However, estimates derived from other MR methods did not reach statistical significance. Results for other amino acids that were not statistically significant across these methods are provided in Supplemental Table 3.

Forest plot summarizing the association between circulating amino acid concentrations and AMD. The causal relationship was inferred using multiple MR approaches.
The sensitivity assessment revealed neither heterogeneity nor directional pleiotropy, thereby reinforcing the reliability of the instrumental variables and the robustness of the causal inference. To further illustrate result stability, scatter and funnel plots were generated (Supplemental Figures 1–16).
Differentially expressed genes analyses of AD and AMD
In the prefrontal cortex, 1886 genes exhibited differential expression, while 1876 were identified in the hippocampus. The gene expression profiles distinguishing AD cases from controls are displayed as volcano plots in Figures 4(a) and 4(b), respectively. Similarly, 2395 DEGs were identified in the AMD dataset (Figure 4(c)). Furthermore, a GeneCards search retrieved 465 genes associated with glutamine and glutamate metabolism (Supplemental Table 4). The intersection of DEGs from the prefrontal cortex of AD, AMD DEGs and the glutamine/glutamate-related genes resulted in 14 overlapping genes: APP, ATM, CAMK2G, DNM3, GFPT1, GLS, GNAS, GOT1, GRIK1, GRM5, GSR, ITGB1, KRAS, and MAPK10. Meanwhile, the corresponding intersection using the hippocampal DEGs identified 10 overlapping genes: APP, ATM, CREB1, GATB, GLS, GNAS, GRIA3, KRAS, MAPT, and SREK1. Among these, five genes including APP, ATM, GLS, GNAS, and KRAS were commonly identified in both brain regions (Figure 4(d)), suggesting that they may represent central components of the shared glutamate and glutamine metabolic dysregulation observed in AD and AMD. That is, 19 shared differentially expressed genes (co-DEGs) were finally identified. Among these 19 co DEGs, GLS has a correlation score of 86.45 with glutamate/glutamine. The complete gene expression status of all datasets is shown in the Supplemental Tables 5–10.
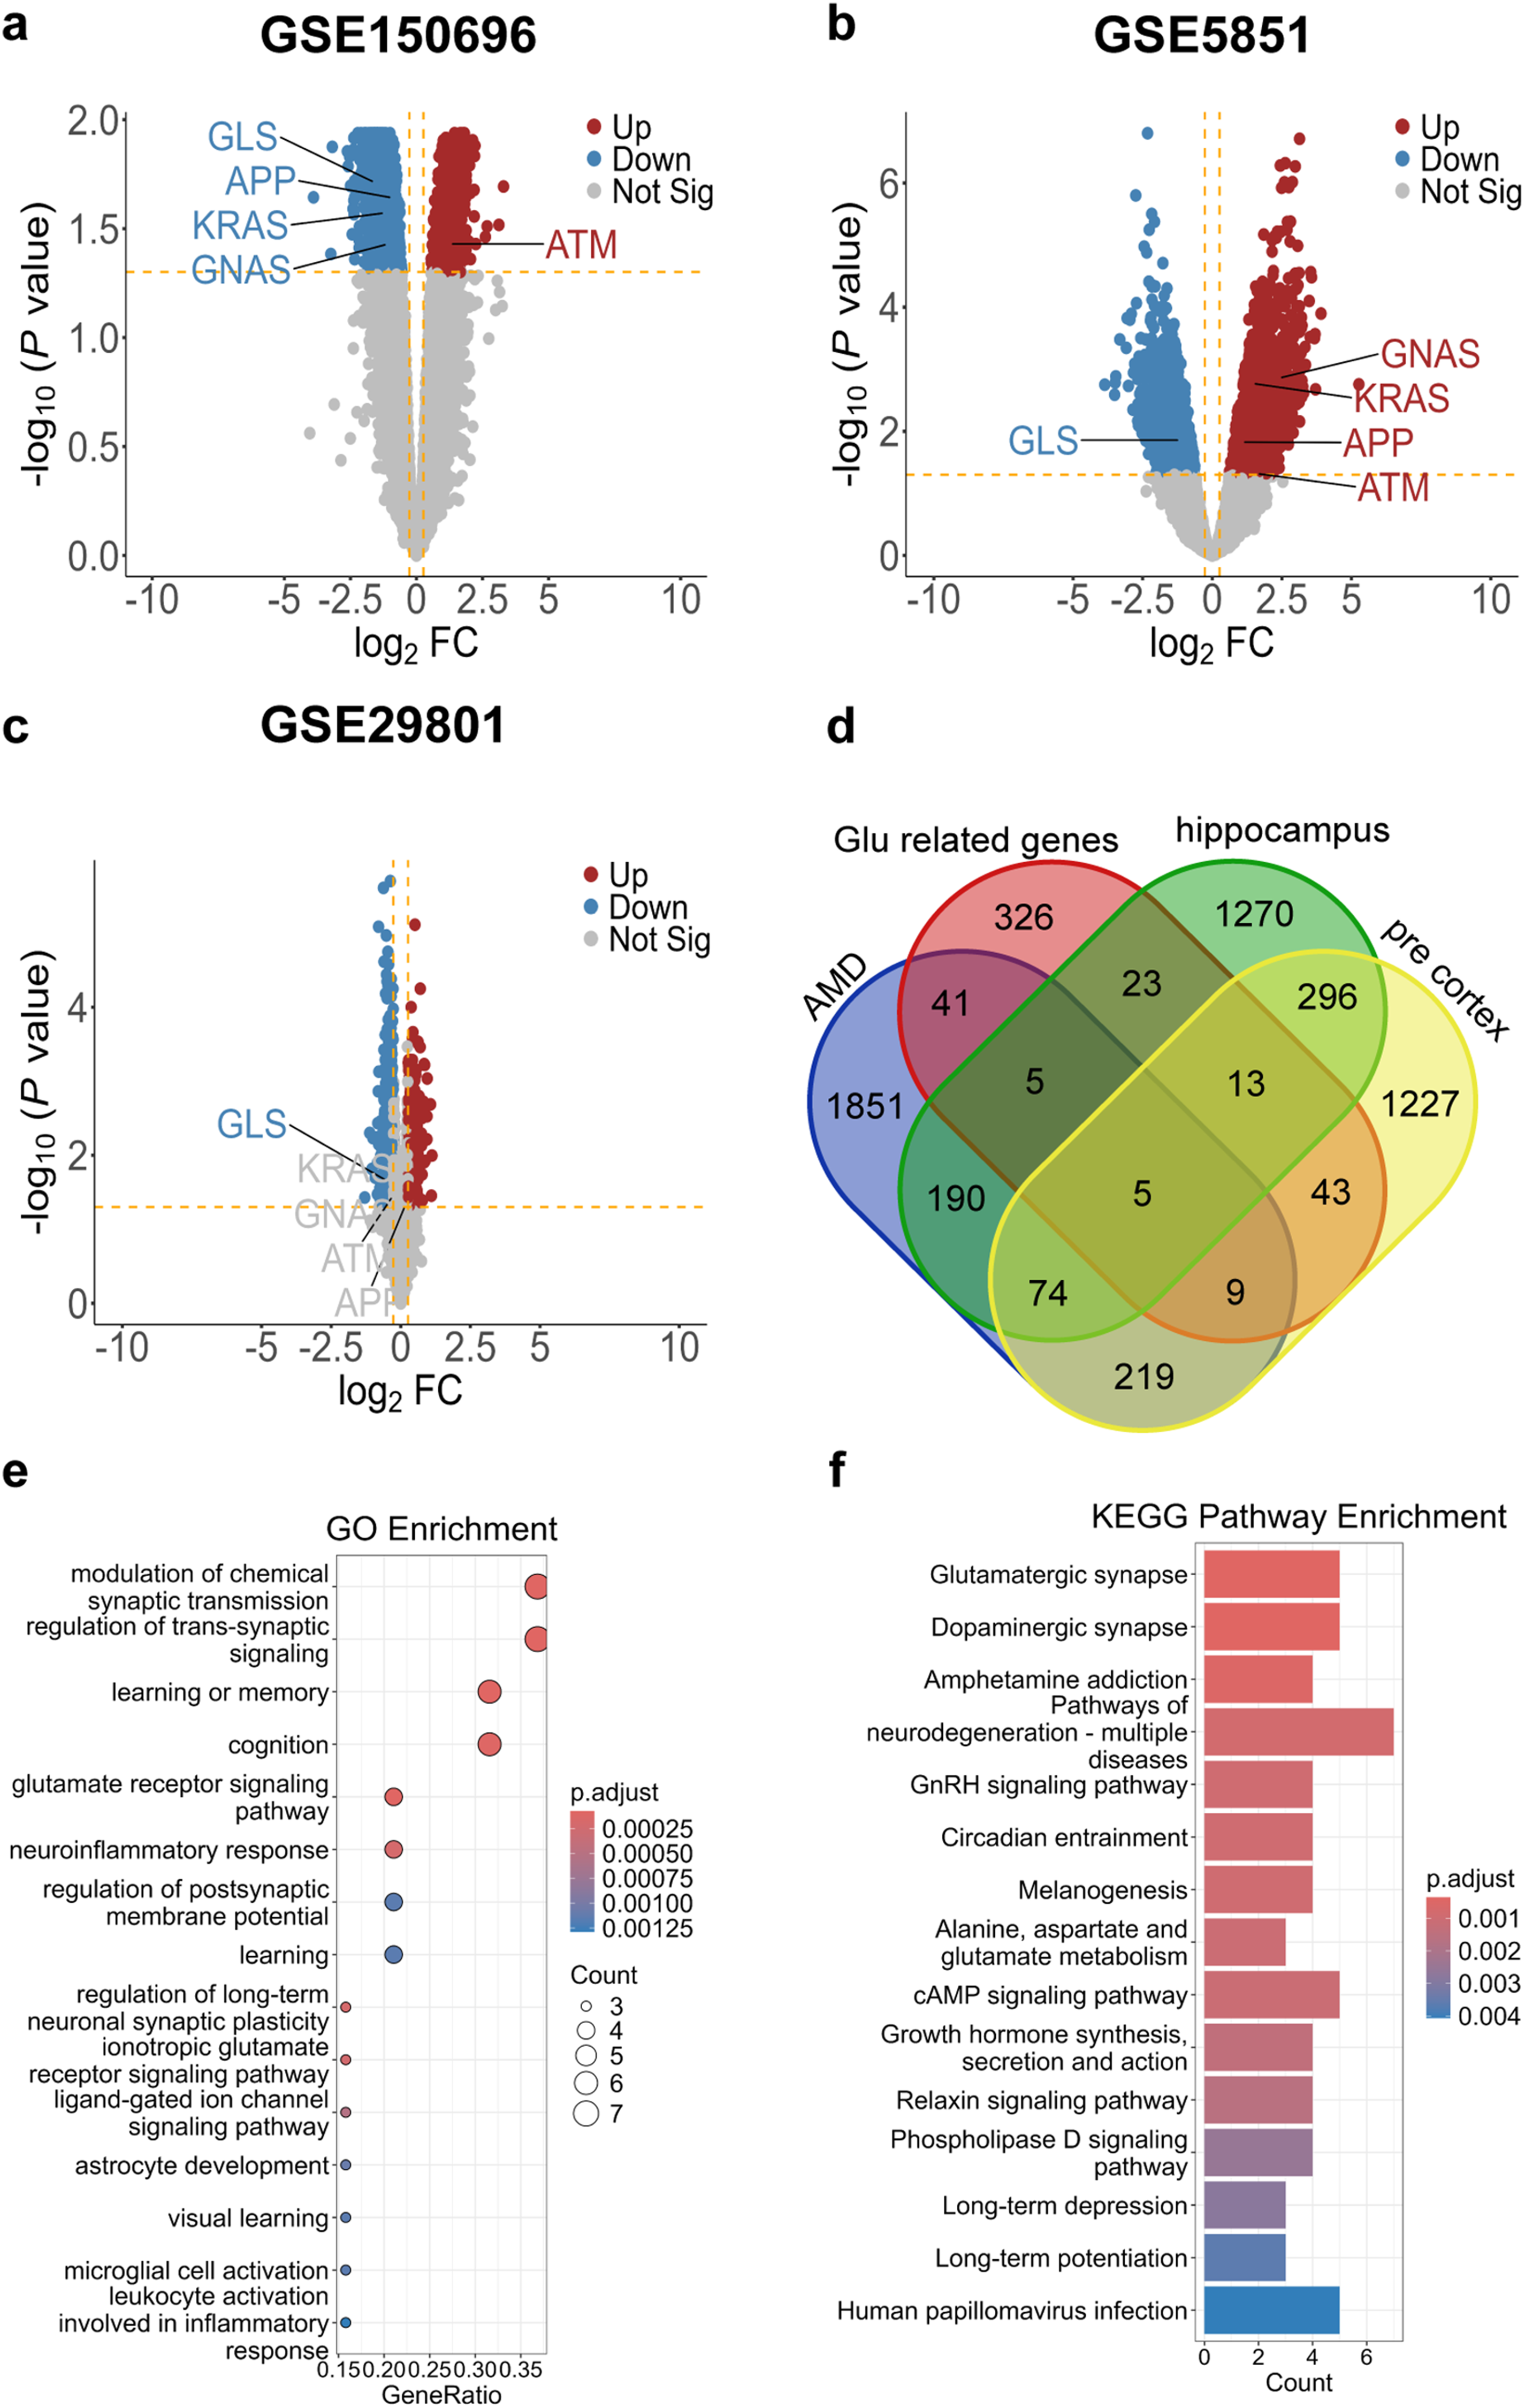
Differential expression analysis in AD and AMD and functional enrichment of glutamate/glutamine-related genes. (a) Volcano plot of DEGs in the prefrontal cortex of AD patients versus controls (GSE150696). (b) Volcano plot of DEGs in the hippocampus of AD patients versus controls (GSE5281). (c) Volcano plot of DEGs in the RPE-choroid of AMD patients versus controls (GSE29801). (d) Four-set Venn diagram showing overlaps among DEGs from AD (prefrontal cortex and hippocampus), AMD (RPE-choroid), and glutamate/glutamine-related genes from GeneCards; five genes are shared across all sets. (e) GO biological process enrichment of 19 shared DEGs (co-DEGs). (f) KEGG pathway enrichment of co-DEGs.
To further investigate the biological relevance of the 19 co-DEGs, enrichment analyses were conducted. Gene Ontology (GO) biological process enrichment analysis (Figure 4(e)) revealed that these genes are primarily involved in the regulation of synaptic transmission (e.g., modulation of chemical synaptic transmission, regulation of synaptic plasticity), cognitive and learning processes (e.g., learning or memory, cognition), and neuroinflammatory responses. These findings support the potential roles of the co-DEGs in neural dysfunction associated with neurodegenerative diseases. Subsequent KEGG pathway enrichment analysis (Figure 4(f)) showed significant enrichment in neurotransmission-related pathways, including glutamatergic synapse, dopaminergic synapse, and amphetamine addiction, as well as pathways associated with neurodegeneration, such as pathways of neurodegeneration—multiple diseases, circadian entrainment, and the cAMP signaling pathway.
Single-cell RNA sequencing analysis results
Among the 19 co DEGs mentioned above, GLS not only has the highest relevance score related to glutamate/glutamine, but also shows differential expression in different brain regions. According to the above results, GLS served as a core gene involved in the glutamate and glutamine metabolic dysregulation both in AD and AMD. Furthermore, Cell-type-specific expression of GLS was explored the by single-cell RNA sequencing datasets from the hippocampus and cortex of AD patients, as well as retinal tissues from AMD patients. Cells were clustered into major neural and glial populations in the cortex (Figure 5(a)), including excitatory neurons, inhibitory neurons, astrocytes, oligodendrocytes, and microglia. And GLS expression was predominantly enriched in excitatory neurons and astrocytes (Figure 5(b)). A pronounced downregulation of GLS expression was observed in AD tissues relative to the control group (Figure 4(c)). Similarly, distinct neuronal and glial subpopulations were identified through clustering in the hippocampus (Figure 5(d)). GLS expression displayed a comparable distribution pattern (Figure 5(e)), with significantly lower expression levels observed in AD samples relative to controls (Figure 5(f)). Cells from the retina and RPE-choroid were also profiled in AMD and control samples. GLS was predominantly expressed in endothelial cells, fibroblasts, macrophages, and lymphocytes (Figure 5g, h). Interestingly, GLS expression was significantly upregulated in AMD samples compared to controls (Figure 5(i)).

Cell-type-specific expression of GLS in AD and AMD. (a, d, g) UMAP plots showing clustering of major cell types in the cortex (a), hippocampus (d) of AD patients, and retinal tissues including RPE of AMD patients (g). Cell types were annotated based on canonical markers. (b, e, h) Feature plots depicting GLS expression across the identified cell populations in the cortex (b), hippocampus (e), and retinal tissues (h). (c, f, i) Violin plots comparing GLS expression levels between disease and control samples in the cortex (c), hippocampus (f), and retinal tissues (i). GLS expression is significantly decreased in AD cortical and hippocampal cells, whereas it is upregulated in AMD retinal cells. UMAP: uniform manifold approximation and projection.
Validation of metabolites involved in glutamine and glutamate metabolism in AD mice
Targeted metabolomics was performed on 9 metabolites involved in glutamine and glutamate relative metabolic pathway across multiple brain and ocular regions in APP/PS1 and WT mice at 5 months and 12 months of age. In 5-month-old APP/PS1 mice, compared with the control group, there were no significant changes in glutamate and ornithine levels in the cortex, hippocampus, retina, and the eye (Figure 6(a), e). Arginine, aspartic acid, and phenylalanine did not show significant differences in the cortex, hippocampus, and retina, but showed significant differences in the entire the eye, Arginine and phenylalanine are downregulated in the eye of APP/PS1 mice, while aspartic acid is upregulated in the eye of APP/PS1 mice. (Figure 6(c), d, and f, p < 0.05). Interestingly, although glutamine did not show significant differences in the cortex and retina, significant differences were observed in both the hippocampus (Figure 6(b), p < 0.05) and the eye (Figure 6(b), p < 0.0001). And the difference between the two tissues is quite consistent, both downregulated in APP/PS1 mice, with the difference in the eye being higher than in the hippocampus.
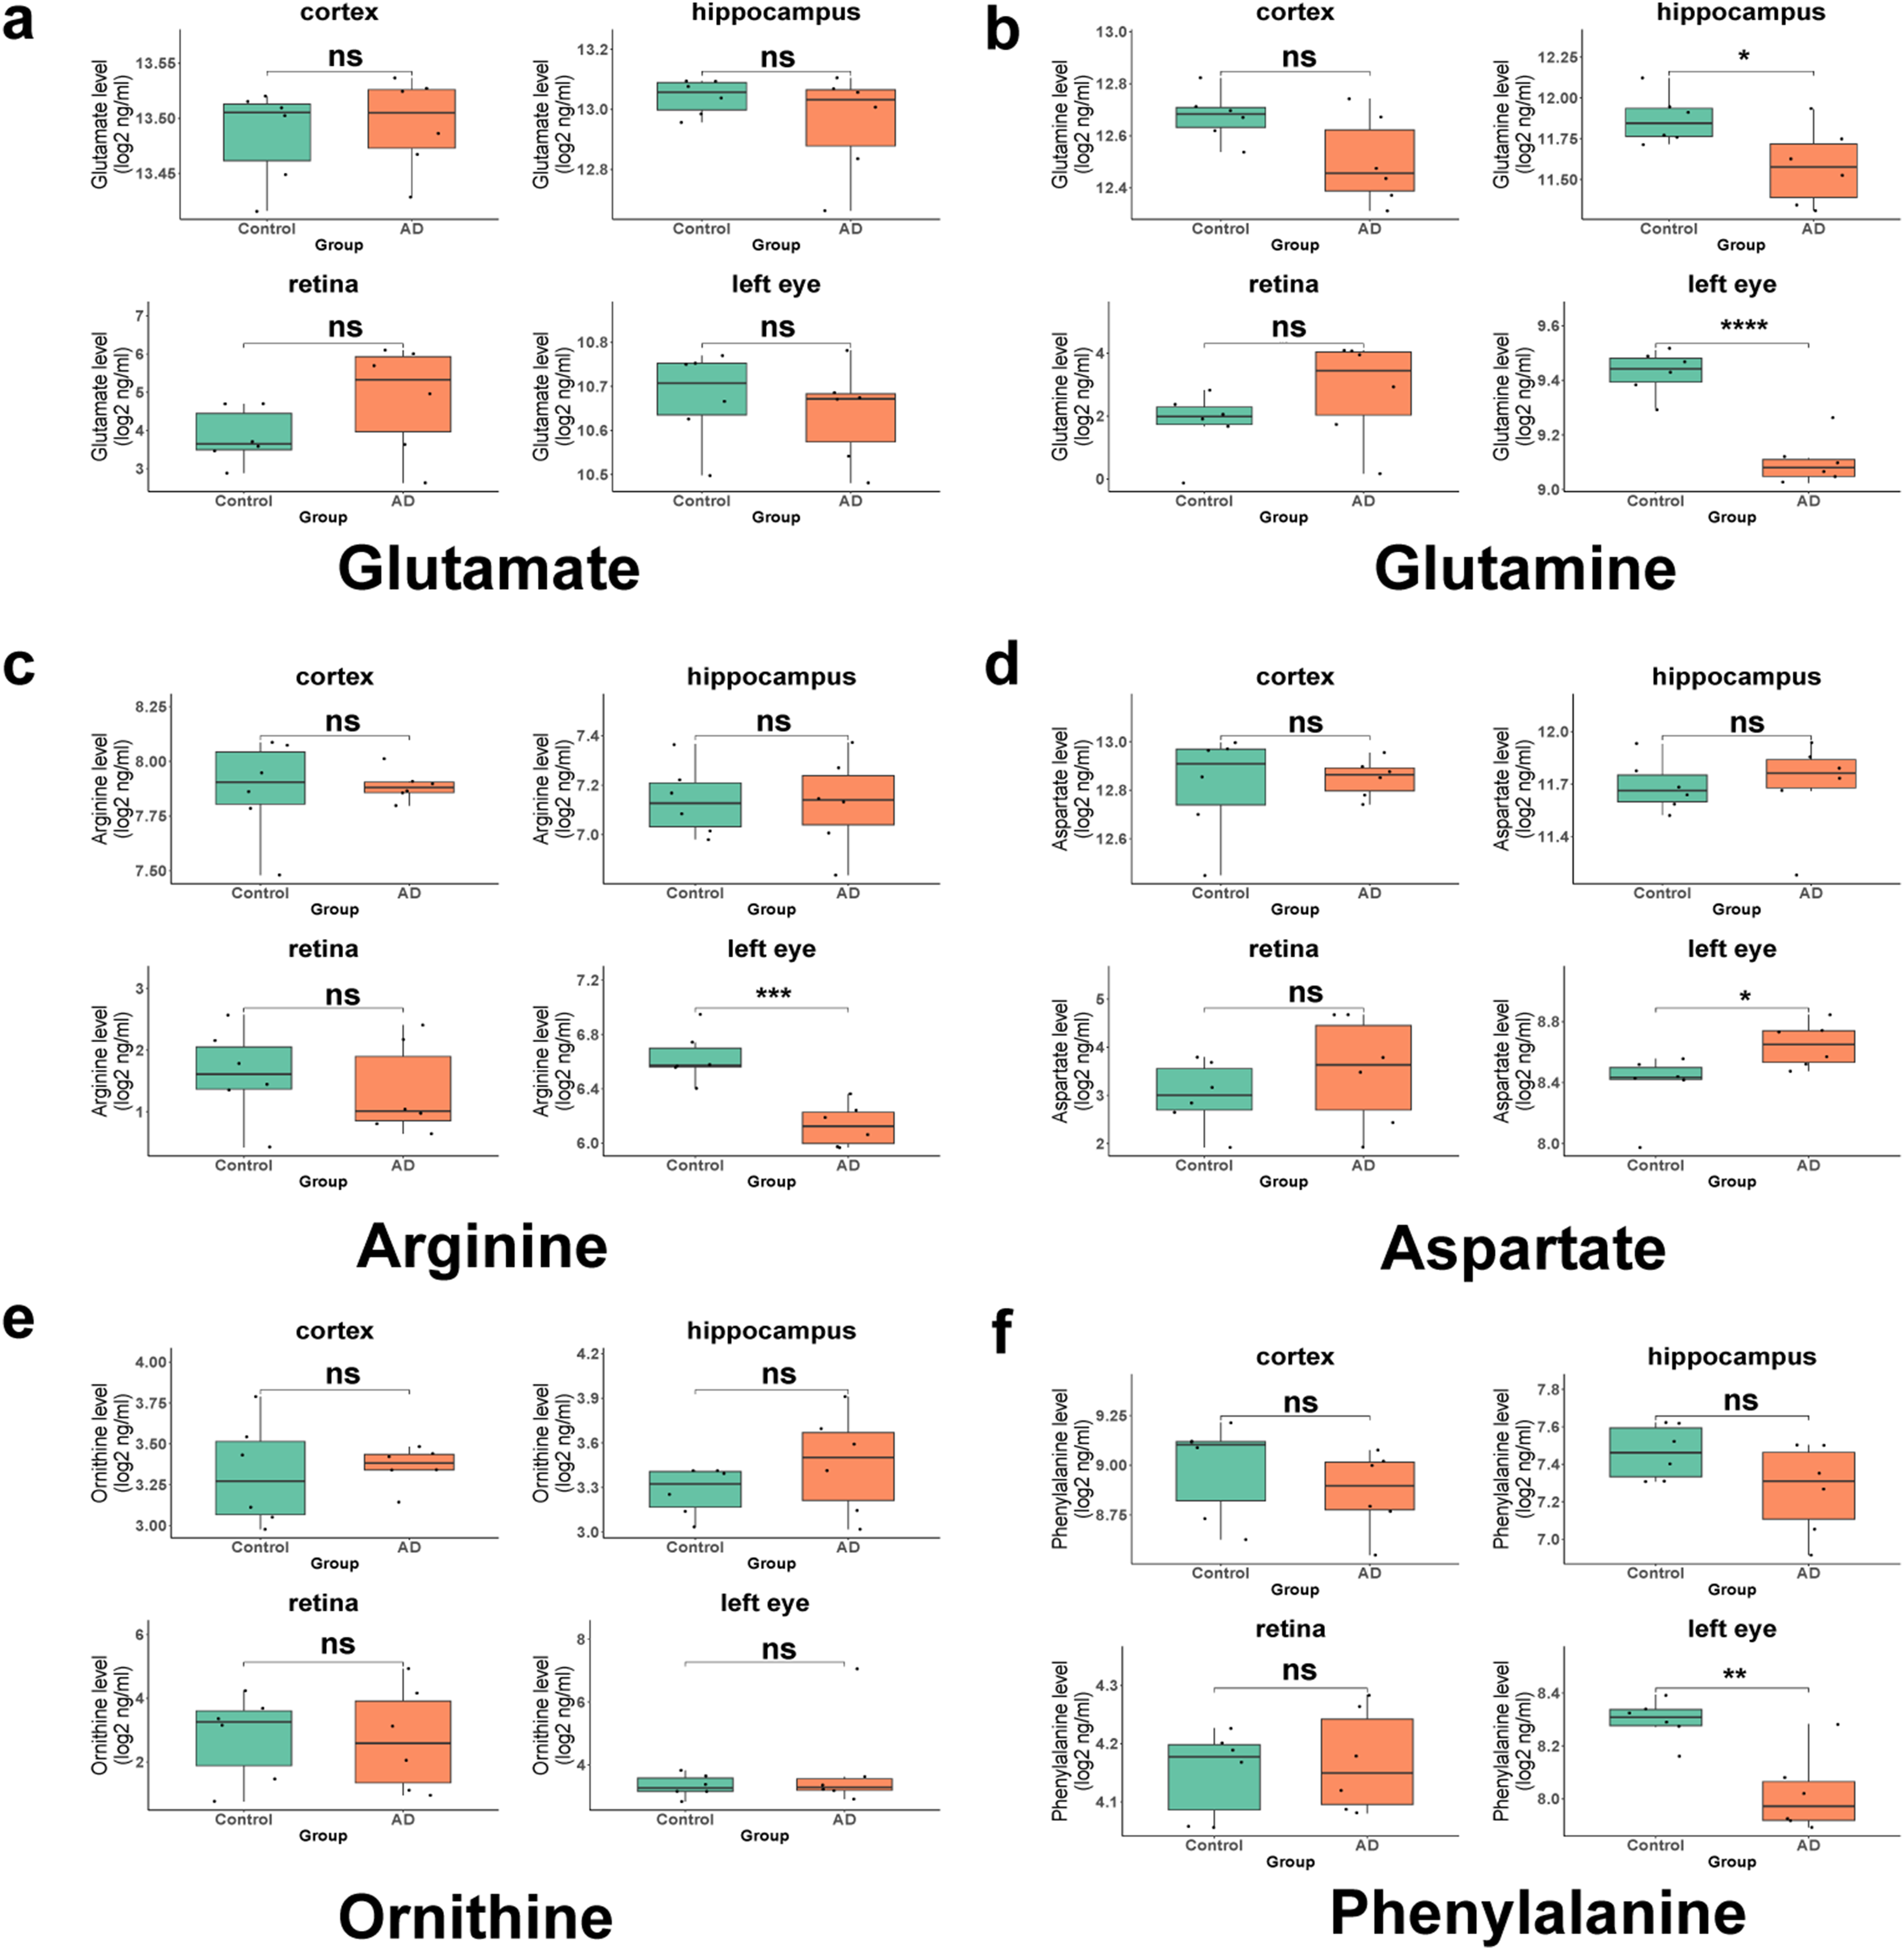
Region-specific alterations of six amino acids in 5-month-old AD and control mice revealed by targeted metabolomics. (a) Glutamate; (b) Glutamine; (c) Arginine; (d) Aspartate; (e) Ornithine; (f) Phenylalanine. Each plot shows amino acid levels in various brain and ocular regions. Statistical comparisons between AD and control groups were performed using appropriate tests. *p < 0.05, **p < 0.01, ***p < 0.001, ****p < 0.0001.
Compared with the control group, glutamate, glutamine, aspartic acid, and phenylalanine did not show significant differences in the cortex, hippocampus, retina, and the eye in 12-month-old APP/PS1 mice (Figure 7(a), b, d, and f). Although arginine did not show significant differences in the cortex, retina, and the eye, it was upregulated in the hippocampus of APP/PS1 mice (Figure 7(c), p < 0.05). Ornithine levels did not show significant differences in the cortex, hippocampus, and the eye between APP/PS1 mice and control group mice, but showed significant differences in the retina, with upregulation of expression in the retina of APP/PS1 mice (Figure 7(e), p < 0.05). Urea, citrulline, and histidine did not show any significant differences in the four tissues between the two groups of mice at 5 and 12 months of age. The boxplots of the expression of these three substances are shown in Supplemental Figure 17–22. The changes in glutamate/glutamine and its related metabolic pathways in the eyes and brain of APP/PS1 mice aged 5 and 12 months are shown in Figure 8.
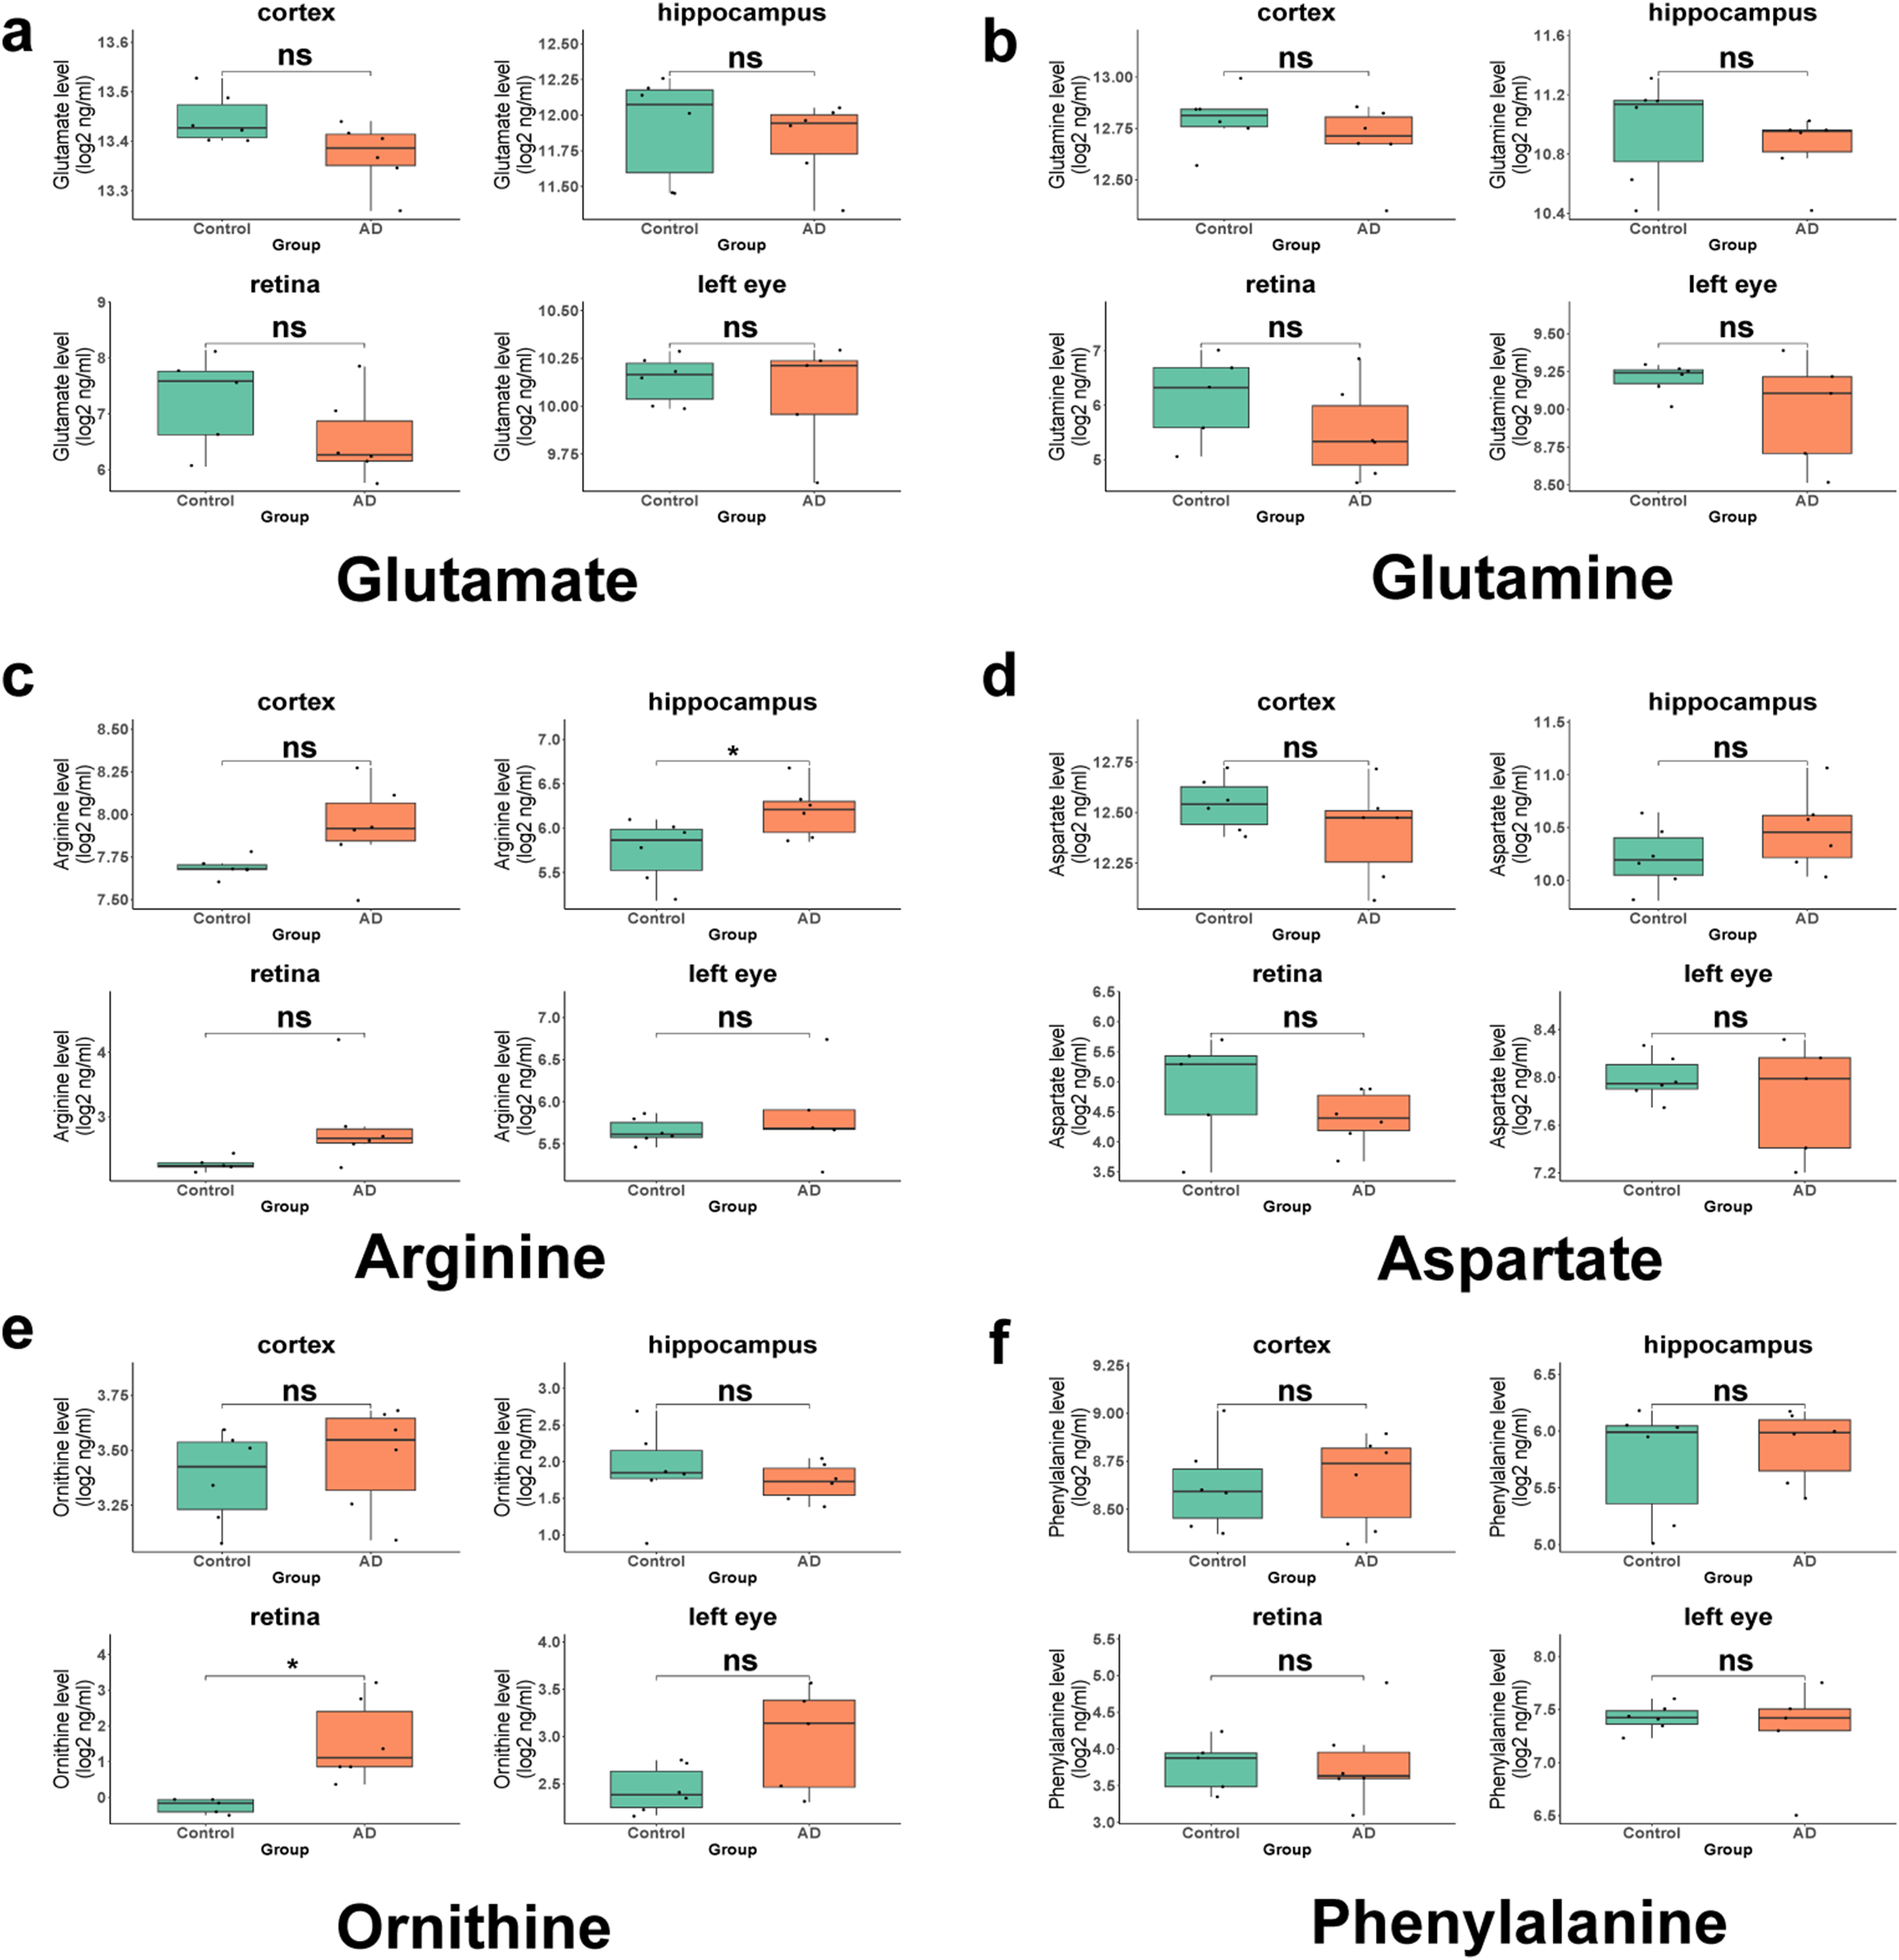
Region-specific alterations of six amino acids in 12-month-old AD and control mice revealed by targeted metabolomics. (a) Glutamate; (b) Glutamine; (c) Arginine; (d) Aspartate; (e) Ornithine; (f) Phenylalanine. Each plot shows amino acid levels in various brain and ocular regions. Statistical comparisons between AD and control groups were performed using appropriate tests. *p < 0.05, **p < 0.01.
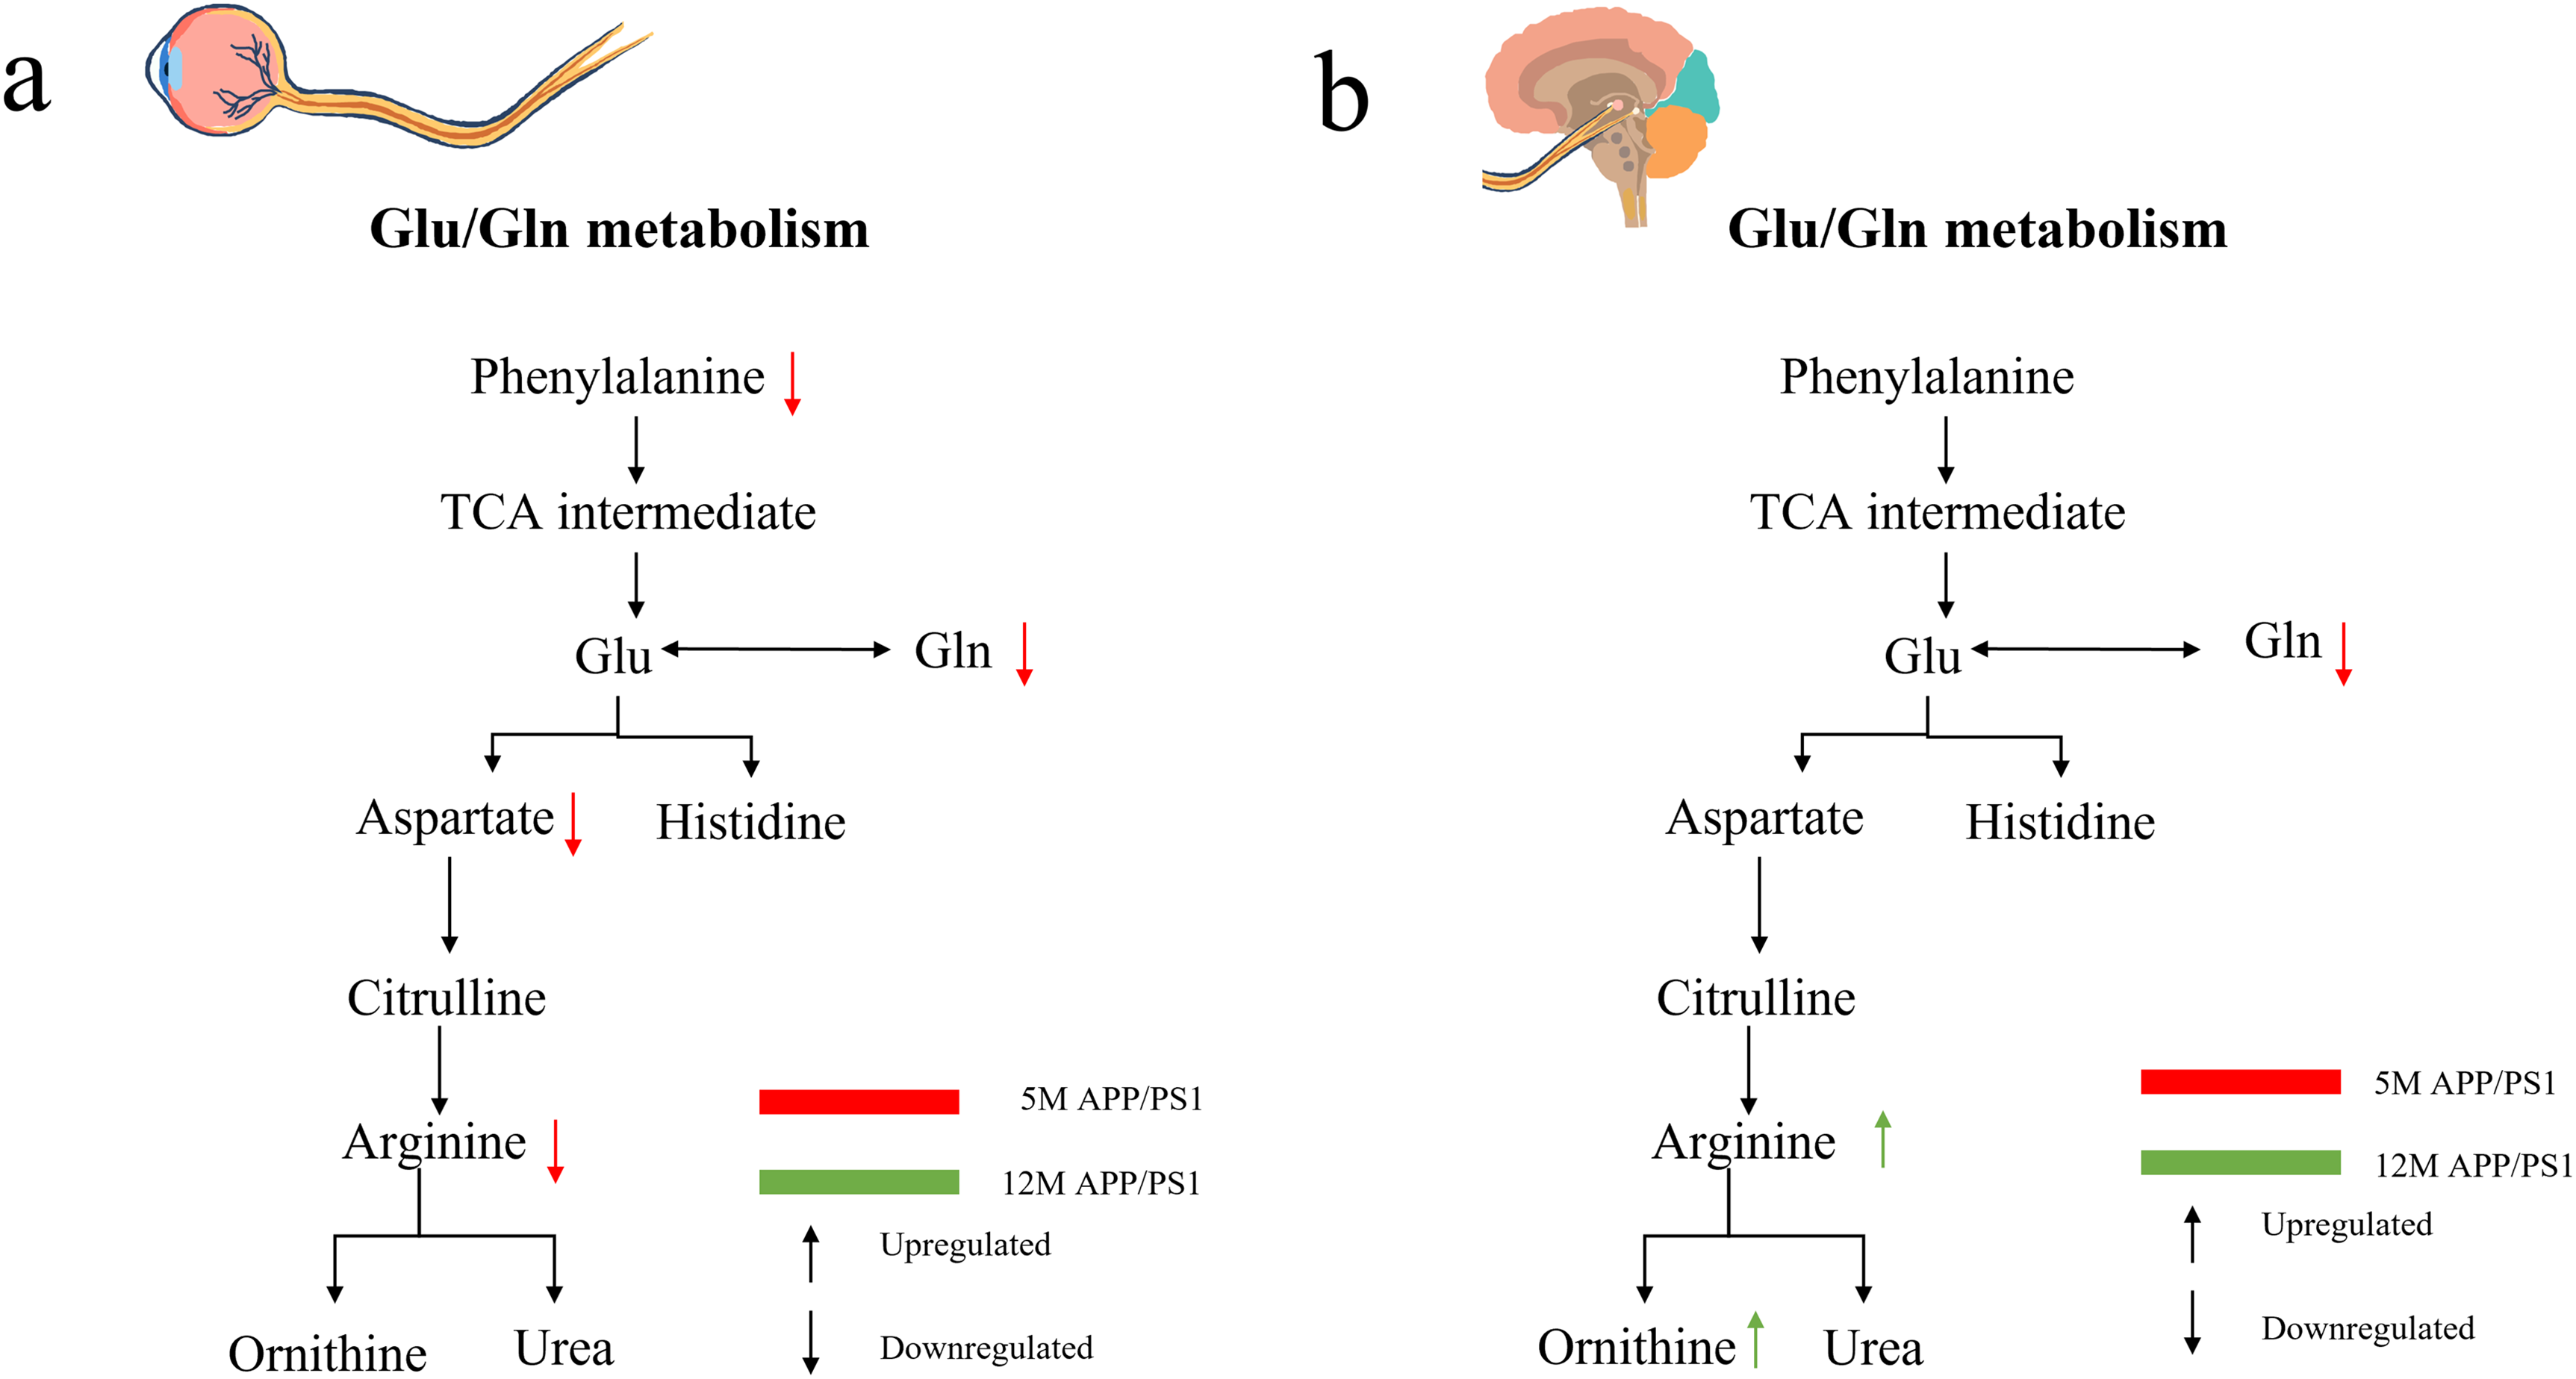
Expression of Glu/Gln and its related metabolites in the eyes and brain of APP/PS1 mice at 5 and 12 months of age. (a) Expression of metabolites in the eyes of APP/PS1 mice. (b) Expression of metabolites in the brain of APP/PS1 mice. Glu: glutamate; Gln: glutamine; 5M: 5 months old; 12M: 12 months old.
Discussion
This work seeks to characterize the shared metabolic signatures underlying AD and AMD, two major neurodegenerative disorders. The results showed that glutamine metabolism has been identified as a potential common pathway involved in these two diseases through multi-omics analysis including MR analysis, conventional gene transcriptome, single-cell transcriptome, and targeted metabolomics. The changes in glutamine levels in the eyes of APP/PS1 mice were much higher than those in the cortex and hippocampus of the brain. Arginine, aspartic acid, phenylalanine, and ornithine showed significant differences in the entire eye or retina of mice of the same age before any differences were observed in the cortex and hippocampus. GLS was also identified as core target involved in the glutamine metabolism both in AD and AMD. In addition, our results indicate that mouse age also has a significant impact on amino acid metabolism in the cortex, hippocampus, retina, and eyes.
MR indicated that glutamine is causally linked to both AD and AMD, exerting a protective influence in AD while elevating susceptibility to AMD. Evidence from prior Mendelian randomization analyses aligns with our results, indicating that elevated glutamine levels may play a protective role in AD.30,31 A mediation MR study indicated that higher plasma glutamine levels are associated with a reduced risk of dry AMD, which is contrary to our research findings. It may be caused by the following two reasons. 32 First, only seven SNPs were used as instrumental variables in that study, whereas our analysis included seventeen SNPs. Second, their research classified AMD into dry and wet subtypes, while the AMD dataset used in our study was not stratified by subtype. There is no distinction between dry and wet AMD patients in the data, and the specific ratio between the two cannot be determined.
The GLS gene encodes a phosphate-dependent mitochondrial glutaminase, responsible for converting glutamine into glutamate and ammonia. This enzyme is crucial for neurotransmitter glutamate synthesis and supports neuronal energy production.33,34 Through bulk transcriptome analysis, we observed reduced expression of the glutamate/glutamine-related gene GLS in both the prefrontal cortex and hippocampus of AD cases. Additionally, GLS expression was diminished in the RPE–choroid tissues of AMD patients. Although there was no significant difference in glutamate levels in the hippocampus and cortex between the control group mice and APP/PS1 mice in the targeted metabolomics analysis of this study, it was also observed that the glutamate levels in the cortex and hippocampus of APP/PS1 mice were lower than those in the control group. This effect became stronger in 12-month-old mice, indicating that age also has an important impact on glutamate/glutamine metabolism. A meta-analysis of AD reported a significant reduction in overall brain glutamate levels in AD patients, which aligns with the observed downregulation of GLS expression in their brain tissue. 35
In single-cell transcriptome analysis, GLS is mainly expressed in excitatory neurons in the cortex and hippocampus of AD patients, which is consistent with the role of GLS in catalyzing the hydrolysis of glutamine into ammonia and excitatory neurotransmitter glutamate. Compared with the control group, the expression of GLS decreased in the cortex and hippocampus of AD patients, which is consistent with the results of the bulk transcriptome analysis. In the retina and RPE-choroid of AMD patients, GLS is mainly expressed in endothelial cells, fibroblasts, macrophages, and lymphocytes. In contrast to the downregulation of GLS expression in the brain tissue of AD patients, the expression of GLS in the retina and RPE choroid of AMD patients is significantly upregulated. AMD is a chronic inflammatory retinal disease characterized by the activation of retinal Müller glial cells and microglia, as well as the release of inflammatory factors. 36 Research has shown that GLS expression is significantly upregulated in microglia activated under pathological conditions, and can promote the secretion of pro-inflammatory extracellular vesicles, thereby constructing a neuroinflammatory environment. 37 Moreover, the expression of GLS was indeed enriched and expressed in microglia in the eyes of AMD patients in our study. Excessive glutamate can also stimulate the release of pro-inflammatory cytokines such as TNF-α and IL-1β by activating glutamate receptors on the surface of microglia. 38 Telegina et al. also observed a similar phenomenon in the AMD like retinal degenerative rat (OXYS rat) model. In the late stage of AMD like lesions, GLS expression was significantly upregulated in the retina, while glutamine synthetase expression was downregulated, indicating the accumulation of glutamate in the retina. 39 The latest study by Goswami et al. further confirms the importance of GLS in retinal neurons, as knocking out GLS in mouse rod cells leads to rapid degeneration and energy metabolism disorders, indicating that GLS catalyzed glutamine metabolism is crucial for maintaining retinal function. 40 The upregulation of GLS in AMD retina and RPE-choroid may be both a compensatory response to the increased demand for retinal energy and glutamate, and may also participate in the pathogenesis of AMD by increasing glutamate concentration and activating glial cells, promoting inflammation and excitotoxicity processes.
Furthermore, the targeted metabolomics analysis was carried out to validate the metabolite changes of glutamate and glutamine related metabolic pathway in the brain and eyes of 5/12-month-old APP/PS1 and WT mice. In 5-month-old APP/PS1 mice, glutamine showed a consistent decreasing trend in the hippocampus and the eye, and the difference was more pronounced in the eye, although there was no significant difference in the retina. A study showed a decrease in glucose metabolism levels in the retina of 5 × FAD mice, accompanied by a significant reduction in glutamine synthesis mediated by Müller glial cells. 41 This finding is consistent with the observed decrease in glutamine levels in the eyes of APP/PS1 mice. Our study did not show significant differences in glutamine content in the retina, which may be due to different mouse breeds. The decrease in glutamine levels in the hippocampus of APP/PS1 mice has also been consistently described in multiple studies.42–44 In our study, 5-month-old APP/PS1 mice showed a decrease in hippocampal glutamine levels, while a large amount of RNA seq data showed a decrease in GLS expression. These two findings may seem contradictory, but there are also multiple biological mechanisms supporting the coexistence of reduced GLS transcription and decreased glutamine levels. Previous studies have shown that glutamine synthesis in the central nervous system is mainly mediated by astrocyte glutamine synthetase (GS). GS is highly sensitive to oxidative stress and Aβ-induced inactivation in early AD, and impaired GS activity directly reduces glutamine production, leading to a decrease in tissue glutamine levels. 45 In addition, glutamine is a major carbon and nitrogen donor for antioxidant defense, mitochondrial replenishment, and glial immune response. Early pathological stress may increase cellular glutamine consumption, thereby reducing steady-state glutamine levels, even if GLS expression is reduced.46,47 Therefore, the reduction of hippocampal glutamine may reflect a comprehensive disruption of astrocyte neuron metabolic coupling and neurotransmitter recycling, rather than a standalone GLS driving effect. These considerations collectively explain why reduced GLS expression can coexist with decreased glutamine abundance in early pathological stages. It is interesting that significant metabolic changes were observed in the eyes before differences in arginine, aspartic acid, and phenylalanine were observed in the cortex and hippocampus, although there was no significant difference in the retina. This suggests that metabolic changes in the eyes may be more significant than in the brain in early AD mice. Further research is needed to determine the specific areas of the eye where these amino acids undergo changes. The impact of aging on metabolic changes in mice cannot be ignored. In our study, glutamine showed differences in the hippocampus and eyes of 5-month-old mice, but these differences disappeared in 12-month-old mice. A study showed that there was a significant difference in the hypothalamus of APP/PS1 mice and wild-type mice aged 5 months, but this difference disappeared in 10-month-old mice. 48 This suggests that metabolic differences detected in the early stages of AD may naturally decrease or transform in the late stages of the disease. At 5 months of age, APP/PS1 mice had already shown Aβ aggregation, but the degree of neuronal loss was relatively mild, and the glutamate glutamine cycle still maintained metabolic activity. 49 The decrease in glutamine levels observed in both the hippocampus and eyes of mice may reflect early damage to neurotransmitter circulation and glial cell metabolic support function. In contrast, at 12 months of age, both APP/PS1 mice and WT mice showed age-related metabolic decline, which may mask the differences between the two groups of mice and weaken the metabolic characteristics in the early stages. 50 In addition, severe Aβ pathological changes in 12-month-old APP/PS1 mice may lead to overall metabolic inhibition due to chronic inflammation, oxidative stress, and mitochondrial dysfunction, resulting in a late-stage metabolic plateau which reduces the metabolic differences between APP/PS1 mice and WT mice.51–54
The appearance of multiple amino acid metabolism changes similar to those in the brain in the eyes of APP/PS1 mice may help explain the similar pathological or comorbidity mechanisms of AD and AMD. A large-scale cohort study in Korea showed that AMD patients have a higher risk of developing AD. 55 A meta-analysis showed that AD patients have a significantly increased risk of developing AMD, and AMD patients are also more likely to experience AD/cognitive decline. 56 In another meta-analysis of common eye diseases and dementia, the correlation between AMD and AD was significant. 57 Further larger sample studies are needed to determine whether the metabolic changes observed in the eyes of APP/PS1 mice, which are similar to those in the brain, can cause neurodegenerative changes in the eyes.
Given that metabolic changes in the eyes of APP/PS1 mice occur earlier and more significantly than in the cortex or hippocampus, it is crucial to explore the potential clinical significance of early detection of AD by evaluating macular degeneration. In clinical practice, AMD is mainly diagnosed by detecting macular structural changes such as drusen, RPE malnutrition, and atrophy through optical coherence tomography. 58 The diagnosis of AD mainly includes mature diagnostic tools such as amyloid positron emission tomography, cerebrospinal fluid biomarker detection, and emerging blood tests. 59 Compared with the above three AD detection methods, ocular assessment has multiple advantages, such as non invasiveness, high cost-effectiveness, and easy repeatability in routine ophthalmic examinations. More importantly, if AMD pathology is detected in the eye before AD pathology is detected in the brain, it may indicate a higher risk of AD in the patient. However, this method also has certain limitations. Due to research on the association between AD and AMD has largely remained at the epidemiological level, with little in-depth mechanistic investigation., compared with traditional AD detection methods, the accuracy of early detection of AD through evaluating macular degeneration is not high.
At present, most studies only focus on one disease, AD or AMD, but rarely use a combination of transcriptomics and metabolomics to investigate the potential association between the two diseases. Our study cross validated the expression changes of GLS gene through batch transcriptomics and single-cell transcriptomics, and validated the same amino acid metabolism changes such as glutamine in the brain and eyes of APP/PS1 mice through targeted metabolomics. Of course, the role of aging in metabolic changes cannot be ignored. Eye metabolism detection is easier to achieve than brain detection, so eye changes may become early biomarkers for AD. Our research also has several limitations. Due to sample limitations, further validation about the expression of GLS in the brain and eyes of APP/PS1 mice could be carried out, and AMD model mice need be further used to detect changes in glutamine metabolism in the eyes and brain to strengthen this association. In addition, collecting samples in clinical practice and conducting relevant evaluations in mild cognitive impairment patients is also our next research direction.
Conclusion
The present study employed multi-omics technique to excavate the common characteristics in AD and AMD. Our results indicate that glutamine is causally associated in both AD and AMD. Transcriptome and single-cell transcriptome analyses jointly identified GLS as a key gene, and targeted metabolomics validated the same abnormal glutamine metabolism in the brain and eyes of APP/PS1 mice, with eye differences being higher than brain differences. In addition, we also find that aging also affects metabolic changes in mouse eye and brain. The study provides new insights into the potential role of ocular metabolic profiling as a novel strategy for early screening of AD, highlighting the retina as a clinically accessible window for detecting cerebral metabolic disturbances associated with AD pathogenesis.
Supplemental Material
sj-docx-1-alz-10.1177_13872877261418263 - Supplemental material for An integrative multi-omics study reveals glutamine metabolism dysregulation connecting Alzheimer's disease and age-related macular degeneration
Supplemental material, sj-docx-1-alz-10.1177_13872877261418263 for An integrative multi-omics study reveals glutamine metabolism dysregulation connecting Alzheimer's disease and age-related macular degeneration by Shuang Wang, Chenting Wang, Hang Hong, Chunlan Tang, Jiancheng Yu and Qinwen Wang in Journal of Alzheimer's Disease
Supplemental Material
sj-xlsx-2-alz-10.1177_13872877261418263 - Supplemental material for An integrative multi-omics study reveals glutamine metabolism dysregulation connecting Alzheimer's disease and age-related macular degeneration
Supplemental material, sj-xlsx-2-alz-10.1177_13872877261418263 for An integrative multi-omics study reveals glutamine metabolism dysregulation connecting Alzheimer's disease and age-related macular degeneration by Shuang Wang, Chenting Wang, Hang Hong, Chunlan Tang, Jiancheng Yu and Qinwen Wang in Journal of Alzheimer's Disease
Footnotes
Acknowledgements
Thanks for the technical support by the Core Facilities, Ningbo University School of Medicine and Laboratory Animal Center of Ningbo University.
Ethical considerations
All procedures were approved by the Experimental Animal Ethics Committee of Ningbo University (approval no. NBU20250349).
Consent to participate
Not applicable.
Consent for publication
Not applicable.
Author contribution(s)
Funding
The authors disclosed receipt of the following financial support for the research, authorship, and/or publication of this article: This study was supported by Zhejiang Province Leading Geese Plan (2024C03101), One health interdisciplinary Research Project, Ningbo University (HY202411) and National 111 Project of China (D16013), National key research and development program(2023YFC3304203), Yangtze River Delta Science and Technology Innovation Community Joint Research Project (2023CSJGG1800), the Key Research and Development Program of Zhejiang Province (2025C01200(SD2) and 2024C03266), Hangzhou Science and Technology Development Project (20231203A18) and the Ningbo Science and Technology Project (2022Z241, 2023Z132, 2023Z168, 2024Z230, 2024S047 and 2023S151).
Declaration of Conflicting Interests
The authors declared no potential conflicts of interest with respect to the research, authorship, and/or publication of this article.
Data availability statement
A summary level genetic association of 20 amino acids was obtained from Lotta et al.'s plasma metabolomic genome map. The specific download links for the data are shown in  . The datasets of GWAS AD (ieu-b-2) and AMD (ebi-a-GCST010723) are from the ieu OpenGWAS project. The transcriptome dataset can be downloaded from the Gene Expression Omnibus Database (GEO): GSE33000, GSE44770, GSE150696, GSE5281, GSE48350, and GSE29801. The single-cell RNA sequencing dataset comes from GEO: GSE157827, GSE175814, and GSE135922.
Supplemental material
Supplemental material for this article is available online.
References
Supplementary Material
Please find the following supplemental material available below.
For Open Access articles published under a Creative Commons License, all supplemental material carries the same license as the article it is associated with.
For non-Open Access articles published, all supplemental material carries a non-exclusive license, and permission requests for re-use of supplemental material or any part of supplemental material shall be sent directly to the copyright owner as specified in the copyright notice associated with the article.
