



Abstract
Background
Vascular cognitive impairment (VCI) is the second most common dementia etiology after Alzheimer's disease. However, plasma biomarkers of VCI remain insufficiently validated.
Objective
We aimed to identify plasma biomarker candidates for VCI by using integrated multi-omics analyses.
Methods
We prospectively recruited VCI patients and healthy controls (HCs), performed proteomic and metabolomic analyses with ELISA validation, and conducted plasma protein quantitative trait loci (pQTL)-based Mendelian randomization (MR) with VCI-related imaging phenotypes.
Results
Proteomics identified 871 differentially upregulated proteins, in 8 VCI patients compared to 6 HCs. Proteins containing YWHAZ, CLDN5, VCL, TPM4, TLN1, CAP1, ITGB3, GP1BB, and ROCK2 were further investigated. ELISA validation conducted on another 8 VCI patients and 8 HCs showed levels of CAP1 (257.1 ± 51.48 versus 204.7 ± 27.47 ng/L, 95% CI: 8.19–96.68, p = 0.0235) and ROCK2 (10.10 ± 2.417 versus 7.555 ± 1.835 ng/mL, 95% CI: 0.24–4.84, p = 0.0328) were significantly higher in the VCI group. CAP1 expression demonstrated a significant association with glycolysis-related metabolites, particularly lactate and the complex glycolysis score, based on adjusted rank correlation analysis (panel-wise FDR < 0.05). MR analysis utilizing plasma pQTL data and vascular dementia and its imaging-derived phenotypes suggested no evidence for a causal effect in either direction.
Conclusions
Plasma CAP1 and ROCK2 levels were observed elevated in individuals with VCI, with CAP1 showing metabolomic consistency in relation to glycolytic pathways. These findings provide preliminary exploratory signals suggesting that CAP1 and ROCK2 may merit further investigation in the context of VCI.
Keywords
Introduction
The term vascular cognitive impairment (VCI) refers to a spectrum of cognitive disorders resulting from vascular-related pathologies, encompassing a range of conditions from mild cognitive impairment to dementia. 1 Vascular dementia (VaD) is the most severe form of VCI, which is the second most common cause of dementia worldwide after Alzheimer's disease (AD). 2 Epidemiological studies indicate that the prevalence of VaD in Chinese adults aged ≥60 years is approximately 0.9–1.7%, while the overall prevalence of VCI ranges from 1.1–2%, increasing to nearly 3% among individuals aged ≥80 years.3–7 However, in contrast to the established ATN biomarker framework for AD, 8 the diagnosis of VCI still relies on traditional methods including evaluation of clinical presentation, neuropsychological scales, and neuroimaging. 2 Currently, there remains a lack of reliable, minimally invasive blood-based biomarkers for the clinical diagnosis and stratification of VCI.
According to previous reports, unbiased proteomics studies have revealed dysregulated pathways associated with inflammation, vascular and extracellular matrix remodeling, and synaptic function across dementias. 9 However, the translation of these findings into validated biomarkers for VCI has been particularly challenging.2,10,11 In recent years, data-independent acquisition mass spectrometry (DIA-MS) offers a solution by enabling deep, reproducible, and quantitative profiling of the plasma proteome, making it an ideal tool for biomarker identification in clinical cohorts. 12 Integrating proteomics with untargeted metabolomics has been regarded as a powerful strategy to enhance the specificity of candidate protein selection and ground protein findings. The multi-omics approach allows for correlation- and pathway-based analyses to determine if proteomic signals are coherent with metabolite alterations in relevant pathological pathways. 13
Mendelian randomization (MR) provides a robust genetic epidemiological framework to further prioritize candidates with potential causal relevance to disease. 14 By using protein quantitative trait loci (pQTL) as instrumental variables, MR can assess whether genetically predicted levels of circulating proteins are causally associated with VCI or its neuroimaging endophenotypes such as cerebral small vessel disease (CSVD), thereby mitigating confounding and reverse causation.14,15 This approach can help identifying the most promising biomarkers for downstream clinical validation.
To sum up, this study will employ a comprehensive and sequential strategy to discover and validate potential plasma biomarkers for VCI. First, we will perform high-depth plasma proteomic profiling using DIA-MS in our clinical cohort. Subsequently, untargeted liquid chromatography-mass spectrometry (LC-MS) metabolomics will be combined to evaluate biochemical consistency and pathway-level coherence between proteomic and metabolomic findings. Leading candidate proteins will then be verified using enzyme-linked immunosorbent assay (ELISA). Finally, bidirectional two-sample MR will be applied to interrogate the causal relationships between the validated protein biomarkers and VCI and its imaging phenotypes. This work aims to deliver a shortlist of mechanistically insightful and clinically viable biomarker candidates to improve the diagnosis and understanding of VCI.
Methods
The study protocol was approved by the ethics committee of Changhai Hospital (approval number: CHEC2024-377). Written informed consent was obtained from all participants. All subjects underwent detailed neuropsychological evaluation and 3.0 T cranial MRI examination. The neuropsychological evaluation included: Montreal Cognitive Assessment (MoCA) and Mini-Mental State Examination (MMSE) for overall cognitive function; and for specific cognitive domains, Auditory Verbal Learning Test (AVLT), Clock Drawing Test (CDT), Verbal Fluency Task (VFT), Digit Symbol Substitution Test (DSST), Digital Span Test (DST), Stroop Color Word Test (SCWT), and Trail Making Test (TMT). Subjective cognitive function was assessed using the Cognitive Failures Questionnaire (CFQ) and the Subjective Cognitive Decline-Questionnaire (SCD-Q).
All subjects underwent a 3.0 T head MRI scan, with sequences including T1-weighted, T2-weighted, T2 Fluid-Attenuated Inversion Recovery (FLAIR), Diffusion-Weighted Imaging (DWI), Apparent Diffusion Coefficient (ADC), and Susceptibility-Weighted Angiography (SWAN). MRI scans were evaluated for cerebrovascular injury using established markers, including white matter hyperintensities, lacunes, perivascular spaces, microbleeds, cortical/subcortical microinfarcts, large vessel-territory infarctions, and hemorrhage. Detailed definitions and thresholds for each marker are provided in Supplemental Table 1.
Fasting venous blood samples were collected from all subjects for subsequent omics analysis.
Proteomic analysis
The Proteomic study included 8 patients with VCI and 6 age- and sex-matched healthy controls (HCs). VCI subjects were recruited from the prospective VCI cohort at the Department of Neurology, Changhai Hospital. HCs were selected from healthy individuals from the same department.
Inclusion criteria for VCI participants were: (1) aged > 45 years; (2) present of vascular risk factors, such as hypertension, diabetes mellitus, hyperlipidemia, smoking, and obesity; (3) able to cooperate with neuropsychological scale assessments and MRI examinations; (4) diagnosis of VCI based on neuroimaging evidence and a MoCA score < 26, 16 in line with NINDS–CSN recommendations 17 ; (5) informed consent. The cognitive domains assessed, and the thresholds used for impairment classification are described in the Supplemental Table 2.
Exclusion criteria for all subjects were: (1) coexisted with central nervous system disorders, including brain tumors, congenital vascular malformations, and epilepsy; (2) with conditions known to cause abnormal brain iron deposition, including demyelinating diseases, multiple sclerosis or Parkinson's disease; (3) with clinical or imaging features suggestive of common non-VaD including AD and Lewy body dementia (LBD) (probable AD: progressive memory impairment fulfilling NIA-AA clinical criteria, 18 with medial temporal lobe atrophy on MRI; suspected LBD: parkinsonism, visual hallucinations, fluctuating cognition, with non-specific atrophy on MRI); (4) with history of brain trauma or intracranial surgery; (5) with severe visual or auditory impairment; (6) with history of severe mental illness or use/abuse of psychotropic drugs; (7) with severe heart, lung, liver, or kidney disease, hypothyroidism, or cancer; (8) contraindicated for MRI examination.
Plasma samples were subjected to protein quantification using the bicinchoninic acid method. Low-abundance proteins were enriched to increase the depth of analysis. The samples were then reduced with dithiothreitol and alkylated with iodoacetamide before protein digestion with trypsin. The resulting peptides were desalted using a C18 cartridge, and peptide concentrations were measured by absorbance at 280 nm.
For LC-MS analysis, peptides were separated on a Vanquish Neo ultra-high-performance liquid chromatography (UHPLC) system with a μPAC Neo High Throughput column and analyzed on an Orbitrap Astral mass spectrometer (Thermo Scientific) operating in DIA mode.
Raw DIA files were processed with DIA-NN software. Differential protein expression was determined using a student's t-test. p-value < 0.05 and an absolute log2Fold Change (log2FC) ≥ 1.5 was considered significant. The identified proteins were then functionally annotated using Gene Ontology (GO) and Kyoto Encyclopedia of Genes and Genomes (KEGG) databases.
Metabolomic analysis
Plasma samples were thawed at 4°C and mixed with a pre-chilled methanol/water solution. After low-temperature homogenization and ultrasonic ice-bath treatment, the mixture was centrifuged to obtain the supernatant which was dried using a high-speed vacuum concentrator and then reconstituted for analysis.
For LC-MS/MS, the samples were separated on a Shimadzu Nexera X2 UHPLC system and analyzed on a 5500 QTRAP mass spectrometer. It was operated in multiple reaction monitoring mode in both positive and negative ion modes.
Raw data was processed with MultiQuant 3.0.2 software. For the present study, metabolite concentrations were used to perform subsequent correlation analyses with candidate proteins.
Proteomics-metabolomics integrated analysis
We integrated proteomics and metabolomics data from the same set of samples. Metabolite data were log-transformed, and Z-score normalized. Annotations were curated through cross-referencing with Human Metabolome Database and KEGG databases. Subsequently, we calculated partial rank correlations between candidate proteins and metabolites from a pre-defined glycolysis panel and a composite glycolysis score, adjusting for confounding variables including age, sex, body mass index (BMI), and group. Two-sided test was utilized to determine correlation significances. p-values within the glycolysis panel were adjusted using the Benjamini-Hochberg method for False Discovery Rate (FDR). Finally, we used the MetaboAnalyst software to assess the consistency of the proteomic and metabolomic findings at the pathway level.
ELISA validation
Plasma samples for ELISA quantification were collected from an independent cohort of patients with VCI and age- and sex-matched HCs. This independent cohort was distinct from the proteomic discovery cohort to ensure unbiased validation of candidate biomarkers identified through proteomic analysis, aiming to prevent circular validation within the same dataset and to reduce potential technical variability between the proteomic and ELISA analytical procedures.
The proteins including YWHAZ, CLDN5, VCL, TPM4, TLN1, CAP1, ITGB3, GP1BB, and ROCK2 were validated via competitive ELISA kits. It was performed according to the manufacturer's instructions. All samples were run in duplicate to ensure data reliability. First, samples and standards were added to the pre-coated microtiter plate, followed by the addition of biotin-labeled antigen. After incubation at 37°C for 30 min, the plate was washed to remove unbound components. Then, avidin-horseradish peroxidase was added and incubated at 37°C for another 30 min. After a final wash, 3,3′,5,5′-tetramethylbenzidine substrate solution was added for color development, and the reaction was then stopped with the addition of a stop solution. The optical density (OD) was measured at 450 nm. Finally, a standard curve was generated, and the concentrations of the target proteins in the samples were calculated based on the negative correlation between the OD value and the protein concentration.
Two-sample MR
We performed a two-sample, bidirectional MR analysis to investigate the potential causal relationships between the proteins CAP1 and ROCK2 and VCI. Genetic instrumental variables for CAP1 and ROCK2 were obtained from the deCODE pQTL database. 19 Summary statistics for VaD were sourced from the FinnGen database (https://storage.googleapis.com/finngen-public-data-r9). Data for CSVD imaging phenotypes, including white matter hyperintensities, fractional anisotropy (FA), mean diffusivity (MD), and cerebral hemorrhage, were obtained from the Brain Small Vessel Disease portal (https://cd.hugeamp.org/downloads.html). All genetic instruments were selected at a genome-wide significance threshold (p-value < 5 × 10⁻⁸) and clumped to ensure independence based on a linkage disequilibrium (LD) test. We used the Inverse-Variance Weighted (IVW) method for the primary analysis; while for exposures with only a single instrumental variable, Wald Ratio method was applied. Sensitivity analyses using MR-Egger and Weighted Median methods were conducted to assess robustness and potential pleiotropy.
Statistical analysis
ELISA data were analyzed by GraphPad Prism 8.0. Data normality was assessed by the Shapiro-Wilk test. Comparisons between the two groups were conducted using an independent-samples t-test for normally distributed data and a Mann-Whitney U test for non-normally distributed data. Categorical variables were compared between groups using two-sided Fisher's exact tests. Given the exploratory nature and limited sample size, formal power calculations were not performed. All data were presented as mean ± standard deviation (SD), and 95% confidence intervals (CI) were reported for key comparisons. A two-sided p-value of less than 0.05 was considered statistically significant.
Results
Proteomic analysis
This study included 8 patients with VCI and 6 HCs. Demographic and clinical characteristics of participants were summarized in Table 1. No significant differences were observed between the two groups in age, sex, BMI, or vascular risk factors. Based on plasma proteomics, a total of 1070 differentially expressed proteins were identified, with 871 of them showing an upward trend. The differential screening thresholds were ∣log2FC∣>1.5 and p < 0.05. Principal component analysis revealed a clear distinction between the overall protein expression profiles of VCI patients and HCs. The distribution of up- and down-regulated proteins was presented in Figure 1A. The expression patterns of these differential proteins in Figure 1B demonstrate clear stratification between VCI patients and HCs, effectively distinguishing the two groups.
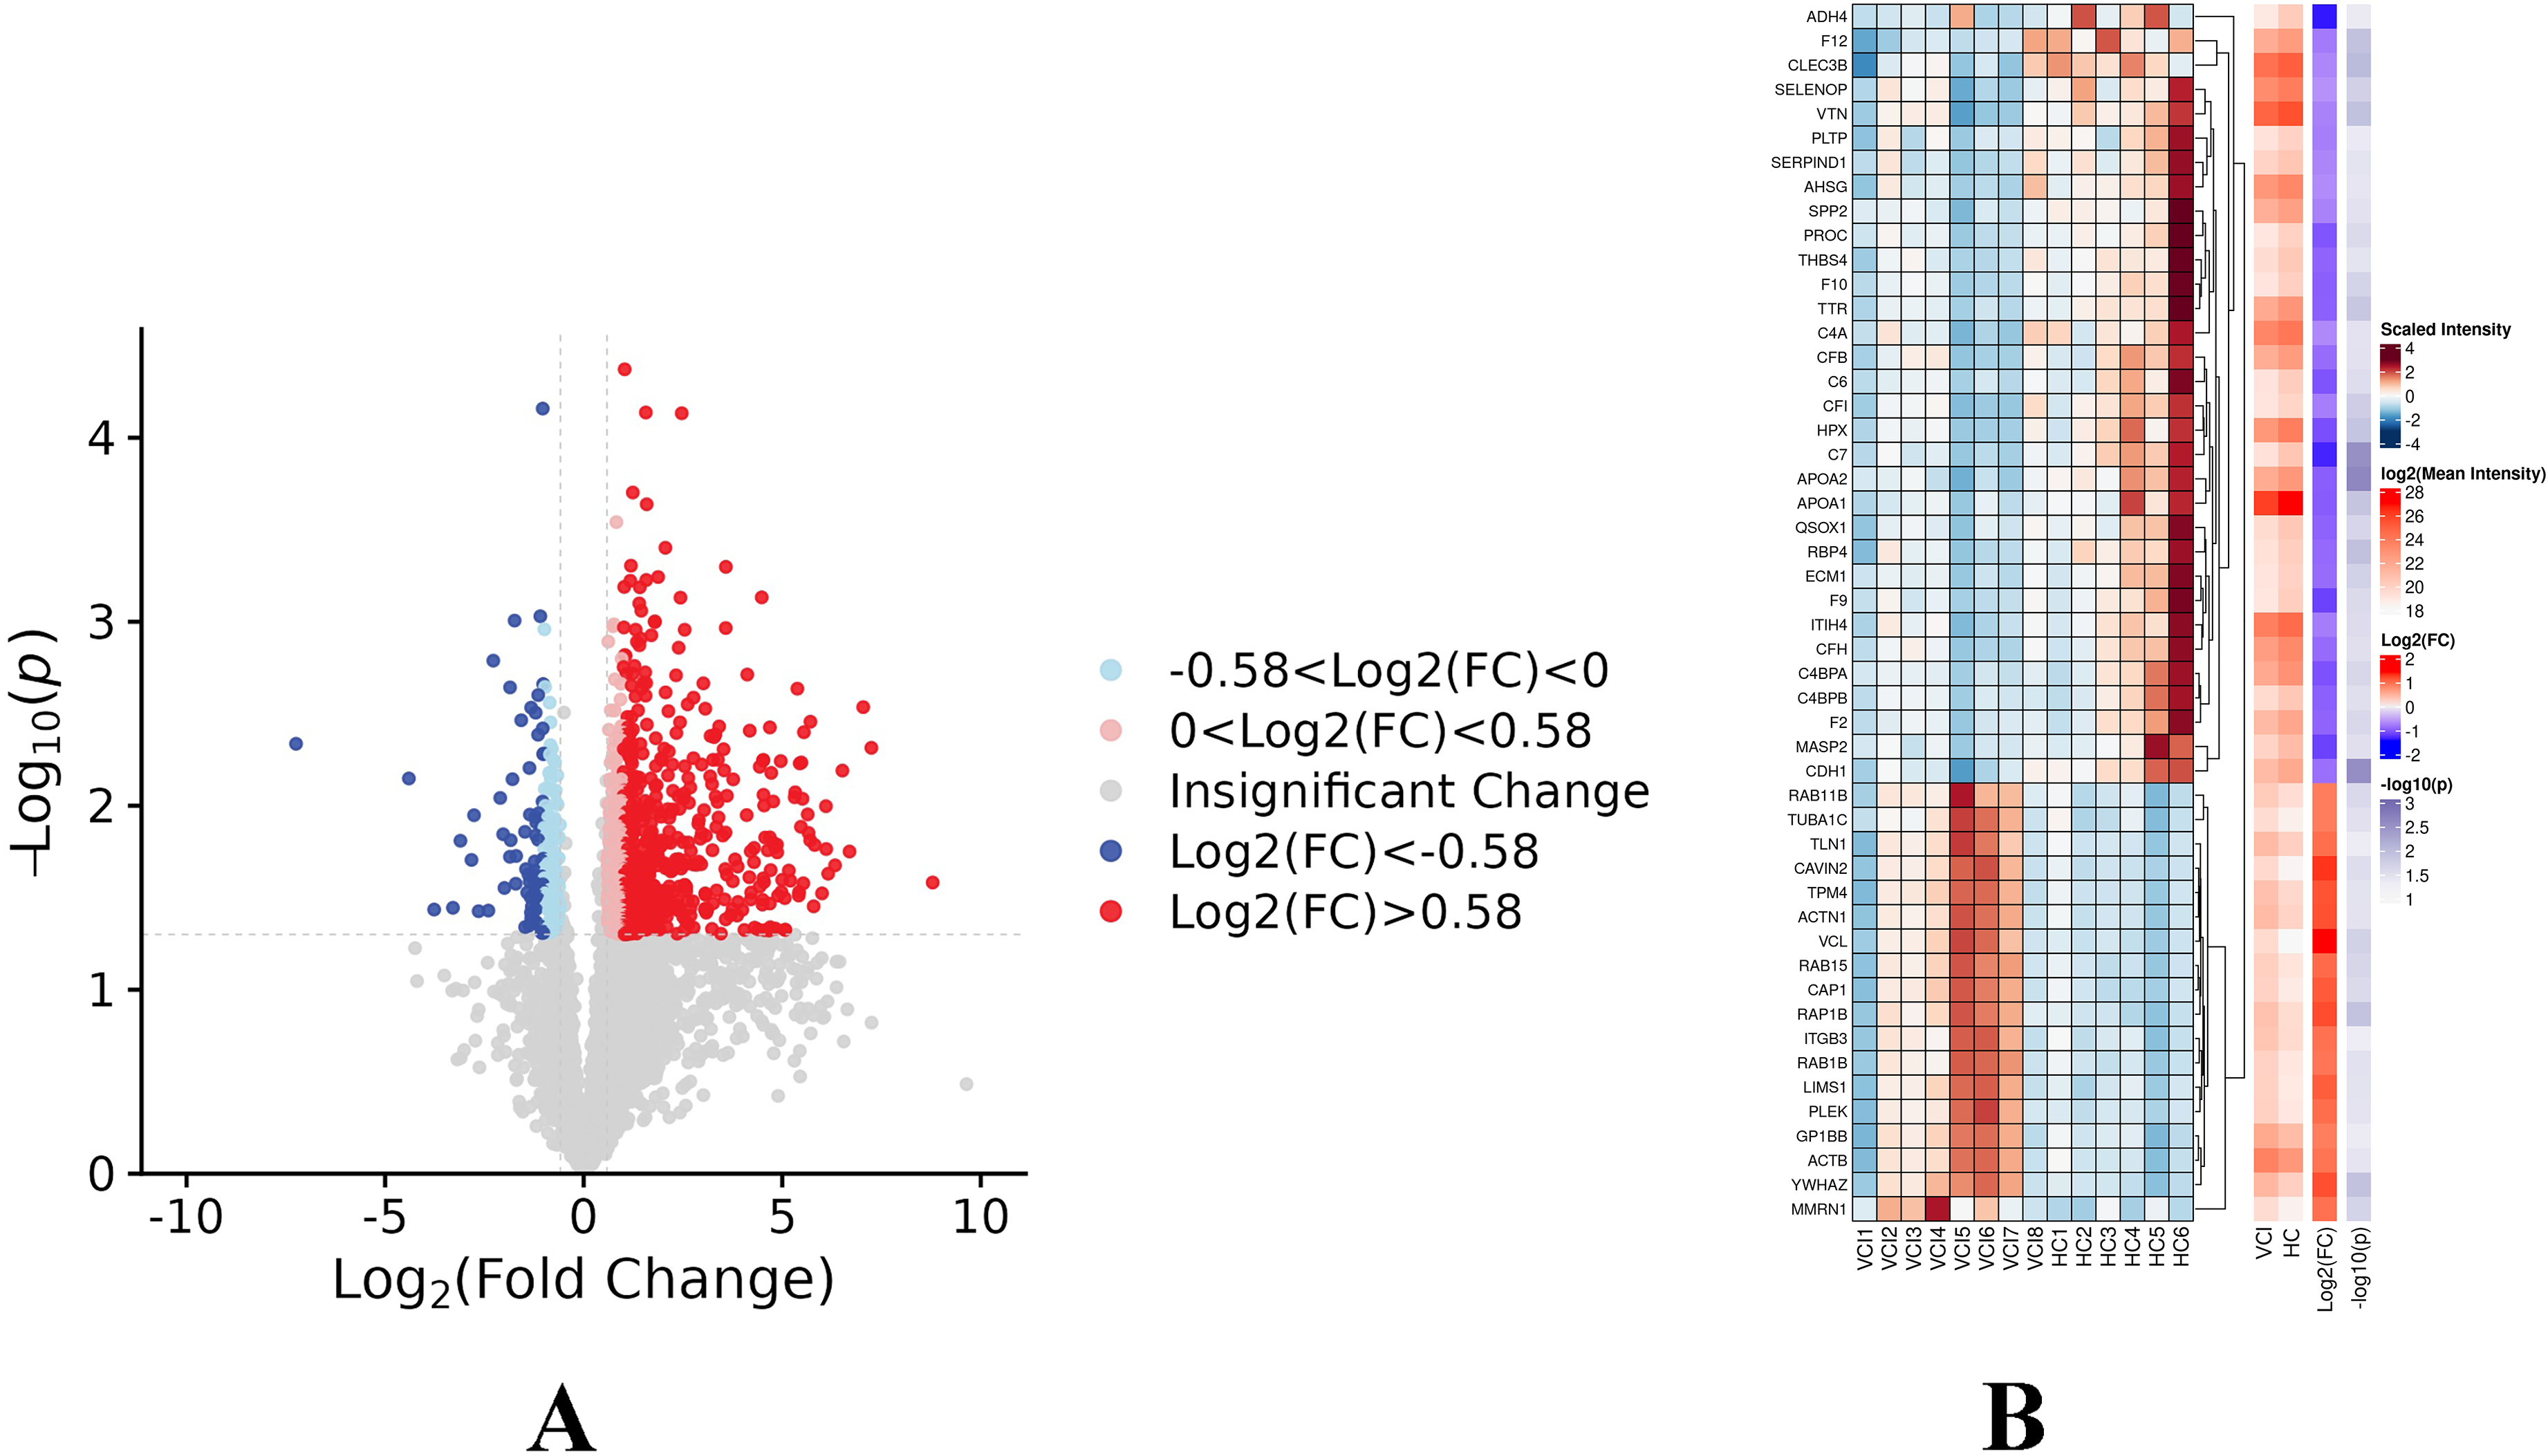
Differential protein expression in VCI and HCs. Figure 1A shows the fold changes and significance of all quantified proteins, highlighting those up- or down-regulated in VCI versus HCs. Figure 1B illustrates the standardized expression patterns of representative differentially expressed proteins across samples, with clustering demonstrating separation between groups.
Demographic and clinical characteristics of participants.
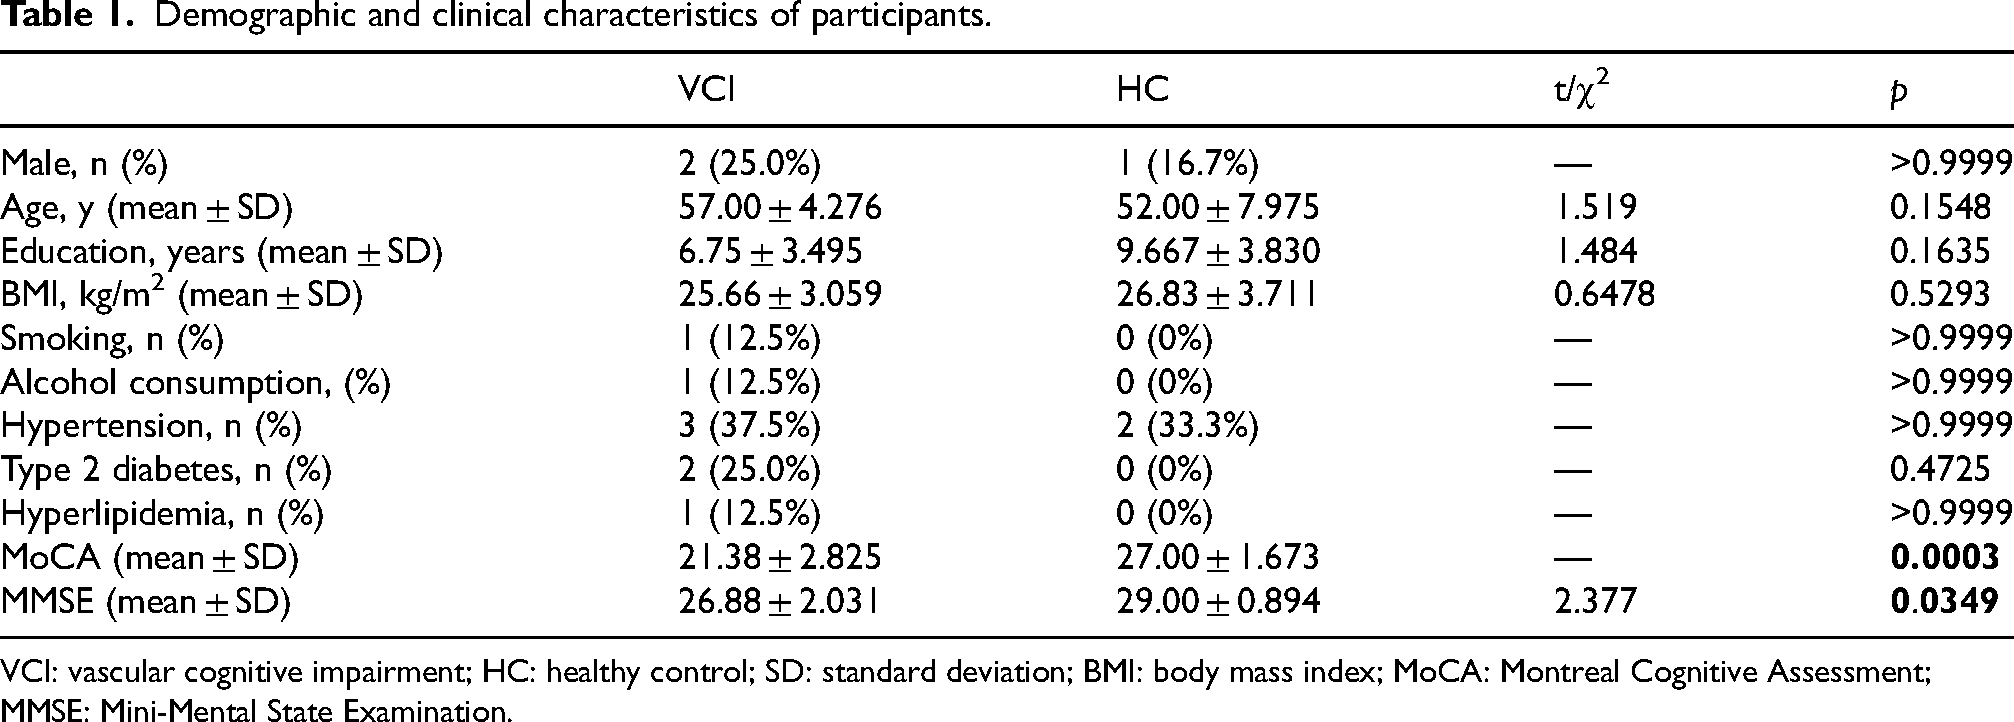
VCI: vascular cognitive impairment; HC: healthy control; SD: standard deviation; BMI: body mass index; MoCA: Montreal Cognitive Assessment; MMSE: Mini-Mental State Examination.
To explore the biological implications of the differentially expressed proteins, we conducted GO and KEGG enrichment analyses. GO-Biological Process (GO-BP) (Figure 2A) suggested that the differentially expressed proteins were significantly enriched in protein localization/transport and vesicle processes including establishment of protein localization, protein localization, protein transport, intracellular transport, vesicle-mediated transport, cellular/macromolecule localization, and nitrogen compound transport, and were also enriched in energy metabolism-related processes including cellular respiration, aerobic respiration, generation of precursor metabolites and energy.

Functional enrichment analysis of upregulated proteins in VCI. Figure 2A presents the top 20 enriched GO-BP for proteins with increased abundance in VCI, with bubble size proportional to gene count and color indicating significance level. Figure 2B displays the top 20 enriched KEGG pathways for the same proteins, with bubble size representing gene count and color reflecting significance level.
KEGG (Figure 2B) showed that pathways were primarily focused on mitochondrial and carbon metabolism modules such as oxidative phosphorylation, citrate cycle and carbon metabolism, protein homeostasis and stress including protein processing in endoplasmic reticulum, chemical carcinogenesis—reactive oxygen species, and platelet/endocytosis-related pathways like platelet activation and endocytosis. Additionally, several common neurodegenerative pathways including AD, Parkinson's disease, and Huntington's disease were observed.
Based on proteomic expression abundance and previous literature, we further selected nine highly expressed proteins, including YWHAZ, CLDN5, VCL, TPM4, TLN1, CAP1, ITGB3, GP1BB, and ROCK2 as candidate biomarkers for subsequent ELISA validation.
ELISA validation
We conducted ELISA experiments in a separate cohort from the same center, comprising 8 VCI patients and 8 HCs recruited under identical inclusion and exclusion criteria, to validate the candidate biomarkers screened by proteomics. We measured the levels of the following candidate proteins including YWHAZ, CLDN5, VCL, TPM4, TLN1, CAP1, ITGB3, GP1BB, and ROCK2.
Results showed that, compared to HCs, the plasma levels of CAP1 (257.1 ± 51.48 versus 204.7 ± 27.47 ng/L, 95% CI: 8.19–96.68, p = 0.0235) and ROCK2 (10.10 ± 2.417 versus 7.555 ± 1.835 ng/mL, 95% CI: 0.24–4.84, p = 0.0328) were significantly higher in the VCI group (Figure 3). These results were consistent with the proteomic analysis, indicating their reproducibility as plasma candidate biomarkers for VCI.
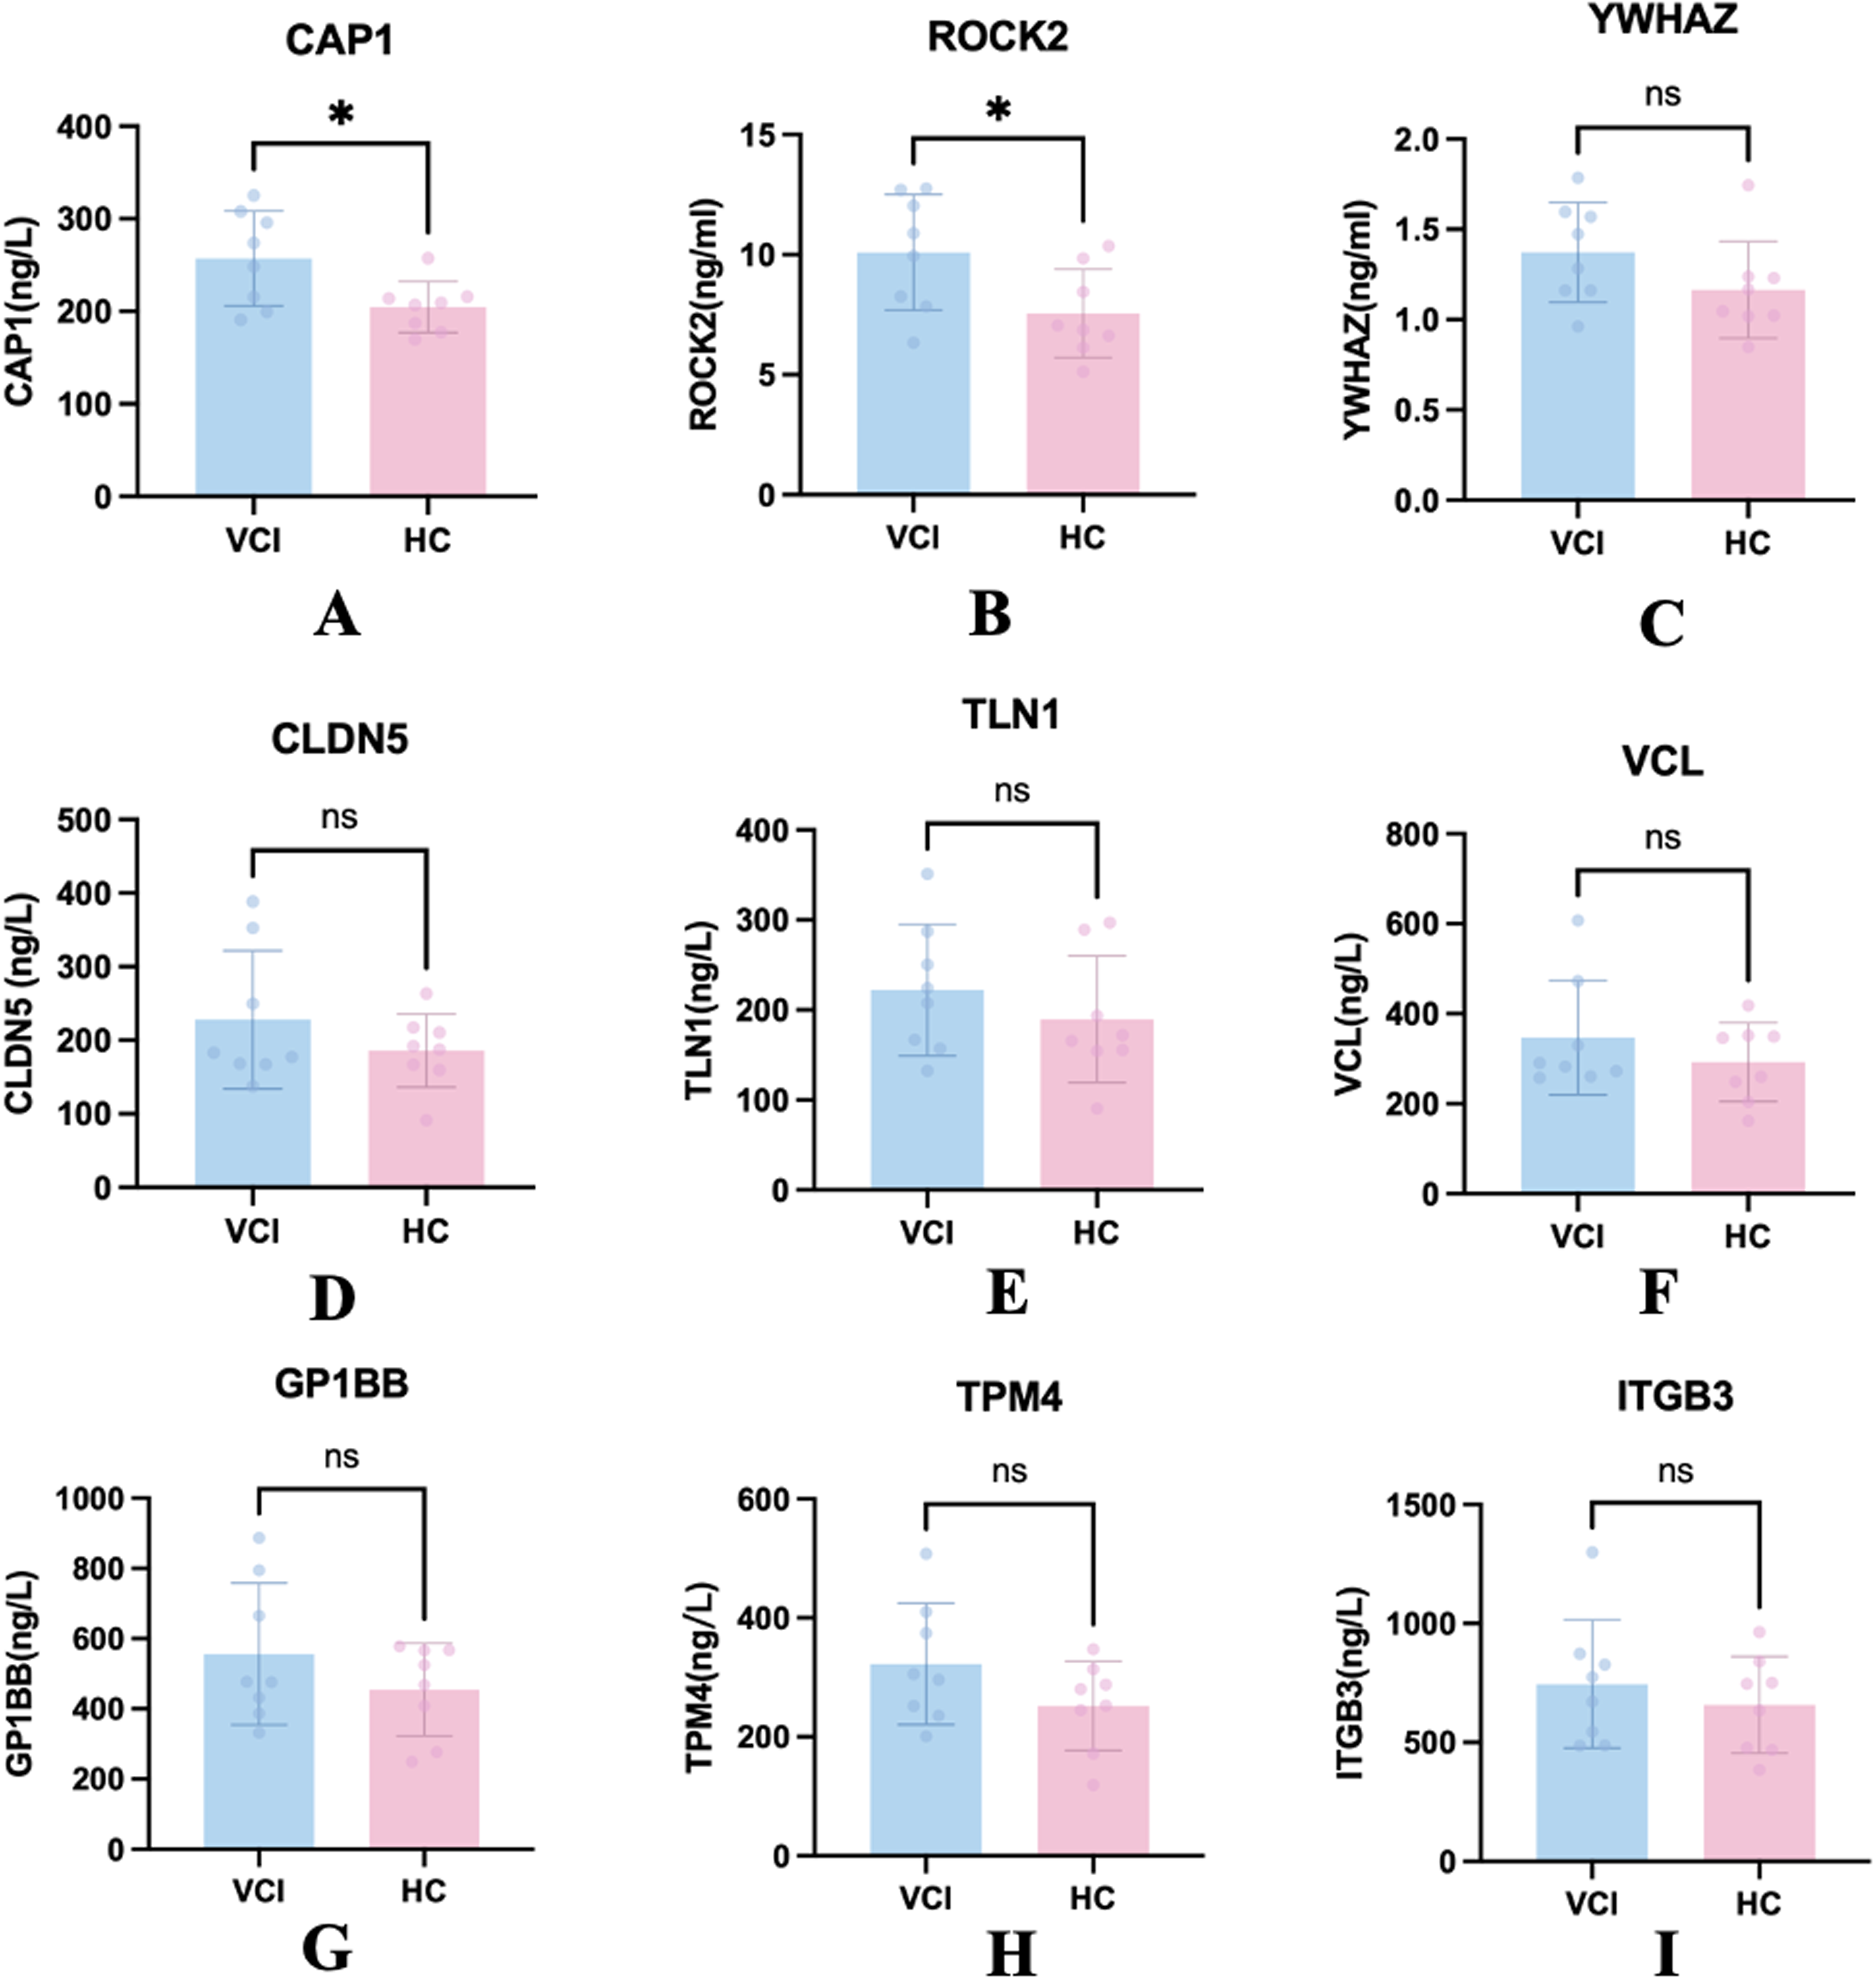
ELISA validation of candidate biomarkers. Figure 3 displays the plasma protein levels of nine candidate biomarkers in VCI patients versus HCs. The asterisks (*) indicate a significant difference between groups (p < 0.05), while “ns” denotes no significant difference. Results show that CAP1 and ROCK2 levels were significantly higher in the VCI group.
Integrated proteomics and metabolomics analysis
We conducted integrated proteomics and metabolomics analysis to explore the functional role of CAP1. Partial correlation analysis adjusted for age, sex, and BMI showed a positive correlation between CAP1 and several glycolysis-related metabolites (Figure 4A). Especially, the correlation of CAP1 levels with lactate and with the composite glycolysis score (gly_score) remained statistically significant after panel-level FDR correction (FDR < 0.05). It suggested that CAP1 maintained a consistent expression trend with metabolic changes within the glycolytic metabolic network.
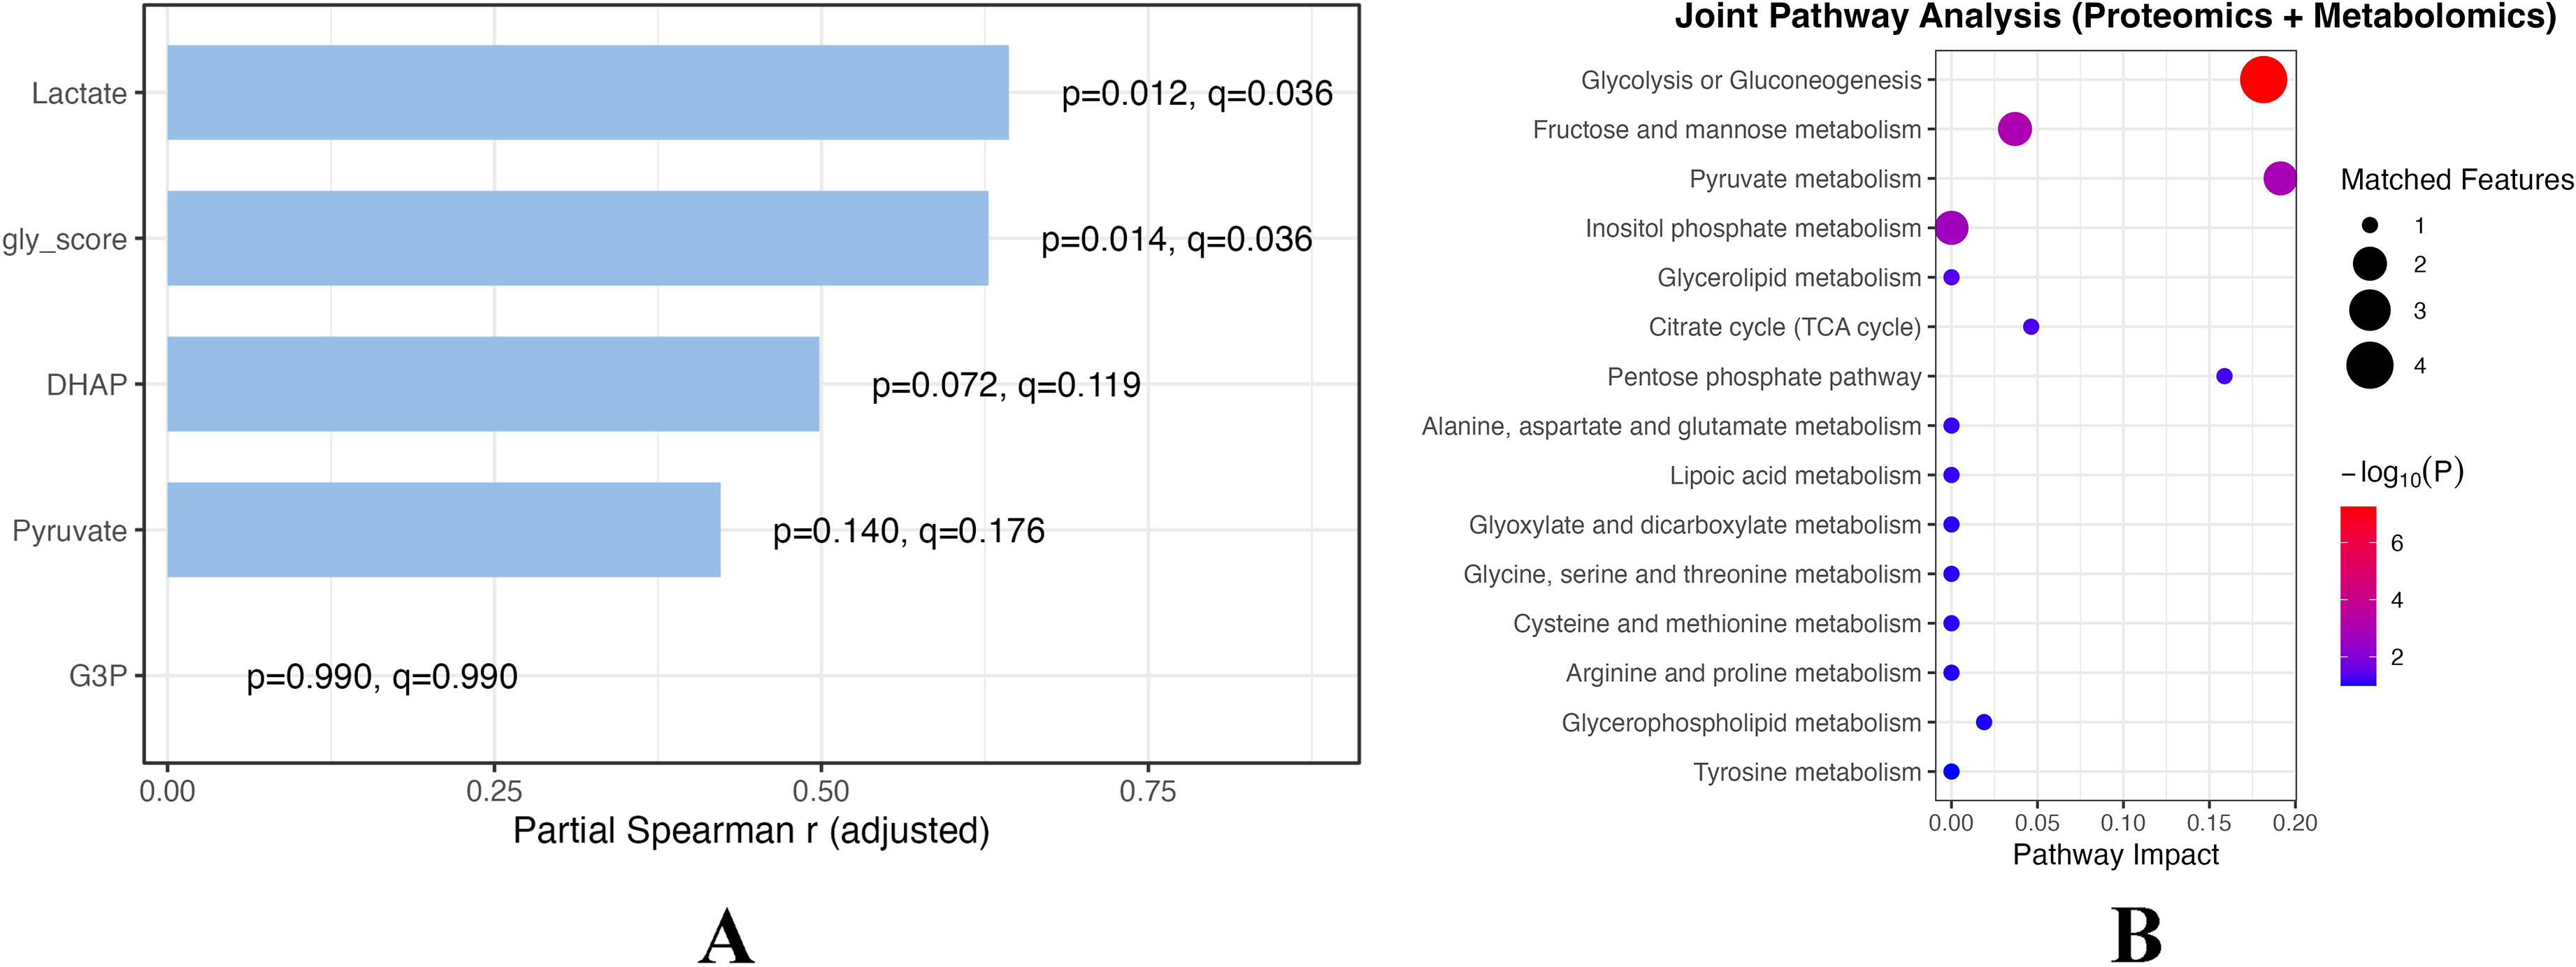
Association of CAP1 with glycolysis-related metabolites and pathway enrichment analysis. Figure 4A presents the partial correlations between CAP1 and glycolysis-related metabolites. The x-axis indicates correlation coefficients (r-values), with p-values and q-values provided. Significant positive correlations were observed between CAP1 and lactate, as well as the gly_score. Figure 4B illustrates the results of joint pathway enrichment analysis integrating proteins and metabolites. The x-axis represents pathway impact, bubble size reflects the number of features in each pathway, and color indicates significance level.
In the joint pathway analysis, it identified several key energy metabolism-related pathways, including glycolysis/gluconeogenesis, fructose and mannose metabolism, and pyruvate metabolism. These pathways showed co-enrichment at both the protein and metabolite levels (Figure 4B), supporting a functional link between CAP1 and glycolysis as well as related metabolic pathways.
MR analysis
To evaluate the potential causal effects of CAP1 and ROCK2, we performed a two-sample MR analysis using publicly available plasma pQTLs as instrumental variables. These were paired with VaD and CSVD-related imaging phenotypes. We used multiple methods for the analysis, including IVW, Weighted Median, and MR-Egger regression. The Wald Ratio method was additionally used when the instrumental variable was a single SNP.
The results showed no evidence of a significant causal association between the circulating levels of CAP1 or ROCK2 and VaD or the CSVD imaging markers (Supplemental Table 3 and Table 4). The findings were consistent across all methods. Similarly, a reverse MR analysis did not support a causal effect of VaD or CSVD on the circulating levels of CAP1 or ROCK2 (Supplemental Table 3 and Table 4).
Discussion
In this study, we utilized proteomics technology to investigate the plasma proteome differences between patients with VCI and HCs. Our key finding is that multiple proteins were differentially expressed in VCI patients, with CAP1 and ROCK2 validated as significantly upregulated potential biomarkers in an independent cohort by ELISA. To further elucidate the function of these proteins, we conducted an integrated proteomics and metabolomics analysis. The results revealed a significant positive correlation between CAP1 and several glycolysis-related metabolites, and a co-enrichment with glycolysis and related carbohydrate metabolic pathways was observed in the pathway enrichment analysis. Furthermore, our MR analysis found no causal association between the circulating levels of CAP1 and ROCK2 and VaD or CSVD imaging markers. This suggests that the observed association may reflect a phenotypic correlation in a disease state rather than a direct genetic causal relationship. In conclusion, these findings not only provide new clues for potential VCI biomarkers but also offer a novel perspective for a deeper understanding of VCI's pathophysiological mechanisms.
Previous studies have suggested that the pathogenesis of VCI involves several biological pathways, including endothelial dysfunction, blood-brain barrier (BBB) disruption, oxidative stress, inflammation, coagulation dysfunction, and neuronal and glial degeneration.2,20 However, evidence for reliable plasma biomarkers remains relatively limited, with most reports concentrating on non-specific inflammatory markers (e.g., C-reactive protein, IL-6), neuro-injury-related molecules (e.g., neurofilament light chain), or indicators of endothelial function.21–25 However, while these markers have shown some value in certain studies, they lack consistent validation across different cohorts. In contrast, the candidate molecules CAP1 and ROCK2, identified through untargeted proteomics in this study, offer a novel direction.
CAP1 plays an important role in cytoskeleton remodeling and the regulation of energy metabolism.25,26 Prior research has also implicated it in neuronal synaptic plasticity and cardiovascular disease-related pathologies, including atherosclerosis.27,28 We found that CAP1 is significantly correlated with several glycolysis-related metabolites, suggesting it may be a key molecule linking vascular pathology with energy metabolism dysfunction. Glycolysis and mitochondrial dysfunction are closely related with impaired cerebral energy metabolism and are considered one of the key mechanisms contributing to cognitive decline and white matter damage.29,30 This theory aligns with the findings of the present study, which indicate that CAP1 is upregulated in patients with VCI and is significantly correlated with gly_score and lactate levels. These findings suggest that CAP1 may exert indirect effects on neuronal function and cognitive performance through the regulation of cytoskeletal and metabolic networks. CAP1 has been scarcely reported in the context of VCI, and our findings may provide a new direction for future research.
ROCK2 has been implicated as a key regulator of vascular tone and cytoskeletal dynamics, playing a significant role in CSVD, atherosclerosis, BBB dysfunction, and inflammatory responses.31–36 Previous studies have suggested that excessive activation of the ROCK pathway is closely associated with vascular endothelial dysfunction. 37 This pathological condition can result in reduced endothelial nitric oxide synthase activity and impaired vascular dilation capacity, thereby contributing to the exacerbation of cerebral hypoperfusion, which is recognized as a key mechanism underlying VCI.37,38 Studies utilizing existing animal and cell models have demonstrated that activation of ROCK2 can result in the downregulation of tight junction (TJ) proteins, including claudin-5, occludin, and ZO-1, both in terms of expression levels and cellular localization.32,39,40 This downregulation subsequently increases the permeability of the BBB, leading to plasma component leakage, white matter damage, and neuroinflammation, processes that closely align with the neuroimaging phenotypes observed in VCI.32,39–41 In these models, upstream regulatory factors of ROCK2, such as catalpol, as well as ROCK inhibitors like Y-27632, have been shown to counteract this effect by restoring the expression and proper localization of TJ proteins, thereby enhancing BBB function.32,42,43 In this study, we found that plasma ROCK2 levels were significantly elevated in patients with VCI, suggesting that ROCK2 may not only serve as a potential plasma biomarker but also contribute to the vascular pathology of the disease, thereby providing a rationale for exploring its potential as a therapeutic target.
However, subsequent bidirectional two-sample MR analyses did not support a causal association between circulating levels of CAP1 or ROCK2 and VaD or imaging markers of CSVD. This suggests that the significant differences observed in proteomics and ELISA validation may primarily reflect state-dependent associations rather than direct genetic causal effects. Therefore, further validation in larger, independent cohorts is warranted.
Several limitations of this study should be noted. First, the proteomics analysis was based on a small sample size of only 8 VCI patients and 6 HCs, which limited the statistical power and might affect the robustness of the identified differential proteins. Similarly, the ELISA validation was performed in a small independent cohort of 8 VCI patients and 8 HCs and is thus insufficient to draw broadly generalizable conclusions. The two cohorts were kept separate to avoid technical heterogeneity and to further validate the biomarkers identified in the proteomics analysis, but larger sample sizes are needed to confirm these findings. Second, potential imbalance in vascular risk factors, such as diabetes, hypertension, and dyslipidemia, may confound CAP1 and ROCK2 levels independent of VCI. Due to the small sample sizes in both the proteomics and ELISA cohorts, statistical adjustment for these factors was not performed, as such models would be unstable and prone to overfitting. Therefore, these findings should be interpreted as preliminary and exploratory. Further studies with larger samples should consider matching or multivariable adjustment to better account for vascular risk confounding. Third, although AD and LBD were excluded based on clinical presentation and structural MRI findings, biomarker-supported neuroimaging techniques such as SPECT or PET were not available in the present cohort. Given the possibility of overlapping pathologies in older adults, the presence of subtle neurodegenerative changes cannot be entirely ruled out. Future studies incorporating biomarker-based imaging assessments may help reduce diagnostic uncertainty. Moreover, although our cohort includes a relatively larger proportion of VCI samples, we acknowledge the absence of a VaD group as a limitation. Including VaD patients in future studies would allow for comparisons across different stages of VCI, helping to clarify the specificity of these biomarkers in a broader population. Additionally, the study was cross-sectional and lacks longitudinal follow-up, which limits the ability to establish causal relationships. Longitudinal studies and functional experiments are needed to further elucidate the causality and clinical relevance of these biomarkers. Finally, although we attempted to validate the potential genetic causal relationship between CAP1 and ROCK2 and VCI through MR analysis, the currently available pQTL and imaging phenotype data remain limited, and the statistical power is insufficient, which may restrict our causal inference. Future studies should be validated in larger, multi-center cohorts and should incorporate longitudinal follow-up and experimental models to further elucidate the pathological roles and clinical application value of the candidate proteins.
In conclusion, our study utilized integrated proteomics and metabolomics analysis, combined with ELISA validation and genetic epidemiology, and identified CAP1 and ROCK2 as upregulated proteins in the plasma of VCI patients. The proteins were associated with carbohydrate metabolism pathways and vascular pathological processes. Although MR analysis did not indicate a genetic causal relationship between them and VCI or CSVD imaging markers, the overall findings provide initial exploratory signals of their potential relevance to VCI. Given the small cohort size and other methodological constraints, these observations are preliminary. Further multi-center studies with larger samples, along with mechanistic investigations, will be required to determine whether CAP1 and ROCK2 play meaningful roles in VCI progression and to clarify their potential value in early clinical assessment or as potential therapeutic targets.
Supplemental Material
sj-docx-1-alz-10.1177_13872877261423568 - Supplemental material for Exploratory evaluation of CAP1 and ROCK2 as candidate blood biomarkers for vascular cognitive impairment
Supplemental material, sj-docx-1-alz-10.1177_13872877261423568 for Exploratory evaluation of CAP1 and ROCK2 as candidate blood biomarkers for vascular cognitive impairment by Xue Ren, Xinyuan Zhang, Weisen Wang, Mingcheng Zhang, Xiaoying Bi and Wenjia Peng in Journal of Alzheimer's Disease
Footnotes
Acknowledgements
The authors have no acknowledgments to report.

Ethical considerations
This study was conducted in accordance with the Declaration of Helsinki and was approved by the Ethics Committee of Changhai Hospital.
Consent to participate
Written informed consent to participate was obtained from all participants.
Consent for publication
Written informed consent for publication was obtained from all participants.
Author contribution(s)
Funding
The authors disclosed receipt of the following financial support for the research, authorship, and/or publication of this article: This work was supported by the Natural Science Foundation of Shanghai Municipality, Medical Innovation Research Special Project of Shanghai Science and Technology Commission, (grant number 22ZR1478100, 22Y11911200).
Declaration of conflicting interests
The authors declared no potential conflicts of interest with respect to the research, authorship, and/or publication of this article.
Data availability statement
The datasets generated and/or analyzed during the current study are not publicly available due to ethical considerations but are available from the corresponding author on reasonable request.
Supplemental material
Supplemental material for this article is available online.
References
Supplementary Material
Please find the following supplemental material available below.
For Open Access articles published under a Creative Commons License, all supplemental material carries the same license as the article it is associated with.
For non-Open Access articles published, all supplemental material carries a non-exclusive license, and permission requests for re-use of supplemental material or any part of supplemental material shall be sent directly to the copyright owner as specified in the copyright notice associated with the article.
