
Abstract
Background
Mild cognitive impairment (MCI) is a condition between normal aging and Alzheimer's disease (AD), with around 12% of individuals progressing to AD each year. Understanding how cognitive functions evolve over time in people with MCI, especially those who eventually develop AD, is key to improving early detection and intervention.
Objective
To investigate the longitudinal changes in the relationships between cognitive functions in patients with MCI, which will or will not convert to AD.
Methods
We applied cross-lagged panel network (CLPN) to data from the Alzheimer's Disease Neuroimaging Initiative (ADNI). We analyzed cognitive evaluations over two years in 128 converters to AD (convMCI), 390 non-converters (stabMCI), and 362 healthy participants (HP).
Results
HP and stabMCI showed increasing stability in their performance over time (i.e., a performance at one time predicting the same performance at a later point), while convMCI experienced a decline. Additionally, while HP maintained stable relationships between different tests (i.e., a performance at one time predicting a different performance at a later point), individuals with MCI showed more fluctuation, particularly those who progress to AD. We also found that executive functions were the most reliable predictors of future cognition in healthy participants, while memory played a more critical role in predicting outcomes for MCI patients, especially those who convert to dementia.
Conclusions
These findings highlight different cognitive trajectories in MCI patients, offering valuable insights into how cognitive decline unfolds in those at risk of developing dementia. Our results shed new light on the longitudinal reorganization of cognitive performances.
Keywords
Introduction
According to the World Health Organization, there are currently 50 million individuals living with dementia worldwide, and this number is expected to triple by 2050. 1 Mild cognitive impairment (MCI) is characterized by a cognitive impairment that does not affect a person's basic activities of daily living. MCI patients’ cognitive performances tend to fall midway between normal aging and mild Alzheimer's disease (AD). 2 Although the clinical manifestation, etiology, and outcome of MCI are heterogeneous, these patients progress to dementia at a rate of approximately 12% per year. 3 Despite new approved pharmacological treatments showing encouraging results,4,5 the early detection of dementia is critical to allow patients and families to plan and receive the available support and take advantage of the limited treatment options available. 6
Cognitive functioning is a dynamic system where different cognitive processes interact, 7 determining the whole system's behavior. Van Der Maas and collaborators have shown that performances on cognitive tasks, measured with neuropsychological tests, are invariably positively intercorrelated (i.e., positive manifold), suggesting that people who score well on one cognitive test are likely to score well on the others. 7 In this framework, changes in one cognitive domain may influence the relationship between other functions. Such complexity of the cognitive organization has been explored using network analysis (NA) to evaluate the relationships between cognitive functions in cross-sectional studies.7–9 A network is defined as a model composed of a set of nodes, representing the variables of interest, and a set of edges that connect the nodes, which represent their relations. 10 This conceptual simplicity makes network analysis useful for exploring systems where many variables are correlated with each other in a complex manner, giving back outcomes that are measurable, comprehensible, and yet not oversimplifying.11,12 Previous studies have shown that cognitive impairment not only diminishes cognitive performance 13 but also disrupts the balance between cognitive functions.9,13,14 In particular, healthy older adults and people with subjective cognitive decline (SCD) are characterized by fractionated communities of neuropsychological tests, which resemble neurocognitive domains (i.e., memory, language, etc.).8,14 Such an organization has been suggested to indicate that each cognitive test mostly captures one cognitive function, although it is not uniquely related to it.9,14 Conversely, AD seems to reduce the fractionalization of the cognitive architecture, with a higher density of connections, implying a simplification of the dimensionality of individual differences.9,14 A higher density of connections may reflect the massive recruitment of non-specific and general cognitive processes to solve a single task. However, evidence about longitudinal patterns is still missing, as previous research focused on cross-sectional studies.
The present study aims to investigate the longitudinal changes in the relationships between cognitive functions in patients with MCI, who will or will not convert to AD. We tackled this issue by means of cross-lagged panel network (CLPN) models, a cutting-edge method to investigate the relationship between cognitive performance on different measurement occasions. 15 The importance of using network analysis to study longitudinal changes in cognitive impairment becomes particularly clear when we consider Van der Maas's proposal that cognitive processes are uncorrelated in the early stages of development and that the positive manifold emerges as a consequence of mutual interactions between processes. 7 We applied CLPN to a relatively large sample of patients with MCI, differentiating between those who will convert to AD and those who will not. As a reference, we also investigated the longitudinal evolution of a group of healthy older adults.
Methods
Participants
Data used to prepare this article were obtained from the Alzheimer's Disease Neuroimaging Initiative (ADNI) database (adni.loni.usc.edu) in November 2023. The ADNI was launched in 2003 as a public-private partnership led by Principal Investigator Michael W. Weiner, MD. The primary goal of ADNI has been to test whether serial magnetic resonance imaging (MRI), positron emission tomography (PET), other biological markers, and clinical and neuropsychological assessment can be combined to measure the progression of MCI and early AD. We focused our study on the clinical data (i.e., neuropsychological assessment) attached to the ADNI. We extracted three cognitive evaluations of two groups of MCI patients who will convert to AD (convMCI; N = 128, 48 females, mean age: 74.70 ± 6.94, mean years of education: 16.00 ± 2.72, mean years of conversion: 4.97 ± 2.27) or not (stabMCI; N = 390, 158 females, mean age: 73.2 ± 7.60, mean years of education: 15.90 ± 2.84) and a group of healthy participants (HP; N = 362, 188 females, mean age: 73.80 ± 5.93, mean years of education: 16.50 ± 2.65).
For all groups, we considered three time points: a baseline assessment administered as a first visit in the ADNI protocol, and two assessments administered after 12 and 24 months from the baseline. Crucially, all patients presented a stable diagnosis across all time points, so that HP never developed MCI and MCI never developed AD during the period we considered. Table 1 shows how long the groups were followed in the ADNI study.
Period covered by the ADNI study and number of assessments.
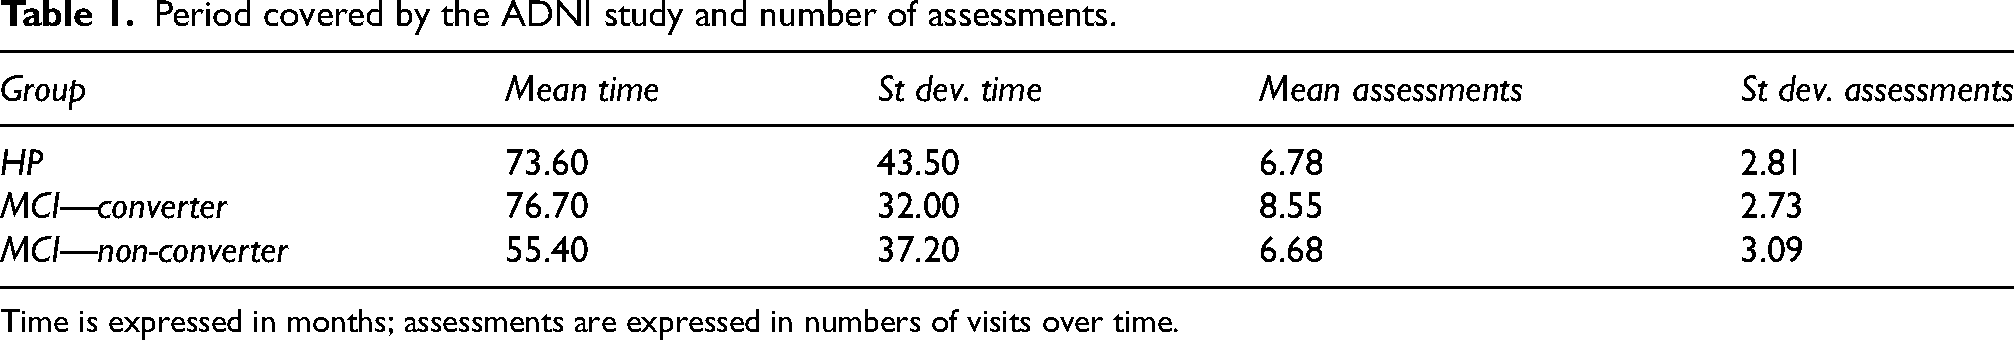
Time is expressed in months; assessments are expressed in numbers of visits over time.
Measures
We considered raw scores of the following neuropsychological tests: Mini-Mental State Examination (MMSE) 16 ; Category Fluency test—animals 17 ; Boston Naming Test 18 ; Rey Auditory Verbal Learning Test—delayed recall and recognition 18 ; Logical memory test—immediate and delayed recall (modified from 19 ); Clock Drawing Test—drawing and copy, 20 and Trail Making Test—part A and part B.21–24 We selected tests with less than 20% missing values in the first visit and time points with less than 20% missing values in all selected tests. The 20% missing values cut-off allowed us to maintain a good balance between having a representative number of tests that cover the main cognitive domains (general cognition, executive functions, language, memory, and praxis) and having a relatively large sample size to draw robust conclusions.
Test scores were used as nodes of the network in the CLPN model.
Statistical analysis
For each group of participants and each test, we imputed missing values using the imputation function from the longitudinalData package25,26 for the statistical software R. We used the copyMean.bisector method, an algorithm that has been proven to recover the original model for longitudinal data well. The method imputes missing data in two stages. First, it uses the classical longitudinal imputation method to obtain an approximation of the imputed value (i.e., for intermittent missing values (i.e., in the middle), values immediately surrounding the missing are joined by a line; for monotone missing values (i.e., at the start and at the end of the trajectory), points are chosen on the bisectrices of global (i.e., average trajectory) and local slopes). A second step uses the information provided by the population's mean trajectory to refine the first approximation; that is, to give the imputed trajectory the same shape as the mean trajectory.25,27 This method has been validated in datasets with 10%, 30% and 50% of missing data. 26 The authors showed that the algorithm works well up to 50% of missing values and that it is capable of recovering the data generative model equally well at 10% or 50% of missing values. With less than 20% of missing values per participant, we are safe to proceed with this algorithm choice.
We compared groups’ age and education with one-way ANOVAs, and sex distribution with the chi-squared test; moreover, we compared groups’ trajectories in all the neuropsychological tests with mixed ANOVAs. Then, for each group, we standardized the neuropsychological test scores based on mean and variance across all three waves. We used CLPN models to investigate the relationship between cognitive performance on different measurement occasions from a network perspective. We assessed edges and node-wise prediction stability via bootstrap (500 samples).
Cross-lagged panel network model
The CLPN model has been developed by Wysocki and colleagues 14 to model the relations between variables (i.e., nodes of the network) as directed paths across time (i.e., edges of the network). Cross-lagged effects are estimated by regressing a set of variables at a measurement occasion t + 1 on the set of variables at the previous occasion t, thus obtaining the effect of each variable on the other over a particular time lag, while controlling for the auto-regressive effect of each variable on itself. As suggested by Wysocki and colleagues, 14 we interpreted cross-lagged and autoregressive paths in terms of prediction. That is, a regression path from variable X at occasion t to a variable Y (or the same variable X) at future occasion t + 1 suggests that a change in X predicts a change in Y (or X itself) over the course of that specific time lag. Thus, paths reflect the variance shared between a variable at occasion t and another variable at the following occasion (t + 1) while controlling for all other variables at occasion t. The model has two main assumptions: (i) time intervals between measurement points are equally spaced; (ii) the sample size must be greater than the total number of variables at all measurement occasions. We extracted the data from the ADNI database to meet both criteria (see Measures and Participants sections). Importantly, CLPN models can admit different longitudinal patterns across different measurement occasions (i.e., different effects across time points). To deal with the great number of paths to estimate, the CLPN model uses a hybrid estimation approach: the initial model is selected using LASSO regularized regression, and then the same model is estimated again as a structural equation model (SEM).
In the first step, edges are estimated as linear regression coefficients of each node (i.e., variable) on itself and each other variable, from one measurement occasion (t) to the next (t + 1). Regression coefficients are estimated using Least Absolute Shrinkage and Selection Operator Regression (LASSO) regression, a penalized regression approach that leads small relationships to shrink to zero, thus achieving a sparse solution (i.e., most of the parameters are zeros) that prevents overfitting. 23 LASSO uses a parameter called lambda (λ) to control the sparsity of the network. Lambda is selected through cross-validation, a method that evaluates the model performance on different subsets of the data and then calculates the average prediction error rate. In this case, regression estimates are obtained for a sequence of 100 lambda values, and the one that produces the lowest cross-validation error is chosen (i.e., the value with the lowest prediction error).
In the second step, we fixed to zero the edges that were estimated to be zero in the first step and re-estimated the model as a non-regularized regression within an SEM. This step provides non-regularized edges but maintains the model estimated via the LASSO regression. To investigate whether the predictive relations across measurement occasions are equal, we fitted two nested models: (i) an unconstrained model where path weights are allowed to vary across time points (i.e., it allows edges to take on different values across subsequent time intervals); and (ii) a constrained model, such that paths from T0 to T1 are constrained to be equal to paths from T1 to T2. We compared the models and selected the best-fitting one.
From the selected model, we computed (i) the average linear regression coefficients (i.e., edges weight) of all variables on themselves at the following occasion (i.e., autoregressive mean weight); (ii) the average linear regression coefficients (i.e., edges weight) of all variables on all the other variables at the following occasion (i.e., cross-lagged mean weight); (iii) the proportion of variance in each variable at a measurement occasion that is explained (i.e., predicted) by the complete set of variables at the previous occasion, excluding autoregressive patterns (i.e., cross-lagged in-prediction) and (iv) the average proportion of variance across all variables at the next measurement occasion that is accounted for (i.e., predicted) by a single variable at the previous occasion, excluding autoregressive patterns (i.e., cross-lagged out-prediction). Prediction indices can range from 0 (i.e., the variable shares no variance with the other nodes at different time points) to 1 (i.e., the entire variance of the node is shared with the other variables in the network at different time points). In the context of CLNP models, in-predictions and out-predictions are considered as measures of variable centrality.
As a final step, we used a bootstrap method to assess the stability of predictions and edges. To create a sampling distribution of these indices, we resampled 500 times with replacement, computed the model on each replica, and calculated regression coefficients, in- and out-predictions from each sample.
All analyses were done in R (R Core Team, version 4.3.2, 2023). R code for the CLPN estimation was freely available at osf.io/9h5nj. 15 CLPN regressions were estimated with the glmnet package, 28 SEMs were estimated with the lavaan package, 29 and networks were plotted using the qgraph package. 30
The analysis codes supporting the conclusions of this article are available in the Open Science Framework repository at the following link: https://osf.io/s8qpk/?view_only=b3179b92b5284b7ba911f329272a3339.
No part of the study procedures or analysis was pre-registered before the research was conducted.
Results
One-way ANOVAs between groups revealed significant differences in years of education (F(2877) = 4.11, p = 0.02, general eta2 = 0.009): future converters were older (mean and standard deviation = 74.7 ± 6.94) as compared to the other groups (stable MCI mean and standard deviation = 73.2 ± 7.60; healthy participants mean and standard deviation = 73.8 ± 5.93). Differences in age were not significant (F(2877) = 2.28, p = 0.06) between groups. The chi-squared test showed a significant difference in sex distribution across groups (χ2(2) = 13.108, p = 0.001, V = 0.08): 40.5% female stable MCI, 51.93% female healthy participants, and 37.50% female future converters.
Mixed (within-between) ANOVAs showed significant differences between groups for all neuropsychological tests (all p-values < 0.001). Language, memory, and screening tests also showed significant effects of time (p-values < 0.05) and significant interaction between group and time (p-values < 0.05). See Supplemental Table 1 for specific results and Supplemental Figure 1 for the group trajectories across time. As expected, healthy subjects showed higher cognitive performances and a more stable trajectory over time compared to MCI patients. When focusing on clinical patients (i.e., converter and non-converter MCI), we found a significant interaction between group and time for memory tests and the BNT only. In particular, future converters were more compromised and revealed a steeper worsening over time.
Cross-lagged panel network model
We described selected models via (i) the mean edge weight, as measuring the strength of the connections in the network; (ii) the density of the network, as an index of the proportion of existing edges on the total number of all possible edges 31 ; (iii) the autoregressive mean weight (i.e., the average linear regression coefficients of all variables on themselves at the following occasion); (iv) the cross-lagged mean weight (i.e., the average linear regression coefficients of all variables on all the other variables at the following occasion); (v) cross-lagged in-prediction (i.e., the extent to which each variable is predicted by other variables, excluding auto-regressive patterns); (vi) cross-lagged out-prediction (i.e., the extent to which each variable predicts other variables in the network, excluding auto-regressive patterns); (vii) bootstrap confidence intervals (CIs), assessing estimates stability.
Healthy participants
An unconstrained model, where path weights are allowed to vary across time points, fitted the data better, although edge density was equal in both years (density = 0.686; 95% CI [0.603; 0.769]; the full list of weights is reported in Supplemental Table 2). All tests showed autoregressive patterns (i.e., each variable at time t predicting itself at the following occasion t + 1), with a lower mean weight in the first year (M = 0.401; 95% CI [0.308; 0.494]) than in the second one (M = 0.515; 95% CI [0.383; 0.647]), suggesting that subjects with high performance at the baseline tend to maintain high performance at the following time point with increasing predictive power (i.e., increasing regression coefficients) and variability across years. Cross-lagged patterns (i.e., each variable at time t predicting other variables at the following occasion t + 1) were similar between the first (M = 0.047; 95% CI [0.036; 0.059]) and the second year (M = 0.043; 95% CI [0.032; 0.054]), with prediction both within cognitive domains (i.e., the delayed recall of the RAVL test predicted the delayed recall of the Logical Memory Test) and between them (i.e., the Trail Making Test performance predicts the Boston Naming Test score; Figure 1). Bootstrap results revealed that most of the prediction patterns are quite stable (i.e., observed edge and bootstrap edge mean overlap), but many edge CIs included zero, suggesting careful consideration of the smallest predictions (see Supplemental Figure 2). Looking at the cross-lagged in-prediction (i.e., the extent to which each variable is predicted by other variables at the previous occasion t-1, excluding auto-regressive patterns), the delayed recall of the Logical Memory Test (0.129) and the Trail Making Test, part A (0.111) were the most predictable scores. More interestingly, the Trail Making Test, part B, showed the highest predictive power across years, because it had the highest cross-lagged out-prediction (i.e., the extent to which each variable predicts other variables at the following occasion, excluding auto-regressive patterns; first year = 0.012; second year = 0.021; see Figure 1). Cross-lagged predictions are presented in Supplemental Table 5.
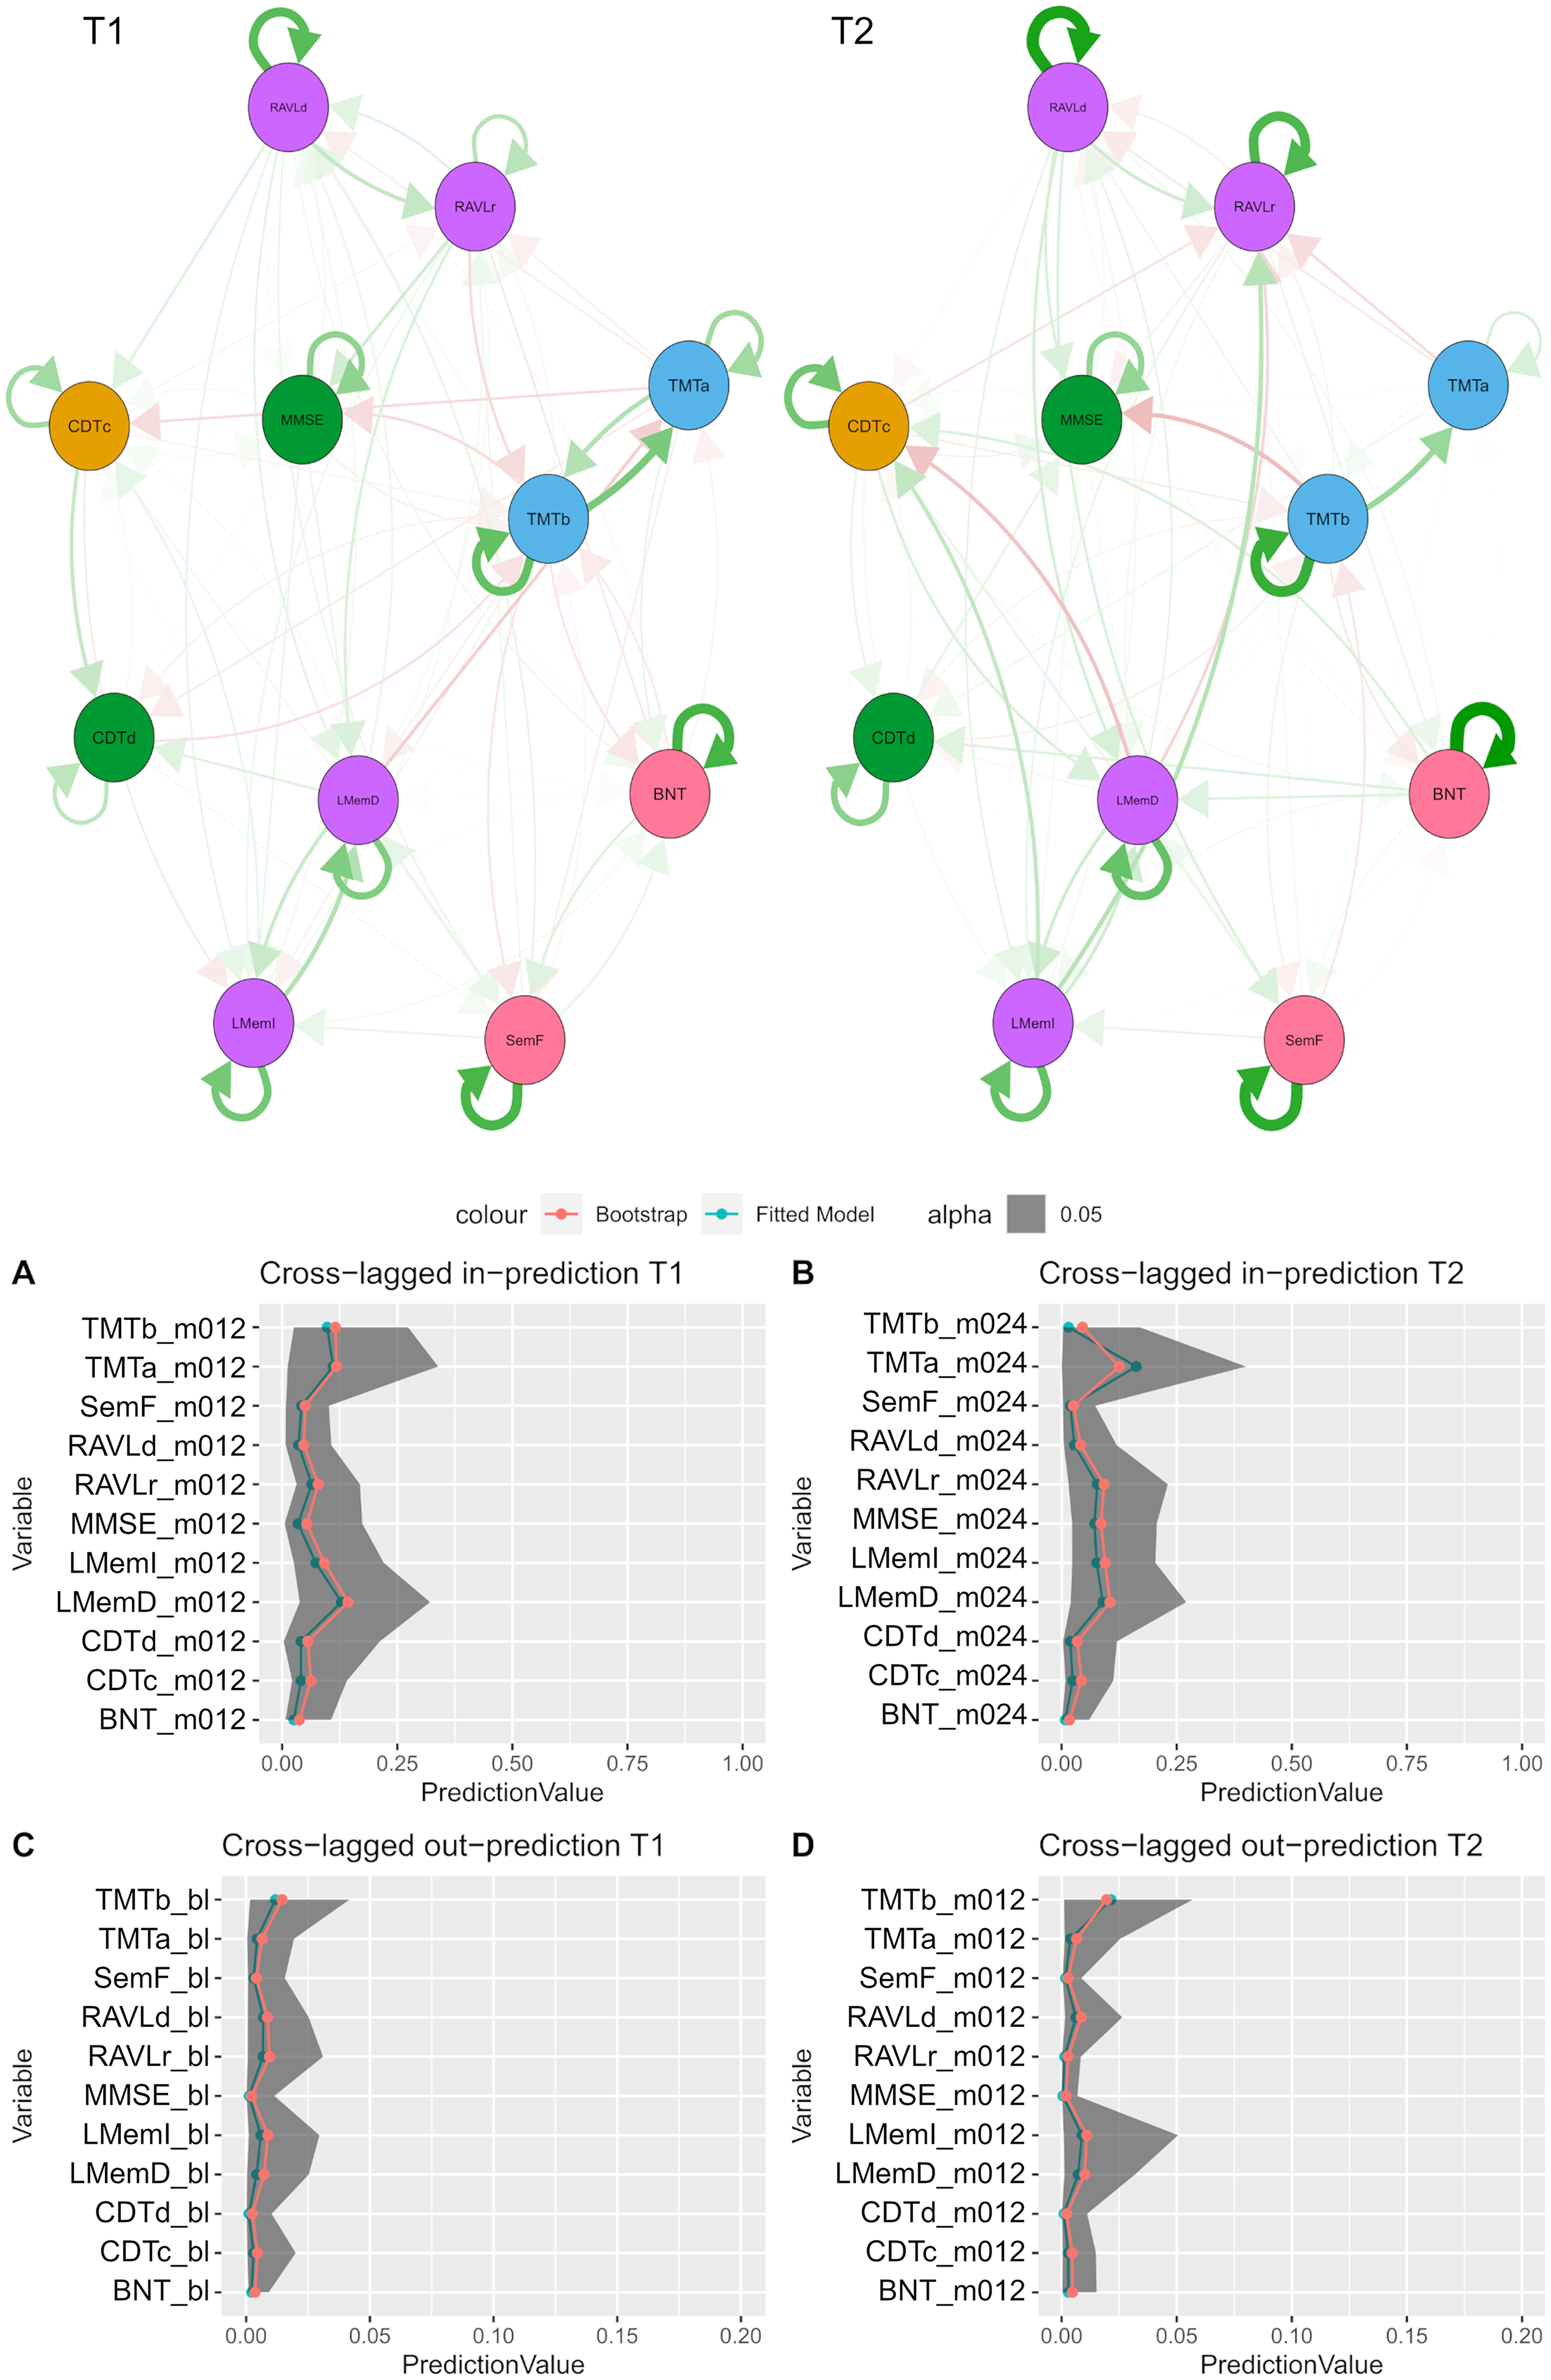
HP network and prediction. The upper panel shows the longitudinal networks: the left network shows the longitudinal prediction from the baseline assessment to the 12 months’ assessment (i.e., T1); the right network shows the longitudinal prediction from the 12 months’ assessment to the 24 months’ assessment (i.e., T2). Red edges indicate negative relations; green edges show positive ones. The edges’ size and color saturation represent the relationships’ intensity. Autoregressive patterns are shown as edges starting from a node and ending at the same node. For example, the MMSE has positive autoregressive patterns in both years, meaning that higher MMSE scores at the baseline are associated with higher MMSE scores at 12 months, and higher MMSE scores at 12 months are associated with higher MMSE scores at 24 months. Cross-lagged patterns are depicted as edges starting from a node and ending at another node. For example, the TMTb negatively predicts the MMSE in both years, meaning that higher TMTb scores at the baseline are associated with lower MMSE scores at 12 months, and higher TMTb scores at 12 months are associated with lower MMSE scores at 24 months. The nodes’ colors represent the cognitive domains (nodes with the same color belong to the same cognitive domain). The lower panel shows the cross-lagged in- and out-prediction (i.e., the extent to which each variable is predicted by or predicts other variables, excluding auto-regressive patterns) and their reliability. Green lines represent the fitted prediction, red lines represent bootstrapped predictions: the more these predictions are similar, the more the results are robust. Grey areas represent bootstrap CIs: the narrower the CIs, the more replicable the results. T1 = prediction from baseline (bl) to 12 months (m012); T2 = prediction from 12 months (m012) to 24 months (m024); BNT: Boston Naming Test; CDTc: Clock Drawing Test (copy); CDTd: Clock Drawing Test (draw); LMemI: Logical Memory Test–immediate recall; LMemD: Logical Memory Test–delayed recall; MMSE: Mini-Mental State Examination; RAVLr: Rey Auditory Verbal Learning Test-recognition; RAVLd: Rey Auditory Verbal Learning Test-delayed recall; SemF: Semantic Fluency test (animal); TMTa: Trail making Test–a; TMTb: Trail making Test–b. The reader is referred to the web version of this paper for the color representation of this figure.
MCI patients—non-converter group
The MCI non-converter networks showed a density index of 0.860 (95% CI [0.798; 0.921]) in both years (the full list of weights is reported in Supplemental Table 3), although an unconstrained model fitted the data better. Almost all tests showed autoregressive patterns (i.e., each variable predicting itself at the following occasion) in both years, with a great increase from the first (M = 0.453; 95% CI [0.331; 0.576]) to the second year (M = 0.729; 95% CI [0.649; 0.810]), suggesting that subjects tend to predict their performance at following time points with increasing predictive power and decreasing variability across years, even more than healthy participants. Cross-lagged patterns (i.e., each variable predicting other variables at the following occasion) decreased from the first (M = 0.068; 95% CI [0.054; 0.082]) to the second year (M = 0.045; 95% CI [0.037; 0.054]), showing higher predictive patterns than the HP in the first year, and then coming back to a similar level. We found cross-lagged patterns within and between cognitive domains (Figure 2, upper panel). Bootstrap analysis revealed even more stable results than the HP group (see Supplemental Figure 3). Looking at the cross-lagged in-prediction (i.e., the extent to which each variable is predicted by other variables, excluding auto-regressive patterns), the subtests of the Logical Memory Test were the most predictable scores in the first (delayed recall = 0.268) and the second year (immediate recall = 0.095). Interestingly, the delayed recall of the RAVL test showed the highest predictive power (i.e., cross-lagged out-prediction) in the first year (0.034), and the delayed recall of the Logical Memory Test showed the highest predictive power in the second year (0.009; see Figure 2, lower panel). Cross-lagged predictions are presented in Supplemental Table 6.

MCI non-converter network and prediction. The upper panel shows the longitudinal networks: the left network shows the longitudinal prediction from the baseline assessment to the 12 months’ assessment (i.e., T1); the right network shows the longitudinal prediction from the 12 months’ assessment to the 24 months’ assessment (i.e., T2). Red edges indicate negative relations; green edges show positive ones. The edges’ size and color saturation represent the relationships’ intensity. Autoregressive patterns are shown as edges starting from a node and ending at the same node. For example, the MMSE has positive autoregressive patterns in both years, meaning that higher MMSE scores at the baseline are associated with higher MMSE scores at 12 months, and higher MMSE scores at 12 months are associated with higher MMSE scores at 24 months. Cross-lagged patterns are depicted as edges starting from a node and ending at another node. For example, the RAVLd positively predicts the LMemI in the first year, meaning that higher RAVLd scores at the baseline are associated with higher LMemI scores at 12 months. The nodes’ colors represent the cognitive domains (nodes with the same color belong to the same cognitive domain). The lower panel shows the cross-lagged in- and out-prediction (i.e., the extent to which each variable is predicted by or predicts other variables, excluding auto-regressive patterns) and their reliability. Green lines represent the fitted prediction, red lines represent bootstrapped predictions: the more these predictions are similar, the more the results are robust. Grey areas represent bootstrap CIs: the narrower the CIs, the more replicable the results. T1 = prediction from baseline (bl) to 12 months (m012); T2 = prediction from 12 months (m012) to 24 months (m024); BNT: Boston Naming Test; CDTc: Clock Drawing Test (copy); CDTd: Clock Drawing Test (draw); LMemI: Logical Memory Test–immediate recall; LMemD: Logical Memory Test–delayed recall; MMSE: Mini-Mental State Examination; RAVLr: Rey Auditory Verbal Learning Test-recognition; RAVLd: Rey Auditory Verbal Learning Test-delayed recall; SemF: Semantic Fluency test (animal); TMTa: Trail making Test–a; TMTb: Trail making Test–b. The reader is referred to the web version of this paper for the color representation of this figure.
MCI patients—converter group
The MCI converter networks showed a density index of 0.669 (95% CI [0.586; 0.753]) in both years (the full list of weights is reported in Supplemental Table 4), although an unconstrained model was the best one. Almost all tests showed autoregressive patterns in both years (i.e., each variable predicting itself at the following occasion), with slightly higher mean weight in the first year (M = 0.520; 95% CI [0.361; 0.680]) than in the second year (M = 0.490; 95% CI [0.375; 0.606]), suggesting that subjects with high performance at the baseline tend to maintain high performance at the following time point with decreasing predictive power and variability across years. Cross-lagged patterns (i.e., each variable predicting other variables at the following occasion) were similar across years (first year M = 0.069; 95% CI [0.054; 0.084]; second year M = 0.069; 95% CI [0.054; 0.084]) but higher than in the HP group. We found cross-lagged patterns within and between cognitive domains (Figure 3, upper panel). Bootstrap analysis revealed less stable results than the HP group, likely due to the lower sample size (see Supplemental Figure 4). Looking at the cross-lagged in-prediction (i.e., the extent to which each variable is predicted by other variables, excluding auto-regressive patterns), the immediate recall of the Logical Memory Test is the most predictable test both in the first (0.280) and the second year (0.297). Notably, the delayed recall of the RAVL test showed the highest predictive power (first year cross-lagged out-prediction = 0.020; second year cross-lagged out-prediction = 0.019; see Figure 3, lower panel). Cross-lagged predictions are presented in the Supplemental Table 7.

MCI converter network and prediction. The upper panel shows the longitudinal networks: the left network shows the longitudinal prediction from the baseline assessment to the 12 months’ assessment (i.e., T1); the right network shows the longitudinal prediction from the 12 months’ assessment to the 24 months’ assessment (i.e., T2). Red edges indicate negative relations; green edges show positive ones. The edges’ size and color saturation represent the relationships’ intensity. Autoregressive patterns are shown as edges starting from a node and ending at the same node. For example, the MMSE has positive autoregressive patterns in both years, meaning that higher MMSE scores at the baseline are associated with higher MMSE scores at 12 months, and higher MMSE scores at 12 months are associated with higher MMSE scores at 24 months. Cross-lagged patterns are depicted as edges starting from a node and ending at another node. For example, the TMTb negatively predicts the MMSE in the first year, meaning that higher TMTb scores at the baseline are associated with lower MMSE scores at 12 months. The nodes’ colors represent the cognitive domains (nodes with the same color belong to the same cognitive domain). The lower panel shows the cross-lagged in- and out-prediction (i.e., the extent to which each variable is predicted by or predicts other variables, excluding auto-regressive patterns) and their reliability. Green lines represent the fitted prediction, red lines represent bootstrapped predictions: the more these predictions are similar, the more the results are robust. Grey areas represent bootstrap CIs: the narrower the CIs, the more replicable the results. T1 = prediction from baseline (bl) to 12 months (m012); T2 = prediction from 12 months (m012) to 24 months (m024); BNT: Boston Naming Test; CDTc: Clock Drawing Test (copy); CDTd: Clock Drawing Test (draw); LMemI: Logical Memory Test–immediate recall; LMemD: Logical Memory Test–delayed recall; MMSE: Mini-Mental State Examination; RAVLr: Rey Auditory Verbal Learning Test-recognition; RAVLd: Rey Auditory Verbal Learning Test-delayed recall; SemF: Semantic Fluency test (animal); TMTa: Trail making Test–a; TMTb: Trail making Test–b. The reader is referred to the web version of this paper for the color representation of this figure.
Discussion
MCI is characterized by a cognitive impairment that does not affect a person's basic activities of daily living.32,33 These patients progress to dementia at a rate of approximately 12% per year, 3 making prognostic information of pivotal importance. Prevention and early detection of dementia is one of the challenges in older adult healthcare. Indeed, the early detection of dementia is crucial to receiving support and the treatment options available. 6 To this end, a promising approach is to study the longitudinal evolution of MCI patients who do or do not progress to AD. In the present paper, we aimed to do so from a NA perspective.
Previous studies adopting NA showed a reorganization of the relationships among neurocognitive variables in MCI patients8,14 as compared with healthy subjects and AD patients. However, those results emerged from cross-sectional studies, lacking evidence about longitudinal patterns, and did not distinguish between stable and converter MCI. Here, we used CLPN models to investigate the progression of cognitive performance and its relationships on different measurement occasions. 15 CLPN models the relations between a variable at occasion t and another variable at the following occasion (t + 1) while controlling for all other variables at occasion t. The resulting network represents variables as nodes and regression parameters between measurement occasions as edges between them. Importantly, different effects across time points are permitted, thus showing changes in the associations between variables across time.
Data used to prepare this article were obtained from the ADNI database (adni.loni.usc.edu). We extracted three cognitive evaluations of two groups of MCI patients who will convert to AD or not, and a group of healthy participants as a reference group. The groups differed in years of education and sex distribution, with lower education and a higher prevalence of males in the clinical groups as compared to the HP.
From the literature, we know that MCI patients’ cognitive performances tend to fall midway between normal ageing and mild AD.3,14 Indeed, most of the cognitive tests that we considered showed a significant interaction between group and time. Specifically, healthy participants scored higher on every test, and MCI performance decreased the most over time. The follow-up analysis considering the MCI groups only showed that future converters’ memory functions were generally more compromised and revealed a stronger worsening over time. While this profile is interesting, it also has limitations. It indeed highlights the differences between the two MCI groups in each specific test. This paper focuses on a more nuanced and comprehensive vision of the changes in people. Specifically, we hypothesized that changes occur in the average performance at different tests and the relationships between cognitive performances over time. This approach conveys richer outcomes, unveiling new insights about the studied populations. In other words, what can CLPN models tell us more than the most traditional approaches?
All networks fit an unconstrained model, where path weights are allowed to vary across time points. This suggests that we have different cognitive trajectories over the considered time period (two years from the first visit), and the effect of time is not linear and equivalent over every function and every association. In other words, cognitive functions do not change at the same rate over time and are not coordinated with each other. Since healthy participants also showed different trajectories, we consider this aspect as a typical characteristic unrelated to any pathological process.
We found increasing autoregressive patterns over time in the HP group. This means that each test's predictive effect on the same test at the following time point grows from the first to the second year of evaluation. This change can be considered the typical evolution of cognitive functioning in older adults. Notably, the same trend emerged in the stable MCI group, which was composed of subjects with MCI who would not evolve into AD within the time they were involved in the study. The stable MCI group and the HP group have the stability of their cognitive status in common, which will not worsen in the following years. Thus, we can conclude that stable cognitive status over time is characterized by an increase in autoregressive patterns, at least in the period we considered. It is worth noting that the stable MCI group showed higher autoregressive power and an even stronger increase, as if the MCI reduced the variability within cognitive functions over time. Crucially, this is not the case for the converter MCI group. These participants received an MCI diagnosis on the first visit, which was confirmed in the following two years (i.e., the time period we considered), but they will end up converting to AD in the next years (i.e., between 3 and 12). In this group, we found an opposite autoregressive pattern, with decreasing prediction from the first to the second year. While we already knew that future converters’ memory functions revealed a higher worsening over time than the non-converter group, the CLPN model revealed that test performance in future converters became less correlated over time. This result also suggests that neuropsychological evaluations at a given time point are poorly informative on the future performance of a converter, because within-measure predictability is lower as compared to healthy elderly and non-converters. Moreover, in both MCI groups, the variability between autoregressive coefficients decreased over time, contrary to what we observed in healthy participants. This result suggests that, parallel to the development of the pathology, there is a reduction in the variability of the strength with which cognitive performance predicts itself. This perspective aligns with recent advancements in neuropsychological research that emphasize the importance of assessing cognitive fluctuations, also known as intra-individual variability, in cognitive performance.34–38 Traditionally, neuropsychological assessments have treated cognition as a stable trait; however, growing evidence suggests that moment-to-moment variability plays a critical role in influencing real-world behavior. 39 Standard testing protocols often overlook subtle but meaningful changes in cognitive function because they fail to capture cognitive fluctuations.37,38 Intra-individual variability has emerged as a valuable marker of cognitive health, with the potential to differentiate between normal and pathological cognitive aging. 36 Methods such as ecological momentary assessment have demonstrated strong within- and between-person reliability, as well as construct validity, and have successfully distinguished individuals with MCI from cognitively healthy individuals. 35 Additionally, increased variability across repeated cognitive assessments has been linked to preclinical AD risk, beyond average performance declines alone. 34 Collectively, these findings support the development of updated neuropsychological protocols that incorporate intra-individual variability as a core component of cognitive assessment.
A third interesting point is related to the cross-lagged regressive patterns assessing the relationship between different cognitive functions over time. Again, we can consider the HP group as a reference for the typical cognitive evolution in older adults. Our results showed that cross-lagged patterns were, on average, similar between the first and the second year, suggesting that the overall organization between cognitive functions over time remains relatively stable in healthy people. In the MCI non-converter group, cross-lagged patterns were higher in the first year but came back to levels similar to the HP group in the second year, meaning that the neuropsychological evaluation during which the MCI diagnosis was made had greater predictive power over the following time point (i.e., baseline over the 12th month) than an evaluation done in a stable period, during which no diagnostic changes occurred (i.e., 12th month over the 24th month). The MCI converter group supported this hypothesis, showing consistently high cross-lagged patterns throughout the study period, like the MCI non-converter group in the first year. Here, the first year immediately follows the MCI diagnosis, but we know that cognitive functions are worsening, and this worsening will bring to the AD diagnosis. These results suggest that stronger predictive patterns between tests are associated with worsening cognitive performance. The highest predictive patterns in clinical groups confirmed previous studies showing a higher density of connections in clinical groups as compared with healthy subjects.9,14 While the presence of defined communities of neuropsychological tests suggests that each cognitive test specifically captures a cognitive function, 9 a higher density of connections may reflect the massive recruitment of non-specific and general cognitive processes to solve a single task. Previous studies showed that cognitive impairment not only reduces the performance of cognitive functions but also alters the balance among them,8,9,13,14 suggesting a reorganization of the cognitive abilities of patients, which has also been confirmed by neuroimaging studies.40,41 To this picture, we can now add a substantial alteration of the longitudinal relationship between cognitive performances. Cognitive worsening seems to imply a low predictive power of autoregressive patterns but strong cross-lagged predictions.
The relationship between cognitive performances has been studied in recent years, from a different perspective. A growing body of work focuses on the concept of cognitive dispersion, which reflects the variability in performance across multiple cognitive measures within a single time point.42,43 This literature proposes that increased intraindividual variability may reflect decreased neurological integrity44,45 and cortical disconnection syndrome in AD.46,47 It is important to note that cognitive dispersion focuses on the variability across cognitive measures within a single time point, whereas CLPN informs us about the correlation between cognitive measures across time. Cross-lagged predictions, as well as correlations between contemporaneous tests, can be thought of as complementary information to cognitive dispersion since they focus on different aspects of cognition. Previous works found that cognitive impairment is associated with increased dispersion 48 and a higher density of connections between cognitive performances. Here, we showed that stronger predictive patterns between tests are associated with worsening cognitive performance. Taking together these results, we suggest that cognitive impairment is associated with a high variability (i.e., cognitive dispersion) and a high longitudinal relationship across neuropsychological performance. It is important to note that these results are not in contradiction, since means and correlations convey different information. From a neuropsychological perspective, we can interpret stronger longitudinal relations as an effect of cognitive impairment. The pathological process influences the evolution of cognitive performances, enhancing the longitudinal relationship between them. Similarly, it is possible that differences in network dynamics may reflect latent baseline differences, which in turn depend on the pathological process. Future studies will deepen the understanding of the causes of differences in network dynamics. The present work did not aim to anticipate conversion based on network dynamics. On the contrary, we wanted to shift the focus from baseline differences to the temporal dynamics of cognitive organization, looking at possible differences based on the conversion profile.
It is important to note that the bootstrap results showed less stability for the MCI converter group. This may be due, in part, to the smaller sample size in this group, which would have made the prediction more unstable. However, another plausible explanation lies in the heterogeneous nature of MCI individuals who eventually progress to AD. Firstly, the timing of conversion varies across subjects, meaning they may be at different stages of the disease. Secondly, these individuals may follow diverse patterns of cognitive decline, which could contribute to the observed instability in longitudinal cognitive organization.
The last information we can extract from the present study is that memory performances are well predicted from the precedent cognitive evaluation. Moreover, they emerged to be the best predictive choice in the MCI groups. The delayed recall of memory tests always showed the highest predictive power over time. Coherently, memory is considered the most reliable single-domain predictor of future cognitive status in MCI and preclinical AD, across diverse study designs, populations, and follow-up durations.49–51 Also, previous network studies revealed that AD patients’ network shows a unique feature of isolating memory function from the rest of the cognitive domains.8,9,14 This was not the case for the healthy participants, where, instead of memory, executive functions showed the highest predictive power. Although verbal memory has been reported as a reliable predictor of future cognitive decline in healthy older adults,52,53 executive functions are increasingly recognized as important indicators of future cognitive and functional status in healthy elderly individuals.54,55 This result confirms previous findings about the centrality of executive functions, which are assumed to regulate other cognitive functions. 56 Noteworthy, most of the studies assessing the predictive value of cognitive functions aim to predict cognitive impairment, functional decline, or conversion to MCI.52–55 On the contrary, our study took into consideration healthy participants with a stable cognitive profile. To sum up, executive functions result as the best choice to predict the future global cognitive status of a healthy subject; however, in a dementia-like state, long-term memory tests overtake executive functions and can inform about future cognitive performances.
This study tackles the challenging task of assessing the evolution of the relationships between cognitive performances in healthy individuals and people with cognitive impairments. While previous attempts did it at a cross-sectional level, we here exploited the power of longitudinal data in a network approach for the first time. Previous studies tracked the longitudinal performance on specific tests (i.e., MMSE and Montreal Cognitive Assessment) and proposed statistical models for determining whether patients show abnormal performance on longitudinal measurements.57–59 The plus of using network analysis is the focus on the relationships between tests, thus adopting a comprehensive point of view.
Despite the novelty and the potential of this approach, some limitations must be pointed out. The different sample sizes between groups, with the convMCI group having a smaller sample size than the other groups can be an issue, especially for the stability estimation of the edges. Moreover, these individuals will convert to AD at different time points, and we could not account for the different times of conversion. Nonetheless, the sample remains relatively large and representative. We were indeed able to compare three relatively large groups of people with stable cognitive evaluations across three years. We were even in the position to distinguish between MCI patients who will do or do not convert to AD, offering a privileged point of view over the prediction of a future cognitive worsening.
This sophisticated statistical approach applied to relatively large sample sizes, was impactful unveiling new insights into the complexity of cognitive functioning and its longitudinal reorganization in people with cognitive impairments. The present paper adds some important pieces of knowledge to the literature: (i) a stable cognitive status over time is characterized by an increase in autoregressive patterns, while cognitive functions in future converters became less correlated over time; (ii) higher predictive longitudinal patterns between cognitive functions accompany cognitive performance worsening in people with MCI, (iii) while executive functions are the best predictors of healthy subjects’ future global cognitive status, in a dementia-like state, long-term memory tests overtake executive functions and can inform about future cognitive performances.
Supplemental Material
sj-docx-1-alz-10.1177_13872877261423962 - Supplemental material for Divergent network trajectories in mild cognitive impairment: Converters versus non-converters to Alzheimer's disease
Supplemental material, sj-docx-1-alz-10.1177_13872877261423962 for Divergent network trajectories in mild cognitive impairment: Converters versus non-converters to Alzheimer's disease by Daniele Romano, Giorgia Tosi and in Journal of Alzheimer's Disease
Footnotes
Acknowledgements
Data collection and sharing for this project was funded by the Alzheimer's Disease Neuroimaging Initiative (ADNI) (National Institutes of Health Grant U01 AG024904) and DOD ADNI (Department of Defense award number W81XWH-12-2-0012). ADNI is funded by the National Institute on Aging, the National Institute of Biomedical Imaging and Bioengineering, and through generous contributions from the following: AbbVie, Alzheimer's Association; Alzheimer's Drug Discovery Foundation; Araclon Biotech; BioClinica, Inc.; Biogen; Bristol-Myers Squibb Company; CereSpir, Inc.; Cogstate; Eisai Inc.; Elan Pharmaceuticals, Inc.; Eli Lilly and Company; EuroImmun; F. Hoffmann-La Roche Ltd and its affiliated company Genentech, Inc.; Fujirebio; GE Healthcare; IXICO Ltd; Janssen Alzheimer Immunotherapy Research & Development, LLC.; Johnson & Johnson Pharmaceutical Research & Development LLC.; Lumosity; Lundbeck; Merck & Co., Inc.; Meso Scale Diagnostics, LLC.; NeuroRx Research; Neurotrack Technologies; Novartis Pharmaceuticals Corporation; Pfizer Inc.; Piramal Imaging; Servier; Takeda Pharmaceutical Company; and Transition Therapeutics. The Canadian Institutes of Health Research is providing funds to support ADNI clinical sites in Canada. Private sector contributions are facilitated by the Foundation for the National Institutes of Health (![]() ). The grantee organization is the Northern California Institute for Research and Education, and the study is coordinated by the Alzheimer's Therapeutic Research Institute at the University of Southern California. ADNI data are disseminated by the Laboratory for Neuro Imaging at the University of Southern California.
). The grantee organization is the Northern California Institute for Research and Education, and the study is coordinated by the Alzheimer's Therapeutic Research Institute at the University of Southern California. ADNI data are disseminated by the Laboratory for Neuro Imaging at the University of Southern California.
Ethical considerations
The current study utilized de-identified archival data from ADNI; therefore, it was exempt from human subjects’ review by our institutional ethics committee.
Ethical approval was obtained by the ADNI investigators. The ADNI study was conducted according to Good Clinical Practice guidelines, the Declaration of Helsinki, US 21CFR Part 50—Protection of Human Subjects, and Part 56—Institutional Review Boards, and pursuant to state and federal HIPAA regulations.
Consent to participate
Written informed consent for the study was obtained from all subjects and/or authorized representatives and study partners before protocol-specific procedures were carried out.
Consent for publication
Not applicable
Author contribution(s)
Funding
The authors disclosed receipt of the following financial support for the research, authorship, and/or publication of this article: This paper was developed within the project funded by Next Generation EU—“Age-It—Ageing well in an ageing society” project (grant number PE0000015), National Recovery and Resilience Plan (NRRP)—PE8—Mission 4, C2, Intervention 1.3”. The views and opinions expressed are only those of the authors and do not necessarily reflect those of the European Union or the European Commission. Neither the European Union nor the European Commission can be held responsible for them. Alzheimer's Disease Neuroimaging Initiative, DoD Alzheimer's Disease Neuroimaging Initiative, (grant number U01 AG024904, W81XWH-12-2-0012).
Declaration of conflicting interests
The authors declared no potential conflicts of interest with respect to the research, authorship, and/or publication of this article.
Data availability statement
Supplemental material
Supplemental material for this article is available online.
References
Supplementary Material
Please find the following supplemental material available below.
For Open Access articles published under a Creative Commons License, all supplemental material carries the same license as the article it is associated with.
For non-Open Access articles published, all supplemental material carries a non-exclusive license, and permission requests for re-use of supplemental material or any part of supplemental material shall be sent directly to the copyright owner as specified in the copyright notice associated with the article.