
Abstract
Background
Alzheimer's disease (AD) affects 55 million people worldwide, projected to reach 139 million by 2050; yet, most machine learning (ML)-based AD classifiers have been developed in Non-Hispanic White (NHW) cohorts, limiting generalizability.
Objective
Assess ethnic differences in AD prediction using classification performance and feature importance derived from multimodal neuroimaging biomarkers across African American (AA), Hispanic, and NHW participants.
Methods
Support vector machine classifiers were applied to multimodal neuroimaging data from a multi-ethnic cohort, incorporating structural magnetic resonance imaging measures, diffusion tensor imaging metrics, and positron emission tomography-based amyloid and tau measures. Models classified cognitively unimpaired (CU) versus cognitively impaired (CI) individuals and mild cognitive impairment (MCI) versus AD dementia, with and without adjustment for age, sex, and education.
Results
Classification performance varied by ethnicity and disease stage. NHW participants showed the strongest overall performance, particularly for CU versus CI, while Hispanic participants demonstrated high sensitivity and balanced performance for MCI versus AD. AA participants exhibited lower AUC and accuracy across tasks but maintained high negative predictive value. Demographic adjustment improved performance primarily for AA and NHW participants. Feature importance analyses revealed shared and population-specific patterns: tau positron emission tomography (PET) measures, especially posterior cingulate and lateral parietal standardized uptake value ratios, consistently ranked highest for CU versus CI across groups, whereas MCI versus AD classification diverged, with amyloid PET predominating in AA participants, tau PET in NHW participants, and mixed medial temporal atrophy and white matter signatures in Hispanics.
Conclusions
Shared early AD neuroimaging signatures exist across ethnic groups, but biomarker importance diverges at later disease stages, underscoring the need for ethnicity-aware ML models to improve prediction and equitable clinical translation.
Keywords
Introduction
Alzheimer's disease (AD) is the most prevalent neurodegenerative disorder, affecting an estimated 6.7 million Americans and nearly 55 million people worldwide, with projections reaching 139 million by 2050.1–3 The socio-economic burden in the United States is substantial, with costs estimated at $321 billion in 2022, including $271 billion in unpaid caregiving. 2 Early detection and intervention are critical to mitigate cognitive decline and the broader societal impact of AD. 4
AD selectively targets brain regions essential for memory and cognition, including the hippocampus, entorhinal cortex, and medial temporal lobes, leading to hallmark deficits in episodic memory, spatial navigation, and language.5–9 Progressive neurodegeneration is accompanied by molecular pathology, notably amyloid-β and tau accumulation, which can be measured in vivo using positron emission tomography (PET) imaging, as well as structural and microstructural changes detectable via magnetic resonance imaging (MRI) and diffusion tensor imaging (DTI).
Machine learning algorithms, such as support vector machine (SVM), 10 show significant potential for predicting and diagnosing AD at early stages, when therapeutic interventions may be most effective. SVM is a supervised learning technique that constructs an optimal hyperplane in a high-dimensional space to maximize the margin between different classes.11–13 By leveraging large neuroimaging datasets, the algorithm can uncover subtle patterns indicative of underlying AD pathology. These models offer the advantage of highlighting pathological differences in AD across ethnic groups. SVM models have notable limitations, including limited interpretability, high complexity, sensitivity to noisy outliers, and dependence on a well-curated training dataset.14–16 Integrating machine learning-based prediction models into clinical practice can assist physicians in early detection, prognosis, and personalized treatment planning for patients at risk of developing AD. This is why transparency and interpretability of machine learning models are necessary for understanding and gaining trust from clinicians and patients.16–18 Visualizing the decision-making process of predictive models, such as feature importance plots and decision trees, enhances understanding and facilitates collaboration between machine learning experts and healthcare professionals. 19 AD exerts a profound impact on individuals, families, and societies globally, underscoring the urgent need for innovative approaches to classification, diagnosis, and management. Leveraging machine learning techniques, particularly the SVM algorithm, offers promising avenues for early detection and personalized intervention in AD. Therefore, ensuring transparency and visualization of predictive models is paramount for their successful integration into clinical practice and improving patient outcomes.
The historical focus on Western populations in AD research has created significant knowledge gaps in understanding how the disease manifests in different ethnic groups. In this study, ethnicity is defined by self-identification as African American (AA), Hispanic, and Non-Hispanic White (NHW), recognizing that these categories are social constructs influenced by cultural, historical, and societal factors, rather than strictly genetic or biological groupings. By studying diverse populations, particularly through initiatives like the Health and Aging Brain Study–Health Disparities (HABS-HD),20–24 researchers can better understand how AD's presentation, risk factors, and progression might vary across different ethnic backgrounds. Genetic variations and environmental factors specific to different ethnic groups can significantly influence how AD develops and progresses. These differences could affect everything from initial disease onset to symptom presentation and treatment response. Furthermore, understanding ethnic differences in AD is crucial for developing more effective, culturally appropriate diagnostic tools and treatment approaches. What works well for one ethnic group may not be as effective for another, making this understanding essential for providing optimal patient care. Studies indicate that biomarker profiles, clinical presentation, and eligibility for clinical trials can differ across ethnic groups, with underrepresentation of AA and Hispanic participants in many studies. 25 These disparities underscore the importance of investigating ethnic differences in neuroimaging biomarkers and predictive model performance to inform culturally appropriate, equitable approaches to early detection and intervention. 25
This study aims to systematically characterize ethnic differences in AD prediction by jointly examining classification performance and model-derived feature importance of multimodal neuroimaging biomarkers, including structural MRI, DTI, and PET measures, across AA, Hispanic, and NHW participants in the Health and Aging Brain Study–Health Disparities (HABS-HD) dataset.20–24 Using SVM models, we evaluate disease discrimination at both early [cognitively unimpaired (CU) versus cognitively impaired (CI)] and late [mild cognitive impairment (MCI) versus AD] stages under demographic covariate-adjusted and unadjusted modeling frameworks. Our goals are threefold: (1) to assess whether predictive performance and feature ranking differs across ethnic groups and disease stages; (2) to identify shared and population-specific neuroimaging biomarkers by comparing feature ranking patterns derived from multimodal MRI, DTI, and PET measures; and (3) to determine how covariate adjustment for age, sex, and education influences both model performance and feature ranking. By integrating transparent, visualization-based model interpretability with rigorous performance evaluation, this study seeks to clarify how machine learning models leverage distinct neurobiological signals across populations, thereby informing equitable and clinically meaningful AD prediction.
Methods
Participants and variables
Our study used data from the HABS-HD, a longitudinal cohort designed to investigate cognitive aging and AD-related biomarkers with an emphasis on health disparities. Participants were classified as CU or CI, with the CI group including individuals diagnosed with MCI or AD. HABS-HD includes deeply phenotyped participants with comprehensive clinical, neuropsychological, sociodemographic, and biomarker assessments. Detailed information on the study design, recruitment procedures, data collection protocols, and participant characteristics has been previously published and is available in the HABS-HD methods paper. 26 All participants in this study underwent neuropsychological testing, clinical labs, blood draws, and neuroimaging. Neuropsychological assessment included measures of global cognitive functioning, attention, executive function, memory, motor function, and language. Neuroimaging included MRI and PET scans that enabled measurements of hyperintensity, thickness, and volume within different regions of the brain.
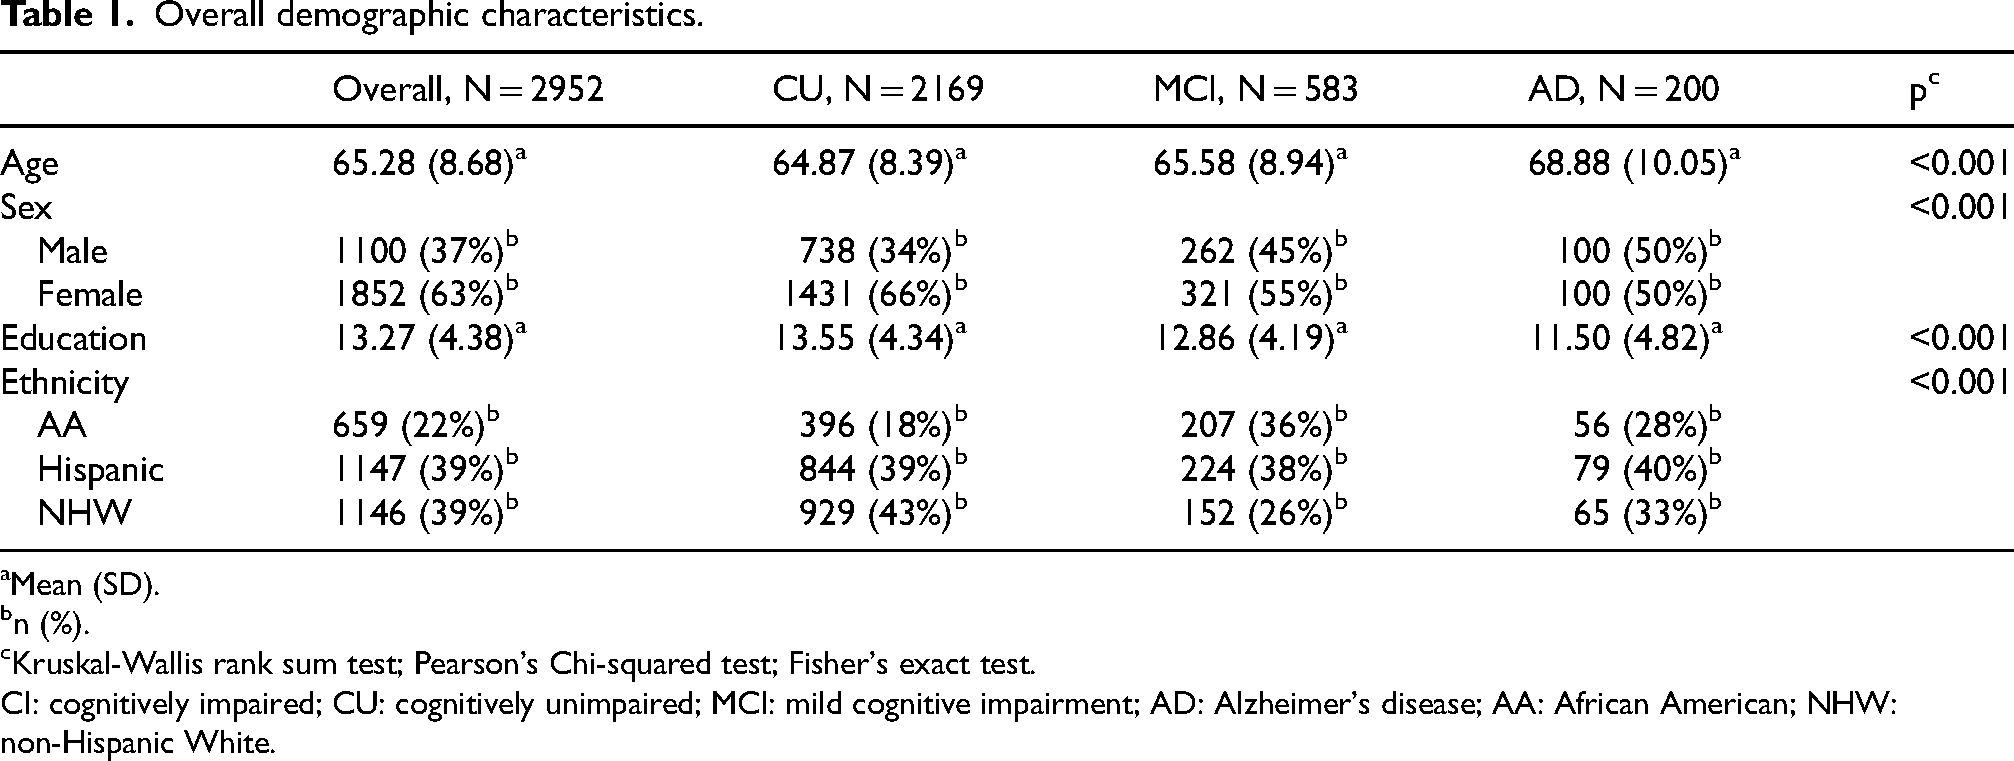
For the present analytical study, we included 2952 participants (1100 males and 1852 females, Table 1). Participants self-identified as AA, Hispanic, or NHW. Diagnoses were assigned using an algorithmic decision tree and subsequently verified through a consensus review process that incorporated self- and informant-reported information on cognitive functioning and performance on standardized neuropsychological assessments; neuroimaging data were not considered in the diagnostic classification. 27 This process resulted in three broad categories: (1) CU, defined by the absence of cognitive complaints, a Clinical Dementia Rating (CDR) Sum of Boxes (SOB) score of 0, and neuropsychological test scores within normative ranges. Participants with a single test score ≤1.5 standard deviations (SD) below age- and education-adjusted norms, but otherwise meeting CU criteria, were also included in this category. (2) MCI was characterized by subjective or informant-reported cognitive complaints, a CDR SOB score between 0.5 and 2.0, and at least one test score falling ≤1.5 SD below normative expectations. (3) AD was diagnosed in individuals with cognitive complaints, a CDR SOB score of 2.5 or greater, and performance on two or more cognitive tests falling at or below 2 SDs from the normative mean.22,28
Overall demographic characteristics.
Mean (SD).
n (%).
Kruskal-Wallis rank sum test; Pearson's Chi-squared test; Fisher's exact test.
CI: cognitively impaired; CU: cognitively unimpaired; MCI: mild cognitive impairment; AD: Alzheimer's disease; AA: African American; NHW: non-Hispanic White.
Neuroimaging acquisition and processing
PET imaging protocol
The radiotracers and acquisition protocols for PET imaging in our study follow those ADNI3 protocol. 29 Specifically: Amyloid PET imaging was performed using [18F]Florbetaben (FBB). Each participant received an intravenous injection of approximately 300 MBq (range: 280–320 MBq). Scanning commenced approximately 90 min post-injection and consisted of a 20-min acquisition (4 × 5-min frames). Tau PET Imaging was conducted using [18F]PI-2620. The administered dose was approximately 185 MBq (range: 166–204 MBq). Imaging began 30–75 min post-injection, consistent with ADNI protocols, with a scan duration of 30 min (6 × 5-min frames).
Complete processing pipeline
All PET data underwent a standardized preprocessing workflow following ADNI4 protocols. The processing pipeline included frame-to-frame motion assessment using rigid-body realignment with specific exclusion criteria for excessive motion (>3 mm translation or >3° rotation). Multiple frames were motion-corrected and averaged to create composite standardized uptake value ratio (SUVR) images, with 4 frames combined for amyloid PET and 6 frames for tau PET. Co-registration between PET and structural MRI data was performed using SPM12 software to ensure precise anatomical alignment for regional analysis.
Spatial normalization pipeline
All neuroimaging data underwent a comprehensive preprocessing pipeline including MRI co-registration, spatial normalization to MNI152 space, and quality control procedures. The preprocessing pipeline ensured standardized anatomical alignment across participants and ethnic groups prior to regional analysis.
ROI definition and regional selection
For both amyloid and tau PET, SUVRs were calculated using the cerebellum as a reference region. Region of interest (ROI) definitions were based on the Desikan-Killiany atlas 30 as implemented in FreeSurfer v7.0 31 to ensure consistency with the structural MRI analysis. All regions were defined using bilateral sampling with values averaged across hemispheres to create single composite scores per region.
PET scans utilized radiotracers to assess amyloid-β and tau protein aggregates across 4 regions for amyloid (frontal cortex, anterior and posterior cingulate cortex, lateral parietal cortex, and lateral temporal cortex) and 3 regions for tau (medial temporal lobe, posterior cingulate cortex, and lateral parietal cortex).
Structural MRI processing
T1-weighted MRI scans examined 34 brain regions in each hemisphere. The structural MRI data were processed using FreeSurfer v7.0 31 to extract cortical thickness and subcortical volume measures. Specifically, we extracted cortical thickness values from 68 bilateral regions (34 per hemisphere) based on the Desikan-Killiany atlas. 30 These regions included the superior frontal gyrus, middle temporal gyrus, entorhinal cortex, fusiform gyrus, banks of the superior temporal sulcus, and various parts of the cingulate cortex (caudal anterior, rostral anterior, isthmus, and posterior). Additionally, both lateral and medial aspects of the orbitofrontal cortex, the supramarginal gyrus, precuneus, insula, and several other key regions were considered. Bilateral average hippocampal volume was likewise extracted and normalized by intracranial volume (ICV). Raw white matter hyperintensity (WMH) volumes were normalized for head size by dividing by ICV to compute a WMH/ICV ratio. In addition, a MetaROI measure was computed as the bilateral average cortical thickness across a predefined set of AD–vulnerable regions, consistent with prior neuroimaging studies.
DTI
DTI is an advanced MRI technique used to examine neuronal tracts and white matter in the brain and assess its structural integrity. Complete DTI sequences were acquired with the following specifications: repetition time (TR) = 9000 ms, echo time (TE) = 88 ms, 64 diffusion-weighted directions with b-value = 1000 s/mm2, plus one b = 0 image. Spatial resolution was 2.0 × 2.0 × 2.0 mm3 isotropic voxels with 65 axial slices providing whole-brain coverage.
DTI preprocessing pipeline
All DTI data underwent comprehensive preprocessing using FSL's Diffusion Toolbox (FDT). The preprocessing pipeline included eddy current correction, motion correction, brain extraction using Brain Extraction Tool (BET), and susceptibility distortion correction. Quality control measures included specific exclusion criteria for excessive motion and artifacts, with visual inspection protocols applied to ensure data integrity before further analysis.
Atlas registration and tract definition
DTI metrics were extracted using step-by-step registration to the JHU ICBM-DTI-81 white matter labels atlas 32 via FNIRT nonlinear registration through the FMRIB58_FA template. Our study utilized DTI metrics, fractional anisotropy (FA), mean diffusivity (MD), axial diffusivity (DA), and radial diffusivity (RD), as biomarkers to measure white matter microstructure in 16 brain regions in each hemisphere. Measurements from the left and right hemispheres were analyzed separately to preserve potential hemispheric differences in white matter integrity. The tracts were categorized into three groups. Association fibers included the superior longitudinal fasciculus, inferior fronto-occipital fasciculus, superior fronto-occipital fasciculus, uncinate fasciculus, and the cingulum (encompassing both the cingulate gyrus and hippocampal portions). Projection fibers included the corticospinal tract, anterior and posterior limbs of the internal capsule, posterior thalamic radiation (including the optic radiation), and the anterior, superior, and posterior corona radiata. Commissural fibers encompassed the genu, body, and splenium of the corpus callosum.
Statistical analysis and machine learning approach
Our independent variables consisted of features derived from neuroimaging scans, including amyloid and tau PET, DTI, and structural MRI measures such as cortical thickness, hippocampus volume, WMH, and MetaROI, while the dependent variable was participants’ disease state, categorized as either CU versus CI or MCI versus AD. We began our analysis by preparing the dataset to ensure it was suitable for model training and evaluation. This preparation involved handling missing values, normalizing features, and encoding categorical variables as necessary. The final dataset consisted of neuroimaging features drawn from nine categories: Cortical Thickness, DTI–DA, DTI—FA, DTI—MD, DTI RD, PET—Amyloid (FBB SUVR), PET—Tau (PI2620 SUVR), Hippocampus Volume, WMH, and MetaROI. Cortical thickness features included bilateral average measurements from 34 anatomically defined cortical regions (68 unilateral regions) derived from T1-weighted MRI using FreeSurfer. Hippocampal volume was represented as the bilateral average of left and right hippocampi, ICV-adjusted. WMH burden was included as a global ICV-adjusted measure of WMH. DTI features consisted of bilateral average values for DA, FA, MD, and RD, each computed across 16 major white matter tracts per hemisphere. PET imaging features included bilateral average amyloid PET (FBB SUVR) values from four cortical regions and bilateral average tau PET ([18F]PI-2620 SUVR) values from three AD-relevant cortical regions. MetaROI was defined as the bilateral average of a predefined set of AD-vulnerable cortical regions, consistent with prior neuroimaging studies.
We performed missing data imputation using Predictive Mean Matching (PMM) within a Multiple Imputation (MI) framework, 33 as implemented in the mice package (version 3.18.0) in R (version 4.5.2). Five imputed datasets were generated to ensure stable estimates, and the final estimates were obtained by averaging across all five datasets. Supplemental Table 1 summarizes the percentage of missing data for each neuroimaging feature. A log transformation was applied to imaging variables to address feature scaling. Additionally, we included confounding variables such as age, gender, and education level. To analyze the data effectively, we stratified participants into three ethnic groups: AA, Hispanic, and NHW.
SHAP with SVM for feature importance
To explore neuroimaging feature importance and enhance interpretability, we applied a SVM model in conjunction with SHapley Additive exPlanations (SHAP).34,35 The SVM was configured with a radial basis function kernel to capture complex decision boundaries. 11 The SVM was trained to classify subjects based on neuroimaging data, and SHAP values were then calculated to interpret feature importance. SHAP assigns an importance score to each feature by evaluating its marginal contribution across all possible feature combinations,17,34,35 providing a detailed understanding of how individual neuroimaging features influence the model's classifications. This method offers a transparent view of the SVM's decision-making process and helps identify key neuroimaging biomarkers by highlighting the most influential features for AD classification.36,37 First, the SVM hyperparameters (cost and gamma) were tuned with an inner stratified 10-times repeated 5-fold cross-validation 38 and a grid search from the sklearn.svm library on the HABS-HD dataset.21–24 Then, the optimal parameter set from parameter tuning was used to train the SVM model utilizing the probability = True argument to enable probability estimates for SHAP interpretation, applying an outer same cross-validation procedure. For explaining the classifications of the SVM model, we utilized SHAP's Kernel Explainer, which is designed to interpret any model, including non-linear ones like SVMs.17,34,35 The explainer was initialized with the model's predicted probabilities and the training dataset. Subsequently, SHAP values were calculated for the test dataset, revealing the extent to which each feature influences the classifications for individual instances.34,35 With stratified 10 times repeated 5-fold cross-validation, the data were partitioned into training and testing sets, ensuring that class distributions were preserved within each fold. Feature importance was then summarized by taking the mean of the SHAP values across all folds and repetitions. We conducted all analyses separately for each ethnic group (AA, Hispanic, and NHW), evaluating both early-stage (CU versus CI) and late-stage (MCI versus AD) classifications under adjusted and unadjusted demographic covariate conditions.
Visualization of the importance of features across three ethnic groups
We utilized the ggsankey package (V 0.0.99999) in R to visualize the aggregated feature importance, creating a clear flow of the relationships between features and their contributions to model classifications across three ethnic groups: AA, Hispanic, and NHW. The computed SHAP values and average importance scores were transformed into a long format suitable for the ggsankey function, with the width of the connections indicating the magnitude of each feature's importance. This Sankey diagram provided an intuitive visualization of how different features influenced cognitive classifications across three ethnic groups, enhancing our understanding of the neuroimaging data in the context of AD.
Performance metrics and base rate adjustments
We evaluated model performance using several standard metrics to comprehensively assess classification outcomes:
Precision/positive predictive value (PPV): The proportion of positive predictions that are true positives, reflecting the model's ability to correctly identify positive cases.
Accuracy: The overall proportion of correctly classified instances (both positive and negative) among all samples.
Sensitivity (Recall): The proportion of actual positive cases that were correctly identified by the model, measuring the ability to detect positive instances.
Specificity: The proportion of actual negative cases that were correctly identified, indicating the model's ability to exclude negative instances.
Negative predictive value (NPV): The proportion of negative predictions that are true negatives, representing the likelihood that a negative prediction is accurate.
Area under the receiver operating characteristic curve (AUC): A summary measure that captures the trade-off between sensitivity and specificity across varying thresholds, providing an overall assessment of discriminatory performance.
PPV at 12% base rate (PPV12): The probability that a positive test result is truly positive when the prevalence of the condition in the population (base rate) is 12%.
NPV at 12% base rate (NPV12): The probability that a negative test result is truly negative when the prevalence of the condition in the population (base rate) is 12%.
Results
Participant characteristics
Overall participant demographic characteristics are summarized in Table 1, with additional pairwise comparisons presented in Supplemental Table 2 (CU versus CI) and Supplemental Table 3 (MCI versus AD). The total sample included 2952 individuals, comprising CU (n = 2169), MCI (n = 583), and AD (n = 200) participants. Significant differences were observed across CU, MCI, and AD groups for age, sex, education, and ethnicity (all p < 0.001). Mean age increased with diagnostic severity, with AD participants being older than both MCI and CU participants. Consistent with this pattern, CI participants were significantly older than CU participants (66.42 versus 64.87 years; p < 0.001), and within the CI group, AD participants were older than those with MCI (68.88 versus 65.58 years; p < 0.001). Educational attainment differed significantly by cognitive status and declined with increasing impairment. CU participants had the highest mean years of education, followed by MCI and AD participants. These differences were confirmed in pairwise analyses, with CI participants having fewer years of education than CU participants (p < 0.001) and AD participants having lower educational attainment than MCI participants (p < 0.001). Sex distribution varied significantly between CU and CI groups, with males representing a greater proportion of the CI group than the CU group (46% versus 34%; p < 0.001). In contrast, sex distribution did not differ significantly between MCI and AD groups (p = 0.22). Ethnic composition differed significantly between CU and CI groups (p < 0.001). AA participants comprised a larger proportion of the CI group than the CU group (34% versus 18%), whereas NHW participants were more prevalent in the CU group (43% versus 28%). Hispanic participants represented a similar proportion across CU and CI groups (39%). Within the CI subgroup, ethnic distributions did not differ significantly between MCI and AD participants (p = 0.092).
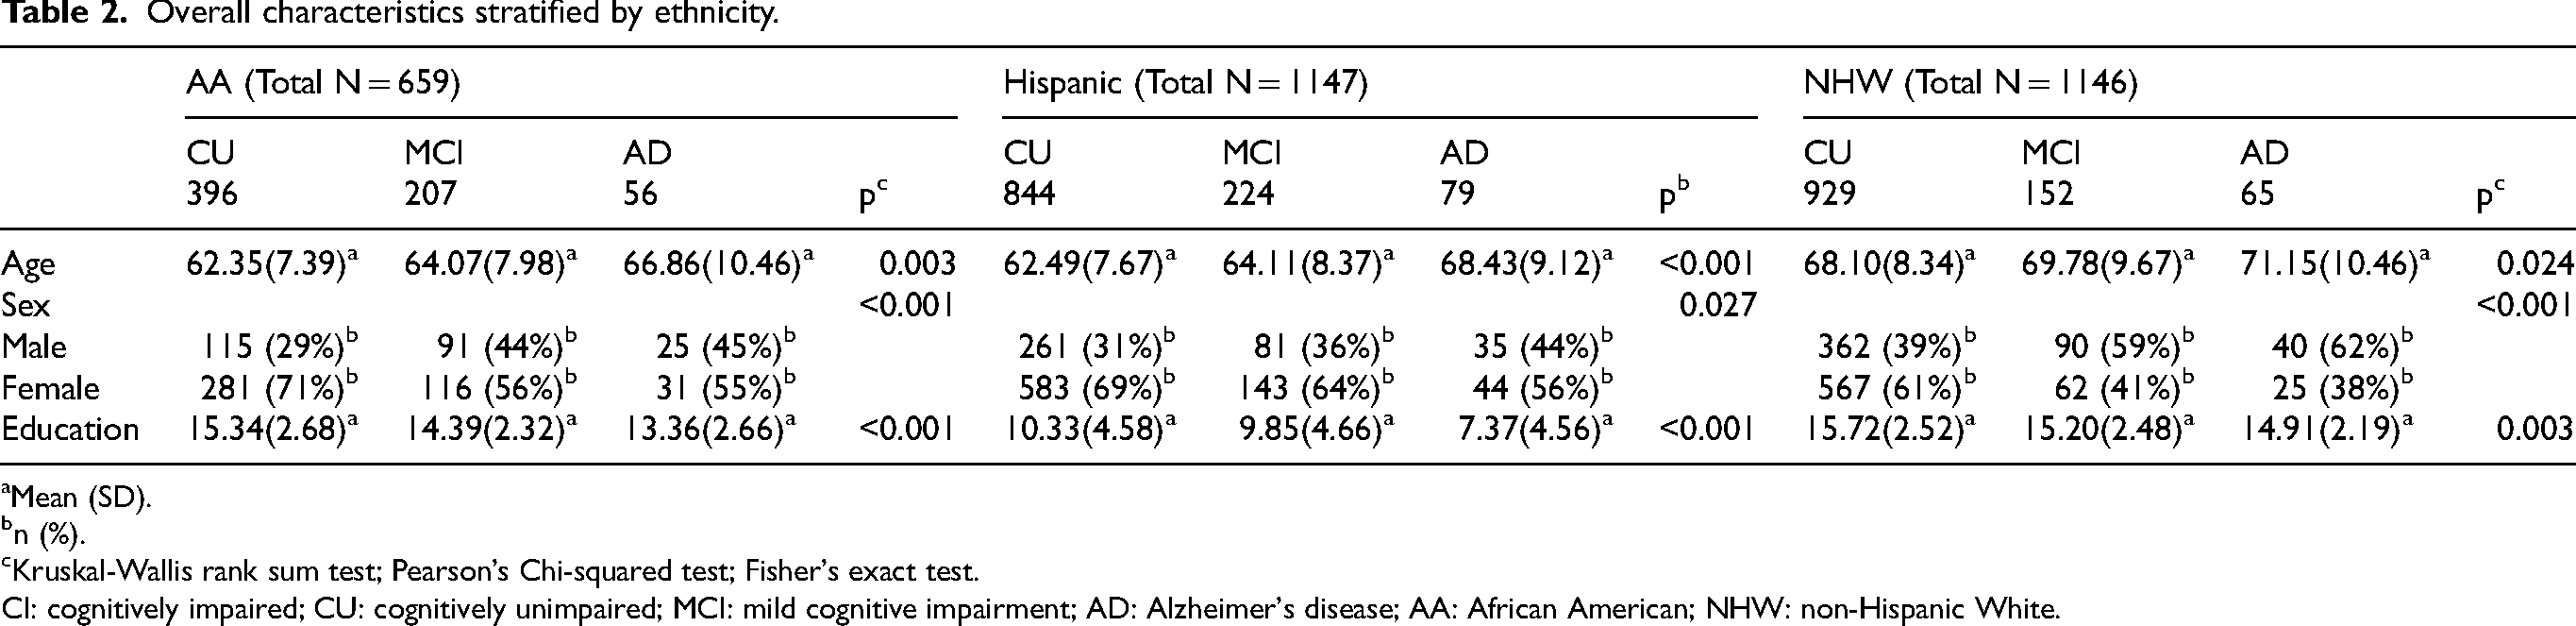
Ethnicity-stratified demographic characteristics are presented in Table 2 and Supplemental Tables 4 and 5, examining differences across cognitive status within AA, Hispanic, and NHW participants. Analyses were conducted for three diagnostic contrasts: CU versus MCI versus AD (Table 2), CU versus CI (Supplemental Table 4), and MCI versus AD (Supplemental Table 5). Across all ethnic groups, age increased with cognitive impairment severity. In the overall comparison (CU versus MCI versus AD), age differed significantly within AA, Hispanic, and NHW participants, with AD individuals being the oldest in each group. When diagnoses were collapsed (CU versus CI), CI participants were significantly older than CU participants across all ethnicities. Within the CI subgroup, age differences between MCI and AD were modest and reached statistical significance only among Hispanic participants. Educational attainment differed significantly by cognitive status within each ethnic group. In the overall comparison, education declined with increasing impairment across all ethnicities, although absolute education levels varied substantially, with Hispanic participants having the lowest and NHW participants the highest mean years of education. Consistent patterns were observed in the CU versus CI comparison, where CI participants had significantly fewer years of education than CU participants within all three ethnic groups. In the MCI versus AD comparison, education was significantly lower in AD than MCI among AA and Hispanic participants, whereas no difference was observed among NHW participants. Sex distributions also varied by cognitive status within ethnic groups. In both the overall and CU versus CI comparisons, CI groups generally included a higher proportion of males than CU groups across all ethnicities. However, within the CI spectrum, sex distributions did not differ significantly between MCI and AD in any ethnic group.
Overall characteristics stratified by ethnicity.
Mean (SD).
n (%).
Kruskal-Wallis rank sum test; Pearson's Chi-squared test; Fisher's exact test.
CI: cognitively impaired; CU: cognitively unimpaired; MCI: mild cognitive impairment; AD: Alzheimer's disease; AA: African American; NHW: non-Hispanic White.
Comparison of performance across AA, Hispanic, and NHW groups
1. Cu versus CI (adjusted and unadjusted)
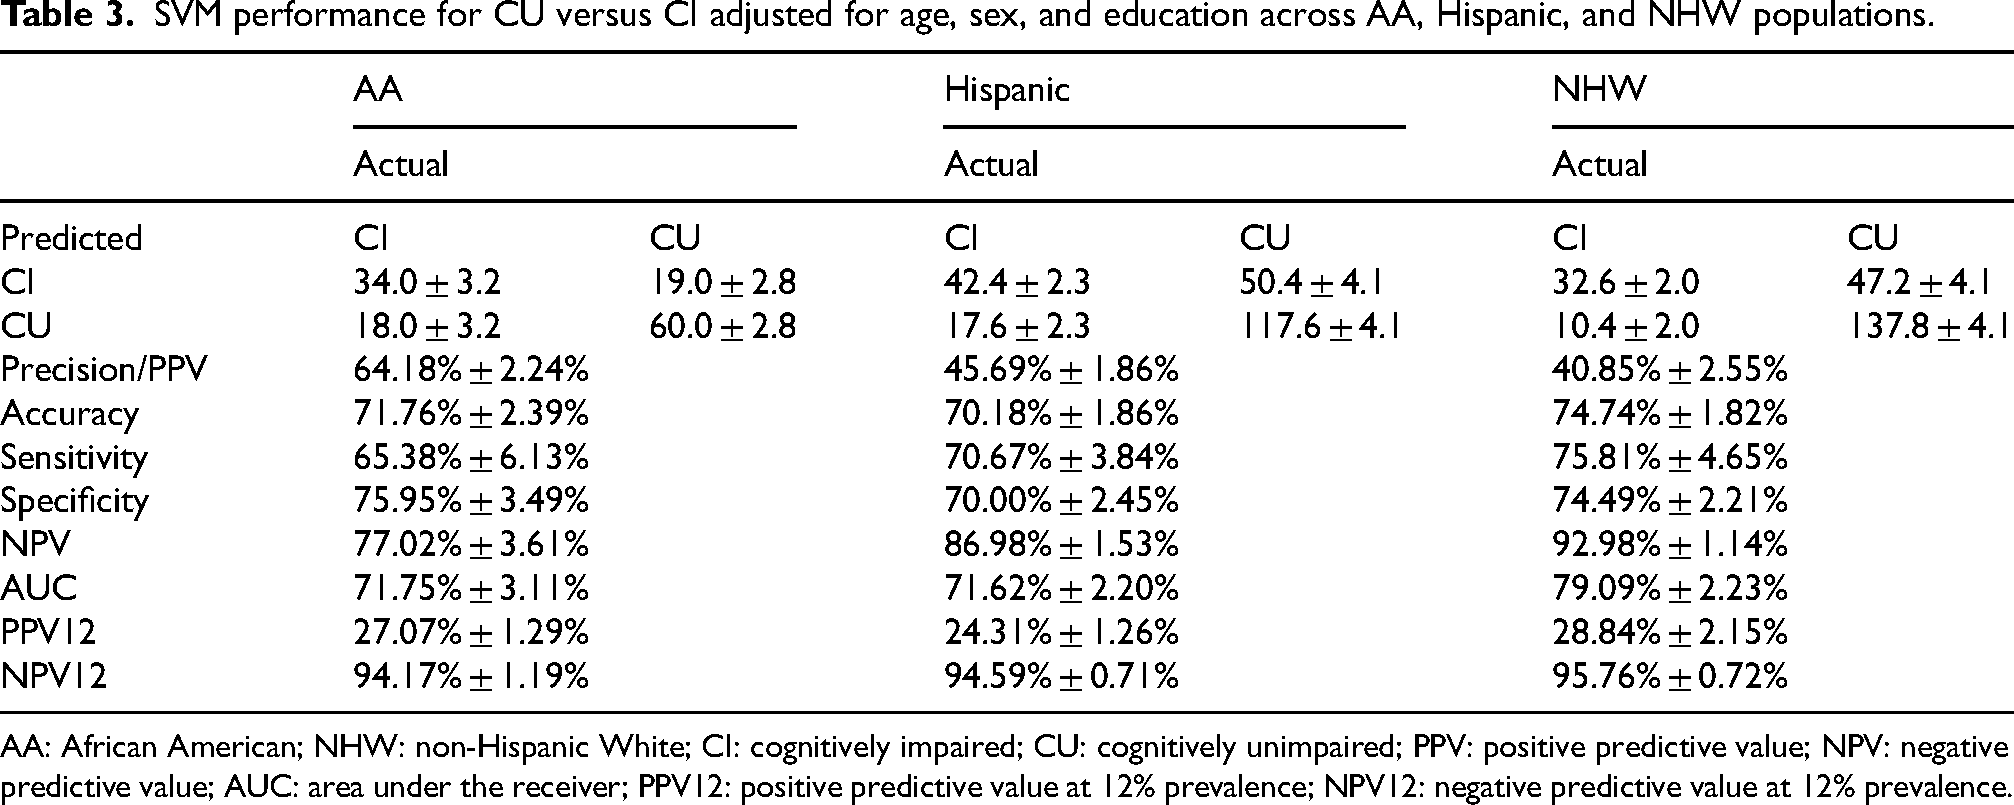
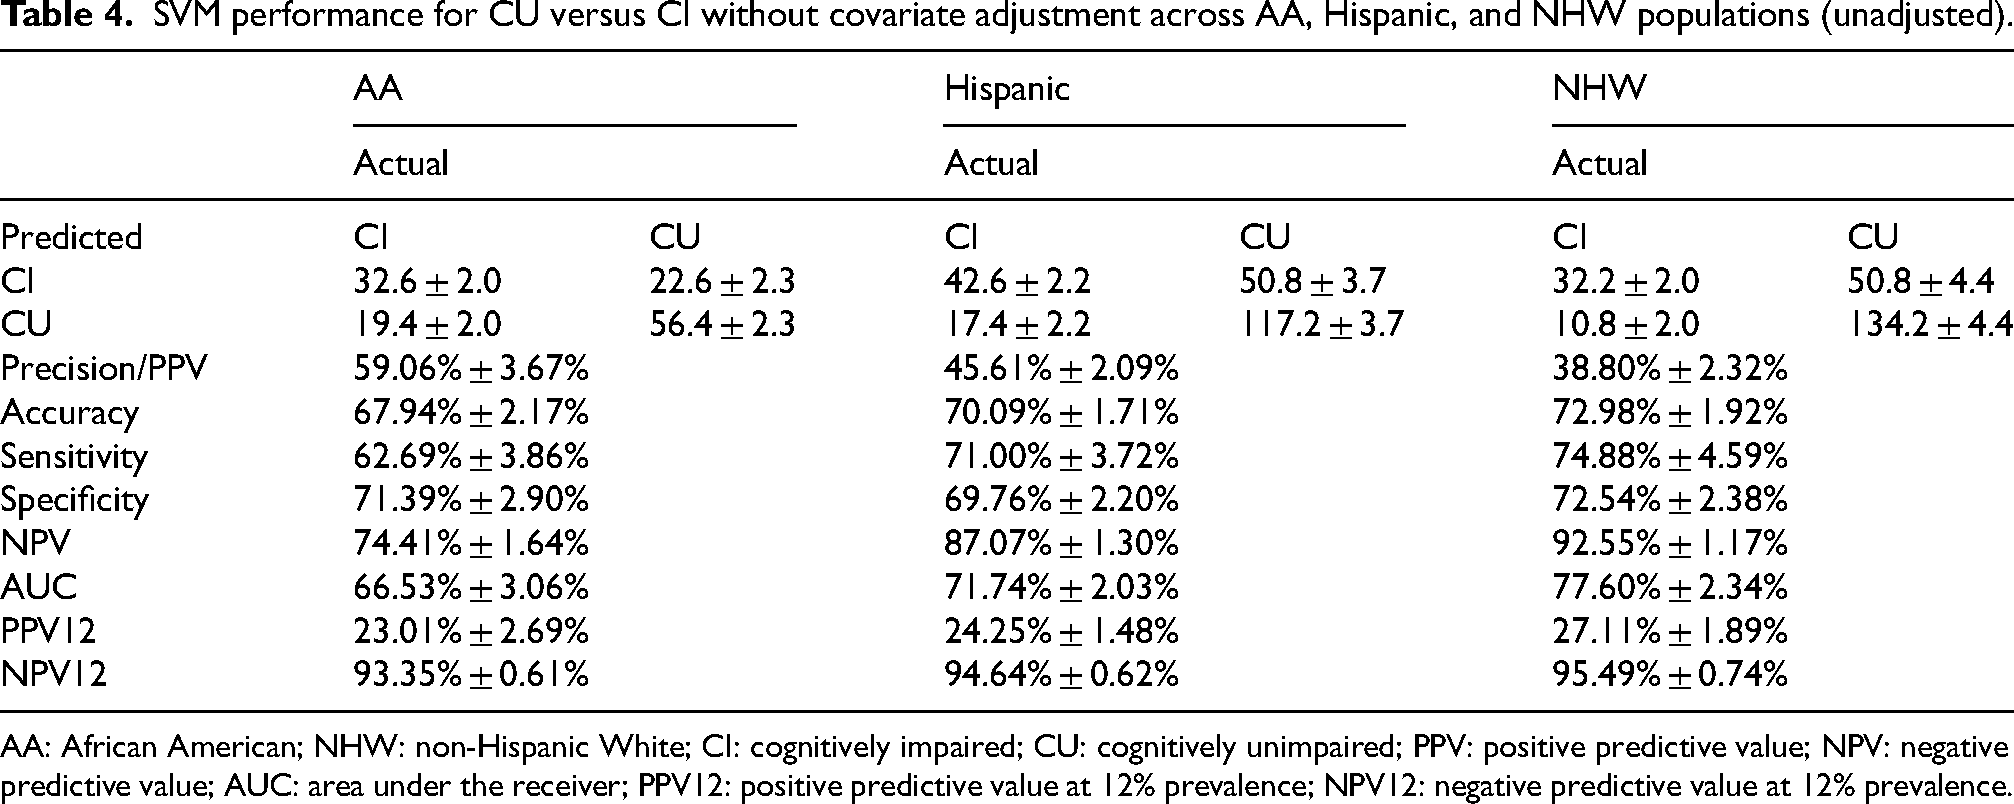
Across both adjusted and unadjusted models, NHW participants consistently demonstrate the strongest overall classification performance, particularly in AUC, NPV, Sensitivity, and PPV12. NHW shows the highest AUC (79.09% adjusted; 77.60% unadjusted) and the best NPV12, indicating stronger model discrimination and reliability for ruling out impairment in this group (Tables 3 and 4). AA performance is generally moderate. AA shows the highest PPV (adjusted: 64.18%), meaning fewer false positives when identifying impairment, but AUC and accuracy remain lower than NHW. AA sensitivity is also modest compared to Hispanic and NHW groups. Hispanic participants show mixed results. Sensitivity is relatively high (70–71%), indicating better identification of impaired cases, but PPV is consistently lowest across groups. AUC is comparable to AA but lower than NHW. Overall, performance for Hispanics tends to be less balanced, with stronger sensitivity but weaker precision and moderate accuracy.
SVM performance for CU versus CI adjusted for age, sex, and education across AA, Hispanic, and NHW populations.
AA: African American; NHW: non-Hispanic White; CI: cognitively impaired; CU: cognitively unimpaired; PPV: positive predictive value; NPV: negative predictive value; AUC: area under the receiver; PPV12: positive predictive value at 12% prevalence; NPV12: negative predictive value at 12% prevalence.
SVM performance for CU versus CI without covariate adjustment across AA, Hispanic, and NHW populations (unadjusted).
AA: African American; NHW: non-Hispanic White; CI: cognitively impaired; CU: cognitively unimpaired; PPV: positive predictive value; NPV: negative predictive value; AUC: area under the receiver; PPV12: positive predictive value at 12% prevalence; NPV12: negative predictive value at 12% prevalence.
2. MCI versus AD (adjusted and unadjusted)
For the MCI versus AD comparison, Hispanic and NHW groups outperform AA across almost all metrics, with Hispanic participants showing the most balanced and highest overall performance in several key measures (Tables 5 and 6). In the adjusted model, Hispanics show the strongest combined metrics: PPV: 63.74% (highest), Accuracy: 83.05% (highest), AUC: 80.79% (close to NHW at 82.05%), and NPV12: 96.49%. NHW participants show high sensitivity (87.69%) and excellent NPV (93–97%), indicating strong performance for ruling out AD, but PPV is lower than Hispanics. AA participants consistently show the lowest AUC, PPV, and accuracy, although their NPV remains high, indicating a tendency toward more false positives but strong ability to identify true negatives. In the unadjusted model, the pattern persists: NHW shows the highest PPV (68.42%) and strong accuracy (82.79%). Hispanics maintain strong sensitivity and NPV. AA performance remains lowest across most metrics.
SVM performance for MCI versus AD adjusted for age, sex and education across AA, Hispanic, and NHW populations.
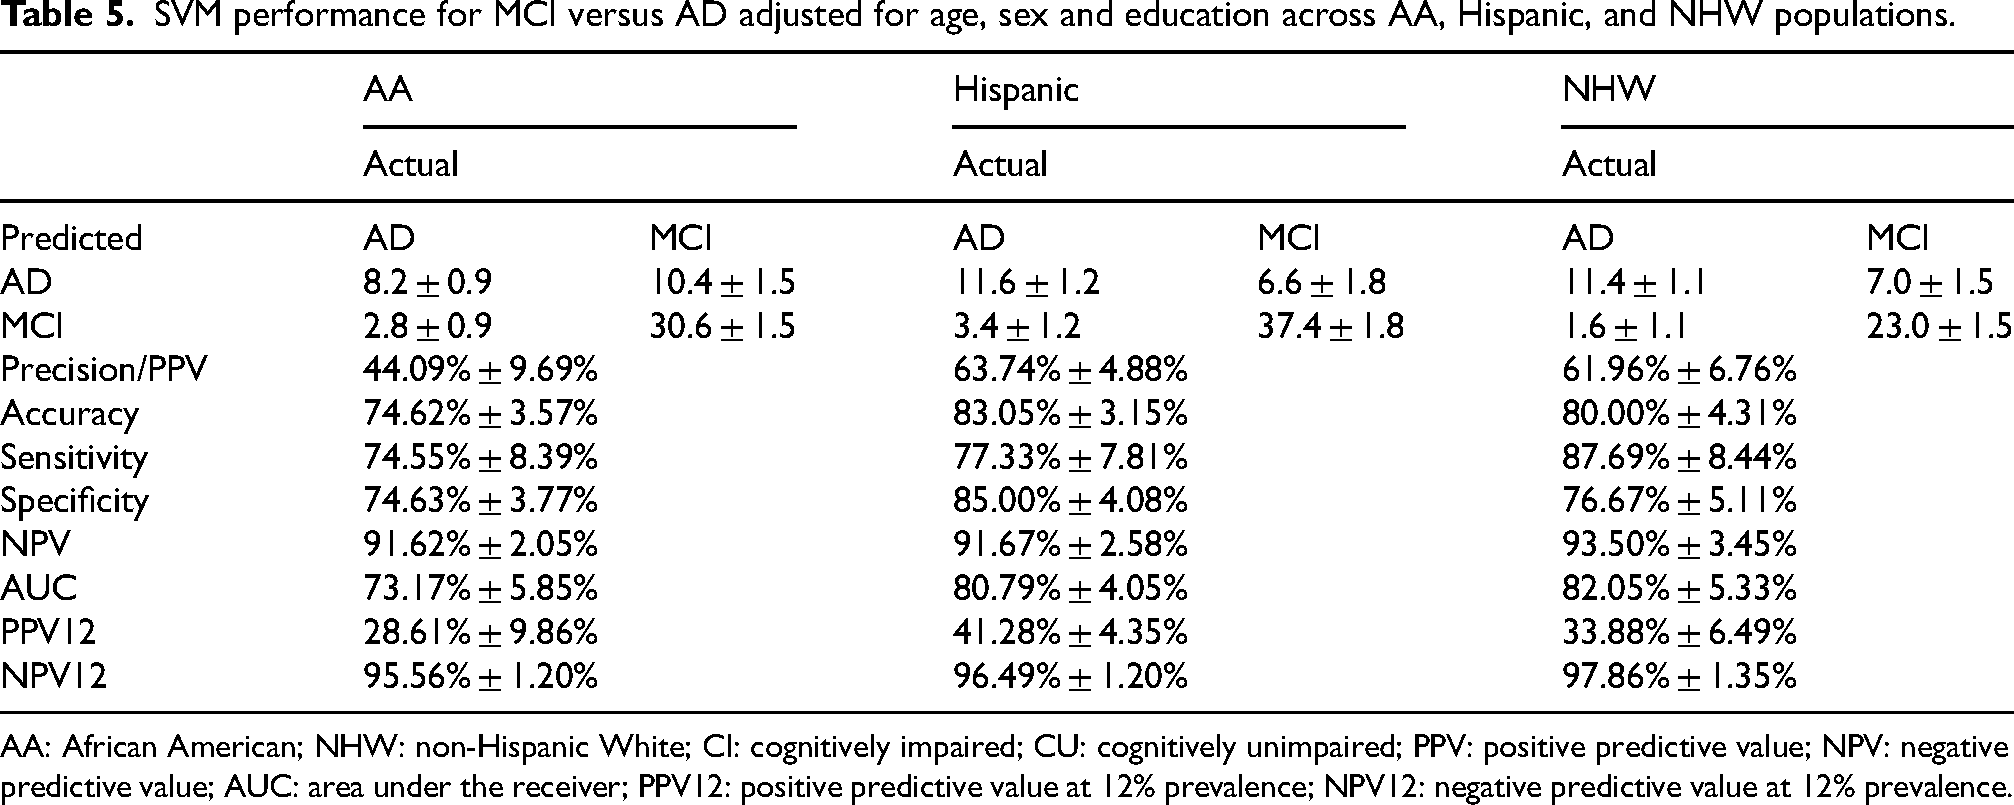
AA: African American; NHW: non-Hispanic White; CI: cognitively impaired; CU: cognitively unimpaired; PPV: positive predictive value; NPV: negative predictive value; AUC: area under the receiver; PPV12: positive predictive value at 12% prevalence; NPV12: negative predictive value at 12% prevalence.
SVM performance for MCI versus AD without covariate adjustment across AA, Hispanic, and NHW populations (unadjusted).
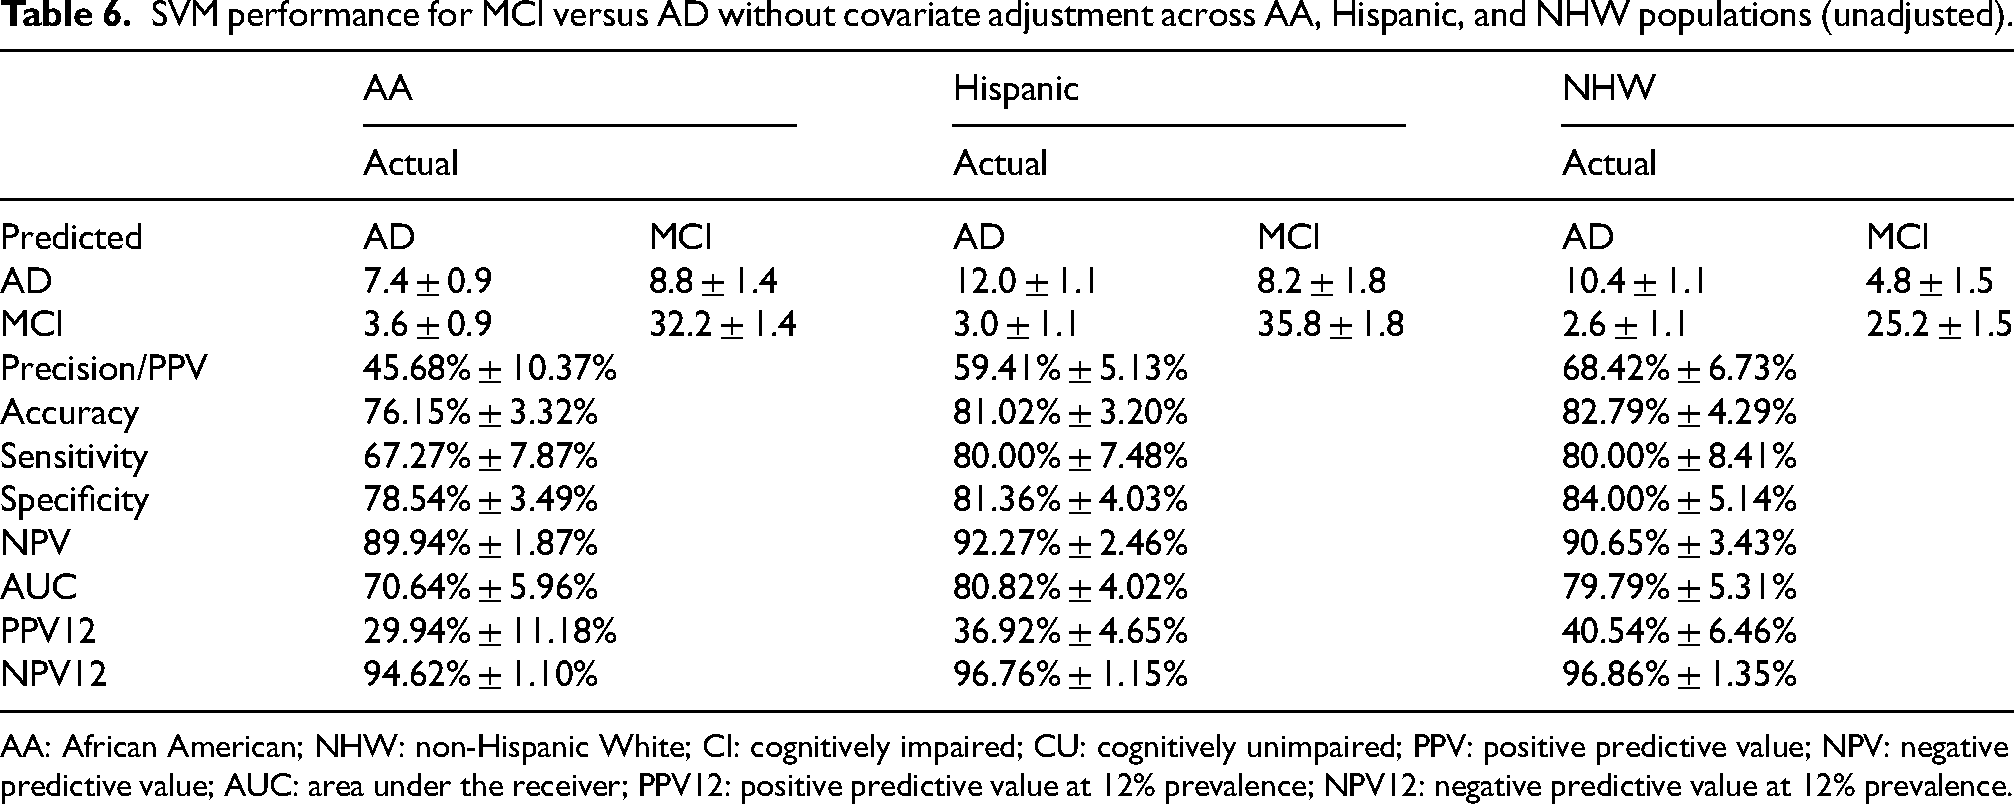
AA: African American; NHW: non-Hispanic White; CI: cognitively impaired; CU: cognitively unimpaired; PPV: positive predictive value; NPV: negative predictive value; AUC: area under the receiver; PPV12: positive predictive value at 12% prevalence; NPV12: negative predictive value at 12% prevalence.
Across both classification tasks (CU versus CI and MCI versus AD) and adjustment conditions, NHW participants consistently show the strongest or near-strongest performance. Specifically, they outperform other groups in AUC, accuracy, NPV, and PPV12, indicating superior discrimination and reliability of predictions. Hispanic participants demonstrate high sensitivity and competitive AUC, particularly in the MCI versus AD task, where they often exceed both AA and NHW in balanced accuracy and PPV. In contrast, AA participants exhibit comparatively weaker performance, with lower AUC and accuracy across tasks, although they have the highest PPV for CU versus CI and maintain strong NPV.
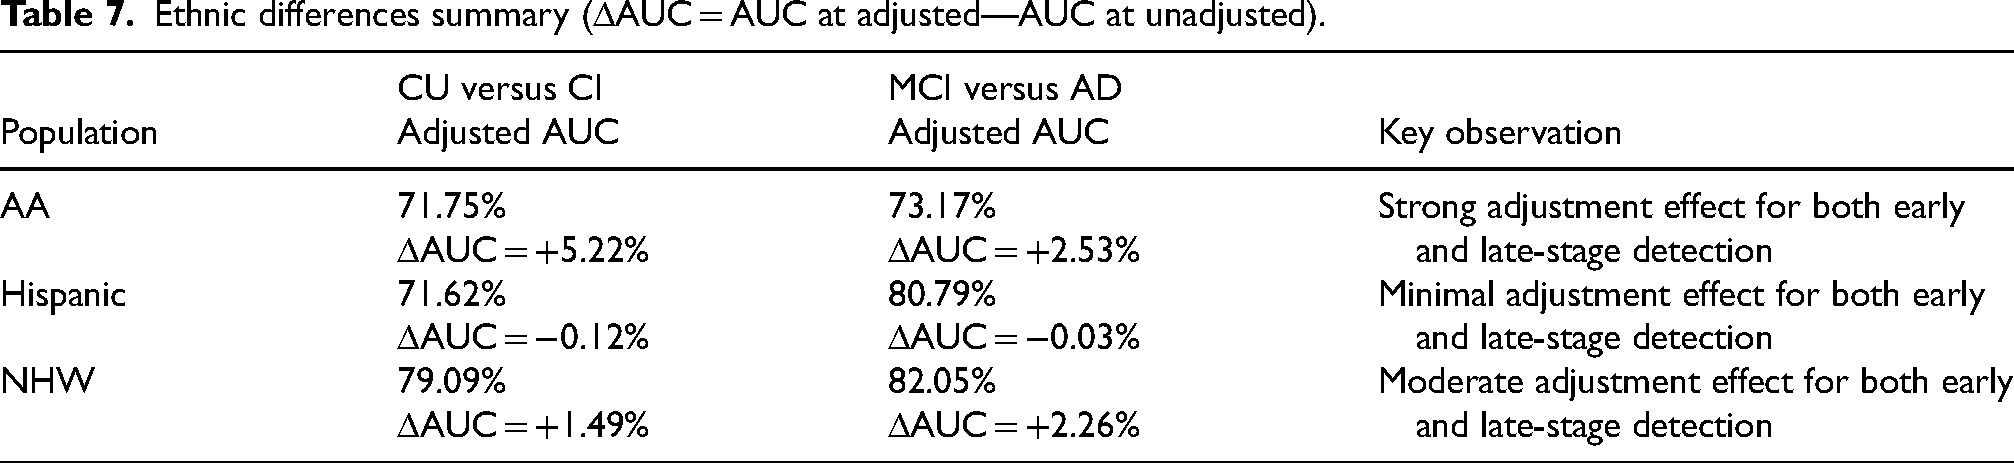
3. Effect of demographic covariate adjustment on classification performance
Adjustment for age, sex, and education yielded meaningful improvements in model discrimination for AA and NHW participants across both comparisons, with the largest gains observed in the CU versus CI classification for AA (+5.22%) (Table 7). Improvements for NHW were smaller but consistent (CU versus CI: +1.49%; MCI versus AD: +2.26%). In contrast, AUC changes among Hispanic participants were minimal, with virtually no difference between adjusted and unadjusted models in either classification (−0.12% and −0.03%, respectively). Overall, adjustment strengthened model performance primarily for AA and NHW groups, while having little impact among Hispanic participants.
Ethnic differences summary (ΔAUC = AUC at adjusted—AUC at unadjusted).
4. Classification performance across disease stages: early (CU versus CI) versus late (MCI versus AD)
We observed distinct patterns in SVM performance between early-stage (CU versus CI) and late-stage (MCI versus AD) cognitive classification. Overall, CU versus CI proved more challenging to classify, likely due to the subtler cognitive changes in the early stages of impairment (Tables 3, 4, and 7). This is reflected in generally lower AUCs and PPV12 values across all populations. AA participants showed the greatest improvement with demographic adjustment, highlighting the importance of accounting for age, sex, and education in early detection. Hispanic participants exhibited minimal changes with adjustment, whereas NHW participants demonstrated modest gains, consistent with their higher baseline separability.
In contrast, MCI versus AD classification exhibited higher separability across all ethnic groups, as evidenced by substantially higher AUCs and NPV12 values (Tables 5–7). Adjustment for demographics had varying effects: it moderately improved performance for AA participants, primarily enhanced precision and specificity for Hispanic participants, and provided modest gains in AUC and negative predictive value for NHW participants. These findings indicate that late-stage cognitive impairment is more readily detected by SVM models and that demographic adjustment plays an important role in optimizing performance, particularly for populations where early-stage classification is most challenging.
Comparison of feature ranking across AA, Hispanic, and NHW
1. Cu versus CI (adjusted and unadjusted)
Across both adjusted (Figure 1 and Supplemental Figure 1) and unadjusted (Figure 2 and Supplemental Figure 2) CU versus CI analyses, tau PET measures consistently ranked among the top features across all three racial/ethnic groups, particularly Tau PI2620 lateral parietal and posterior cingulate SUVR. This convergence suggests a shared role of early tau-related cortical involvement in distinguishing CU from CI individuals regardless of race/ethnicity. Beyond this shared tau signal, group-specific patterns emerged. AA participants showed relatively higher rankings of parietal and temporal cortical thickness measures (e.g., inferior parietal, bankssts, supramarginal) and white matter diffusion metrics (e.g., corticospinal tract, posterior corona radiata), indicating greater heterogeneity across gray- and white-matter features. Hispanic participants demonstrated stronger emphasis on medial temporal cortical thickness (entorhinal, parahippocampal) alongside tau PET and selected white matter integrity measures, suggesting prominent medial temporal involvement at the CU–CI transition. NHW participants consistently ranked hippocampal volume (ICV-adjusted), WMH burden, and posterior white matter diffusion metrics among top features, indicating earlier prominence of neurodegeneration and vascular-related markers. Overall, CU versus CI classification reflects shared tau-driven changes with race/ethnicity-specific structural and white matter signatures.
Top 20 feature rankings for CU versus CI adjusted for age, sex, and education across AA, Hispanic, and NHW populations.
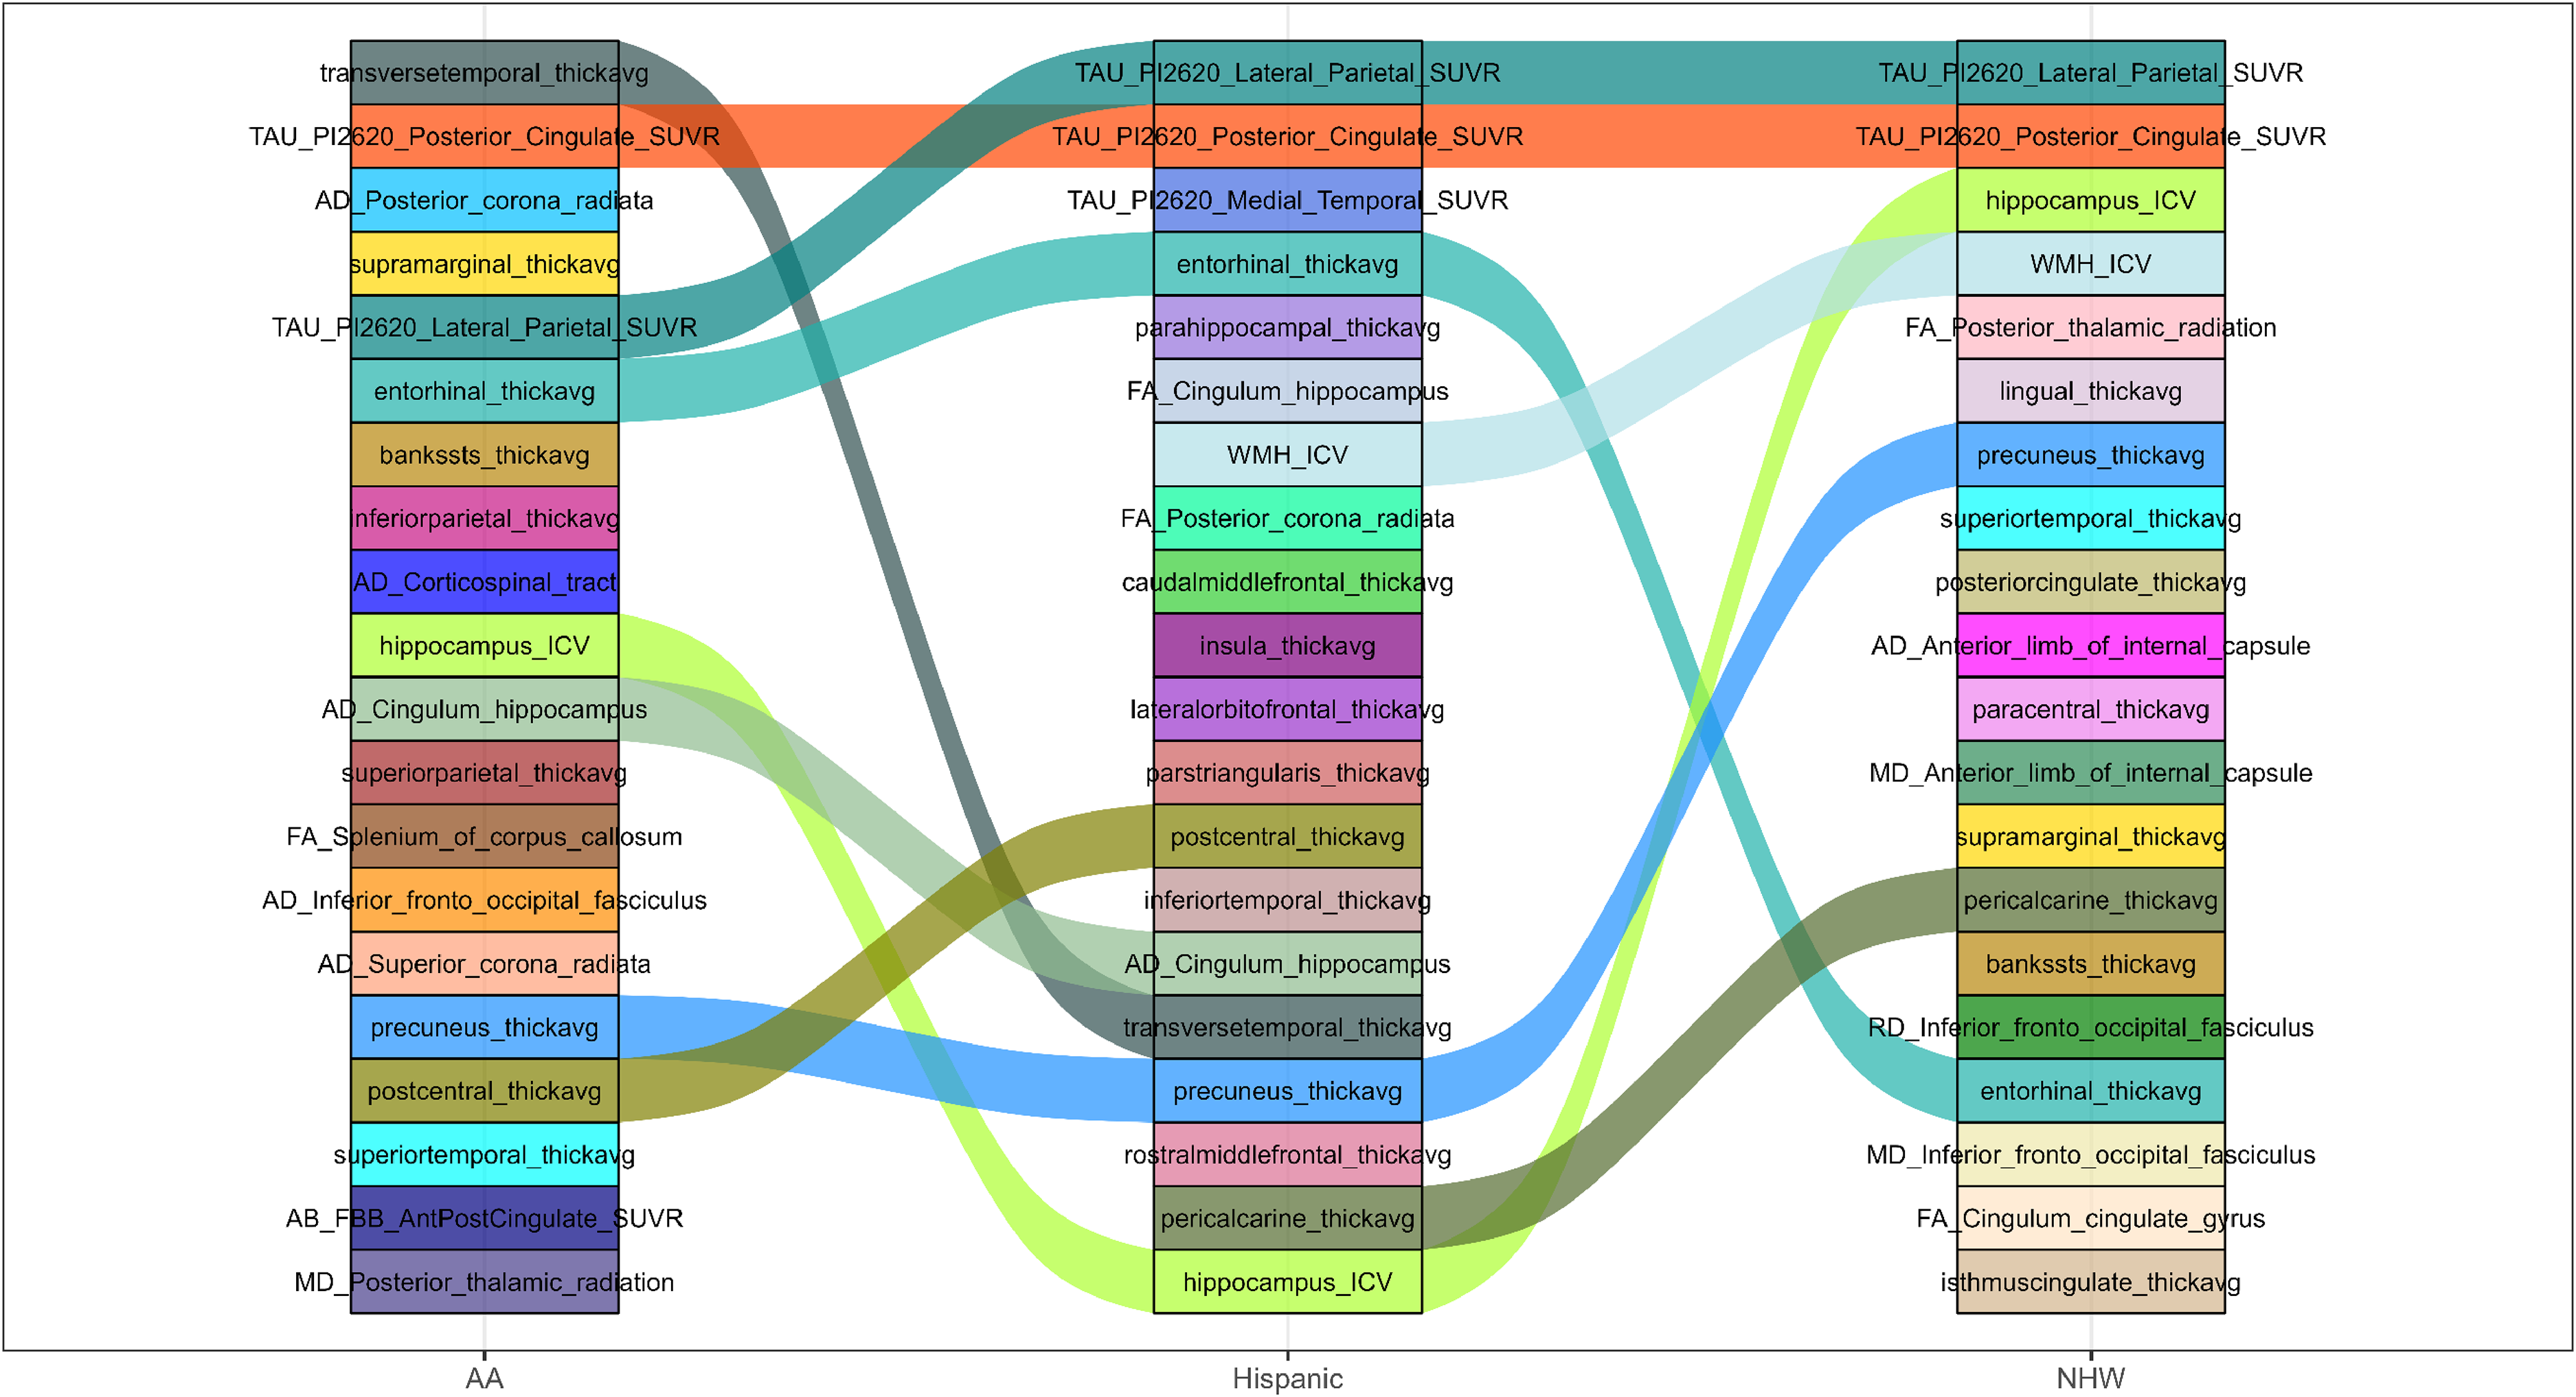
Top 20 feature rankings for CU versus CI without covariate adjustment across AA, Hispanic, and NHW populations.
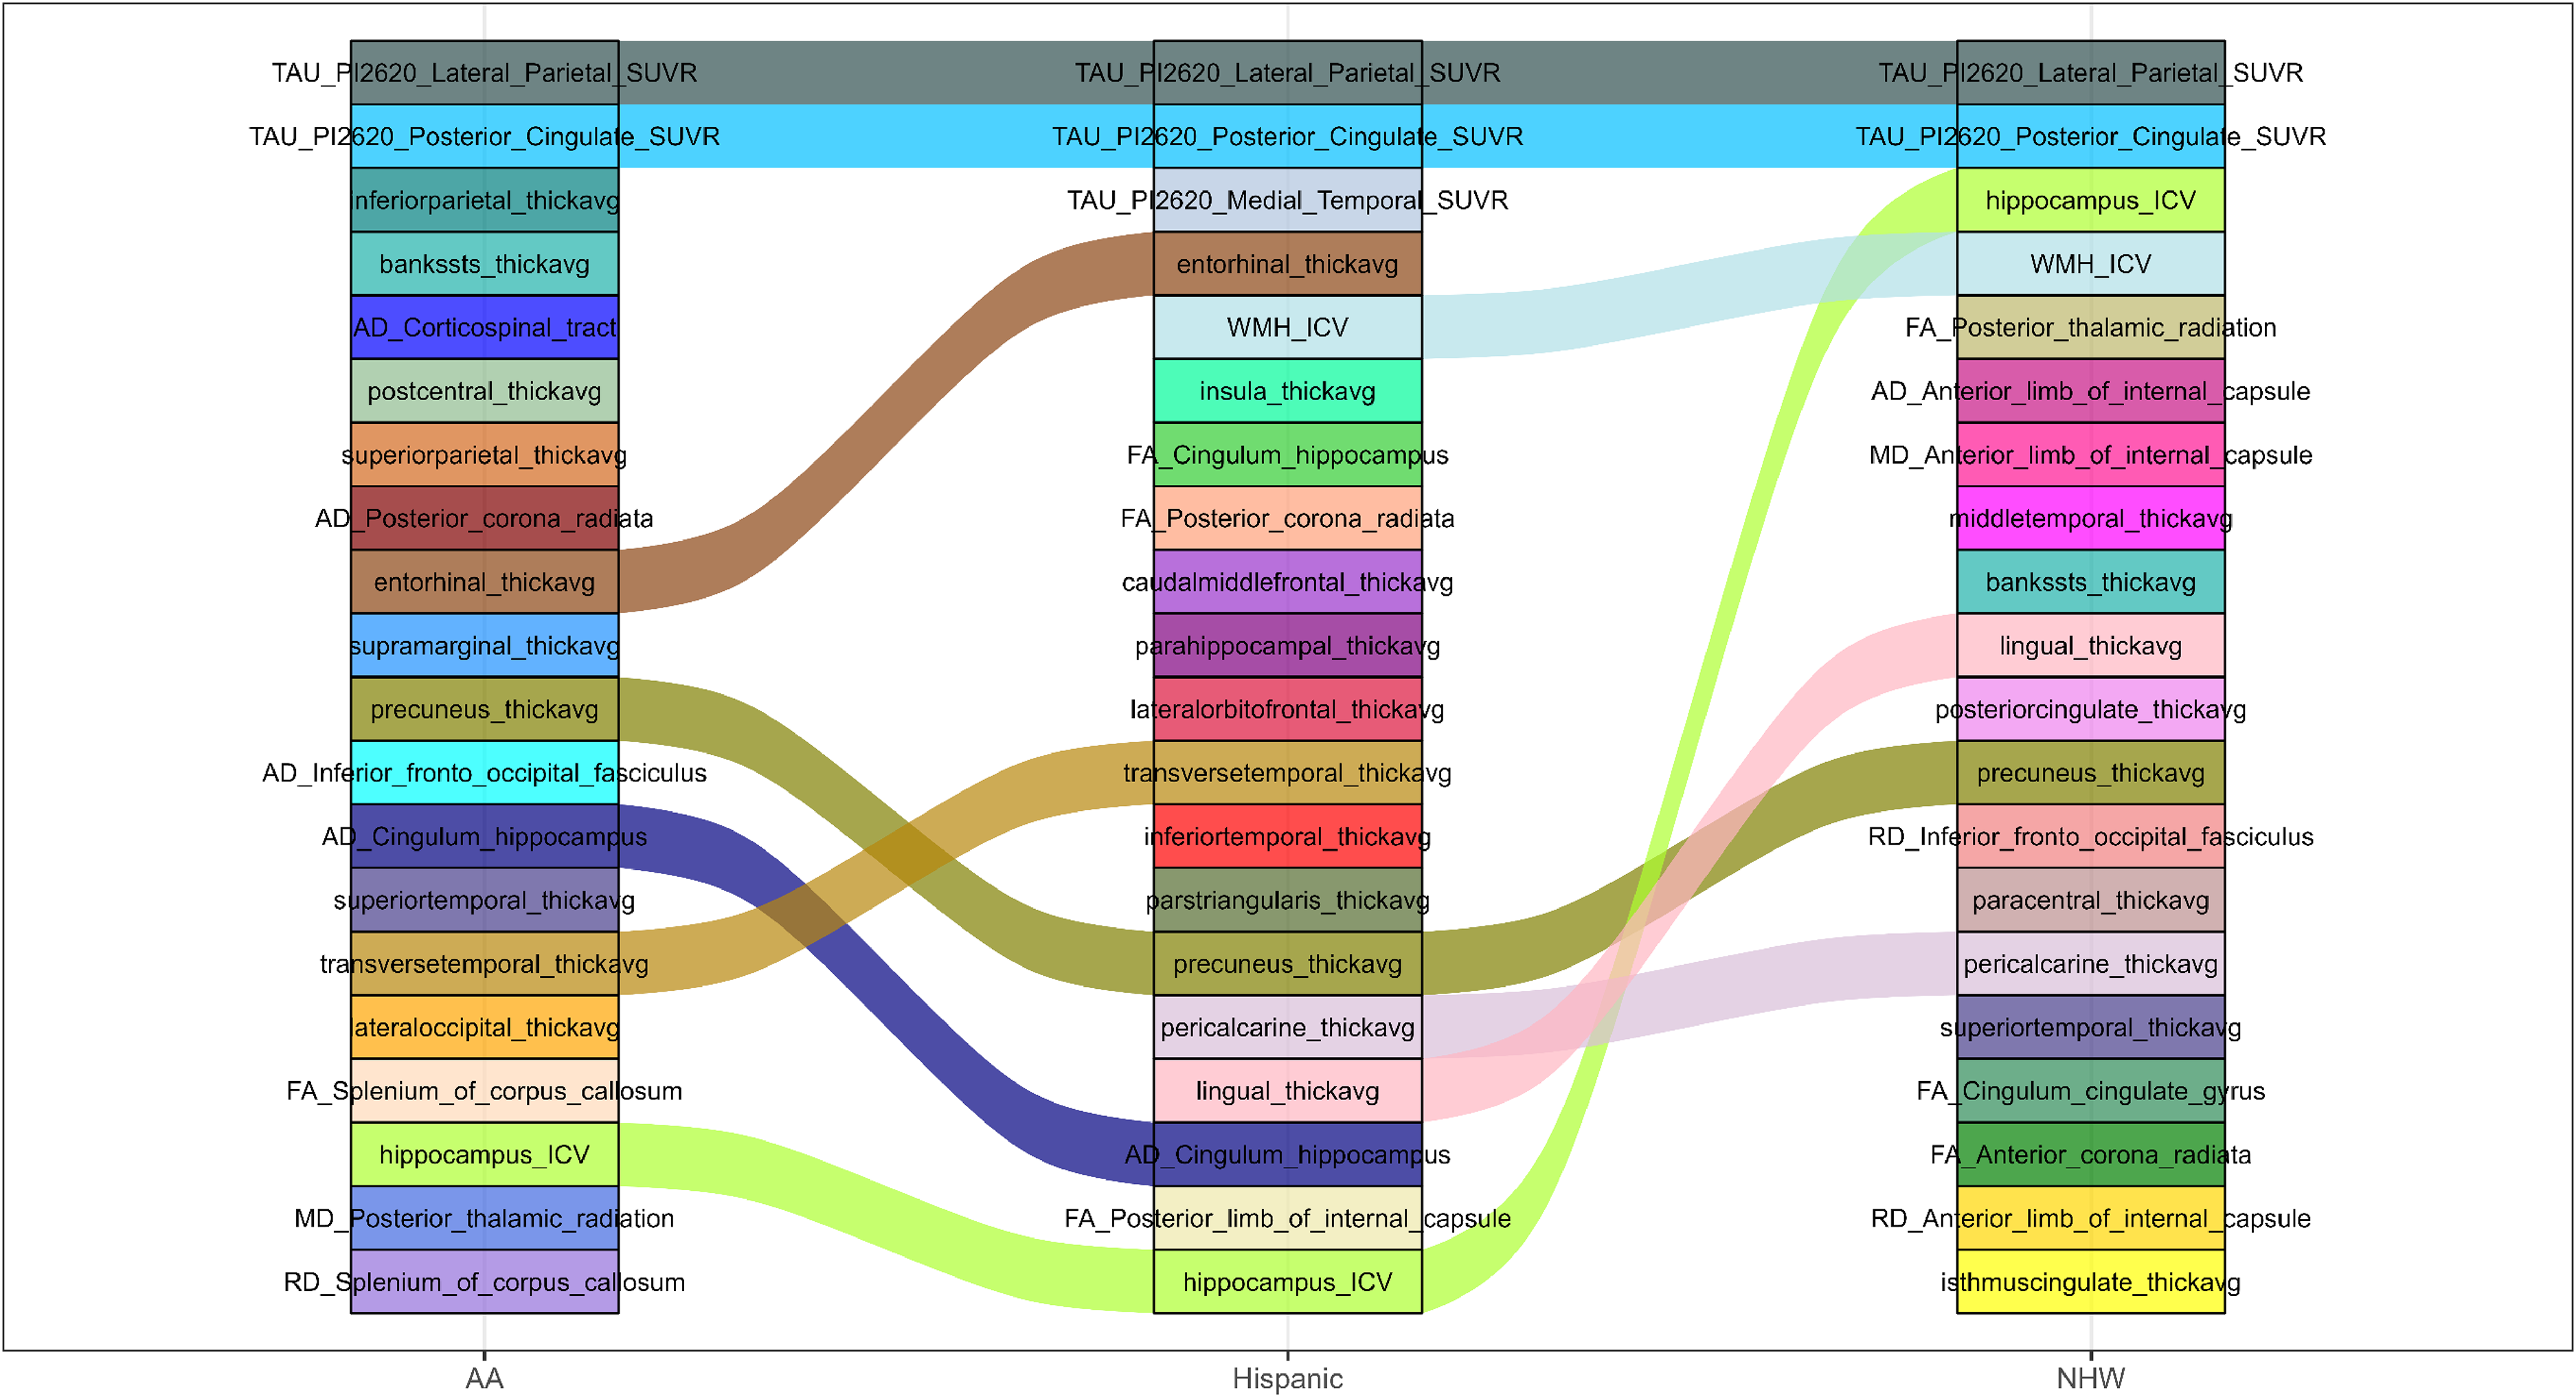
2. MCI versus AD (adjusted and unadjusted)
For MCI versus AD comparisons (Figures 3 and 4 and Supplemental Figures 3 and 4), greater cross-group divergence in feature ranking was observed compared with CU versus CI. AA participants were dominated by amyloid PET SUVRs across frontal, parietal, temporal, and cingulate regions in both adjusted and unadjusted analyses, followed by tau PET and white matter tract measures. This pattern indicates a stronger relative contribution of amyloid burden in distinguishing later disease stages within AA participants. Hispanic participants consistently ranked hippocampal volume, entorhinal and frontal cortical thickness, and splenial diffusion metrics highly, reflecting a combination of medial temporal neurodegeneration and callosal white matter involvement. NHW participants showed a dominant tau PET–centric pattern, with medial temporal, posterior cingulate, and lateral parietal tau SUVRs ranking at the top, followed by hippocampal volume and cortical thickness measures. Thus, in later disease stages, AA participants emphasized amyloid-related features, NHW participants emphasized tau pathology, and Hispanic participants showed a mixed neurodegenerative and white matter profile.
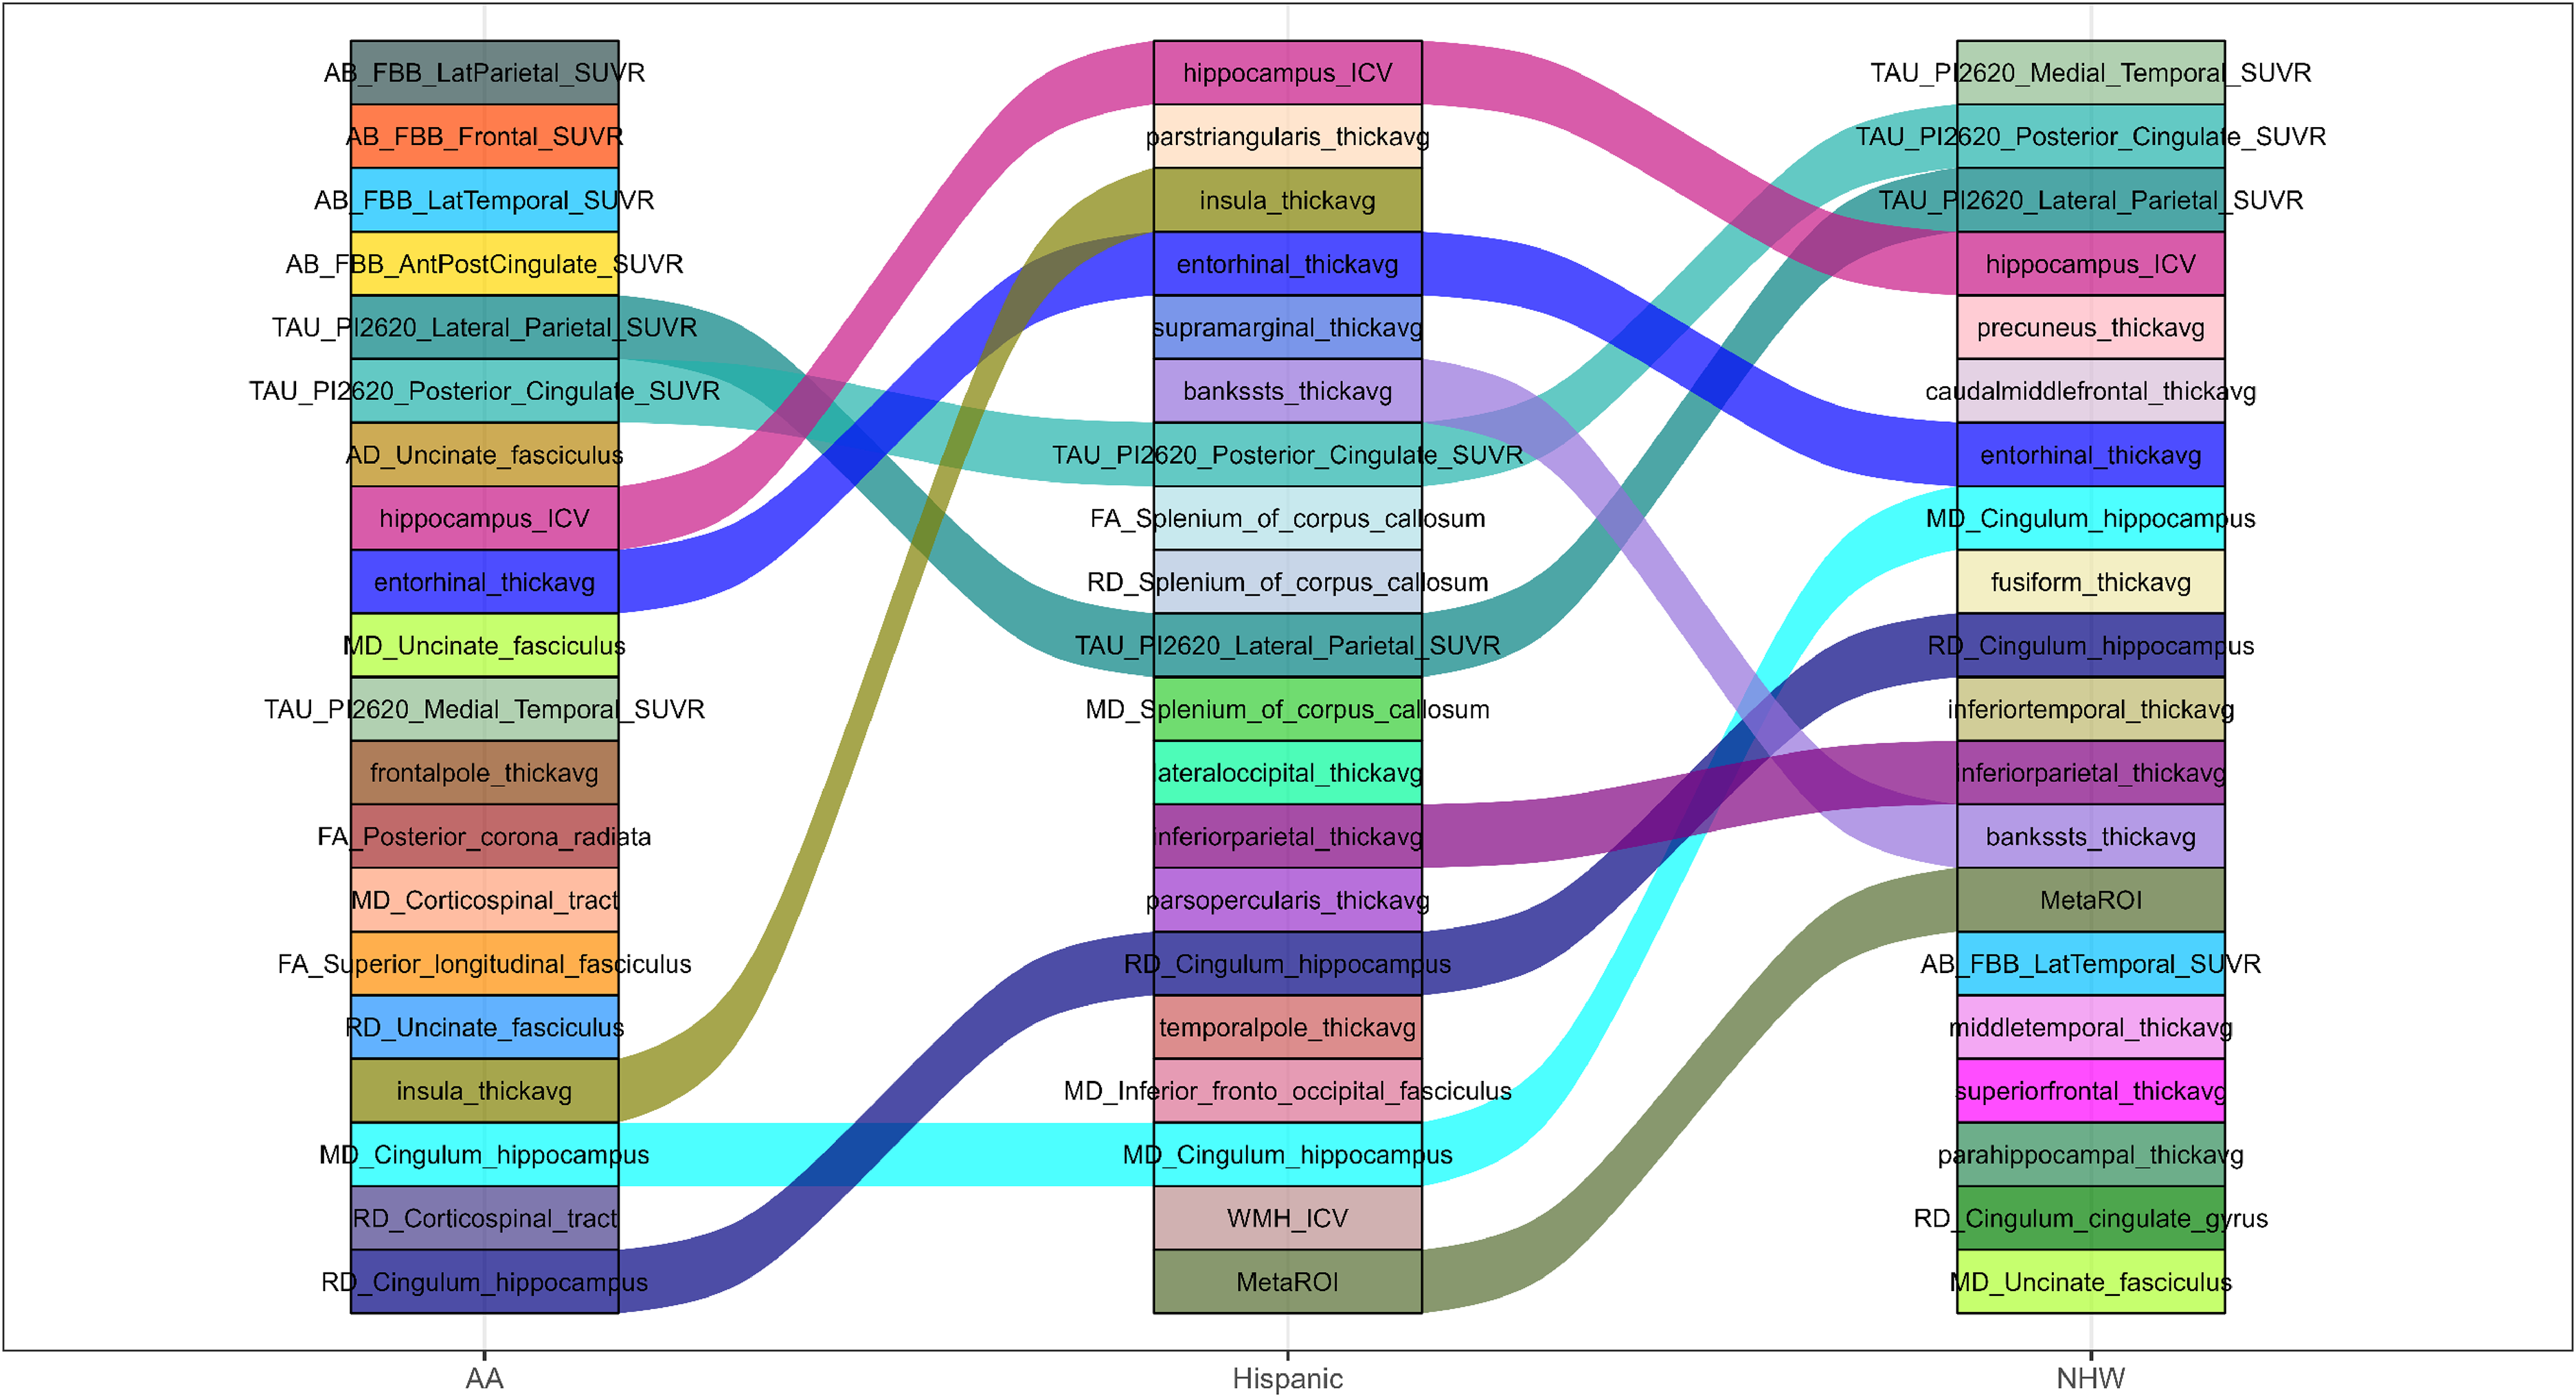
Top 20 feature rankings for MCI versus AD adjusted for age, sex, and education across AA, Hispanic, and NHW populations.
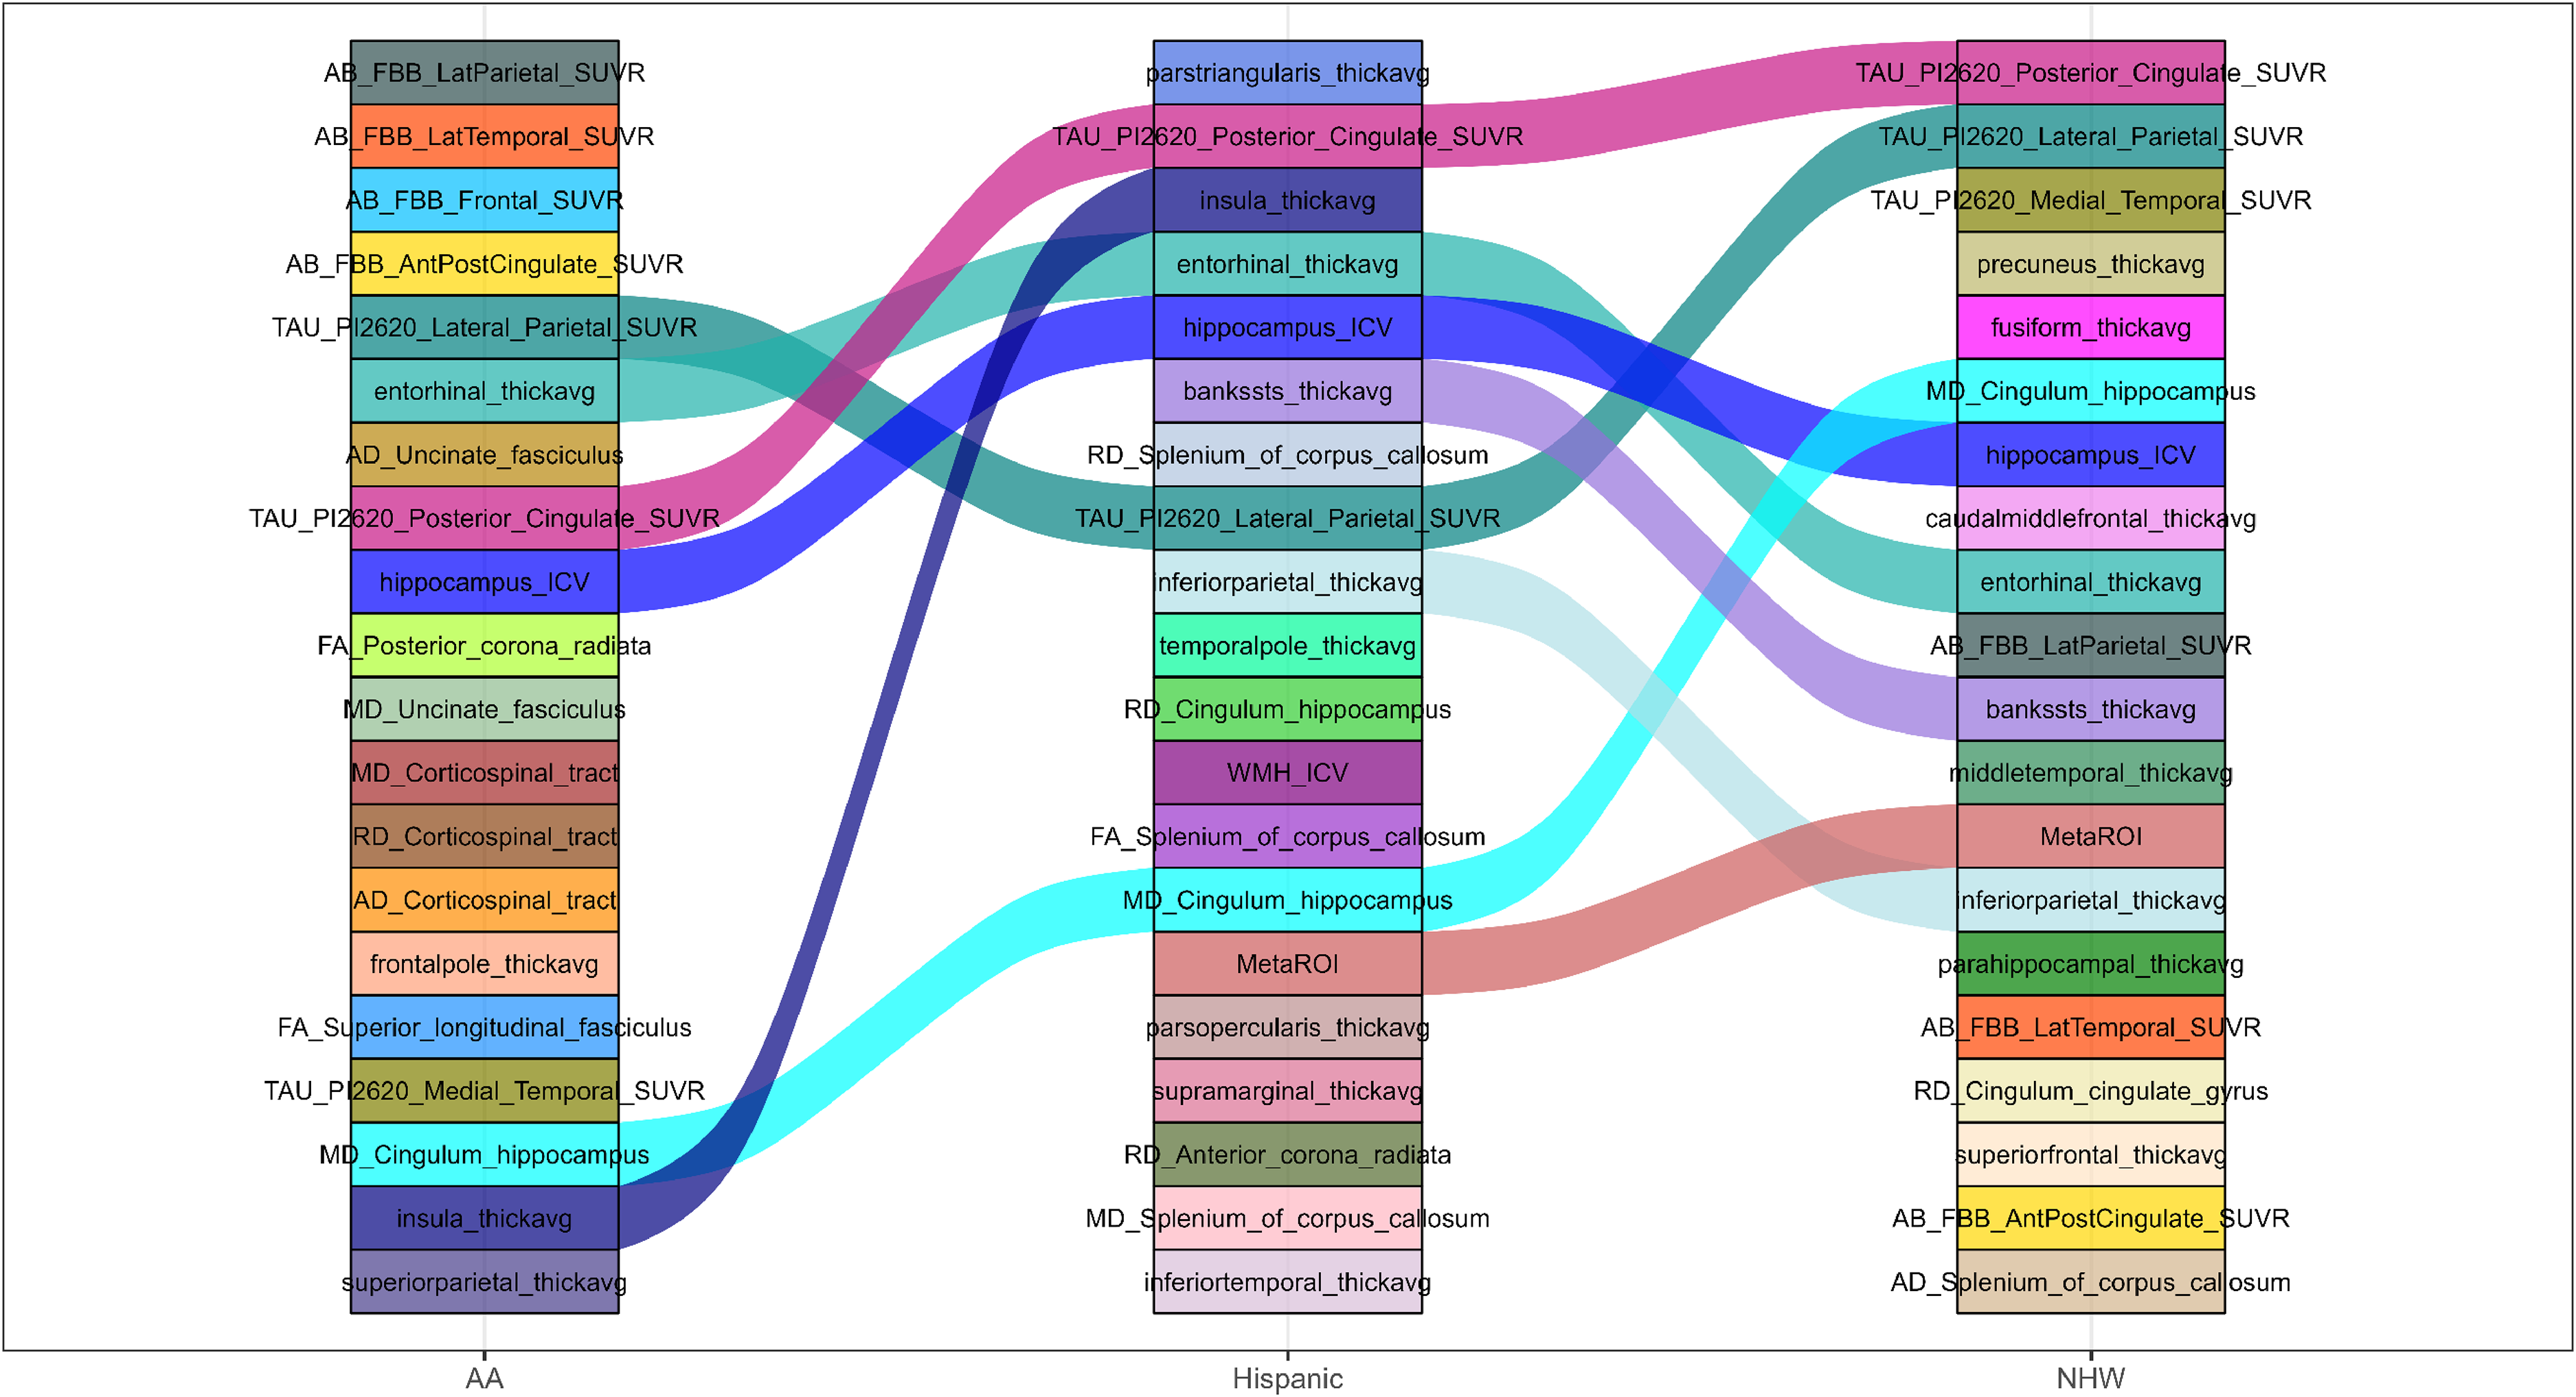
Top 20 feature rankings for MCI versus AD without covariate adjustment across AA, Hispanic, and NHW populations.
3. Effect of demographic covariate adjustment on feature ranking
Comparing adjusted (Figures 1 and 3 and Supplemental Figures 1 and 3) and unadjusted (Figures 2 and 4 and Supplemental Figures 2 and 4) analyses reveal that covariate adjustment primarily refined, rather than fundamentally altered, feature ranking patterns. In both CU versus CI and MCI versus AD tasks, adjustment for age, sex, and education attenuated the prominence of age-associated features, including hippocampal volume, WMH burden, and global diffusion measures. After adjustment: Tau and amyloid PET measures rose in relative importance, particularly in NHW (tau PET) and AA (amyloid PET) groups. Cortical thickness measures in medial temporal and association cortices became more prominent in Hispanic participants. Conversely, unadjusted models amplified the ranking of features known to covary strongly with age, such as WMH_ICV, hippocampus_ICV, and splenial or cingulum diffusion metrics. This pattern was most evident in NHW and Hispanic groups, supporting the interpretation that removal of covariate adjustment increases the apparent contribution of age-related neurodegenerative and vascular markers rather than revealing distinct disease-specific signals.
4. Feature ranking across disease stages: early (CU versus CI) versus late (MCI versus AD)
Comparing early and late disease stages demonstrates a clear shift in dominant feature types across all racial/ethnic groups. Early stage (CU versus CI) classification was characterized by tau PET measures and distributed cortical thickness changes, particularly in parietal, posterior cingulate, and temporal regions, with supplementary contributions from white matter integrity and WMH burden. Late stage (MCI versus AD) classification showed increased prominence of molecular pathology and medial temporal neurodegeneration, with amyloid PET (AA), tau PET (NHW), and hippocampal/cortical atrophy (Hispanic) emerging as dominant discriminators. Importantly, group-specific emphases became more pronounced at later stages, suggesting that racial/ethnic heterogeneity in biomarker importance widens as disease severity increases, whereas early disease stages are characterized by more shared pathophysiological signals.
Discussion
In this study, we systematically examined ethnic differences in AD prediction using classification performance and feature importance derived from multimodal neuroimaging biomarkers across AA, Hispanic, and NHW participants. Our findings reveal substantial heterogeneity in both model performance and the neuroimaging features driving classification, highlighting the importance of considering ethnicity in machine learning–based AD prediction.
The impact of ethnic, disease stage, and demographic covariate adjustments on classification performance
We observed notable differences in model performance across ethnic groups and disease stages, highlighting the interplay between ethnicity, cognitive stage, and demographic factors in predicting AD. Early-stage classification (CU versus CI) was generally more challenging across all populations, reflected in lower AUC, accuracy, and PPV12 values, likely due to subtler cognitive changes. NHW participants consistently demonstrated the strongest overall performance at this stage, with higher AUC, accuracy, and NPV. Hispanic participants exhibited higher sensitivity, whereas AA participants showed lower overall accuracy and AUC but maintained strong NPV, indicating reliable detection of CU individuals.
Adjustment for age, sex, and education improved performance primarily for AA and NHW participants, with the largest gains observed in early-stage classification for AA (+5% AUC), while changes for Hispanics were minimal. These findings underscore the importance of demographic covariate adjustment to enhance fairness and predictive accuracy, particularly for early-stage detection in populations with lower baseline separability.
Late-stage classification (MCI versus AD) exhibited higher separability and improved performance across all ethnic groups. Hispanics achieved the most balanced metrics, NHW participants showed high sensitivity and NPV, and AA participants continued to demonstrate relatively lower overall performance, though with strong negative predictive value. Together, these results indicate that disease stage, ethnicity, and demographic covariates jointly modulate classification performance, with early-stage detection posing greater challenges and late-stage impairment being more reliably identified by machine learning models. Accounting for these factors is critical for designing predictive models that are accurate, equitable, and generalizable across diverse populations.
The impact of ethnic, disease stage, and demographic covariate adjustments on feature ranking
Neuroimaging feature importance in AD varies across ethnic groups, disease stages, and with demographic covariate adjustment. Understanding these factors is essential for developing interpretable and generalizable machine learning models.
Ethnic differences strongly modulated feature importance. While Tau-PC and Tau-LP remained universally critical, AA participants showed higher relative contributions from amyloid PET SUVR and white matter integrity metrics, Hispanic participants emphasized medial temporal cortical thickness and hippocampal volume, and NHW participants consistently prioritized tau PET and posterior cortical measures. These population-specific patterns indicate that underlying pathophysiology and biomarker expression differ across ethnic groups, underscoring the need for ethnically inclusive datasets and tailored modeling approaches in AD prediction.
Comparing early and late disease stages highlights dynamic shifts in biomarker relevance. In early-stage classification (CU versus CI), tau PET measures, particularly Tau-PC and Tau-LP, dominated feature importance across all groups, with secondary contributions from hippocampal volume, medial temporal and association cortex thickness, and white matter integrity metrics (DTI and WMH). Late-stage classification (MCI versus AD) shifted toward disease-specific molecular pathology and neurodegeneration, with AA participants relying more on amyloid PET, NHW participants on tau PET and hippocampal volume, and Hispanic participants on a combination of medial temporal cortical thinning and white matter tract alterations. This widening divergence across ethnic groups suggests that biomarker contributions evolve with disease progression and population-specific pathophysiology.
Adjustment for age, sex, and education primarily refined rather than fundamentally altered feature ranking. Covariate adjustment attenuated the prominence of age-associated features, such as hippocampal volume, WMH burden, and global diffusion metrics, while increasing the relative importance of disease-specific markers, including Tau-PC for NHW participants and amyloid PET for AA participants. In Hispanic participants, adjustment shifted importance toward medial temporal cortical thickness and select white matter tracts. Unadjusted models overemphasized age-related markers, particularly in NHW and Hispanic groups, potentially masking disease-specific signals. These findings indicate that demographic covariate adjustment improves interpretability and isolates true disease-related biomarkers across populations.
Shared and population-specific neuroimaging biomarkers
Our findings highlight both shared and ethnic-specific neuroimaging signatures in predicting cognitive impairment. Across AA, Hispanic, and NHW participants, tau PET measures, particularly posterior cingulate (Tau-PC) and lateral parietal (Tau-LP) SUVRs, consistently emerged as the top discriminators for early-stage (CU versus CI) classification, supporting their role as key early markers of AD-related pathology.39–41 The prominence of Tau-PC aligns with its central role in memory, attention, and other cognitive functions, and reflects early tau accumulation patterns that have been linked to disease progression and cognitive decline.42–44 For example, Ossenkoppele et al. found that tau PET imaging patterns vary across individuals with AD and that tau accumulation in the posterior cingulate cortex is strongly associated with clinical symptoms and disease progression. 39 Maass et al. demonstrated that the posterior cingulate shows distinct tau deposition patterns between cognitively unimpaired and impaired individuals, highlighting its potential as a biomarker for early detection. 40 Buckner et al. identified the posterior cingulate as a central hub in the brain's default mode network, showing early amyloid accumulation and structural changes linked to memory decline in AD. 41
Regional tau accumulation in the lateral parietal cortex (Tau-LP) has been increasingly recognized as a critical marker of AD progression. Lagarde et al. 42 demonstrated that a distinct Tau-LP profile is associated with accelerated clinical progression and cognitive decline, highlighting its prognostic value. Malpetti et al. 43 further showed that higher Tau-LP burden predicts domain-specific cognitive deterioration, particularly in episodic memory, even in early symptomatic AD, emphasizing its relevance for early detection. Complementing these findings, Abuwarda et al. 44 illustrated that lateral parietal tau uptake reflects network-based propagation patterns and advanced Braak stages, supporting its involvement in the spread of tau pathology across functionally connected cortical regions. Collectively, these studies reinforce the importance of Tau-LP as a robust predictor of cognitive impairment and disease progression, aligning with our results showing consistently high feature importance of Tau-LP across AA, Hispanic, and NHW participants.
While Tau-PC and Tau-LP were universally important, the relative influence of hippocampal volume, regional cortical thickness, PET-amyloid (FBB SUVR), DTI measures (DA, FA, MD, and RD), and WMH burden varied across ethnic groups, suggesting subtle differences in underlying pathophysiology.
For later-stage (MCI versus AD) classification, feature importance diverged more markedly across populations. AA participants showed dominant contributions from amyloid PET SUVRs across frontal, parietal, temporal, and cingulate regions, NHW participants emphasized tau PET and hippocampal volume, and Hispanic participants exhibited a mixed profile of medial temporal cortical thinning and white matter integrity measures, including DTI metrics such as DA, FA, MD, and RD.45–47 These results underscore that while early-stage tau-driven changes are largely shared, late-stage pathology reflects ethnicity-specific patterns of neurodegeneration and molecular pathology.
DTI metrics, particularly DA, emerged as important markers of white matter microstructure, consistent with early indicators of splenial and posterior white matter abnormalities in AD.45–47 Structural MRI highlighted cortical thinning in regions including the isthmus cingulate, medial orbitofrontal cortex, and postcentral gyrus, reflecting progressive gray matter involvement. 48 Tau accumulation patterns reflect the typical AD progression from medial temporal regions to posterior cingulate, lateral parietal, and frontal cortices.48,49 White matter regions, including the posterior corona radiata and corpus callosum, also contributed to feature importance, consistent with their role in interhemispheric communication and early white matter degeneration.49,50
These findings illustrate that early cognitive decline is primarily tau-driven across populations, whereas later-stage AD engages distinct molecular, structural, and white matter signatures depending on ethnic background. This emphasizes the need for ethnically informed biomarker selection in machine learning–based AD prediction models.
Validation with prior studies
We identified only one study that explicitly examined ethnic differences in AD neuroimaging biomarkers. Caunca et al. investigated the intersectional effects of race/ethnicity and sex/gender on dementia-related neuroimaging markers in the same multi-ethnic cohort. 51 They reported that Hispanic and Black women exhibited greater medial temporal tau PET uptake compared to NHW counterparts, suggesting higher tau-related pathology in this region. Our findings are consistent with this work. Specifically, we observed that medial temporal regions, including entorhinal and parahippocampal cortical thickness and hippocampal volume, were particularly important in Hispanic participants, serving as key discriminators of cognitive impairment across both early (CU versus CI) and late (MCI versus AD) stages. In contrast, NHW participants showed a stronger emphasis on medial temporal tau PET, reflecting molecular pathology rather than structural atrophy. Collectively, these results highlight that medial temporal degeneration, both structural and molecular, plays a critical role in AD progression, with its relative importance varying across ethnic groups. These findings underscore the need for diverse and representative cohorts in neuroimaging studies to better understand population-specific patterns of AD pathology.
Implications for AD prediction and equity
Our findings have several implications. First, shared early-stage biomarkers support the generalizability of tau PET–driven detection strategies. Second, ethnic-specific differences in late-stage feature importance suggest the need for population-informed predictive models to ensure equitable performance. Third, demographic adjustment can meaningfully enhance model reliability in groups where early-stage detection is challenging. Collectively, these results highlight the importance of integrating multi-ethnic perspectives in AD research, particularly when deploying machine learning–based diagnostic tools.
SHAP with SVM for feature importance transparency
We chose SVM classifier due to its effectiveness in handling high-dimensional data and its robustness against overfitting.11,52 Despite the power of SVM, it is often regarded as a black-box model, making it challenging to discern the decision-making process from the output alone. To address this, combining SVMs with SHAP can enhance the interpretability of these models.17,34,35 SHAP provides a way to explain individual classifications by assigning “Shapley values” to each feature, quantifying its contribution to the final output. Combining SHAP with SVM rather than other models, like Random Forest, can be motivated by several key factors related to interpretability, model characteristics, and specific use cases.53,54 The choice to combine SHAP with SVM may stem from the desire for deeper interpretability of complex decision boundaries, the need for precise assessments of feature influence, and SVM's resistance to overfitting. 55 Firstly, SVM, particularly with non-linear kernel (like the radial basis function), can exhibit more intricate decision boundaries than other models such as Random Forest which is also seen as black-box model and complex and difficult to interpret directly.52,53 SHAP can provide a clearer understanding of these complex decision boundaries by attributing the contributions of individual features to model classifications.34,35 Secondly, SVM is sensitive to feature scaling and selection, as it relies on maximizing the margin between classes. Using SHAP with SVM allows for a detailed assessment of how each feature influences the decision boundary, making it easier to identify which features are driving the model's classifications.11,55 This is particularly valuable in domains like neuroimaging, where understanding the impact of specific features (e.g., cortical thickness, DTI, and PET) is crucial.36,37 Thirdly, SVM focuses on a subset of training samples known as support vectors, which are critical for defining the decision boundary. SHAP can highlight which features are influential for these support vectors, providing targeted insights into the key instances that drive the model's classifications.17,34 Fourthly, SVM is less prone to overfitting compared to other models like Random Forest, especially in high-dimensional spaces.11,36 This characteristic is due to the margin maximization principle, which seeks to find the optimal boundary between classes while maintaining a certain distance from the closest data points. As a result, SVMs often generalize better on unseen data, and combining them with SHAP allows for reliable interpretations of feature importance without the added concern of overfitting affecting the model's insights. 17
Limitations and future directions
Several limitations of this study should be acknowledged. First, we adopted an SVM framework rather than more complex deep learning or multimodal fusion approaches. This choice was intentional to prioritize interpretability and enable controlled comparisons of specific imaging-derived biomarkers across ethnic groups. However, it may limit the maximum achievable classification performance. While deep learning methods do not consistently outperform traditional machine-learning models such as SVM when applied to structured, tab-delimited feature representations, they may offer advantages for modeling high-dimensional raw neuroimaging data and complex cross-modal interactions. In addition, our analyses relied on pre-extracted, summary-level imaging features, which may not fully capture subtle spatial or nonlinear patterns present in the original data.
Second, although this study leveraged a large multi-ethnic cohort, differences in sample size across groups, particularly the smaller number of AA participants, may have influenced classification performance and feature importance estimates. Despite the use of cross-validation and demographic covariate adjustment, residual confounding from unmeasured factors such as socioeconomic status, comorbidities, healthcare access, or lifestyle differences cannot be fully excluded.
Third, given the low prevalence of cognitive impairment in the general population (approximately 12%), the PPV of our models is modest across all ethnic groups (23.01%-41.28%), indicating that a notable proportion of predicted positives may be false. This is a known limitation when applying predictive models to low-prevalence populations. However, the models demonstrated consistently high negative predictive values (93.35%-97.86%), suggesting strong reliability in identifying CU individuals. Therefore, these models may be most appropriately applied as screening tools, to rule out impairment and prioritize individuals for further evaluation, rather than as standalone diagnostic instruments.
Future research should address these limitations by expanding cohort sizes, particularly for underrepresented populations, to enhance model stability, generalizability, and equity. Incorporating longitudinal neuroimaging and additional multimodal biomarkers may clarify temporal changes in tau, amyloid, neurodegeneration, and white matter integrity. Furthermore, applying advanced multimodal fusion strategies and deep learning architectures to raw or minimally processed imaging data could improve predictive performance while extending biological insight. Validation in independent, ethnically diverse cohorts will also be essential to ensure clinical robustness and translational relevance. Collectively, these efforts will support the development of equitable, interpretable, and generalizable machine learning models for AD prediction across diverse populations.
Conclusion
In this study, we systematically evaluated ethnic differences in AD classification using multimodal neuroimaging biomarkers and machine learning across AA, Hispanic, and NHW participants. By jointly examining classification performance and feature importance across disease stages and demographic adjustment conditions, we demonstrate that both predictive accuracy and biomarker ranking vary substantially by ethnicity, cognitive stage, and demographic covariate adjustment.
Across all groups, tau PET measures, particularly posterior cingulate and lateral parietal tau SUVR, emerged as robust and shared predictors, underscoring their central role in early cognitive impairment. However, population-specific patterns became increasingly pronounced at later disease stages, with AA participants showing greater reliance on amyloid PET measures, NHW participants emphasizing tau pathology and hippocampal volume, and Hispanic participants exhibiting a mixed profile of medial temporal neurodegeneration and white matter alterations. These findings highlight that while early AD is characterized by shared tau-driven mechanisms, biomarker heterogeneity widens with disease progression.
Classification performance also varied across populations and disease stages. Early-stage detection remained challenging, particularly for AA participants, but benefited most from demographic covariate adjustment. In contrast, late-stage classification showed higher separability across all groups, with more balanced performance among Hispanic participants. Importantly, demographic adjustment refined feature importance by attenuating age-related effects and enhancing disease-specific signals, improving model interpretability across ethnic groups.
Together, these results emphasize the necessity of ethnically inclusive datasets, stage-aware modeling, and demographic adjustment when developing neuroimaging-based machine learning models for AD. Our findings support a move toward more equitable and biologically informed predictive frameworks and provide a foundation for future work integrating longitudinal data and advanced multimodal modeling to improve early detection and personalized intervention across diverse populations.
Supplemental Material
sj-docx-1-alz-10.1177_13872877261426563 - Supplemental material for Exploring feature importance in machine learning for neuroimaging traits in Alzheimer's disease across a multiethnic cohort
Supplemental material, sj-docx-1-alz-10.1177_13872877261426563 for Exploring feature importance in machine learning for neuroimaging traits in Alzheimer's disease across a multiethnic cohort by Daniel Gibbs, Ben Black, Melissa Petersen, Leigh Johnson, James Hall, Sid E. O’Bryant, Fan Zhang and in Journal of Alzheimer's Disease
Supplemental Material
sj-xlsx-2-alz-10.1177_13872877261426563 - Supplemental material for Exploring feature importance in machine learning for neuroimaging traits in Alzheimer's disease across a multiethnic cohort
Supplemental material, sj-xlsx-2-alz-10.1177_13872877261426563 for Exploring feature importance in machine learning for neuroimaging traits in Alzheimer's disease across a multiethnic cohort by Daniel Gibbs, Ben Black, Melissa Petersen, Leigh Johnson, James Hall, Sid E. O’Bryant, Fan Zhang and in Journal of Alzheimer's Disease
Footnotes
Acknowledgements
We thank the participants and their families for their invaluable contributions to this study. We also acknowledge the investigators and staff of the HABS-HD for their efforts in participant recruitment, data collection, and study coordination.
Ethical considerations
The HABS-HD study was conducted in accordance with the Declaration of Helsinki and was approved by the appropriate Institutional Review Boards. All study procedures involving human participants were reviewed and approved prior to study initiation.
Consent to participate
Written informed consent was obtained from all participants or their legally authorized representatives prior to participation in the study.
Consent for publication
All participants provided consent for the use of their de-identified data for research and publication purposes.
Author contribution(s)
Funding
The authors disclosed receipt of the following financial support for the research, authorship, and/or publication of this article: Research reported in this presentation was supported by the National Institute on Aging of the National Institutes of Health under Award Numbers R01AG054073 and R01AG058533, P41EB015922 and U19AG078109. The content is solely the responsibility of the authors and does not necessarily represent the official views of the National Institutes of Health.
Declaration of conflicting interests
The authors declared the following potential conflicts of interest with respect to the research, authorship, and/or publication of this article: Sid E. O’Bryant has multiple patents pending related to precision medicine technologies for neurodegenerative diseases. He is the founding scientist of Cx Precision Medicine and has served on an Advisory Board for Roche Diagnostics. Dr O’Bryant is an Editorial Board Member of this journal but was not involved in the peer-review process of this article nor had access to any information regarding its peer-review. All other authors have nothing to disclose.
Supplemental material
Supplemental material for this article is available online.
References
Supplementary Material
Please find the following supplemental material available below.
For Open Access articles published under a Creative Commons License, all supplemental material carries the same license as the article it is associated with.
For non-Open Access articles published, all supplemental material carries a non-exclusive license, and permission requests for re-use of supplemental material or any part of supplemental material shall be sent directly to the copyright owner as specified in the copyright notice associated with the article.