
Abstract
Background
YWHAG has been recognized as a promising biomarker for Alzheimer's disease (AD). However, the precise role of YWHAG within the revised 2024 diagnostic framework for AD remains unclear.
Objective
Our study aimed to evaluate YWHAG with established biomarkers to delinea te the role of YWHAG and determine whether it could serve as a complementary biomarker within the 2024 diagnostic criteria.
Methods
We compared YWHAG with established biomarkers among 708 participants from Alzheimer's Disease Neuroimaging Initiative (ADNI) across three domains: 1) diagnostic utility, 2) cross-sectional associations with clinical variables and brain structure, and 3) predictive value for clinical progression risk.
Results
Our results demonstrated the accuracy of YWHAG (AUC = 0.856) was comparable to that of FDG-PET (AUC = 0.912) and HVA (AUC = 0.879), but superior to that of T-tau (AUC = 0.796), NFL (AUC = 0.712), and GFAP (AUC = 0.617) in distinguishing AD versus controls. Moreover, YWHAG was consistently among the top three biomarkers most strongly associated with cognitive decline and brain atrophy, alongside HVA and FDG-PET. Furthermore, the YWHAG positive (Y+) group had a significantly higher risk of AD progression (HR = 2.45, 95% CI: 1.75–3.43) compared to the YWHAG negative (Y-) group (p < 0.001).
Conclusions
We identify YWHAG as a novel biomarker predictive of cognitive decline, brain atrophy, and AD progression. The performances of YWHAG are comparable to established biomarkers such as FDG-PET, HVA and T-tau, thereby providing a complement to the current AD diagnostic framework.
Introduction
Alzheimer's disease (AD), the most prevalent form of dementia, emerges as a major global health challenge due to its substantial mortality, economic burden, and societal impact. 1 However, numerous drug candidates for AD have failed, and no effective therapies are currently available. 2 Compelling evidence reveals that AD neuropathology initiates up to two decades before clinical symptom onset, highlighting a critical window for early intervention to potentially delay disease progression.3–5 This underscores the urgent need for reliable early diagnostic strategies to identify at-risk individuals for timely therapeutic interventions. 1
The National Institute on Aging-Alzheimer's Association (NIA-AA) has recently revised the biomarker classification framework for AD. In the updated criteria, AD biomarkers are categorized into core and non-core classifications. 6 Specifically, core biomarkers comprise two principal categories: “A” [amyloid-β (Aβ) proteinopathy] and “T” (tau pathology), with the latter further subdivided into T1 [phosphorylated tau (p-tau181) and secreted tau] and T2 (tau proteinopathy). 6 Non-core biomarkers encompass four categories: neurodegeneration, inflammation, vascular, and α-synuclein biomarkers (NIVS). For instance, “N” includes neurofilament light chain (NFL), diminished 18F-Fluorodeoxyglucose positron emission tomography (FDG-PET) and atrophic brain structures in magnetic resonance image (MRI); “I” refers to elevated glial fibrillary acidic protein (GFAP); “V” represents vascular brain injury; and “S” indicates elevated α-synuclein (α-Syn-SAA). 6 Notably, the classification of cerebrospinal fluid (CSF) total tau (T-tau) as a T- or N-category biomarker remains debated in the 2024 diagnostic framework, although it is well-established that CSF T-tau alone does not qualify as a core biomarker. 6 This multidimensional approach enhances diagnostic specificity and our understanding of AD pathogenesis.7,8 However, the validation and ranking of non-core biomarkers remain equivocal, creating an urgent need to identify and characterize novel candidates.
YWHAG belongs to the 14-3-3 protein family, a group of seven isoforms (β, γ, ε, ζ, η, τ, and σ), and is encoded by a gene located on chromosome 7q11.23 in humans.9–11 YWHAG encodes the 14-3-3γ isoform, which is abundantly expressed in the brain and predominantly neuronal-localized. 12 Functionally, YWHAG modulates various neural processes, including ion channel regulation, receptor trafficking, and mediates signal transduction through phosphodiesterase interaction.13–15 Moreover, YWHAG plays a critical role in the molecular pathogenesis of neurodevelopmental disorders.16–18 Recent studies reported that YWHAG was mainly expressed during embryonic mouse development; however, its expression was rapidly down-regulated after birth, indicating an indispensable role in neurodevelopment.19–21
Importantly, YWHAG has been strongly implicated in AD pathology. 14-3-3 proteins have been found in neurofibrillary tangles where they interact with microtubule-associated protein tau in AD patients. 22 Moreover, both in vitro and in vivo experiments confirmed that activation of YWHAG increased tau phosphorylation. 15 Previous studies have reported the elevation of YWHAG in AD patients and its significant associations with AD core pathology.23–26 Notably, a recent CSF proteomics study revealed that YWHAG exhibited optimal diagnostic performance for AD. 26 Moreover, another large-scale multi-cohort CSF proteomic study has identified the YWHAG:NPTX2 synaptic protein ratio as a powerful and independent biomarker for predicting the rate of cognitive decline in AD. 24 Despite these promising findings, the precise role of YWHAG within the current AD diagnostic framework remains poorly understood. Therefore, further investigation is needed to illustrate the underlying mechanisms of YWHAG in AD pathology.
Based on these findings, we quantified CSF YWHAG level in the Alzheimer's Disease Neuroimaging Initiative (ADNI) cohort to evaluate its potential classification within the 2024 NIA-AA diagnostic framework. This study aimed to: (1) determine the diagnostic performance of YWHAG in distinguishing AD from cognitively normal (CN) subjects compared to established biomarkers; (2) compare YWHAG with non-core biomarkers by investigating their associations with cognitive measures; and (3) assess the predictive value of YWHAG for disease progression risk, to clarify the specific role of YWHAG in AD diagnostic framework.
Methods
Population
Data utilized in this observational study were sourced from the ADNI database (http://adni.loni.usc.edu/). The ADNI project was launched in 2003 and designed to assess serial changes in clinical, genetic, neuroimaging, biological, and neuropsychological data to investigate the progression of mild cognitive impairment (MCI) and early-stage AD. The enrolled individuals, aged 55 to 90 from 57 clinical sites across the United States and Canada, were classified into three groups: CN, MCI and AD. The study protocol was approved by the institutional review boards of all participating centers, and written informed consent was obtained from all participants or their legally authorized representatives.
All ADNI participants underwent standardized assessment, and diagnosis was assigned according to standard research criteria for either control, MCI, or AD. Respectively, criteria for CN controls include Mini-Mental State Examination (MMSE) scores of 24 or higher and a Clinical Dementia Rating (CDR) score of 0. Patients with MCI were defined as those with an MMSE score between 24 and 30 and a CDR score of 0.5, objective memory impairment as measured by delayed recall of the Wechsler Memory Scale Logical Memory II. Within the MCI group, participants were further classified as early MCI (EMCI) and late MCI (LMCI) according to standardized ADNI operational criteria, based on education-adjusted cutoff scores on the Logical Memory II subtest: for individuals with ≥16 years of education, EMCI is defined by a score of 9–11 and LMCI by a score ≤ 8; for 8–15 years of education, EMCI corresponds to a score of 5–9 and LMCI to a score ≤ 4; and for 0–7 years of education, EMCI is defined by a score of 3–6 and LMCI by a score ≤ 2. All AD participants fulfilled the National Institute of Neurological and Communicative Disorders and Stroke-Alzheimer's Disease and Related Disorders Association criteria for probable AD, with MMSE scores between 20 and 26 and CDR global scores of either 0.5 or 1. We extracted data from the most recent version of the merged document, “ADNIMERGE.csv,” updated on May 20, 2024. The analysis included 708 subjects from the ADNI cohort, consisting of 167 cognitively normal controls, 403 individuals with MCI, and 138 patients clinically diagnosed with AD. For the longitudinal survival analysis, inclusion required at least one follow-up cognitive assessment. Consequently, 15 MCI patients with only baseline data were excluded, resulting in an analytical cohort of n = 388. All participants had baseline data available for CSF YWHAG protein assays, CSF amyloid-β peptide of 42 amino acids (Aβ42), and CSF p-tau181. Supplemental Figure 1 is a flow chart of the derivation of the final study population.
Candidate biomarkers
According to the 2024 revised criteria by NIA-AA, 6 we have assessed the following AD non-core biomarkers: hippocampal volume atrophy (HVA), FDG-PET, CSF T-tau, CSF NFL, CSF GFAP, and CSF α-Syn-SAA, for comparison with YWHAG at baseline.
CSF measurement
All CSF proteins data were extracted from the ADNI database. The levels of 7584 analytes in baseline CSF samples from the ADNI study (n = 758) were assessed using the SomaScan 7 K platform. 27 The overall median coefficients of variation for intra- and inter-plate assays were less than 5%.27,28 CSF samples collected from each ADNI study site were frozen at −80°C and transferred to the laboratory of Washington University for analysis. Protein analyte measurements underwent standard SomaScan data normalization and standardization, followed by quality control of the normalized SomaScan 7 K data using an in-house protocol (https://ida.loni.usc.edu/). After quality control, 7008 analytes from 708 baseline ADNI samples were retained for analysis. The present study focused on 708 baseline ADNI samples, with assays for four selected CSF biomarkers (YWHAG, NFL, GFAP, and α-Syn-SAA), and complete data for CSF Aβ42 and p-tau181. All CSF biomarkers were measured in duplicate and averaged. The inter- and intra-assay coefficients of variation for CSF analytes were consistently below 15%. Further details are available at http://www.adni-info.org.
Neuroimaging
Structural brain imaging was conducted using a Vision 3.0 T or 1.5 T scanner (Siemens, Erlangen, Germany) with T1-weighted scans, utilizing a sagittal volumetric magnetization-prepared rapid gradient echo sequence. Imaging protocols and pre-processing details were available through the ADNI database (https://adni.loni.usc.edu/methods/documents/mri-protocols/). Regional brain volumes and cortical thickness were quantified using FreeSurfer software package, referencing the 2010 Desikan-Killiany atlas. In this study, middle temporal lobe (MTL), entorhinal cortex (EC), whole brain, ventricles, and fusiform gyrus were chosen as key regions of interest (ROIs) for further assessment of brain atrophy. PET imaging data for FDG were preprocessed using the ADNI pipeline (http://adni.loni.usc.edu/datasamples/pet/). MRI scans from each participant's closest visit were segmented and parcellated in native space with FreeSurfer (v.7.1.1) to define ROIs. The standard uptake value ratio (SUVR) for each scan was calculated by dividing the tracer uptake in the target ROIs by the uptake in a predefined reference region. For FDG-PET images, a composite SUVR was calculated by averaging the uptake in predefined MetaROIs (bilateral angular, posterior cingulate, and inferior temporal gyrus) and normalizing it to the mean uptake in the pons/vermis reference region.
Cognitive scores
General cognition was assessed by MMSE, CDR global scores, CDR Sum of Boxes (CDRSB), Alzheimer Disease Assessment Scale 13 score (ADAS-13), and Rey Auditory Verbal Learning Test immediate (RAVLT-i).
ATX measurements
The CSF concentrations of AD core biomarkers, including Aβ42 and p-tau181, were quantified using Roche Elecsys and cobas e601 automated immunoassay systems in ADNI.29,30 For the A and T categories, diagnostic classifications were based on established cutoffs from the ADNI database to determine abnormal (positive/+) or normal (negative/−) test results. Aβ42-positive (A+) individuals were defined as those with CSF Aβ42 concentrations ≤ 1098 pg/ml, while p-tau181-positive (T+) was characterized by CSF p-tau181 levels exceeding a threshold of 26.64 pg/ml.31,32 Our study designated the term “X” to denote the set of non-core biomarkers, including YWHAG, HVA, FDG-PET, T-tau, NFL, GFAP, α-Syn-SAA, and the YWHAG/Aβ42 ratio, to facilitate the subsequent description of combinatorial biomarker patterns. Binary classifications for X markers were based on optimal Youden index-derived cutoffs from receiver operating characteristic (ROC) analyses using AD patients as cases and CN controls. For biomarkers where higher values indicate greater pathology (YWHAG, T-tau, NFL, GFAP, α-Syn-SAA, YWHAG/Aβ42 ratio), a concentration at or above the cutoff was defined as positive (X+), and below as negative (X−). Conversely, for biomarkers where lower values indicate greater pathology (HVA, FDG-PET), a value below the cutoff was defined as positive (X+), and at or above as negative (X−).
Statistical analysis
We conducted a three-step analysis in this study. First, the analysis of non-core biomarkers [including YWHAG, the YWHAG/Aβ42 ratio (which was calculated as the CSF concentration of YWHAG divided by the CSF concentration of Aβ42), HVA, FDG-PET, T-tau, NFL, GFAP, and α-Syn-SAA] levels across the CN, MCI, and AD diagnostic groups was performed using the Kruskal-Wallis test with Dunn's post hoc test for multiple comparisons. Following this, we excluded non-significant markers and assessed the diagnostic accuracy of the core biomarkers (including the CSF concentrations of Aβ42 and p-tau181) and non-core biomarkers using the area under the receiver operating characteristic curve (AUROC) in binary logistic regression models. Subsequently, the statistical significance of differences in AUC between each biomarker and the reference biomarker (YWHAG) was evaluated using DeLong's test. Based on the Youden index-derived cutoff values from ROC analysis, each X marker was classified into two groups: abnormal/normal (positive/negative, +/−).
Second, we utilized multiple linear regression models to assess the cross-sectional associations of each biomarker with cognitive performance, as measured by the MMSE, CDRSB, ADAS-13, and RAVLT-i. All biomarkers and cognitive scores were standardized by subtracting the mean and dividing by the standard deviation (Z-score transformation) to facilitate direct comparison of effect sizes. Model coefficients were estimated using ordinary least squares, with corresponding standard errors derived from the model's variance-covariance matrix. We also applied a multiple linear regression approach to evaluate the associations between biomarkers and brain atrophy (MTL volume, EC thickness, whole brain volume, ventricular system volume, and fusiform gyrus volume). In these analyses, all continuous variables were standardized to Z-scores prior to inclusion in the regression models. All regression models were adjusted for age, sex, education and APOE ε4 carrier status. Statistical significance was assessed with Bonferroni correction for multiple comparisons.
Third, to evaluate the predictive value of biomarkers for clinical progression, we performed the following survival analyses: (a) an unadjusted Kaplan-Meier (K-M) analysis with the log-rank test to examine the transition from MCI to AD. The time-to-event was measured from the baseline MCI to the onset of AD, with study end or dropout serving as censoring points; (b) a standard multivariate Cox proportional hazards model (for each biomarker individually), adjusted for age, sex, education, and APOE ε4 carrier status at baseline; and (c) stratified subgroup analyses based on Aβ42 and biomarker X status. These subgroup analyses were conducted in two stages: (i) comparison between groups defined solely by non-core biomarker X status (X+ versus X−); and (ii) evaluation of combined groups based on both Aβ42 status (A+ or A−) and biomarker X status (A−X−, A−X+, A+ X−, A+ X+). Additionally, to assess the independent contribution of each biomarker while adjusting for potential collinearity, we also fitted a multivariable Cox proportional hazards model that simultaneously included all non-core biomarkers of interest (YWHAG, FDG-PET, HVA, T-tau, NFL, and GFAP) as predictors, alongside adjustments for age, sex, education, and APOE ε4 status.
All statistical significance was considered at a threshold of p < 0.001 for all tests. Data analysis was conducted using R statistical software (version 4.2.2). Key R packages included: pROC for ROC curve analysis (primary for Figure 1); lme4 and lmerTest (where applicable) for linear mixed-effects models (primary for Figure 2); and the survival and survminer packages for conducting and visualizing survival analyses, including Kaplan-Meier estimation and Cox proportional hazards regression (primary for Figure 3). A complete R analysis scripts have been included as Supplemental Material.
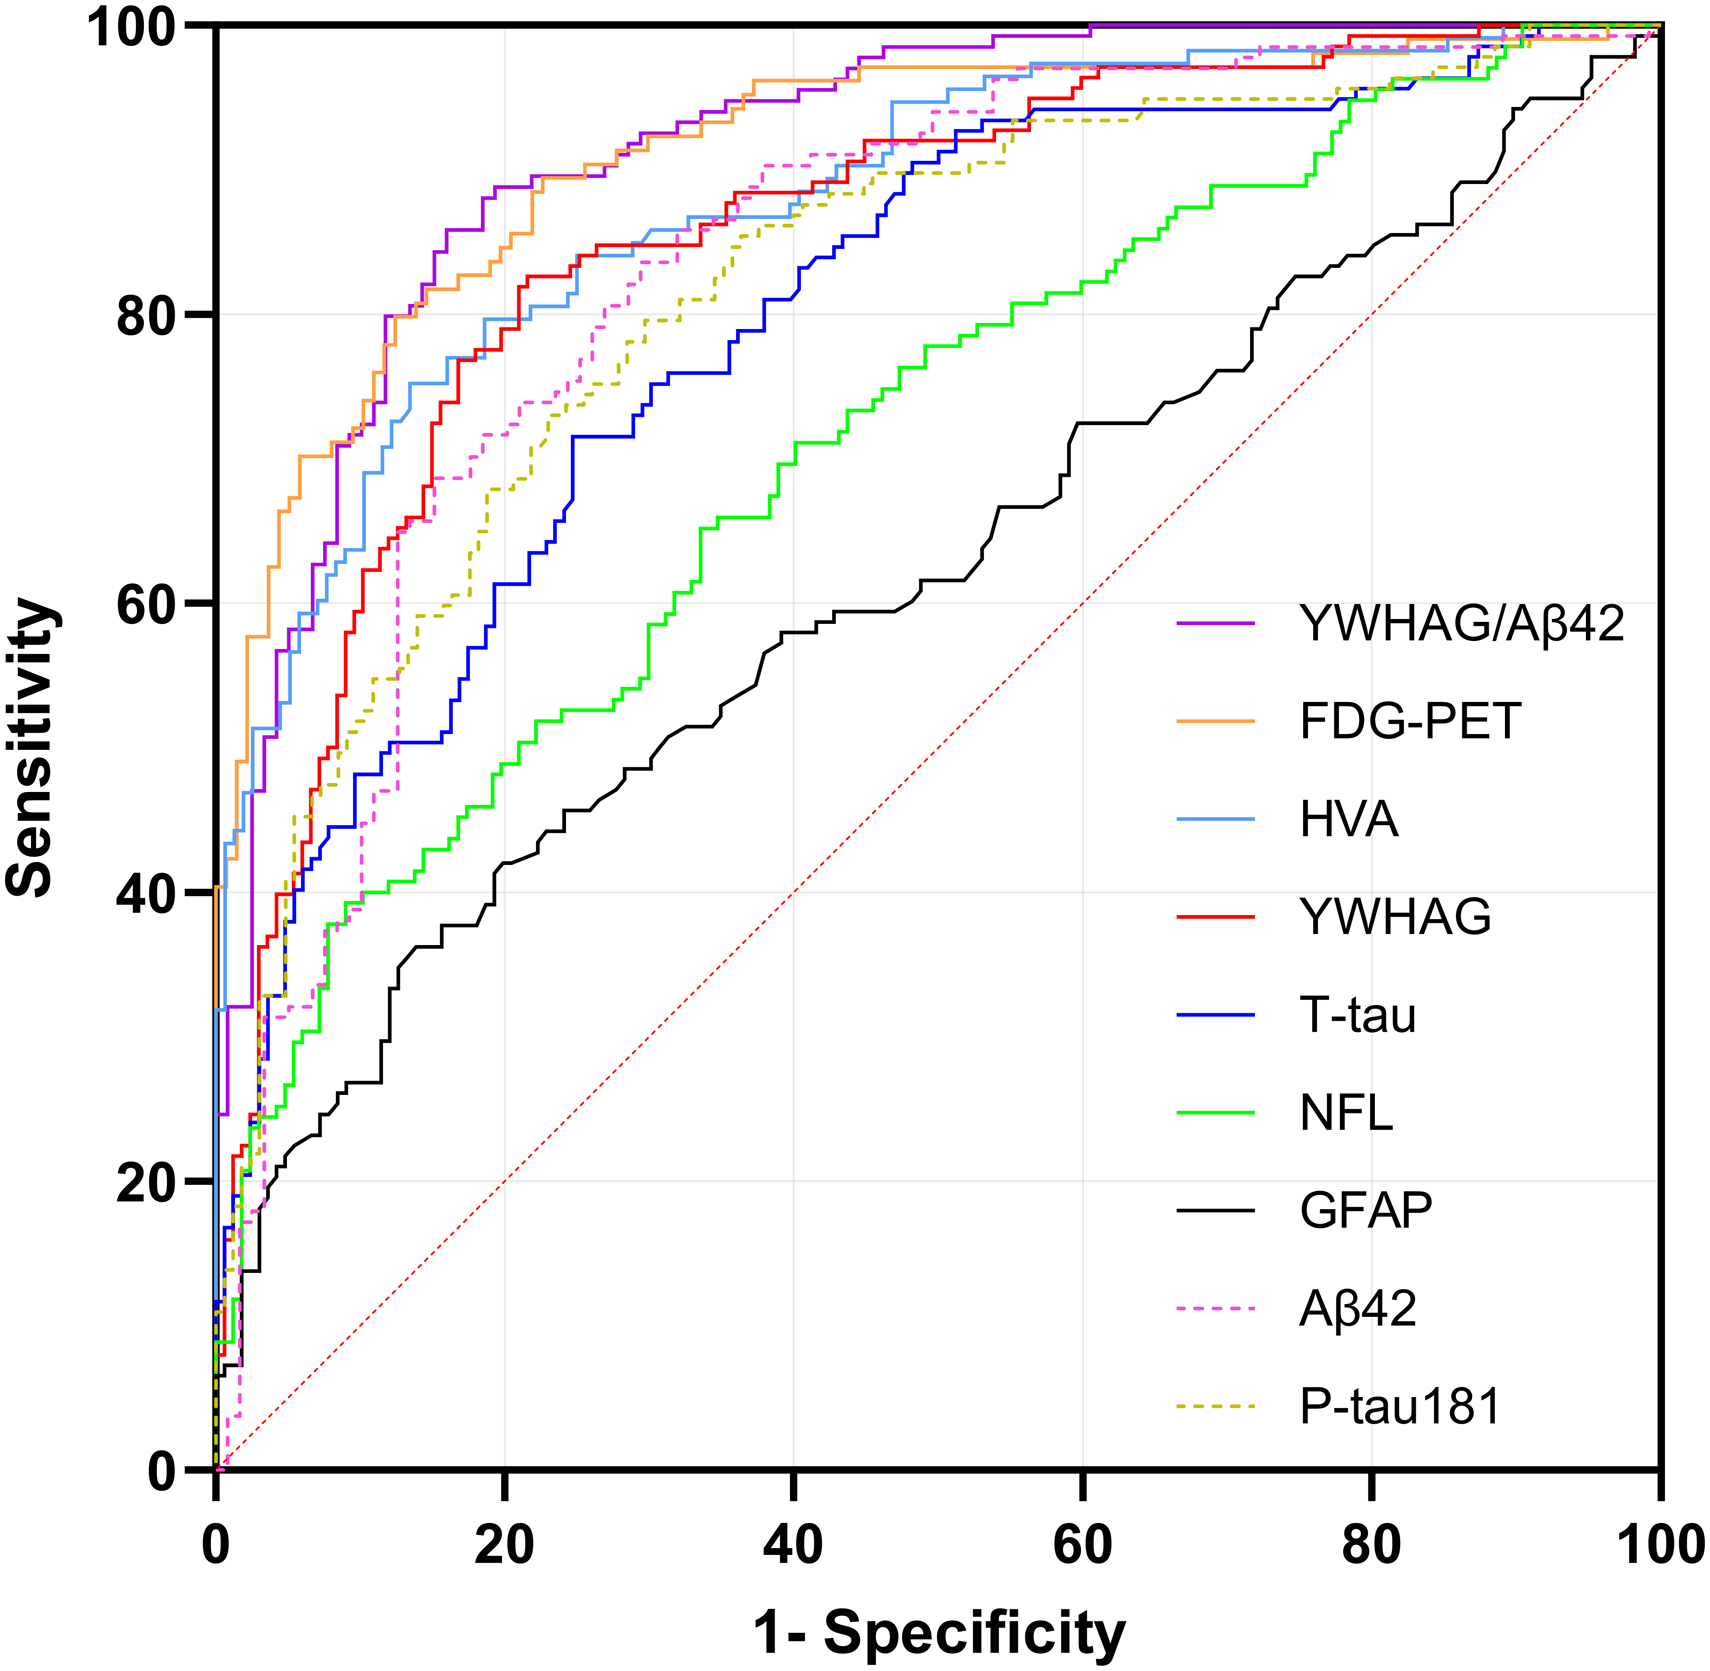
ROC curves for YWHAG and biomarkers for the Alzheimer's disease cases versus cognitively normal subjects. Aβ42: amyloid-β peptide of 42 amino acids; FDG-PET: 18F-fluorodeoxyglucose positron emission tomography; GFAP: glial fibrillary acidic protein; HVA: hippocampal volume atrophy; NFL: neurofilament light; p-tau181: phosphorylated tau at threonine 181; ROC: receiver operating characteristic curve; T-tau: total tau; YWHAG: 14-3-3 protein gamma.
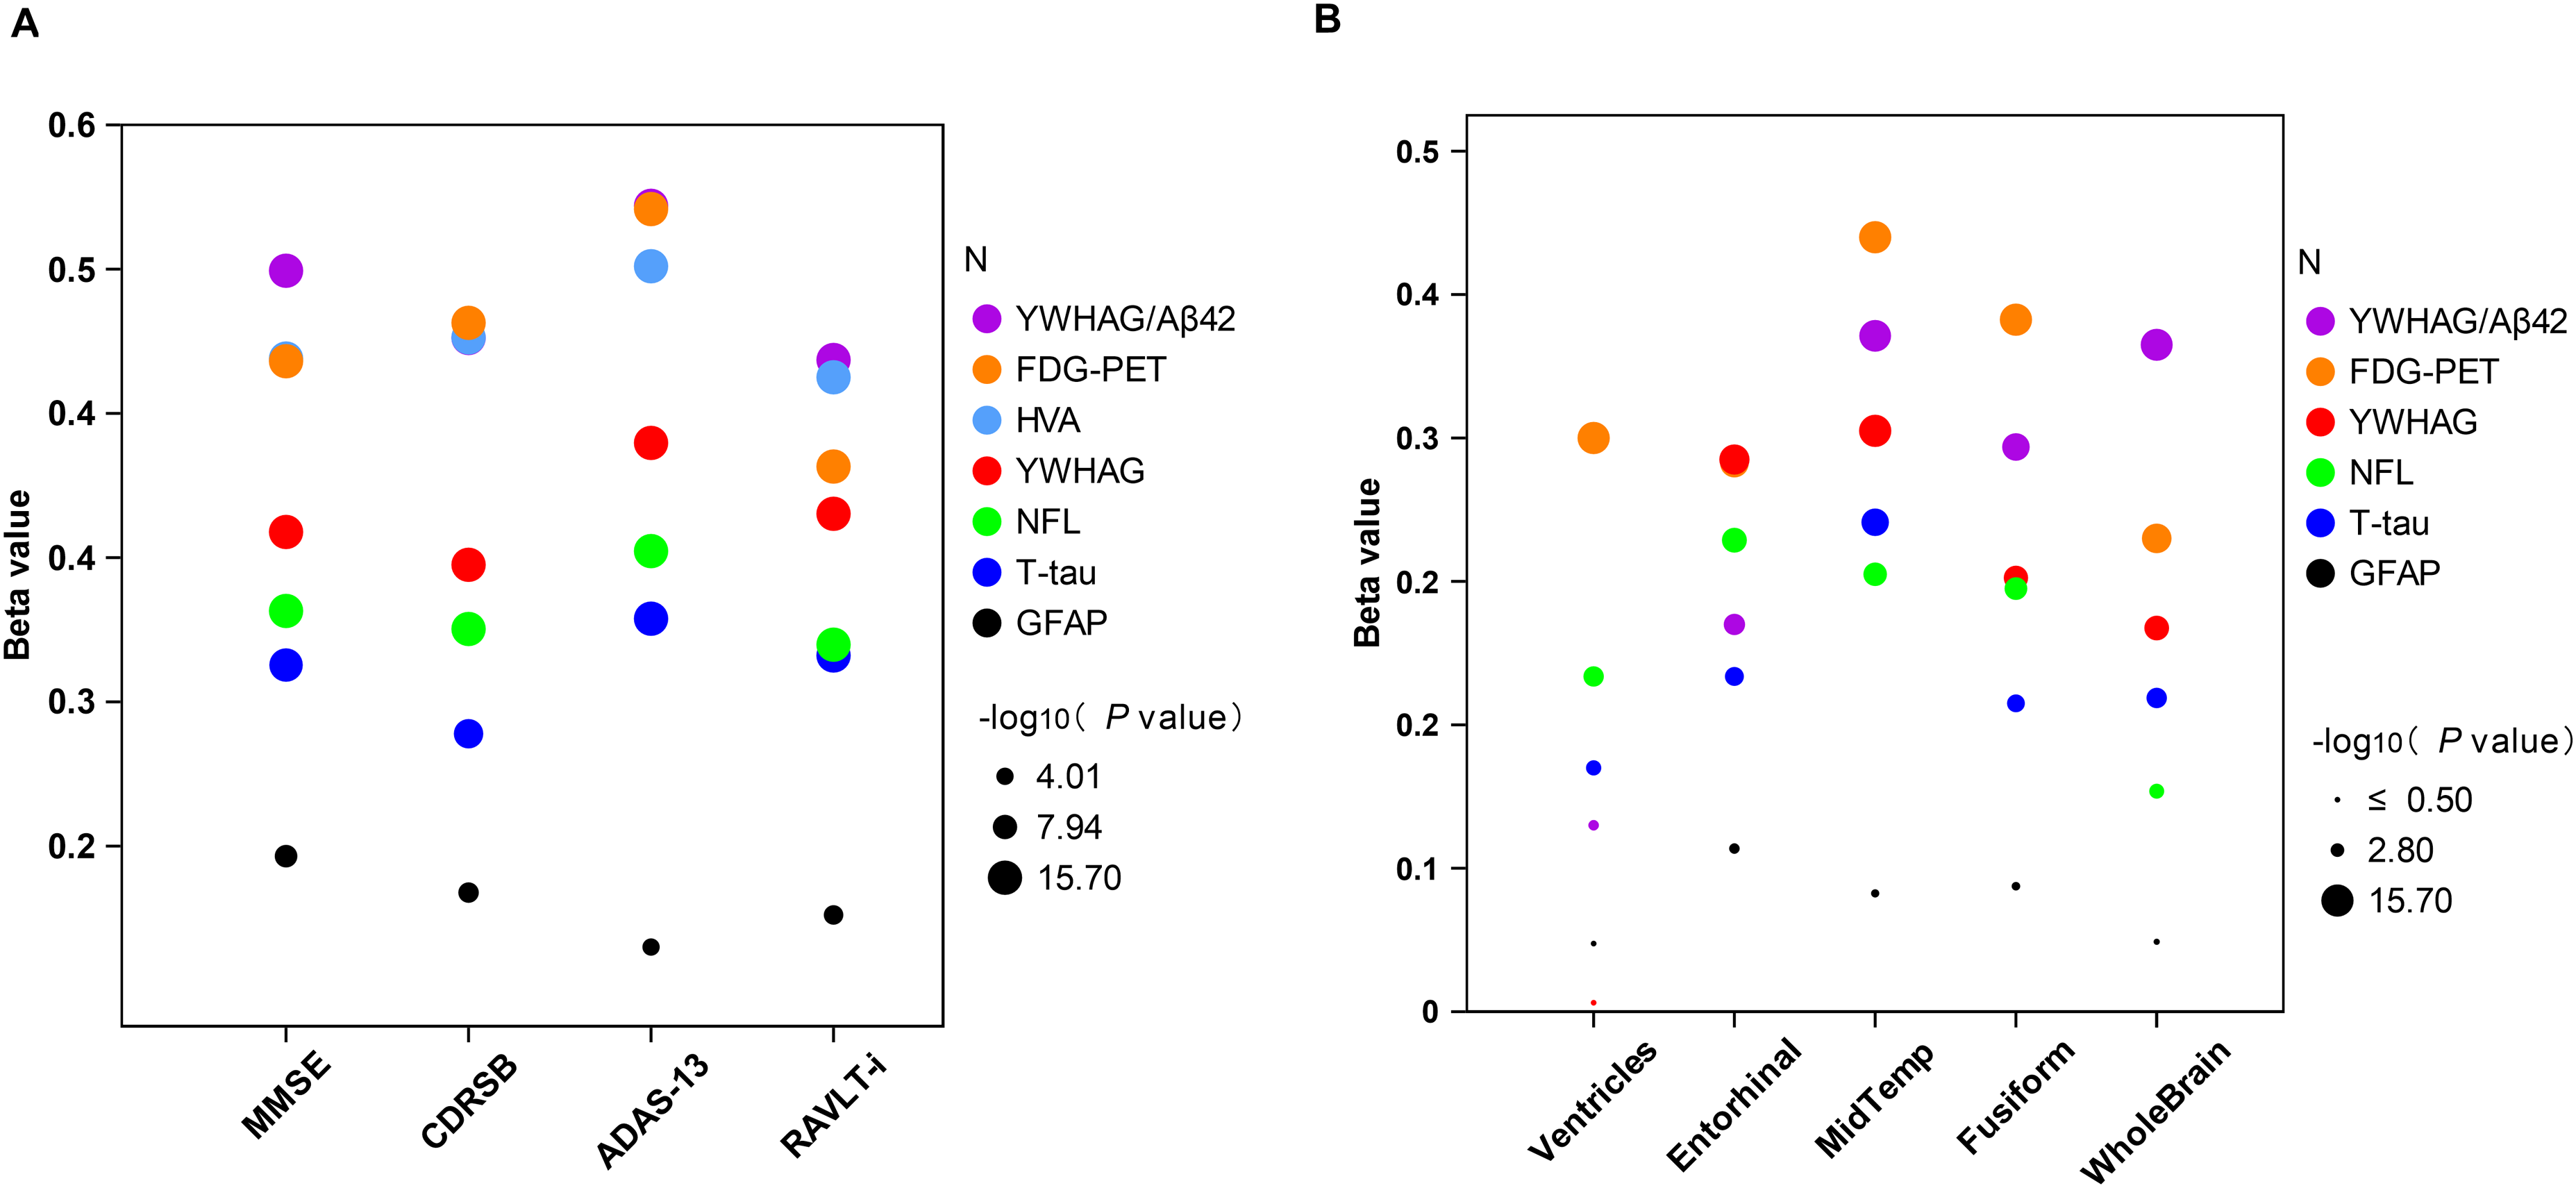
Associations between non-core biomarkers with cognitive scores and imaging markers. All analyses were adjusted for age, sex, education, and APOE ε4 carrier status. All data were standardized to Z-scores prior to inclusion in the regression models. Statistical significance is indicated by the size of the dots, which represent the -log₁₀ (p value). Larger dots denote higher significance. The analysis threshold was set at -log₁₀ (p value) > 3 (p < 0.001). ADAS-13: Alzheimer's Disease Assessment Scale 13 score; CDRSB: Clinical Dementia Rating scale Sum of Boxes; FDG-PET: 18F-Fluorodeoxyglucose positron emission tomography; GFAP: CSF glial fibrillary acidic protein; HVA: hippocampus volume atrophy; MMSE: Mini-Mental State Examination; NFL: CSF neurofilament light; RAVLT-i: Rey Auditory Verbal Learning Test immediate; T-tau: total tau; YWHAG: 14-3-3 protein gamma.
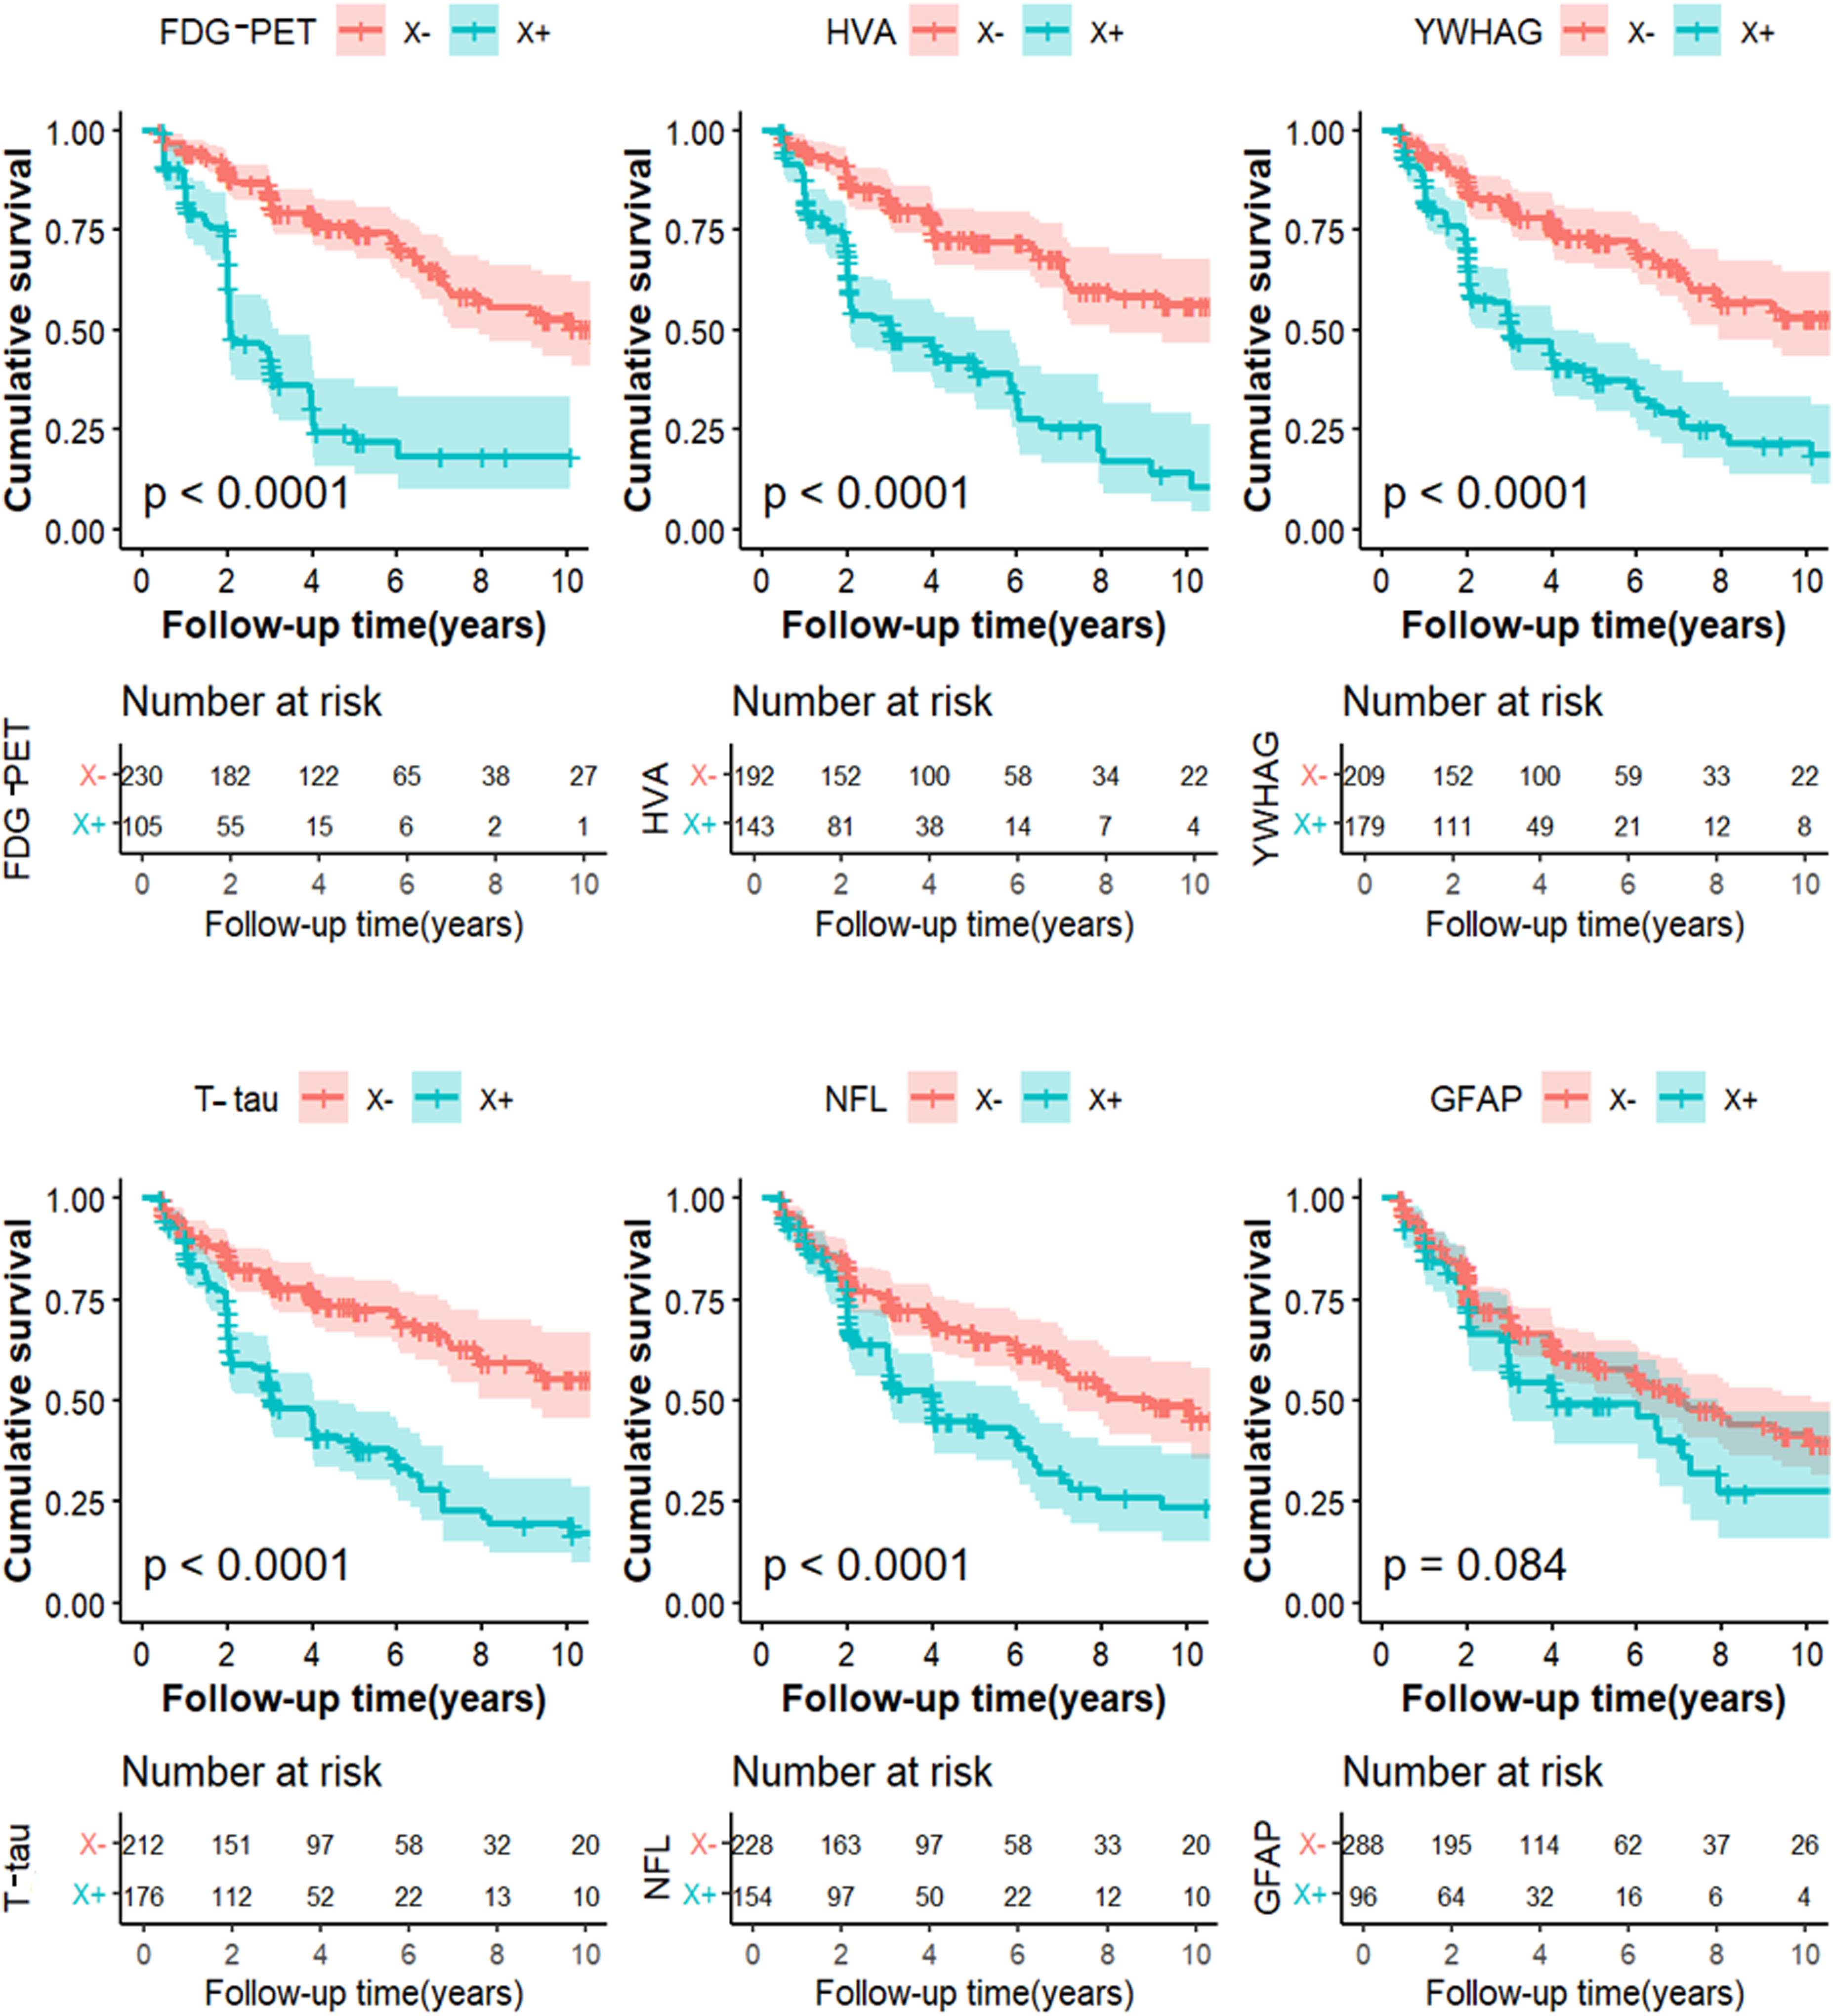
Kaplan-Meier curves showing cumulative probability of clinical disease progression. The comparisons of cumulative probability of clinical progression in non-core biomarkers X- versus X+. The numbers of subjects at different time points were presented. FDG-PET: 18F-Fluorodeoxyglucose positron emission tomography; GFAP: CSF glial fibrillary acidic protein; HVA: hippocampus volume atrophy; NFL: CSF neurofilament light; T-tau: total tau; YWHAG: 14-3-3 protein gamma.
Results
Basic characteristics of the population
We included 708 individuals from the ADNI in our study. Table 1 summarizes the demographic, clinical, psychometric, and CSF biomarker profiles of the included participants (including 167 CN, 403 MCI, and 138 AD). The study population had a median age of 73.7 years (interquartile range, 68.5–78.5 years), a female proportion of 42.8%, a median educational level of 16.0 years (IQR 14–18 years), and an 48.87% APOE ε4 positivity. The three diagnostic groups varied in age and APOE ε4 allele frequency yet were comparable in terms of sex distribution and educational attainment. All research subjects possessed full datasets for CSF Aβ42, p-tau181, criteria used for the stratification of AT groups. Cognitive performances significantly differed between groups (all p < 0.001).
Baseline characteristics of participants stratified by clinical diagnosis.
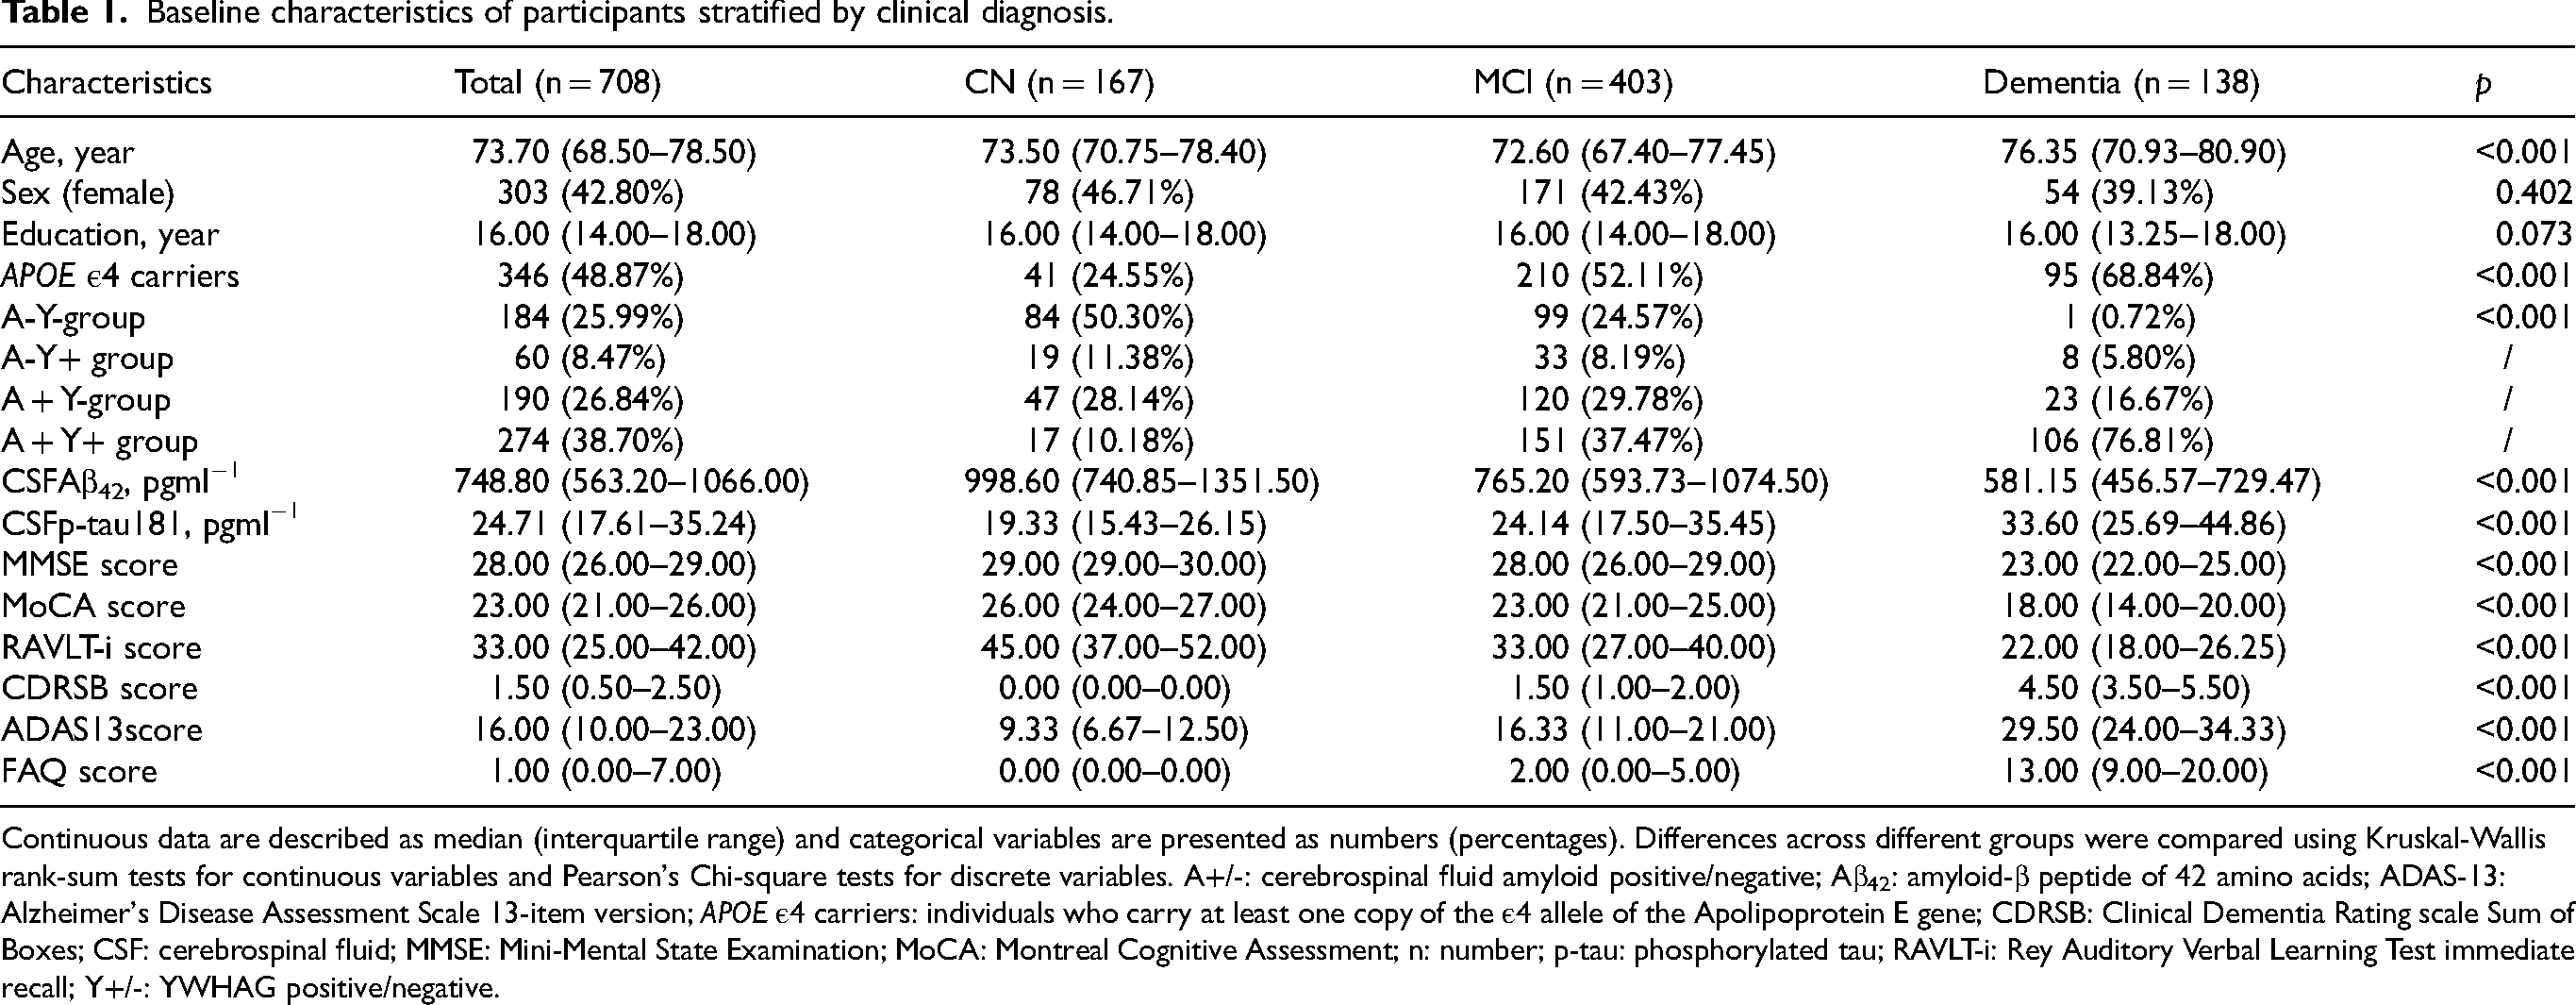
Continuous data are described as median (interquartile range) and categorical variables are presented as numbers (percentages). Differences across different groups were compared using Kruskal-Wallis rank-sum tests for continuous variables and Pearson's Chi-square tests for discrete variables. A+/-: cerebrospinal fluid amyloid positive/negative; Aβ42: amyloid-β peptide of 42 amino acids; ADAS-13: Alzheimer's Disease Assessment Scale 13-item version; APOE ε4 carriers: individuals who carry at least one copy of the ε4 allele of the Apolipoprotein E gene; CDRSB: Clinical Dementia Rating scale Sum of Boxes; CSF: cerebrospinal fluid; MMSE: Mini-Mental State Examination; MoCA: Montreal Cognitive Assessment; n: number; p-tau: phosphorylated tau; RAVLT-i: Rey Auditory Verbal Learning Test immediate recall; Y+/-: YWHAG positive/negative.
Accuracy of YWHAG and candidate biomarkers in clinical AD diagnosis
We first analyzed the baseline levels of seven candidate non-core biomarkers (YWHAG, HVA, FDG-PET, T-tau, NFL, α-Syn-SAA, and GFAP) across CN, MCI, and AD groups. Consistent with prior reports,26,33 HVA and FDG-PET signal significantly declined with disease progression (p < 0.001), while CSF levels of YWHAG, T-tau, and NFL significantly increased (p < 0.001) (Supplemental Figure 2). Since the difference in α-Syn-SAA did not reach statistical significance, we included YWHAG and other five biomarkers (HVA, FDG-PET, T-tau, NFL, and GFAP) for further analysis.
ROC analysis was performed to evaluate the diagnostic performance of YWHAG against non-core biomarkers (detailed sensitivity, specificity, and cutoffs are provided in Supplemental Table 1). The sensitivities and specificities reported for all biomarkers are explicitly contingent upon the specific case (clinically diagnosed AD) and control (CN) cohorts defined in this study and were derived using standard ROC analysis with the R pROC package. FDG-PET showed the highest specificity (87.6%; sensitivity: 79.8%; cutoff: 1.15 SUVR; AUC = 0.912). YWHAG exhibited balanced performance (AUC = 0.856, sensitivity: 82.6%, specificity: 78.4%; cutoff: 3370.55 pg/ml). HVA showed a sensitivity of 75.2% and specificity of 86.5% (AUC = 0.879; cutoff: 6597.50 mm3). T-tau exhibited values of 71.5% sensitivity and 75.3% specificity (AUC = 0.796; cutoff: 279.70 pg/ml). For NFL, sensitivity and specificity were 65.2% and 66.5%, respectively (AUC = 0.712; cutoff: 1028.85 pg/ml). GFAP displayed the lowest sensitivity (36.2%) but high specificity (86.1%) at a cutoff of 40.80 pg/ml (AUC = 0.617). Statistical comparison using DeLong's test revealed that the diagnostic accuracy of YWHAG was comparable to FDG-PET (pDeLong test = 0.063) and HVA (pDeLong test = 0.678), but significantly superior to T-tau, NFL, and GFAP (all pDeLong test < 0.001; Supplemental Table 2).
To further evaluate the discriminatory power, we conducted a direct comparison of YWHAG with AD CSF core biomarkers (Aβ42 and p-tau181). Notably, the identification capacity of YWHAG was comparable to that of Aβ42 (AUC = 0.833, pDeLong test = 0.423) and p-tau181 (AUC = 0.818, pDeLong test = 0.005). In summary, YWHAG emerged as an effective biomarker for identifying clinically diagnosed AD, the performance of which was comparable to established biomarkers: FDG-PET and HVA.
Associations among biomarkers with cognitive scores and neuroimaging indices
In multi-variable models, after adjusting for age, sex, education, and APOE ε4 carrier status at baseline, we comprehensively evaluated the relations of YWHAG and non-core biomarkers with clinical assessment scales in enrolled subjects. Our results revealed that YWHAG, FDG-PET, HVA, T-tau, NFL, and GFAP were all significantly associated with the above cognitive variables (MMSE, RAVLT-i, CDRSB, ADAS-13). When ranked by the absolute value of the regression coefficients (β), HVA and FDG-PET displayed the most pronounced correlations, closely followed by YWHAG and NFL (Figure 2A and Supplemental Table 3). Specifically, YWHAG levels were negatively associated with performance on the MMSE (β = -0.374, p < 0.001) and RAVLT-i (β = -0.384, p < 0.001), and positively correlated with the CDRSB (β = 0.356, p < 0.001) and ADAS-13 (β = 0.424, p < 0.001). Thus, HVA, FDG-PET and YWHAG showed the strongest associations with cognitive decline.
We then assessed the correlations between biomarkers and MRI-derived measurements of brain atrophy (ventricles, entorhinal, middle temporal lobe, fusiform, and whole brain). In contrast to the cognitive correlations, the absolute β values varied across brain regions without a consistent ranking pattern, as showed in Figure 2B and Supplemental Table 4. Nevertheless, YWHAG levels were significantly associated with volumetric atrophy in the entorhinal (β = -0.308, p < 0.001), middle temporal lobe (β = -0.324, p < 0.001), fusiform (β = -0.242, p < 0.001), and whole brain (β = -0.214, p < 0.001), but not with ventricles (p = 0.894). Collectively, after excluding the ventricles, FDG-PET and YWHAG emerged as the top two biomarkers with the strongest correlations to brain structure.
Furthermore, we performed a comprehensive analysis of the associations of AD CSF core biomarkers (Aβ42 and p-tau181) with cognitive assessments and MRI measurements (Supplemental Tables 3 and 4). The absolute β values for YWHAG and Aβ42 showed a mixed pattern, with neither biomarker consistently demonstrating stronger associations across all measures. However, comparisons with p-tau181 revealed that YWHAG's associations were generally stronger, as the absolute β values for p-tau181 were lower than those for YWHAG for most assessments, except for ventricular volume. This finding underscores the potential value of YWHAG, suggesting its utility in the AD diagnostic landscape may rival that of established core biomarkers.
Frequency distributions of cognitive diagnosis and YFH profiles
Based on the analysis of ROC curves and correlation studies, biomarkers YWHAG, FDG-PET, and HVA (collectively termed YFH) exhibited superior performance. Therefore, we utilized the YFH profiles for further descriptive frequency distribution analysis (Figure 4). Specifically, using the dichotomization criteria defined in the Methods, the distribution of clinical cognitive diagnoses across the four YWHAG-FDG-PET (YF) profiles and the distribution of YF profiles across the four cognitive states [CN, EMCI, LMCI, and AD] were illustrated in Figure 4A and B. Subjects were dichotomized as follows: YWHAG levels > 3370.55 pg/mL and ≤ 3370.55 pg/mL defined Y+ and Y− status, respectively; FDG-PET SUVR ≤1.15 and >1.15 defined F+ and F− status, respectively; HVA ≤6597.50 mm3 and >6597.50 mm3 defined H+ and H− status, respectively. Using these binary classifications, each participant was assigned to one of four mutually exclusive YF profiles: Y−F− (both normal), Y + F− (abnormal YWHAG only), Y−F + (abnormal FDG-PET only), and Y + F + (both abnormal). The frequency distribution of clinical diagnoses across these profiles, and the distribution of profiles across clinical stages, was then analyzed and visualized in Figure 4. Firstly, the prevalence of abnormal Y+ in AD was 82.7%, with Y + F− at 15.4% and Y + F+ at 67.3%. In addition, there was a progressive increase in the Y + F+ profile from CN to AD: 5.1% in CN, 9.4% in EMCI, 30.7% in LMCI, and 67.3% in AD. Conversely, the Y−F− profile showed a decline from CN to AD: 70.1% in CN, 58.6% in EMCI, 28.3% in LMCI, and 4.8% in AD. Moreover, the transition from Y-F- to Y + F+ was associated with a rise in AD prevalence (from 2.0% to 48.3%) and a decline in CN prevalence (from 37.8% to 4.8%). These trends suggest that the co-occurrence of abnormal YWHAG and FDG-PET (Y + F+) is strongly associated with disease progression. Similar distribution patterns were observed when HVA was utilized as an alternative to FDG-PET, as detailed in Figure 4C and D.
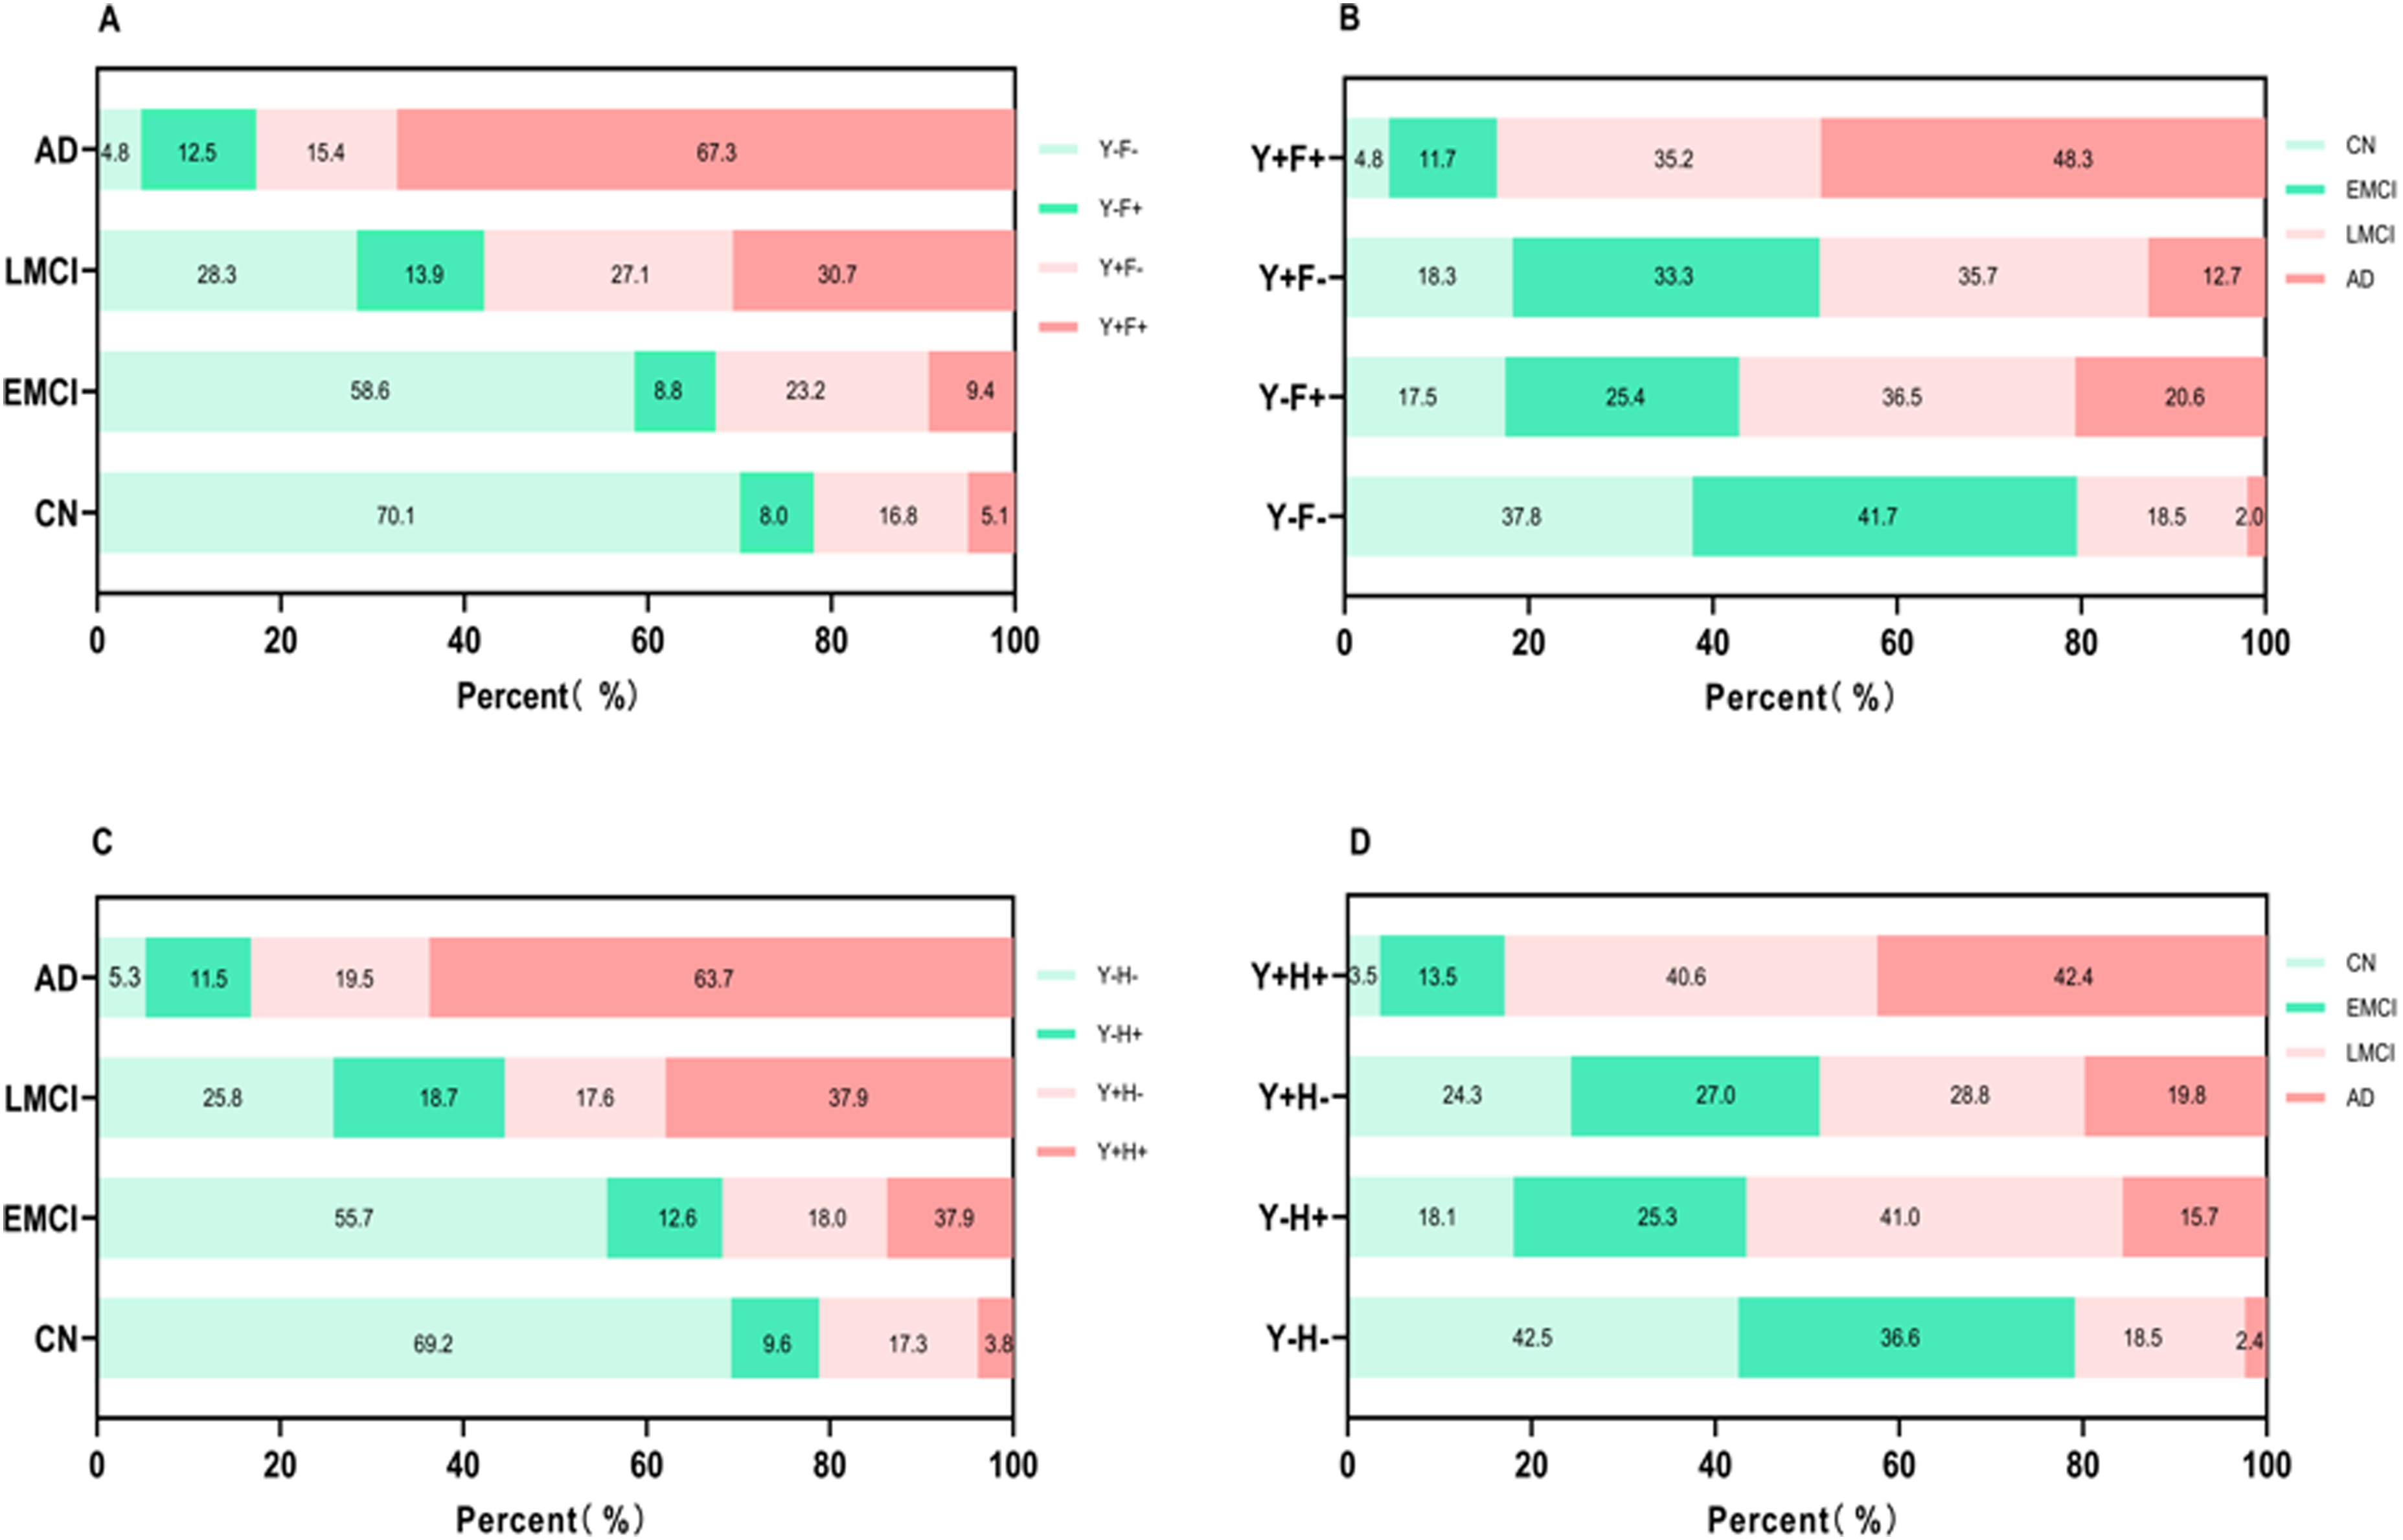
Frequency distributions of cognitive diagnosis and YFH profiles among different groups. Binary classifications were defined as follows: Y + (YWHAG-positive): CSF YWHAG level > 3370.55 pg/mL; Y- (YWHAG-negative): CSF YWHAG level ≤ 3370.55 pg/mL; F + (FDG-PET-positive): SUVR ≤ 1.15; F-(FDG-PET-negative): SUVR > 1.15; H + (HVA-positive): volume ≤ 6597.50 mm3; H- (HVA-negative): volume > 6597.50 mm3. (A) The distributions of the YF profiles in the population with different cognitive states (CN, EMCI, LMCI, and AD). (B) Among the four YF groups, the various distributions of four cognitive states. (C) The distributions of the YH profiles in the population with different cognitive states. (D) Among the four YH groups, the various distributions of four cognitive states. AD: Alzheimer's disease; CN: cognitively normal; EMCI: early mild cognitive impairment; LMCI: late mild cognitive impairment; MCI: mild cognitive impairment; YFH: the biomarker profile combining YWHAG, FDG-PET, and HVA; YF: the profile combining YWHAG and FDG-PET; YH: the profile combining YWHAG and HVA.
Ability of candidate markers to predict future clinical progression
We assessed the predictive accuracy of candidate biomarkers using CSF proteins, imaging, and diagnostic follow-up data (over up to 10 years) in a cohort of 403 individuals with MCI. After excluding 15 individuals who lacked follow-up data, 388 MCI patients were included in the further analysis. Kaplan-Meier analysis was conducted to reveal the predictive performance of biomarkers of interest (Figure 3), and between-group differences were evaluated using the log-rank test. Subsequently, a Cox regression model (Supplemental Table 5), adjusted for age, sex, education, and APOE ε4 carrier status, demonstrated that the YWHAG + subgroup had a significantly higher risk of progression compared to the YWHAG- subgroup (HR = 2.45, 95% CI: 1.75–3.43). When compared against other biomarkers, this risk was only ranked lower than FDG-PET (HR = 4.54, 95% CI: 3.12–6.62) and HVA (HR = 3.29, 95% CI: 2.29–4.72), but was higher than T-tau (HR = 2.38, 95% CI: 1.70–3.33), NFL (HR = 1.9, 95% CI: 1.37–2.64), and GFAP (HR = 1.23, 95% CI: 0.87–1.73).
To further refine the predictive model, we performed a stratification based on the combination of the A biomarker and X biomarker, creating four subgroups (A-X-, A-X+, A+ X-, A+ X+). This analysis showed that the A + Y+ group had a remarkable increased risk of AD conversion (HR = 5.67, 95% CI: 3.15–10.19). Notably, within the A + X+ subgroup, the hazard ratio for YWHAG was higher than GFAP but lower than other biomarkers: HVA (HR = 10.80, 95% CI: 5.08–22.89), FDG-PET (HR = 6.47, 95% CI: 3.47–12.05), NFL (HR = 8.34, 95% CI = 3.89–17.88), and T-tau (HR = 5.83, 95% CI: 3.32–10.23) (Supplemental Table 5).
In the comprehensive multivariable Cox model that included all non-core biomarkers simultaneously, only FDG-PET (HR = 4.91, 95% CI: 3.19–7.58) and HVA (HR = 2.22, 95% CI: 1.48–3.33) retained statistically significant independent associations with progression risk. In this model, the association for YWHAG alone was no longer significant (HR = 1.12, 95% CI: 0.62–2.02), and the hazard ratios for T-tau, NFL, and GFAP also included 1 within their confidence intervals.
Performance of YWHAG/Aβ42
Given the robust performance of YWHAG in the aforementioned analyses, we further evaluated a composite indicator, the YWHAG/Aβ42 ratio. This ratio was assessed for its discriminatory accuracy, associations with clinical and imaging measures, and ability to predict clinical progression. Specifically, ROC analysis demonstrated that YWHAG/Aβ42 ratio achieved the highest diagnostic accuracy (AUC = 0.914, 95% CI: 0.88–0.95), with a sensitivity of 85.8% and specificity of 84.0% (cutoff: 5.08; Figure 1 and Supplemental Table 1). Moreover, associations analyses revealed that the absolute β values for YWHAG/Aβ42 ratio were consistently ranked among the top two correlates, highlighting its robust associations with cognitive decline and cerebral atrophy (Figure 2). Furthermore, K-M analysis revealed that YWHAG/Aβ42+ subgroup had a significantly higher risk of clinical progression than the YWHAG/Aβ42− subgroup (HR = 4.14; Supplemental Figure 3), and this risk was only ranked lower than FDG-PET (Supplemental Table 5). In summary, these results indicate that YWHAG/Aβ42 ratio demonstrate superior overall performance compared to other individual biomarkers. Therefore, it is imperative to integrate YWHAG into the biological research framework for AD.
Discussion
Through head-to-head comparisons of YWHAG with core and non-core biomarkers, we confirmed that YWHAG was a good discriminator with relatively high values for AD compared to CN subjects. Specifically, the clinical value of YWHAG in distinguishing AD from CN was comparable to that of FDG-PET or HVA, but superior to T-tau, NFL, and GFAP. Beyond its diagnostic utility, YWHAG levels showed a significant association with the clinical and neurodegenerative progression of AD. Indeed, YWHAG was more strongly associated with cognitive decline and brain atrophy than T-tau, NFL, and GFAP, and only ranked lower than FDG-PET and HVA. Moreover, YWHAG also showed significant prognostic value, as MCI patients with elevated YWHAG levels exhibited a substantially higher rate of progression to AD compared to YWHAG− individuals. The rate of disease progression in the YWHAG+ subgroup was markedly exceeding the progression rate of the NFL+ and GFAP+ groups, although it remained lower than that of the FDG-PET+ cohort. In a comprehensive model including all non-core biomarkers, FDG-PET and HVA retained independent significance, whereas the association for YWHAG alone was no longer significant. This finding refines, rather than diminishes, the interpretation of YWHAG's value. It suggests that YWHAG's predictive signal overlaps with the neurodegenerative processes captured by FDG-PET and HVA, which is consistent with its role in tau pathology. This also highlights that combining molecular CSF biomarkers like YWHAG with imaging markers may provide the most robust prediction in AD. Collectively, these findings position YWHAG as a biomarker with performance comparable to the leading established non-core biomarkers: FDG-PET, HVA, and T-tau.
Our finding that YWHAG is markedly elevated in AD patients and effectively distinguishes AD from CN subjects is consistent with previous reports.23–26 This conclusion is further strengthened by a recent proteomic study which confirmed that CSF YWHAG exhibited robust discriminatory capacity for AD in both African American and Caucasian populations. 25 Moreover, a prior publication examining the correlation between Epstein-Barr virus infection and the pathogenesis of AD, has identified a cohort of differentially expressed genes, with the YWHAG gene emerging as a notable candidate. 34 Furthermore, through an unbiased proteomic analysis of 3397 individuals, the YWHAG:NPTX2 synaptic protein ratio was established as a powerful and independent biomarker for predicting the rate of cognitive decline in AD. 24 While previous studies have established the general diagnostic utility of various biomarkers,26,35–37 our study provides the comprehensive evaluation of YWHAG specifically within the context of the revised 2024 AD diagnostic framework, delineating its diagnostic performance and prognostic utility by systematically comparing it against core and non-core biomarkers, thereby effectively addressing this gap in the literature.
Beyond the diagnostic ability, YWHAG is strongly associated with cognitive decline and AD susceptible areas. We used several cognitive scales and MRI scans to investigate declines in cognitive function reductions and brain volume loss. Consistent with our expectations, individuals with higher levels of YWHAG exhibited poorer cognitive performance, which was aligned with previous researches, linking YWHAG to cognitive impairment. 25 Moreover, YWHAG also demonstrated robust predictive value for MCI-to-AD progression. Given that the MCI population represents a critical target for early intervention due to their high risk of cognitive deterioration, 38 this predictive capability is of particular clinical importance. Our study reveals that the progression risk associated with elevated YWHAG was comparable to established biomarkers HVA and FDG-PET, but superior to T-tau, NFL and GFAP. These findings strongly support the role of YWHAG as a promising biomarker for early AD detection and risk stratification.
Current evidence demonstrates that cortical volume loss initially targets the middle temporal lobe and limbic territories, subsequently progresses to parietal association regions, and ultimately spreads to frontal and primary cortices.39,40 Our findings demonstrate that elevated YWHAG levels are associated with volumetric reductions in key brain regions, including the entorhinal cortex, middle temporal lobe, fusiform gyrus, and whole brain volume. These results align with established neuropathological evidence showing YWHAG up-regulation in AD affected brain regions, particularly in the frontal cortex and hippocampus. 34 Nevertheless, a conflicting study reported that YWHAG expression was decreased in the frontal cortex in AD patients. 41 Given this discrepancy, the precise relationship between YWHAG levels and regional brain atrophy remains unclear, highlighting the need for further research to elucidate the specific role of YWHAG in neurodegenerative processes.
Collectively, our study provides significant advancements in AD diagnostics by systematically evaluating novel biomarkers within the NIA-AA framework. Specifically, the integration of YWHAG into clinical practice could enhance diagnostic accuracy, particularly in distinguishing MCI from early AD. However, this study has several limitations that warrant consideration. Firstly, the dichotomization of continuous biomarker data may obscure subtle pathological gradients. Secondly, the longitudinal CSF analysis is constrained by a relatively small sample size, potentially limiting the generalizability of our findings. Thirdly, the single-center design may introduce selection bias, necessitating validation in multi-center cohorts. Future research directions should validate these findings in larger, diverse cohorts, and more experimental studies are needed to investigate the potential mechanism of YWHAG in the pathogenesis of AD.
Conclusions
In conclusion, these findings suggest that individuals with higher levels of YWHAG have worse cognition, accelerated brain atrophy and an increased likelihood of progression from MCI to AD. The performances of YWHAG are comparable to the established non-core biomarkers, including FDG-PET, HVA, and T-tau. It is recommended to regard YWHAG as a novel and important biomarker in AD research framework. This work could be a complement to the diagnostic framework for AD.
Supplemental Material
sj-R-1-alz-10.1177_13872877261450474 - Supplemental material for YWHAG as a novel biomarker in Alzheimer's disease biological research framework
Supplemental material, sj-R-1-alz-10.1177_13872877261450474 for YWHAG as a novel biomarker in Alzheimer's disease biological research framework by Qing-Fei Zhao, Liang-Yu Huang, Yang-Ke Zhu, He-Ying Hu, Hui-Fu Wang, Wei Zhang, Hao Hu, Lan Tan and in Journal of Alzheimer's Disease
Supplemental Material
sj-docx-2-alz-10.1177_13872877261450474 - Supplemental material for YWHAG as a novel biomarker in Alzheimer's disease biological research framework
Supplemental material, sj-docx-2-alz-10.1177_13872877261450474 for YWHAG as a novel biomarker in Alzheimer's disease biological research framework by Qing-Fei Zhao, Liang-Yu Huang, Yang-Ke Zhu, He-Ying Hu, Hui-Fu Wang, Wei Zhang, Hao Hu, Lan Tan and in Journal of Alzheimer's Disease
Footnotes
Acknowledgements
Data collection and sharing for this project was funded by the Alzheimer's Disease Neuroimaging Initiative (ADNI) (National Institutes of Health Grant U01 AG024904) and DOD ADNI (Department of Defense award number W81XWH-12-2-0012). ADNI is funded by the National Institute on Aging, the National Institute of Biomedical Imaging and Bioengineering, and through generous contributions from the following: AbbVie, Alzheimer's Association; Alzheimer's Drug Discovery Foundation; Araclon Biotech; BioClinica, Inc.; Biogen; Bristol-Myers Squibb Company; CereSpir, Inc.; Cogstate; Eisai Inc.; Elan Pharmaceuticals, Inc.; Eli Lilly and Company; EuroImmun; F. Hoffmann-La Roche Ltd and its affiliated company Genentech, Inc.; Fujirebio; GE Healthcare; IXICO Ltd; Janssen Alzheimer Immunotherapy Research & Development, LLC.; Johnson & Johnson Pharmaceutical Research & Development LLC.; Lumosity; Lundbeck; Merck & Co., Inc.; Meso Scale Diagnostics, LLC.; NeuroRx Research; Neurotrack Technologies; Novartis Pharmaceuticals Corporation; Pfizer Inc.; Piramal Imaging; Servier; Takeda Pharmaceutical Company; and Transition Therapeutics. The Canadian Institutes of Health Research is providing funds to support ADNI clinical sites in Canada. Private sector contributions are facilitated by the Foundation for the National Institutes of Health (www. fnih.org). The grantee organization is the Northern California Institute for Research and Education, and the study is coordinated by the Alzheimer's Therapeutic Research Institute at the University of Southern California. ADNI data are disseminated by the Laboratory for Neuro-Imaging at the University of Southern California.
Ethical considerations
The study procedures were approved by the institutional review boards of all participating centres (http://adni.loni.usc.edu/wp-content/uploads/how_to_apply/ADNI_Acknowledgement_List.pdf), and written informed consent was obtained from all participants or their authorised representatives according to the Declaration of Helsinki (consent for research). Ethics approval was obtained from the institutional review boards of each institution involved: Oregon Health and Science University; University of Southern California; University of California—San Diego; University of Michigan; Mayo Clinic, Rochester; Baylor College of Medicine; Columbia University Medical Center; Washington University, St Louis; University of Alabama at Birmingham; Mount Sinai School of Medicine; Rush University Medical Center; Wien Center; Johns Hopkins University; New York University; Duke University Medical Center; University of Pennsylvania; University of Kentucky; University of Pittsburgh; University of Rochester Medical Center; University of California, Irvine; University of Texas Southwestern Medical School; Emory University; University of Kansas, Medical Center; University of California, Los Angeles; Mayo Clinic, Jacksonville; Indiana University; Yale University School of Medicine; McGill University, Montreal-Jewish General Hospital; Sunnybrook Health Sciences, Ontario; U.BC Clinic for AD & Related Disorders; Cognitive Neurology—St Joseph's, Ontario; Cleveland Clinic Lou Ruvo Center for Brain Health; Northwestern University; Premiere Research Inst (Palm Beach Neurology); Georgetown University Medical Center; Brigham and Women's Hospital; Stanford University; Banner Sun Health Research Institute; Boston University; Howard University; Case Western Reserve University; University of California, Davis—Sacramento; Neurological Care of CNY; Parkwood Hospital; University of Wisconsin; University of California, Irvine-BIC; Banner Alzheimer's Institute; Dent Neurologic Institute; Ohio State University; Albany Medical College; Hartford Hospital, Olin Neuropsychiatry Research Center; Dartmouth-Hitchcock Medical Center; Wake Forest University Health Sciences; Rhode Island Hospital; Butler Hospital; UC San Francisco; Medical University South Carolina; St Joseph's Health Care Nathan Kline Institute; University of Iowa College of Medicine; Cornell University and University of South Florida: USF Health Byrd Alzheimer's Institute. The investigators within the ADNI contributed to the design and implementation of the ADNI and/or provided data but did not participate in analysis or writing of this report. A complete listing of ADNI investigators can be found online (http://adni.loni.usc.edu/![]() ).
).
Consent to participate
Not applicable
Author contribution(s)
Funding
The authors disclosed receipt of the following financial support for the research, authorship, and/or publication of this article: This study was supported by grants from the National Natural Science Foundation of China (grant number 82201587), Taishan Young Scholarship (NO.tsqn202408399) and the Science and Technology Innovation 2030 Major Projects (grant number 2022ZD0211600).
Declaration of conflicting interests
The authors declared no potential conflicts of interest with respect to the research, authorship, and/or publication of this article.
Data availability statement
The datasets supporting the conclusions of this article are available in the publicly available ADNI database. The datasets used and/or analyzed during the current study are available from the corresponding author on reasonable request.
Supplemental material
Supplemental material for this article is available online.
References
Supplementary Material
Please find the following supplemental material available below.
For Open Access articles published under a Creative Commons License, all supplemental material carries the same license as the article it is associated with.
For non-Open Access articles published, all supplemental material carries a non-exclusive license, and permission requests for re-use of supplemental material or any part of supplemental material shall be sent directly to the copyright owner as specified in the copyright notice associated with the article.