
Abstract
Background
Alzheimer's disease (AD) is a neurodegenerative disorder whose incidence grows with age and its development is gradual. However, if detected earlier there is much hope to prevent further exacerbation. In this study, NGS transcriptomics data from cases and controls with Braak scores of III-IV were investigated that all possessed neurofibrillary tangles (NFTs) in their fusiform gyrus.
Objective
The aim of this study was to discover the underlying mechanisms at gene level which could explain cognitive impairment by considering the presence of NFTs in both groups.
Methods
Differentially expressed genes (DEGs) were determined and ROC AUC were evaluated by leave-one-out cross-validation method on the diagnostic DEGs to detect candidate gene biomarkers. WGCNA was employed to identify co-expression modules with their trait association. Finally, in silico hybridization of lncRNAs from potential biomarkers with important AD-related microRNAs was carried out.
Results
Highly ranked potential diagnostic gene biomarkers revealed assessed AUC ranges of 80–90% in which RASGRF2-AS1 demonstrated the highest value. WGCNA demonstrated upregulated genes in favor of dephosphorylation of tau, proper proteostasis and vascular health in resilient controls whereas dysfunctional proteostasis, chronic protein misfolding, heightened cellular stress and tetrahydrobiopterin deficiency were attributed to cognitive impairment in AD patients. In silico analyses predicted some lncRNAs with a high possibility of acting as sponge for AD-related microRNAs.
Conclusions
This study discovered potential diagnostic gene biomarkers and transcriptional signatures that could explain the mechanisms of cognitive decline by considering the existence of NFTs, which could provide further insight for diagnosis and treatment of the disease.
Introduction
Alzheimer's disease (AD) is the most common neurodegenerative disorder and the leading cause of dementia, characterized neuropathologically by the presence of extracellular amyloid-β (Aβ) plaques and intracellular neurofibrillary tangles (NFTs) composed of hyperphosphorylated tau proteins. 1 The presence of NFTs could be an indicator of AD, which could serve as a diagnostic hallmark and a mechanistic contributor to the synaptic and neuronal dysfunction that weakens cognitive power. 2 However, they could be observed in cognitively normal individuals as well. AD is a gradual disease which involves continuous development of NFTs in different areas of the brain indicated by different stages. In order to classify these stages, Braak scoring—which is invented by Heiko Braak—is used to classify various degrees of pathology in AD after autopsy of a brain which includes 6 stages: initial stages (I-II) in which NFTs are mainly confined to the entorhinal region of the brain, moderate stages (III-IV) indicative of the involvement in limbic regions such as the hippocampus and finally severe stages (V-VI) which demonstrate moderate to severe neocortical involvement. 3 The Nun Study, demonstrated for the first time that while neocortical NFTs were exclusive to those with dementia, NFTs in the hippocampus were also remarkably prevalent among the cognitively normal individuals. In that study, NFTs were present in the hippocampal subiculum of all cognitively normal individuals and in the cornu ammonis area 1 (CA1) region of 50% of them. 4 Another postmortem study had demonstrated that NFTs could be present in the entorhinal cortex and hippocampus of many cognitively normal elderly, suggesting that even healthy people can harbor NFTs without manifesting cognitive impairment. 5 Strikingly, as reported in another study more than 50% of cognitively unimpaired individuals demonstrated Braak scores of III-IV, without manifesting clinical dementia. 6 However, it seems more appropriate to consider these individuals as cognitively healthy controls who were resilient and clinically unimpaired, regardless of underlying tau pathology. NFTs could also be present in the neocortex, which includes the fusiform gyrus as well. In Braak stages III and IV, NFTs extend from the transentorhinal and entorhinal regions into limbic areas, including the hippocampus and neocortical regions such as fusiform gyrus. This indicates that the pathology of AD has progressed significantly, affecting areas responsible for higher cognitive functions. Damage to the fusiform gyrus at this stage can lead to difficulties in recognizing faces and processing visual information, contributing to the overall cognitive decline in AD patients. 7 It was also demonstrated that accumulation of phosphorylated tau in the fusiform gyrus was found to be associated with impaired name retrieval in older adults, indicating its importance in semantic memory and cognitive processing. 8 AD is a neurodegenerative disorder characterized by memory loss and cognitive decline and NFTs are key drivers of it. A reason that NFTs have been investigated in this study is that they are produced and accumulated inside the cytoplasm of neuronal cells 9 where they can affect the vast networks of coding and non-coding genes that govern the molecular mechanisms of AD pathology and have the potential to alter transcriptomic profiles of neurons, making them highly relevant to study gene expression networks and differences when NFTs exist in both case and controls. Thus, genes could be discovered that would explain the pathogenesis of AD when NFTs are present to unravel the genuine mechanism of the disease by comparing differences in transcriptomics data. By discovering these genes, it is highly possible to target specific genes to prevent further exacerbation of the disease or at least slow the progression down as a preemptive action or use them for diagnosis. Gene-based diagnostic biomarkers are molecular indicators derived from an individual's genetic material that can provide information about the disease's pathology. Unlike traditional biomarkers, which often measure proteins or metabolites, gene-based biomarkers detect changes at the genetic or transcriptomics levels. RNAs have emerged as significant contributors to disease mechanisms. Among them, long non-coding RNAs (lncRNAs) play key roles in AD by influencing pathological processes such as Aβ plaque formation, tau protein hyperphosphorylation and neuroinflammation. It has been demonstrated that some lncRNAs could act as a blood biomarker in AD. 10 lncRNAs can interact with proteins and microRNAs (miRNAs) to modulate the disease mechanisms, by either promoting or inhibiting the pathology.11,12 Because of their involvement in these critical processes, lncRNAs are promising candidates as diagnostic biomarkers which could also serve as potential therapeutic targets in AD.
In this high throughput transcriptomics analysis, a comparison between 14 AD patients versus 16 cognitively-healthy controls which possessed Braak score of either III or IV was carried out. As observed earlier the presence of solely NFTs is not sufficient to cause dementia and some brains compensate that pathology through various genes and co-expressed gene networks, whereas the AD patients could not tolerate these burdens by manifesting compromised networks of genes. The purpose of this study was to identify these genes and transcriptomic signatures involved in the pathogenesis of AD at moderate stages and to nominate potential diagnostic biomarker candidates that appear independent of overt NFTs and the interconnected gene networks as well. Finally, since novel lncRNAs were identified which have not been characterized so far, in slilico analysis of these genes have been implemented in order to discover if they could have a potential role as sponge on well-known brain miRNAs involved in AD. The information curated from this dataset are exploratory and proposed for further validation of the mechanism of AD and hopefully could be used for prognosis as well; however, establishing clinical diagnostic application requires more investigation.
Methods
Sample data curation
RNA-seq data based on Illumina sequencing from post-mortem fusiform gyrus tissues were acquired from NCBI sequence read archive (SRA), under BioProject accession number PRJNA377568 which included 117 postmortem samples. 13 In this study, all high-quality samples based on the criterion of RIN ≥7 that had Braak scores of either III (11 samples) or IV (19 samples) were shortlisted which summed up to 30 samples.
RNA-seq analysis workflow
Linux environment of Ubuntu 24.04.2 LTS was used in Windows subsystem for Linux (WSL) terminal (v2.4.13.0). The required RNA-seq SRA files were downloaded by prefetch command of SRA Toolkit (v3.0.3). Then they were converted to .fastq file format by fastq-dump to get the paired-end files. For quality control FastQC (v0.12.1) was used. Subsequently, Fastp (v0.23.4) was implemented to perform trimming of low-quality bases from the beginning of the reads and keeping minimum length of 18 bp with a total Phred score cut off of 20. Hisat2 (v2.2.1) was used for reference aligning to create the SAM files and then the corresponding BAM files were created by Samtools (v1.19.2). Finally, FeatureCounts (v2.0.6) along with GENCODE annotation file (v49) was used to produce gene count matrix from the BAM files.
Sample and count matrix analysis
First, detection of potential sample outliers was performed by a combination of robust principal component analysis (PCA) based on gene expression profiles following variance-stabilizing transformation (VST). For PCA-based detection, orthogonal distances from the PCA space were computed using the PcaGrid algorithm implemented from the rrcov package (v1.7.7), which takes advantage of the robust principal component analysis. According to this method, samples with distances exceeding the median+2.5×MAD (median absolute deviation) threshold were regarded as outliers. The raw count matrix containing all genes (coding and non-coding) was analyzed by DEseq2 package (v1.46.0) in RStudio (v2025.09). All analyses were performed using R (v4.5.2) and Bioconductor (v3.21) and relevant packages were loaded as required. Sample metadata, including sex (male, female), diagnosis (control, Alzheimer) along other information were curated and imported into R, with sample identifiers set as row names and categorical variables defined as factors using control and female as reference (Supplementary file 1).
Curation of genes
Since the data were obtained from postmortem samples, contamination from cells originating from heterogeneous tissues could occur. In particular, residual blood cells within the fragile vascular network of postmortem brain tissue of the elderly, can strongly contribute to peripheral RNA signals as observed in RNA-seq datasets. To mitigate this issue, GTEx could be a reliable reference for highly expressed tissue-specific genes in specific organs despite its low-level contamination. 14 To minimize contamination from non-brain tissues in this bulk brain RNA-seq dataset, genes whose maximum expression was observed in non-neural tissues were identified using GTEx v8 TPM data. These non-brain-dominant coding genes were defined as those for which the highest mean transcripts per million (TPM) occurred in a non-brain tissue (excluding brain, nerve or other neuronal tissue). Because some coding genes on this list might be expressed in fusiform gyrus, in order to avoid removing genuinely expressed genes in the final gene count matrix, genes from this list that had RNA expression of per sample TPM (pTPM) ≥ 10 in the fusiform gyrus based on Human Protein Atlas 15 were removed from the non-brain gene list. Therefore, this count matrix excluded genes whose dominant expression was in non-brain tissues while retaining genes with substantial expression in the fusiform gyrus, ensuring that brain-relevant genes were preserved. For the remaining genes with Ensembl ID which existed on GTEx, an additional filtering procedure was implemented to identify and exclude genes that could never be related to brain tissue. For that purpose, genes that did not exhibit dominant expression in brain tissues were initially classified as borderline. These genes were reclassified as never-brain genes if they satisfied all of the following conditions: (i) their highest expression level in any brain tissue was below 1 TPM, (ii) their expression in non-brain tissues was at least ten times higher than in brain tissues, (iii) brain tissues accounted for less than 10% of the gene's overall expression across all tissues and (iv) no brain tissue appeared among the top 20% of tissues when tissues were ranked by expression level. This conservative, multi-criterion approach ensured the exclusion of genes with expression patterns incompatible with brain while minimizing the risk of removing genuinely brain-associated genes. Genes meeting these criteria were designated as non-brain associated and were excluded from the final count matrix for subsequent downstream analyses.
Differential gene expression analyses
Differential gene expression analyses were carried out by DESeq2 using two modeling strategies: design1 (age at death + postmortem interval + RIN score + diagnosis + sex), which was evaluated using two contrasts. Contrast one included AD versus control, along with all covariates. Through this approach, genes associated with AD were identified while accounting for available covariates. Visualizations of this setting included PCA on variance-stabilized counts, MA plot, volcano plot and heatmap to summarize differential expression results. EnhancedVolcano (v1.24.0), ComplexHeatmap (v2.24.1), ggplot2 (v4.0.0), tidyr (v1.3.1), and dplyr (v1.1.4) were used for plotting and data handling. Contrast two included male versus female, to control for the influence of disease status. This contrast enabled the detection of genes exhibiting baseline sex-biased expression independent of AD diagnosis. Design 2 (age at death + postmortem interval + RIN score + sex * diagnosis) was used which included all covariates with an interaction term between sex and diagnosis. This specification allowed the main effect of sex and diagnosis to be estimated while also enabling the detection of their interaction. Through this model, genes were identified for which the influence of AD differed between males and females, thereby capturing sex-specific transcriptional responses after adjusting for all covariates. Top differentially expressed genes (DEGs) were depicted on the corresponding volcano plots. In all analyses, the Wald test was applied, and p-values were adjusted using the false discovery rate (FDR) with a significance threshold of padj < 0.05 and log2 fold-change cutoff of |log2FC| ≥ 1.
AUC-ROC analysis
In this study, the DEGs from the first design contrast one were examined to identify potential biomarkers for AD. Receiver operating characteristic (ROC) with area under the curve (AUC) calculation was carried to find out potential diagnostic gene biomarkers. For biomarker discovery, a cross-validation strategy specifically tailored to the constraints of our small cohort (N = 30) was implemented. Rather than adopting conventional k-fold cross-validation, which risks unstable splits when sample sizes are limited, leave-one-out cross-validation (LOOCV) strategy was implemented. To minimize overfitting given our limited sample numbers, each candidate gene was modeled independently using Firth's bias-reduced logistic regression. Thus, each LOOCV model included only one predictor (the gene expression), rather than all genes simultaneously. This approach ensured that every individual contributed to both model training and testing, thereby maximizing data utilization to produce more reliable performance estimates in small-sample numbers, providing nearly unbiased performance estimates. Following VST of RNA-seq counts with DESeq2, the expression data was merged with the metadata (sex, diagnosis). Each candidate gene was then evaluated using Firth's bias-reduced logistic regression implemented in package logistf (v1.26.1), a method chosen for its robustness against separation issues that commonly arise in small datasets. In each LOOCV iteration, one sample was withheld as the test case, while the remaining samples were used for training. Predictions were generated for the held-out individual and this procedure was repeated until every participant had served once as the test case. Bootstrap confidence intervals for variance explained metrics were computed using the boot package (v1.3.32). Model performance was quantified using the AUC and computed with the pROC package (v1.19.0.1). AUCs were calculated for each gene across the full cohort as well as separately for males and females to identify potential sex-specific differences. The absolute male-female AUC difference was computed as a measure of sex bias. To evaluate biomarker robustness, each gene was re-estimated on the complete dataset using Firth logistic regression to obtain associated p-values and FDR-adjusted p-values, along with bootstrap-based variance metrics. Permutation testing was conducted to assess whether the observed predictive performance arose by chance or not. Diagnosis labels were randomly shuffled 1000 times per gene, LOOCV AUCs were recalculated for each permutation and empirical p-values were derived as the proportion of permuted AUCs exceeding the observed AUC. This approach addressed the risk of overfitting in the small cohort. Finally, biomarker candidates were assigned to confidence tiers based on LOOCV performance and classified according to sex-stratified predictive profiles.
WGCNA
Weighted gene co-expression network analysis (WGCNA) was implemented to construct gene co-expression networks, detect modules of correlated genes and relate these modules to phenotypic or clinical traits. Since the number of identified DEGs was insufficient for constructing robust gene co-expression networks, a variance-based filtering strategy was implemented to capture the most variable genes across all samples, thereby ensuring sufficient gene representation and network complexity. Genes were ranked by median absolute deviation (MAD) across samples to prioritize highly variable genes. An empirical optimization procedure was performed in which multiple candidate gene set sizes were evaluated for network quality to select the ideal combination based on scale-free topology fit, mean connectivity, module number, proportion of unassigned (grey) genes and module–trait associations. Based on this multi-criteria assessment, the most variable genes (N = 10500) were selected for construction of the final WGCNA network. Raw RNA-seq count data were filtered to remove sparsely expressed genes, retaining only those with normalized counts > 5 in at least 50% of samples. With the aid of WGCNA package (v1.73), the analysis was carried out on these high-variance genes in an unsupervised manner to identify gene modules based on co-expression patterns. By taking the minimum power 12, the scale-free topology fit index (R2) > 0.80 and mean connectivity (Mean.k) of around 13 was achieved, which provided a good balance between topology and sparsity. This approach allowed the discovery of biologically relevant merged module eigengenes associated with the traits of sex, diagnosis and Braak score. Module eigengenes (MEs), representing the principal component of each gene co-expression module, were correlated with the mentioned sample traits. Categorical traits were numerically encoded to allow quantitative analysis. Pearson correlation coefficient (r) was calculated between each module eigengene and each trait. Statistical significance of these correlations was assessed using Student's t-test and adjusted for multiple comparisons using the Benjamini–Hochberg FDR. Outputs were visualized in a heatmap to identify modules significantly associated with sex, disease status and Braak score. Gene co-expression networks were constructed. For each module of interest, an adjacency matrix was first computed from pairwise correlations between gene expression profiles, using a soft-thresholding approach. From the adjacency matrix, a Topological Overlap Matrix (TOM) similarity was derived to capture both direct and shared connections among genes. TOM similarity was converted to dissimilarity (1-TOM) and used for hierarchical clustering with average linkage. For network creation and visualization of customized plots, igraph (v2.1.4) and ggraph (v2.2.2) packages were used. For each module, the top 40 most connected genes were selected. Network diagrams were generated with nodes sized according to kWithin and edges weighted based on the TOM, with top 10 hub genes and their connected genes labeled.
lncRNA and microRNA sponge prediction
To investigate the potential sponge interactions between identified lncRNAs and well-established AD-associated miRNAs, 14 mature miRNAs and transcripts which could serve as an lncRNA from 23 DEGs whose LOOCV ROC AUC was over 70%, were curated in FASTA format with their corresponding Ensembl transcript identifiers. Only those transcripts were shortlisted that had a reciprocal relation with the expression of a given miRNA. It is noteworthy that despite SYTL4 being a coding gene, it had a single transcript that could act as an lncRNA.
Since the secondary structure of RNA molecules strongly influences miRNA's access to target regions, local structural accessibility was estimated for each lncRNA using RNAplfold from the ViennaRNA Package 16 (v2.7.0). RNAplfold was executed with a window size of 80 nucleotides, a maximum pairing span of 40 nucleotides and an unpaired-region length of one. Base-wise unpaired probabilities (Pu[i]) were extracted and averaged across each predicted binding site to obtain a site-specific structural accessibility value. Then potential miRNA–lncRNA interactions were predicted with RNAhybrid 17 (v2.1.2), which identifies energetically favorable miRNA-target duplexes using minimum free energy (MFE) calculations. RNAhybrid was run with strict seed matching enabled, defining nucleotides 2–8 of the miRNA as the seed region and using 5000 Monte Carlo shuffles for statistical validation. All reported sites were retained without a fixed limit on the number of predicted sites per miRNA-lncRNA pair. Each predicted site was classified into a seed category (8mer, 7mer-A1, 7mer-m8, 6mer or non-canonical) based on base-pairing patterns. Canonical seed classes were assigned higher weights (8mer: 4.0, 7mer-A1: 3.5, 7mer-m8: 3.0, 6mer: 2.0 and non-canonical: 0.5) reflecting biologically preferred modes of miRNA recognition.
For each predicted miRNA binding site, multiple features including seed class, RNAhybrid statistical significance, minimum free energy and local structural accessibility were integrated into a composite site-level score reflecting relative binding strength.
To quantify the overall sponging potential of each lncRNA transcript, site-level scores were further aggregated at the transcript level to estimate a transcript-specific sponge potential, incorporating binding site density, diversity of interacting miRNAs, average binding strength and structural accessibility. A Final Combined Score was computed for each miRNA–transcript pair to summarize overall interaction strength.
Because multiple transcript isoforms can belong to the same gene and interact with the same miRNA, transcript-level data were aggregated to generate a gene-centric dataset. For gene-level aggregation, a score with optimal variance (site quality score, integrated site score, or final combined score) was selected and normalized to a 0–1 range using min-max scaling: Normalized score = (score – min score)/(max score – min score)
For each gene-miRNA pair, normalized scores from all transcript isoforms of that gene were summed to produce a cumulative gene-miRNA interaction score. Genes were then ranked by their overall sponging potential (sum of all gene-miRNA pair scores across all miRNAs targeting that gene) and the top 20 genes were selected for heatmap visualization. This custom analysis pipeline was implemented in Python (v3.13) using pandas (v2.3.0) for data handling, numpy (2.3.0) for numerical operations. Transcript-level and gene-level miRNA–lncRNA interaction heatmaps were generated using matplotlib (v3.10.3) and seaborn (v0.13.2).
Results
Included samples and genes
Examination of all samples did not show any outlier according to the implemented criteria (Figure 1). The final count matrix resulted in overall 56610 genes including coding and non-coding ones.
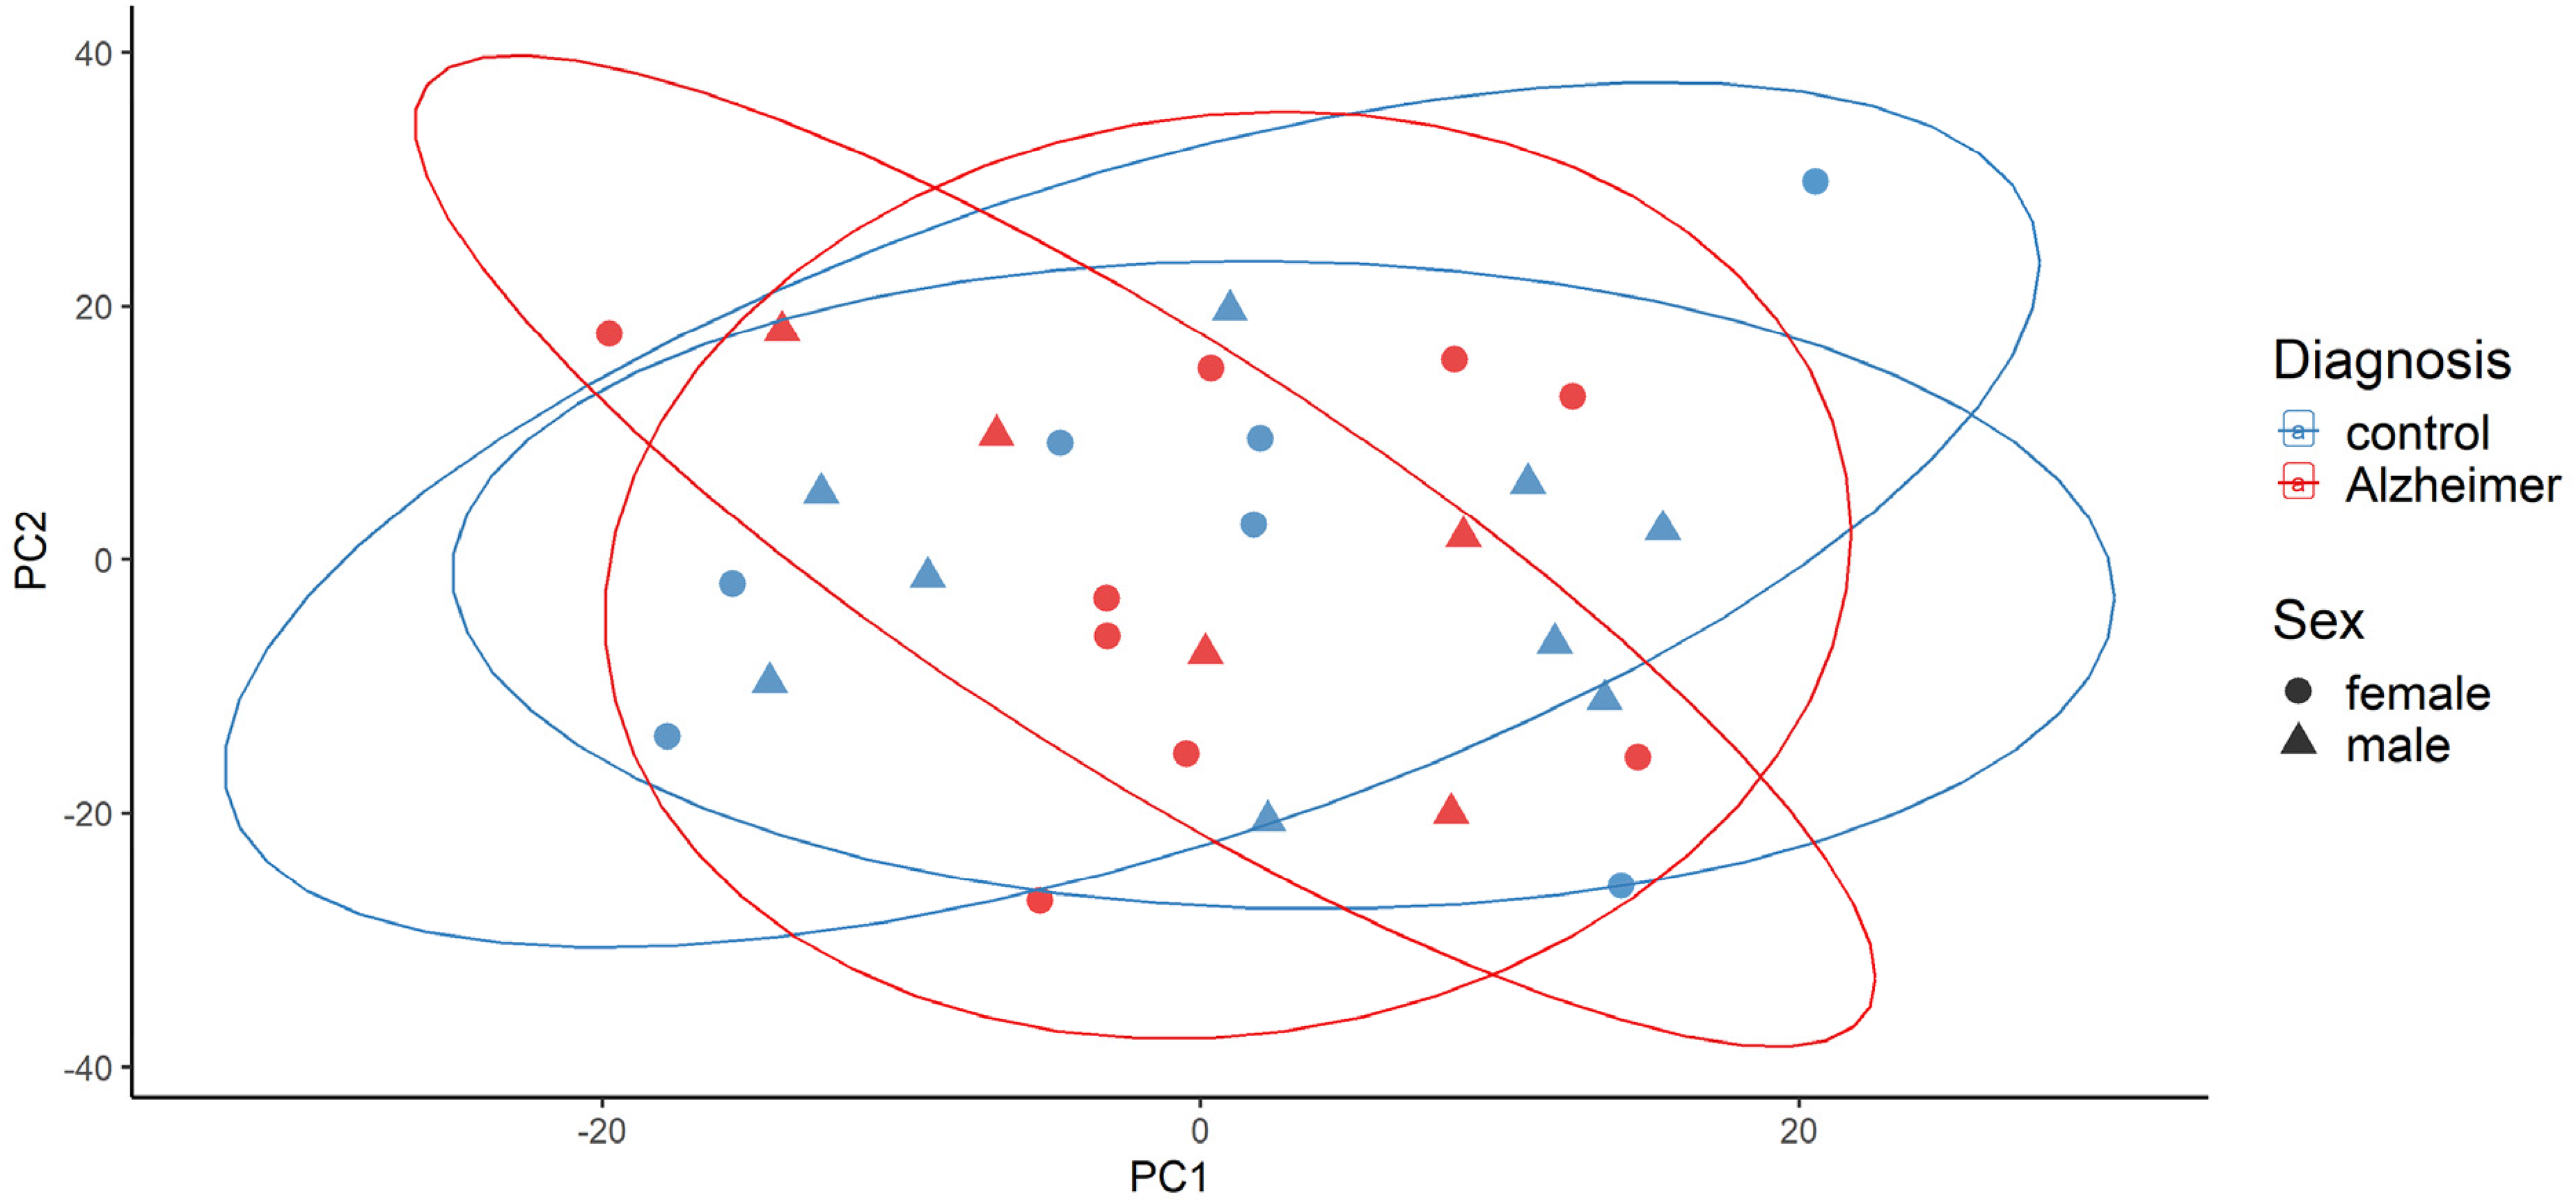
PCA plot for detection of potential outliers by robust PCA analysis of samples using the first principal components.
Analyzed DEGs
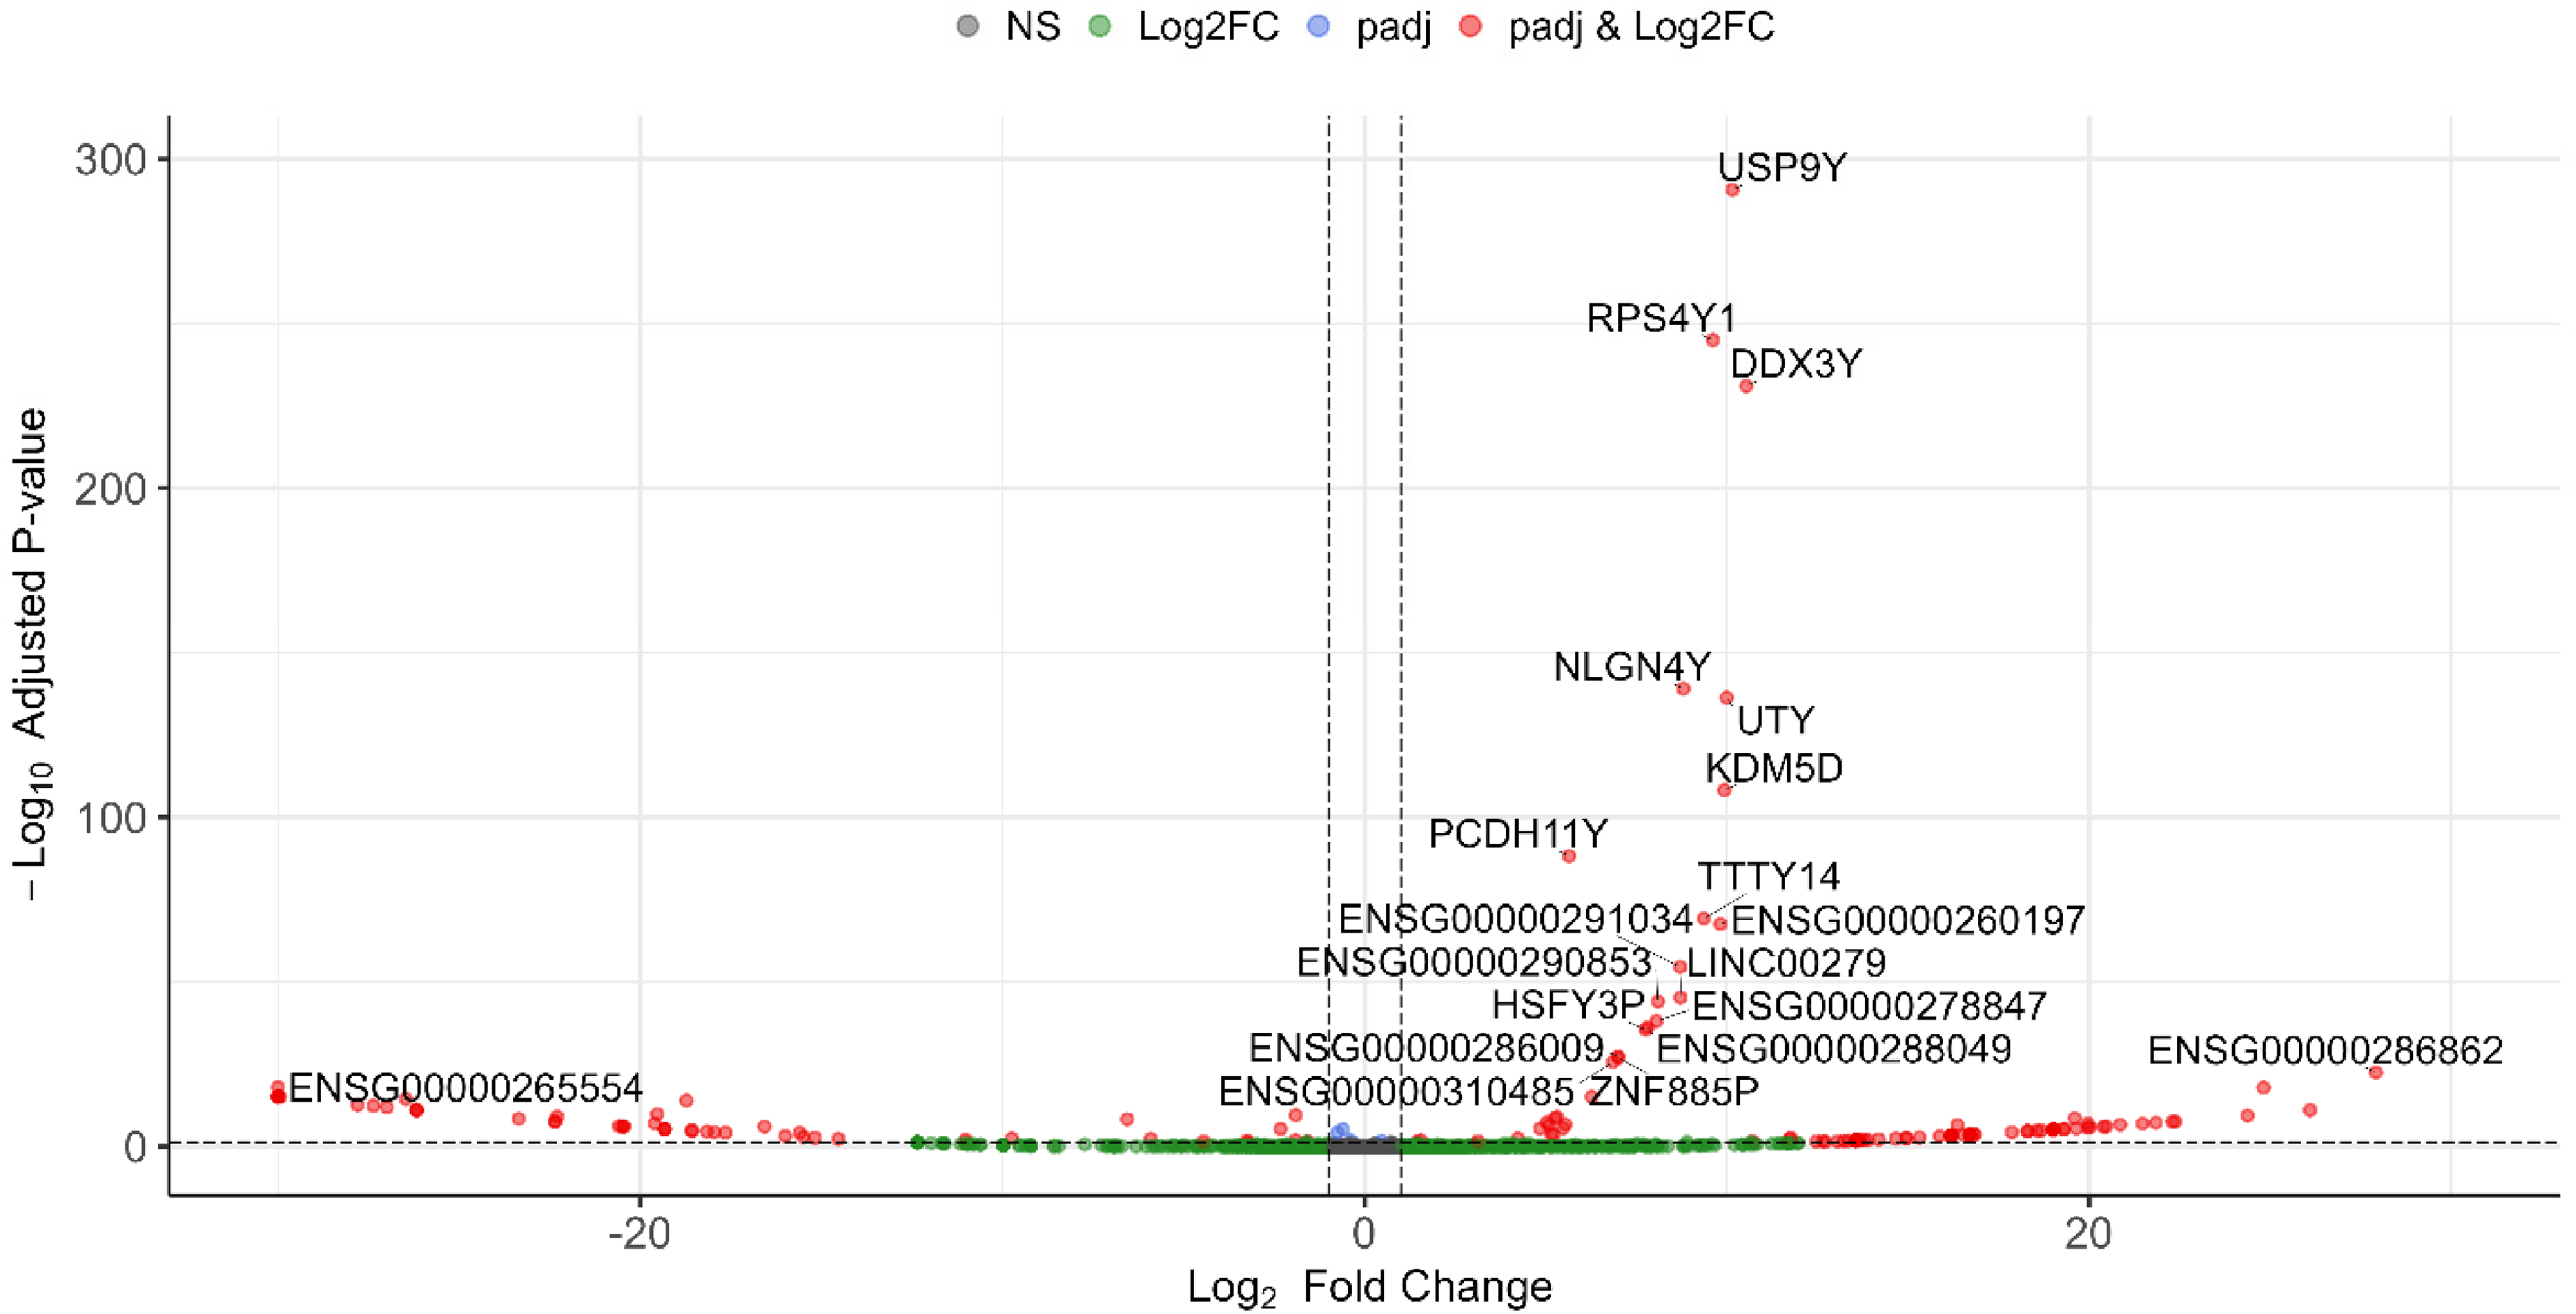
The MA plot was generated from the full set of unfiltered differential gene expression results for the diagnosis contrast with covariates in design 1, allowing to observe the overall distribution of upregulated and downregulated genes associated with AD (Figure 2). The filtering of DEGs was based on padj<0.05 and |log2FC| ≥ 1 which demonstrated 57 upregulated and 161 downregulated genes summing to 218 DEGs for further analysis (Supplementary file 2). The volcano plot highlighted the top 20 DEGs based on the FDR-adjusted p-value and log2FC for diagnosis by considering covariates (Figure 3). The heatmap of the top 50 DEGs for diagnosis showed various clustering (Figure 4). The second contrast of this design demonstrated that 119 genes were upregulated and 55 were downregulated in males compared to females as sex-biased genes from overall 174 DEGs (Figure 5 and Supplementary file 3).
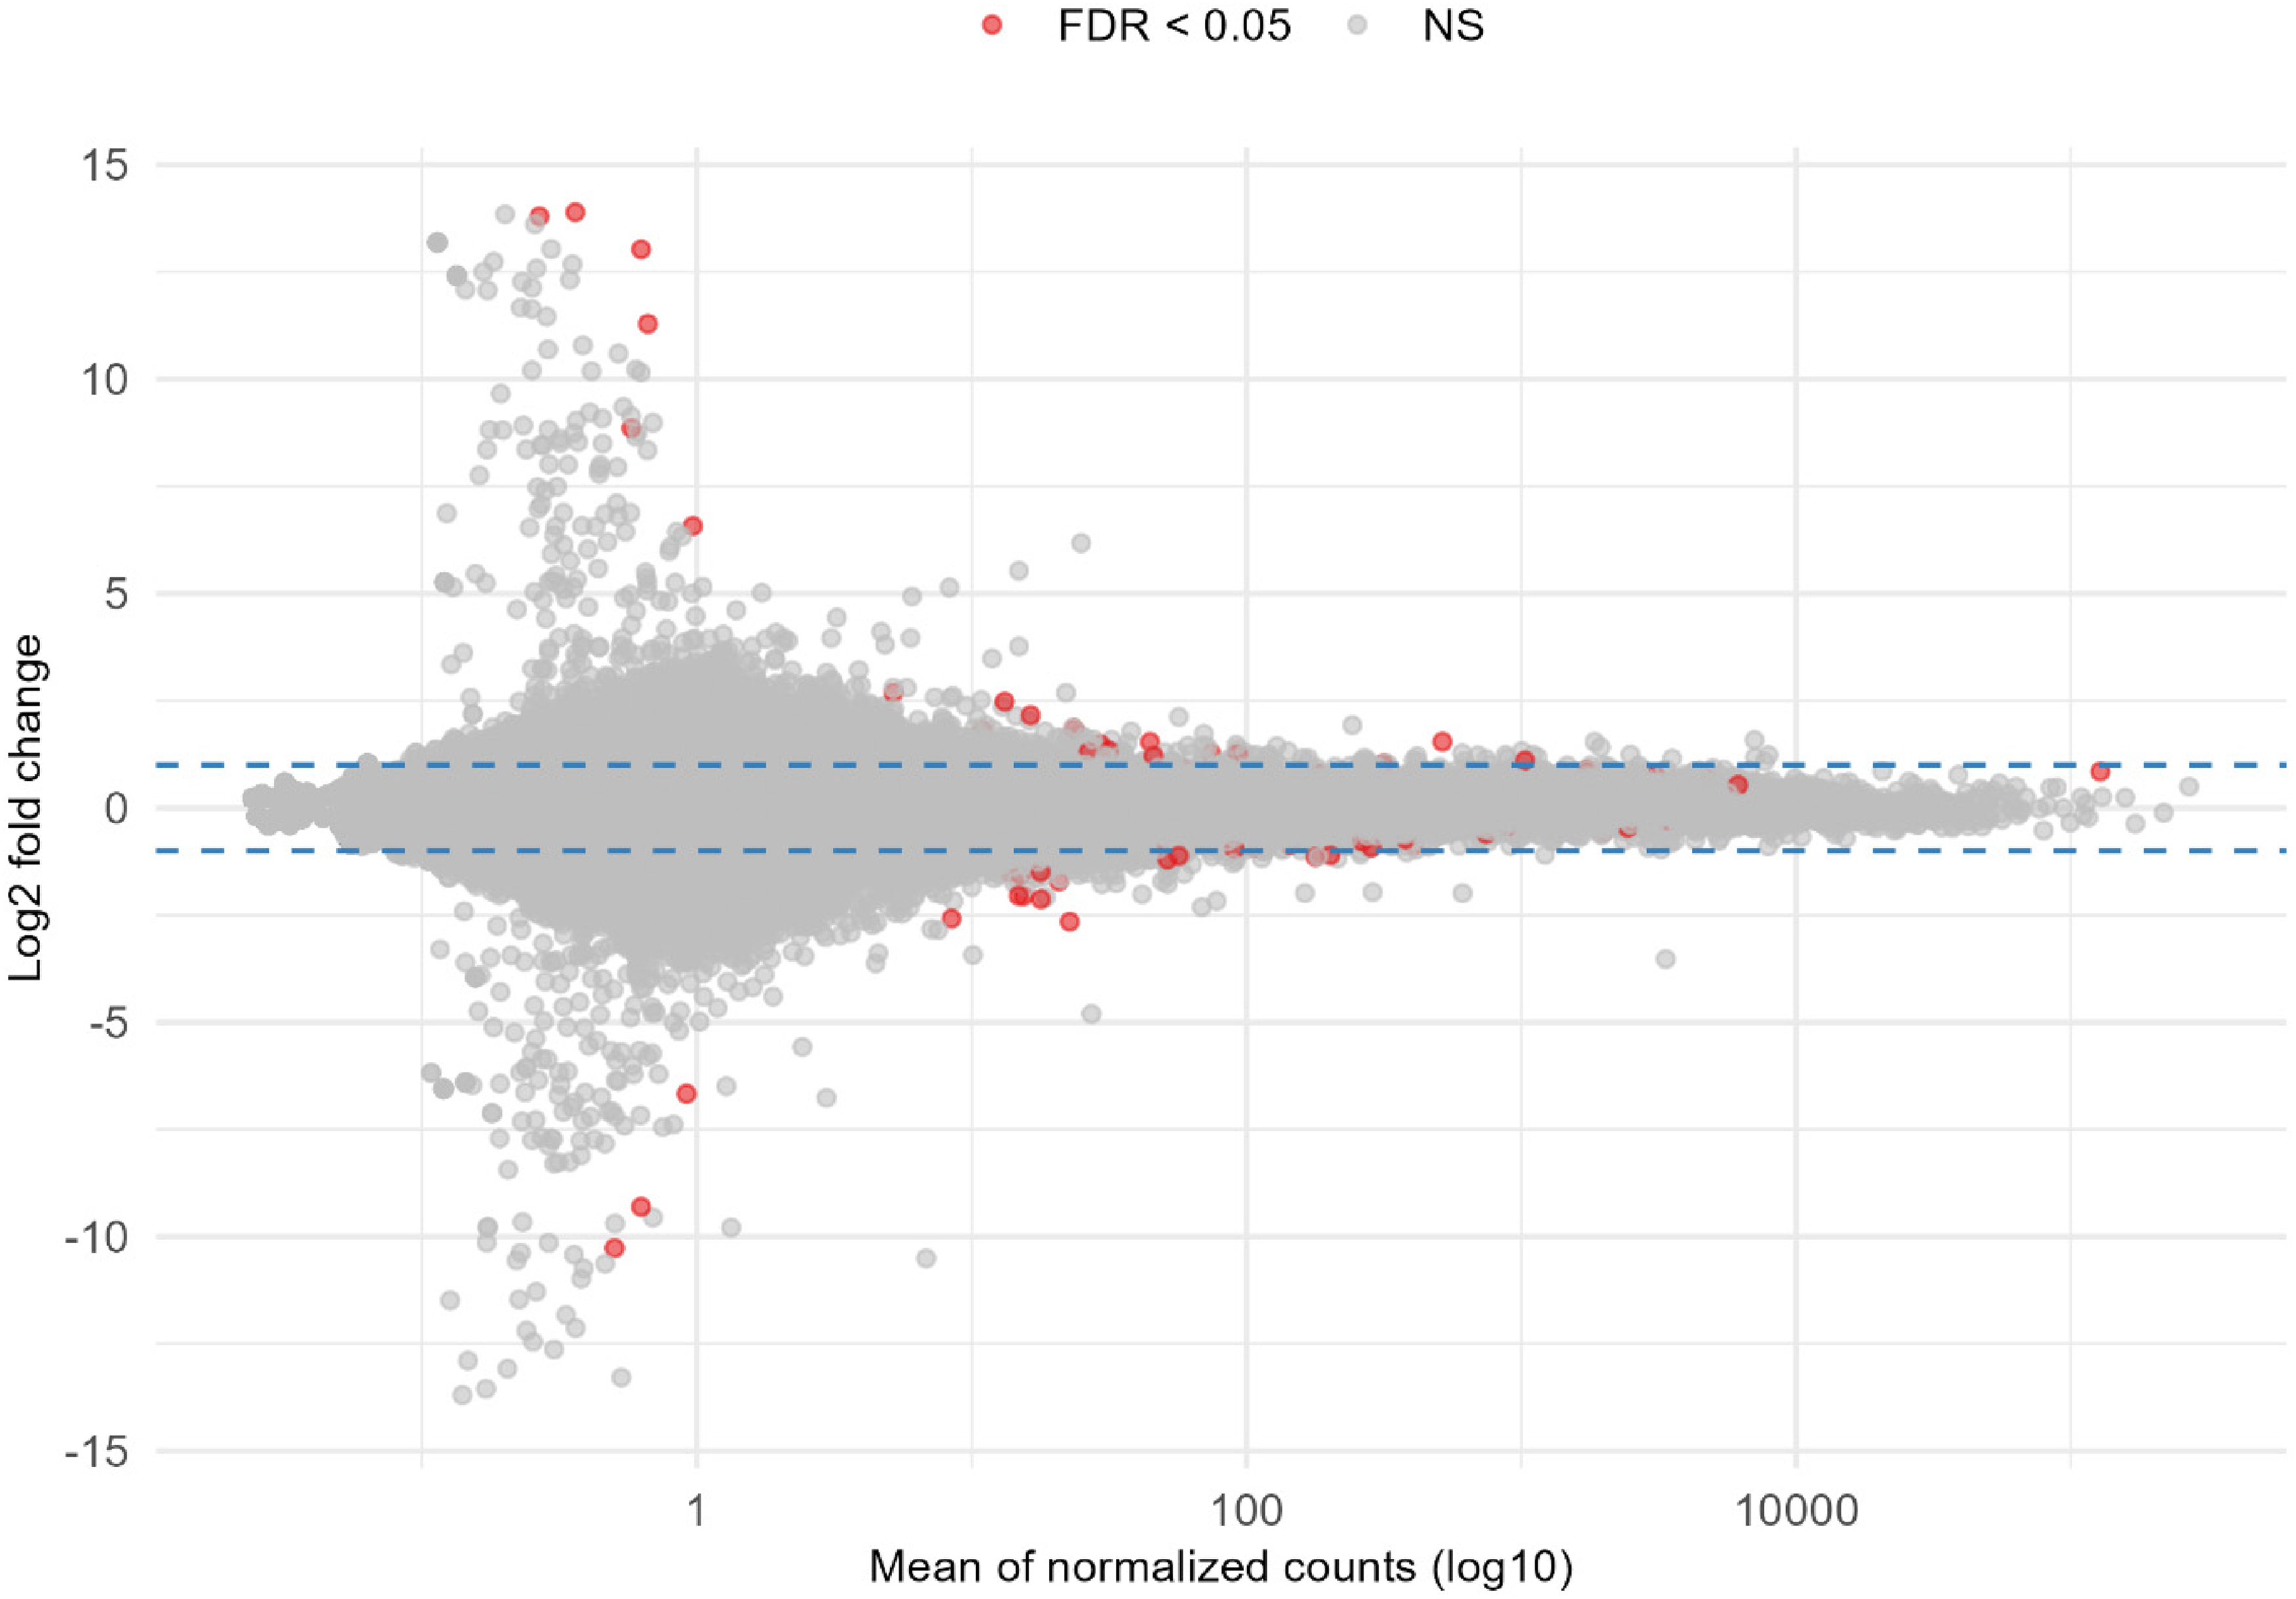
Ma plot for all unfiltered DEGs for diagnosis by considering covariates (Color figure available online).
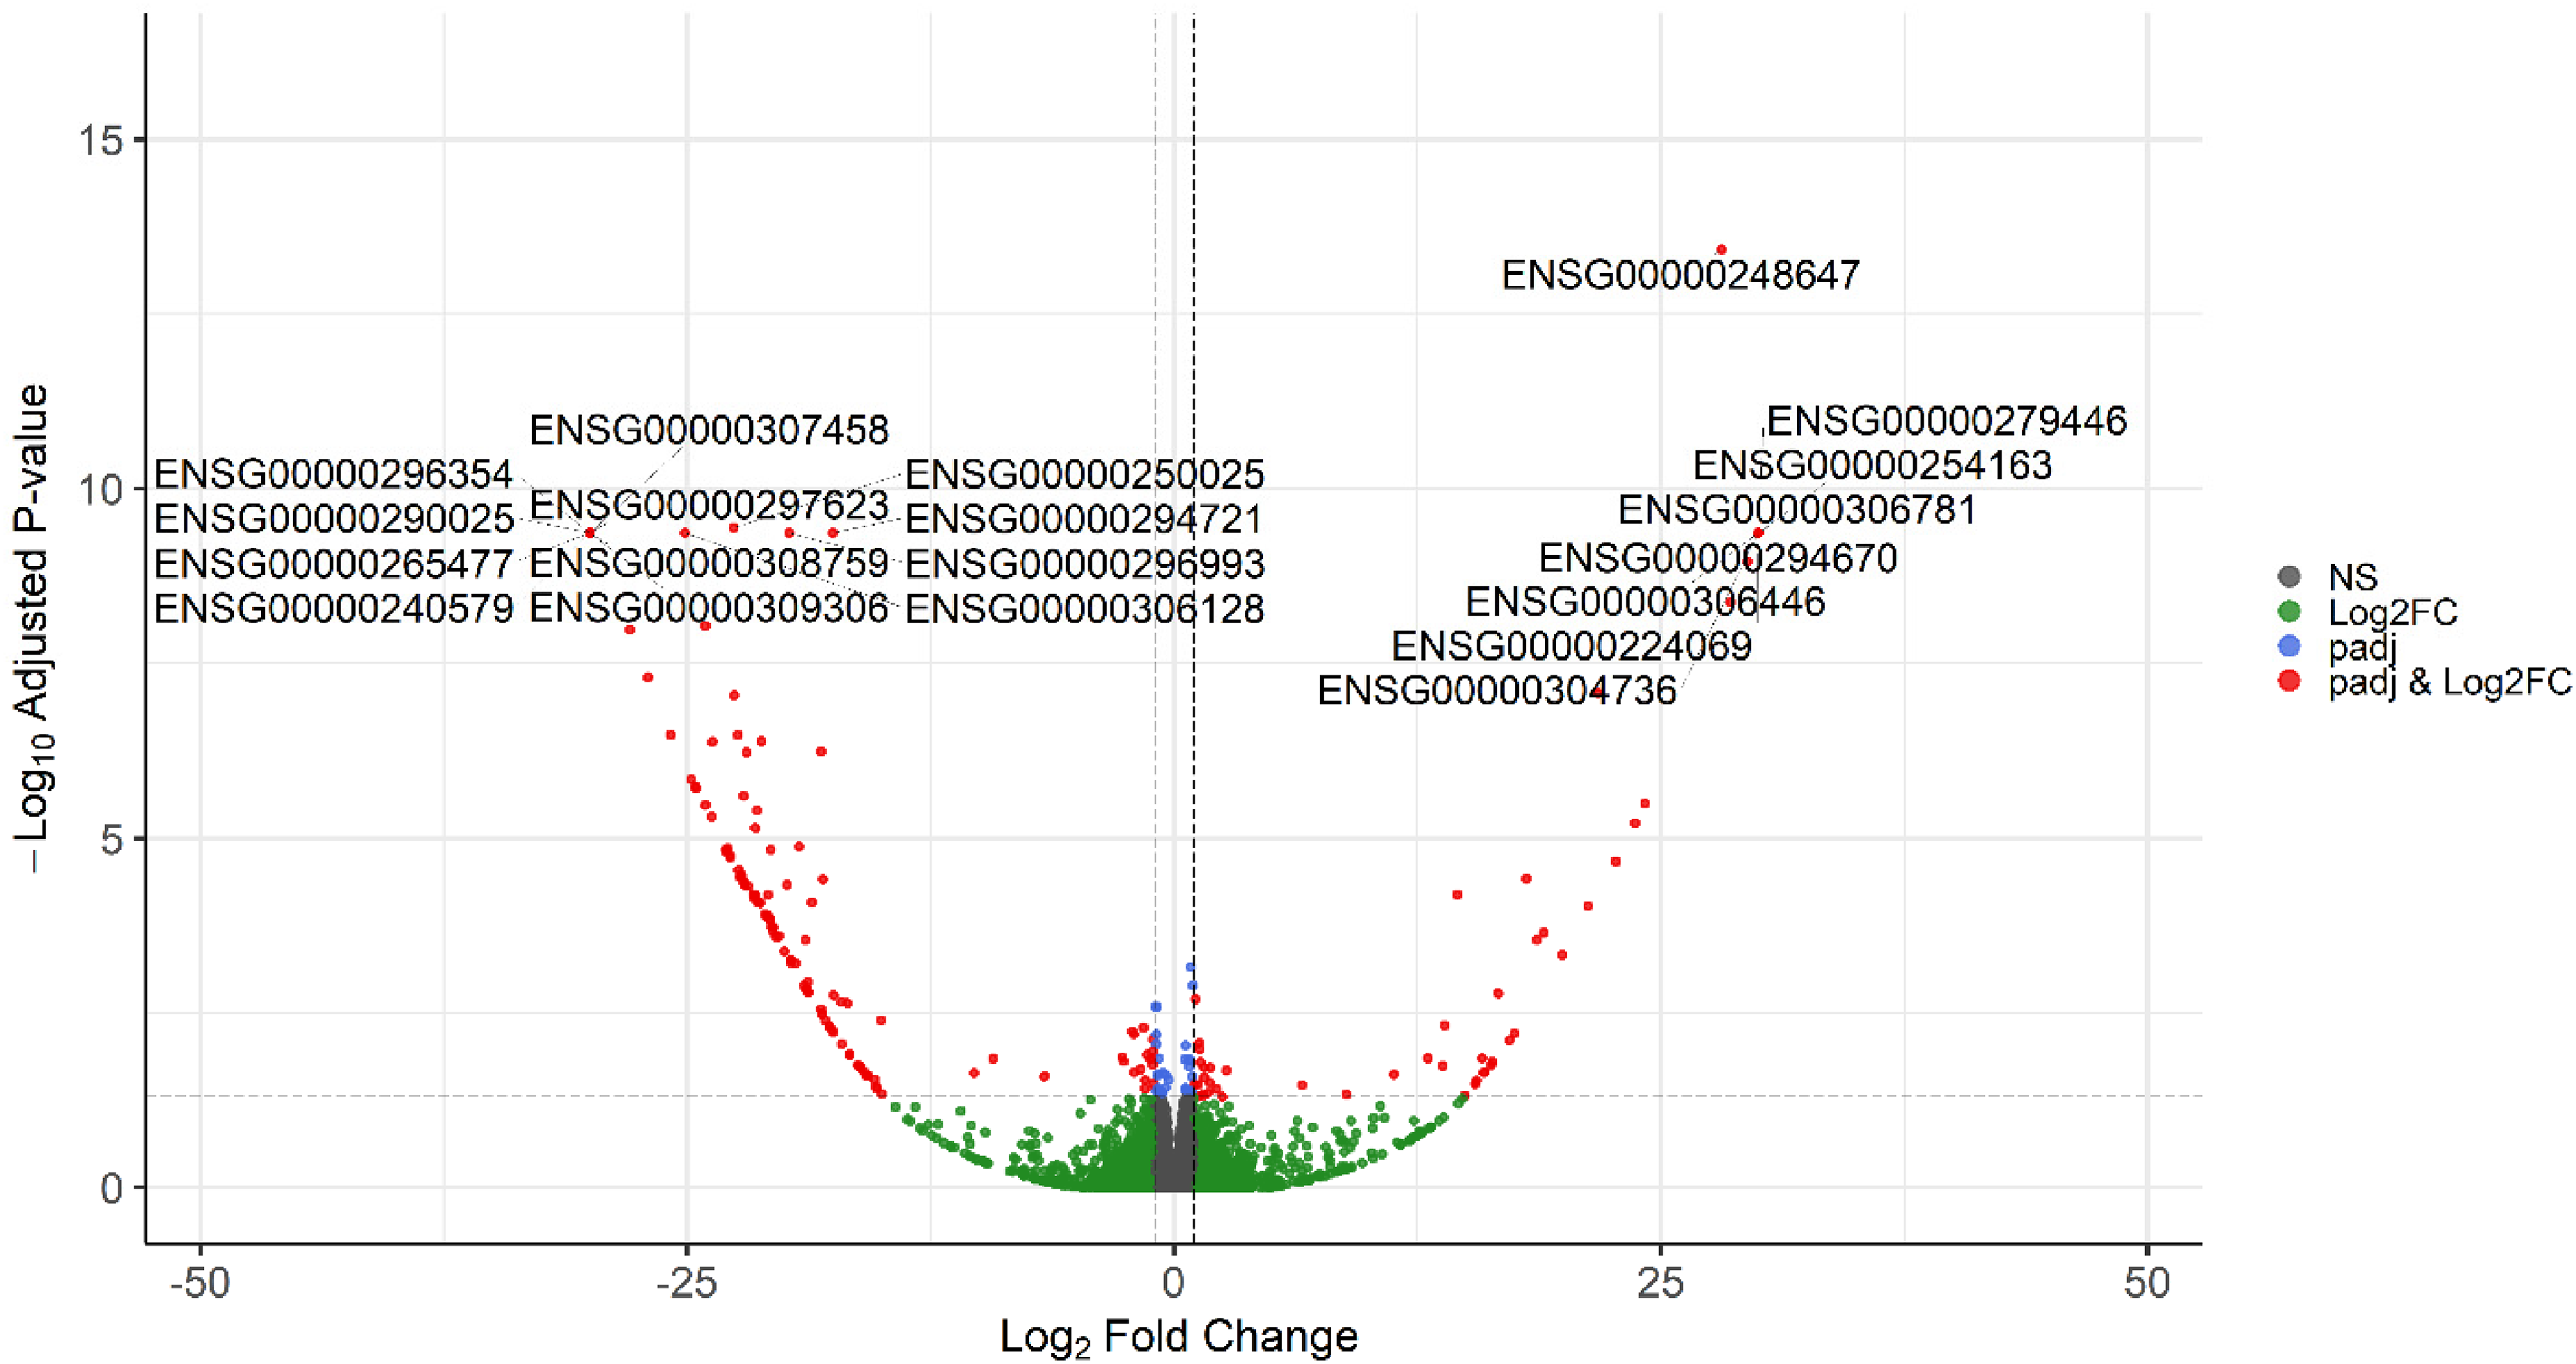
Volcano plot for all DEGs based on diagnosis by considering covariates (Color figure available online).
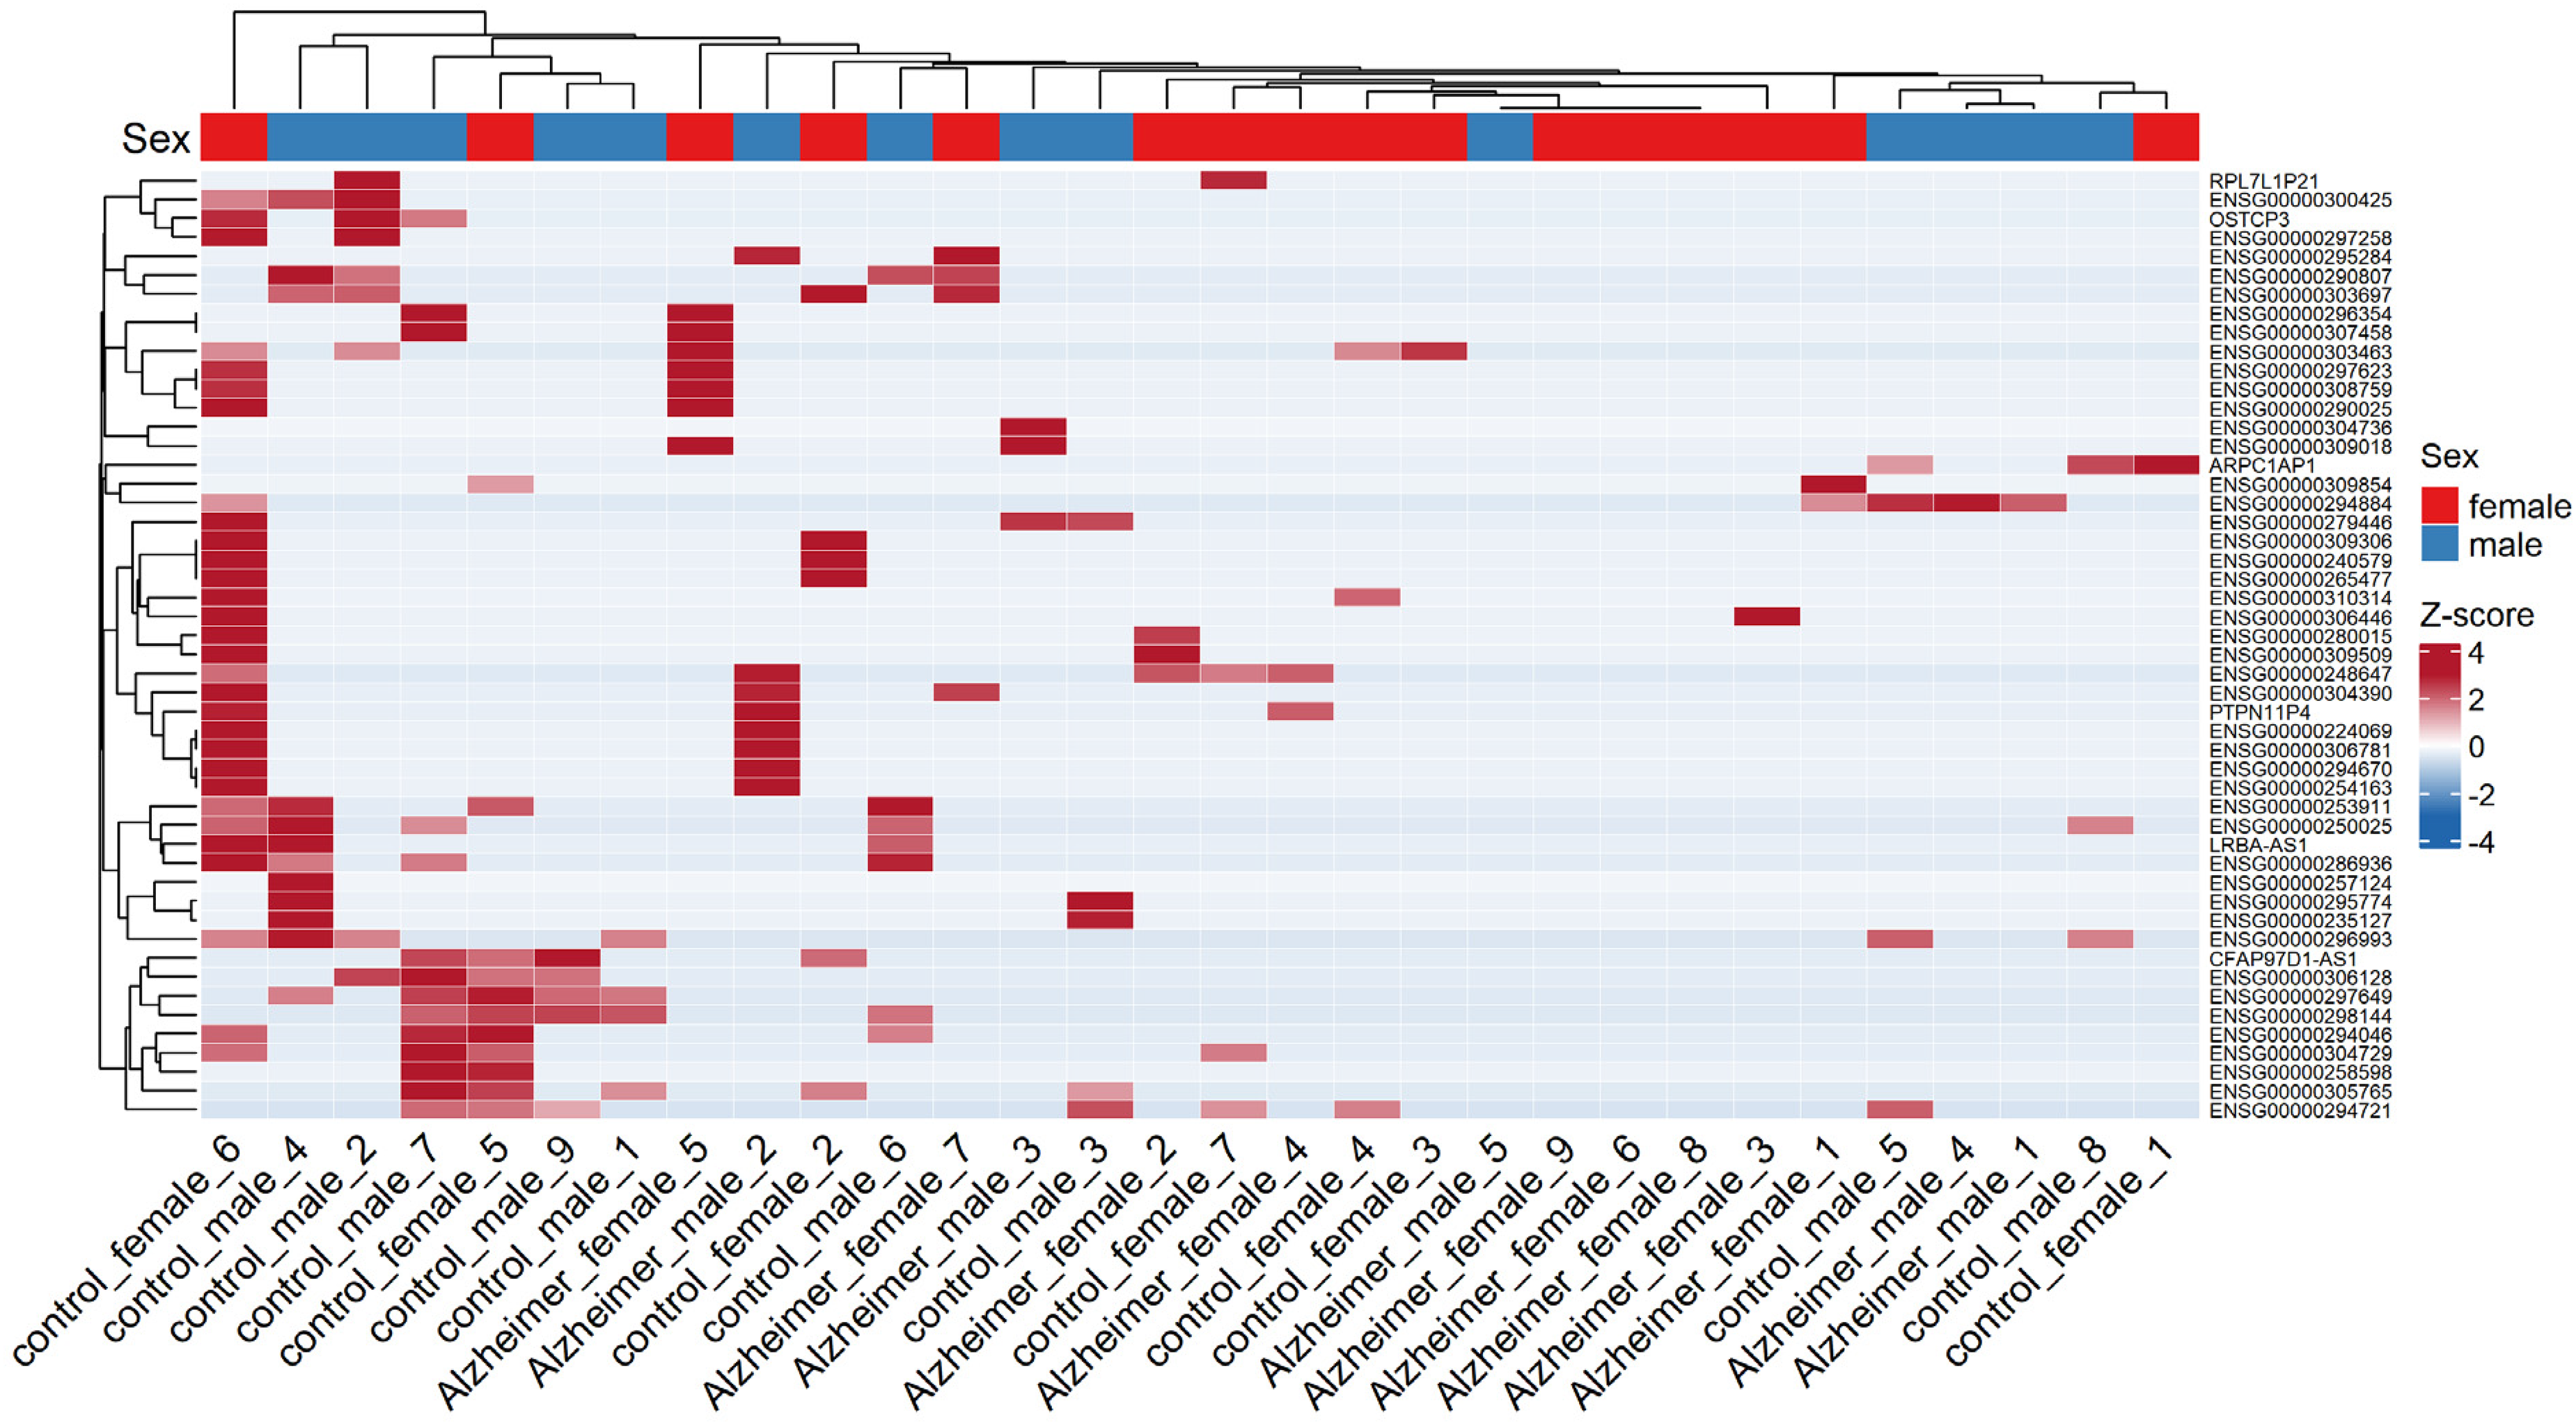
Heatmap for top 50 DEGs based on diagnosis by considering covariates (Color figure available online).
Volcano plot showing all sex-biased DEGs between male and female samples by considering the covariates (Color figure available online).
Design 2 identified 281 sex-specific DEGs in which 74 genes were upregulated (male-specific) and 207 ones were downregulated (female-specific), indicating statistically significant evidence that the effect of AD differs between males and females for these genes in this dataset (Figure 6 and Supplementary file 4).
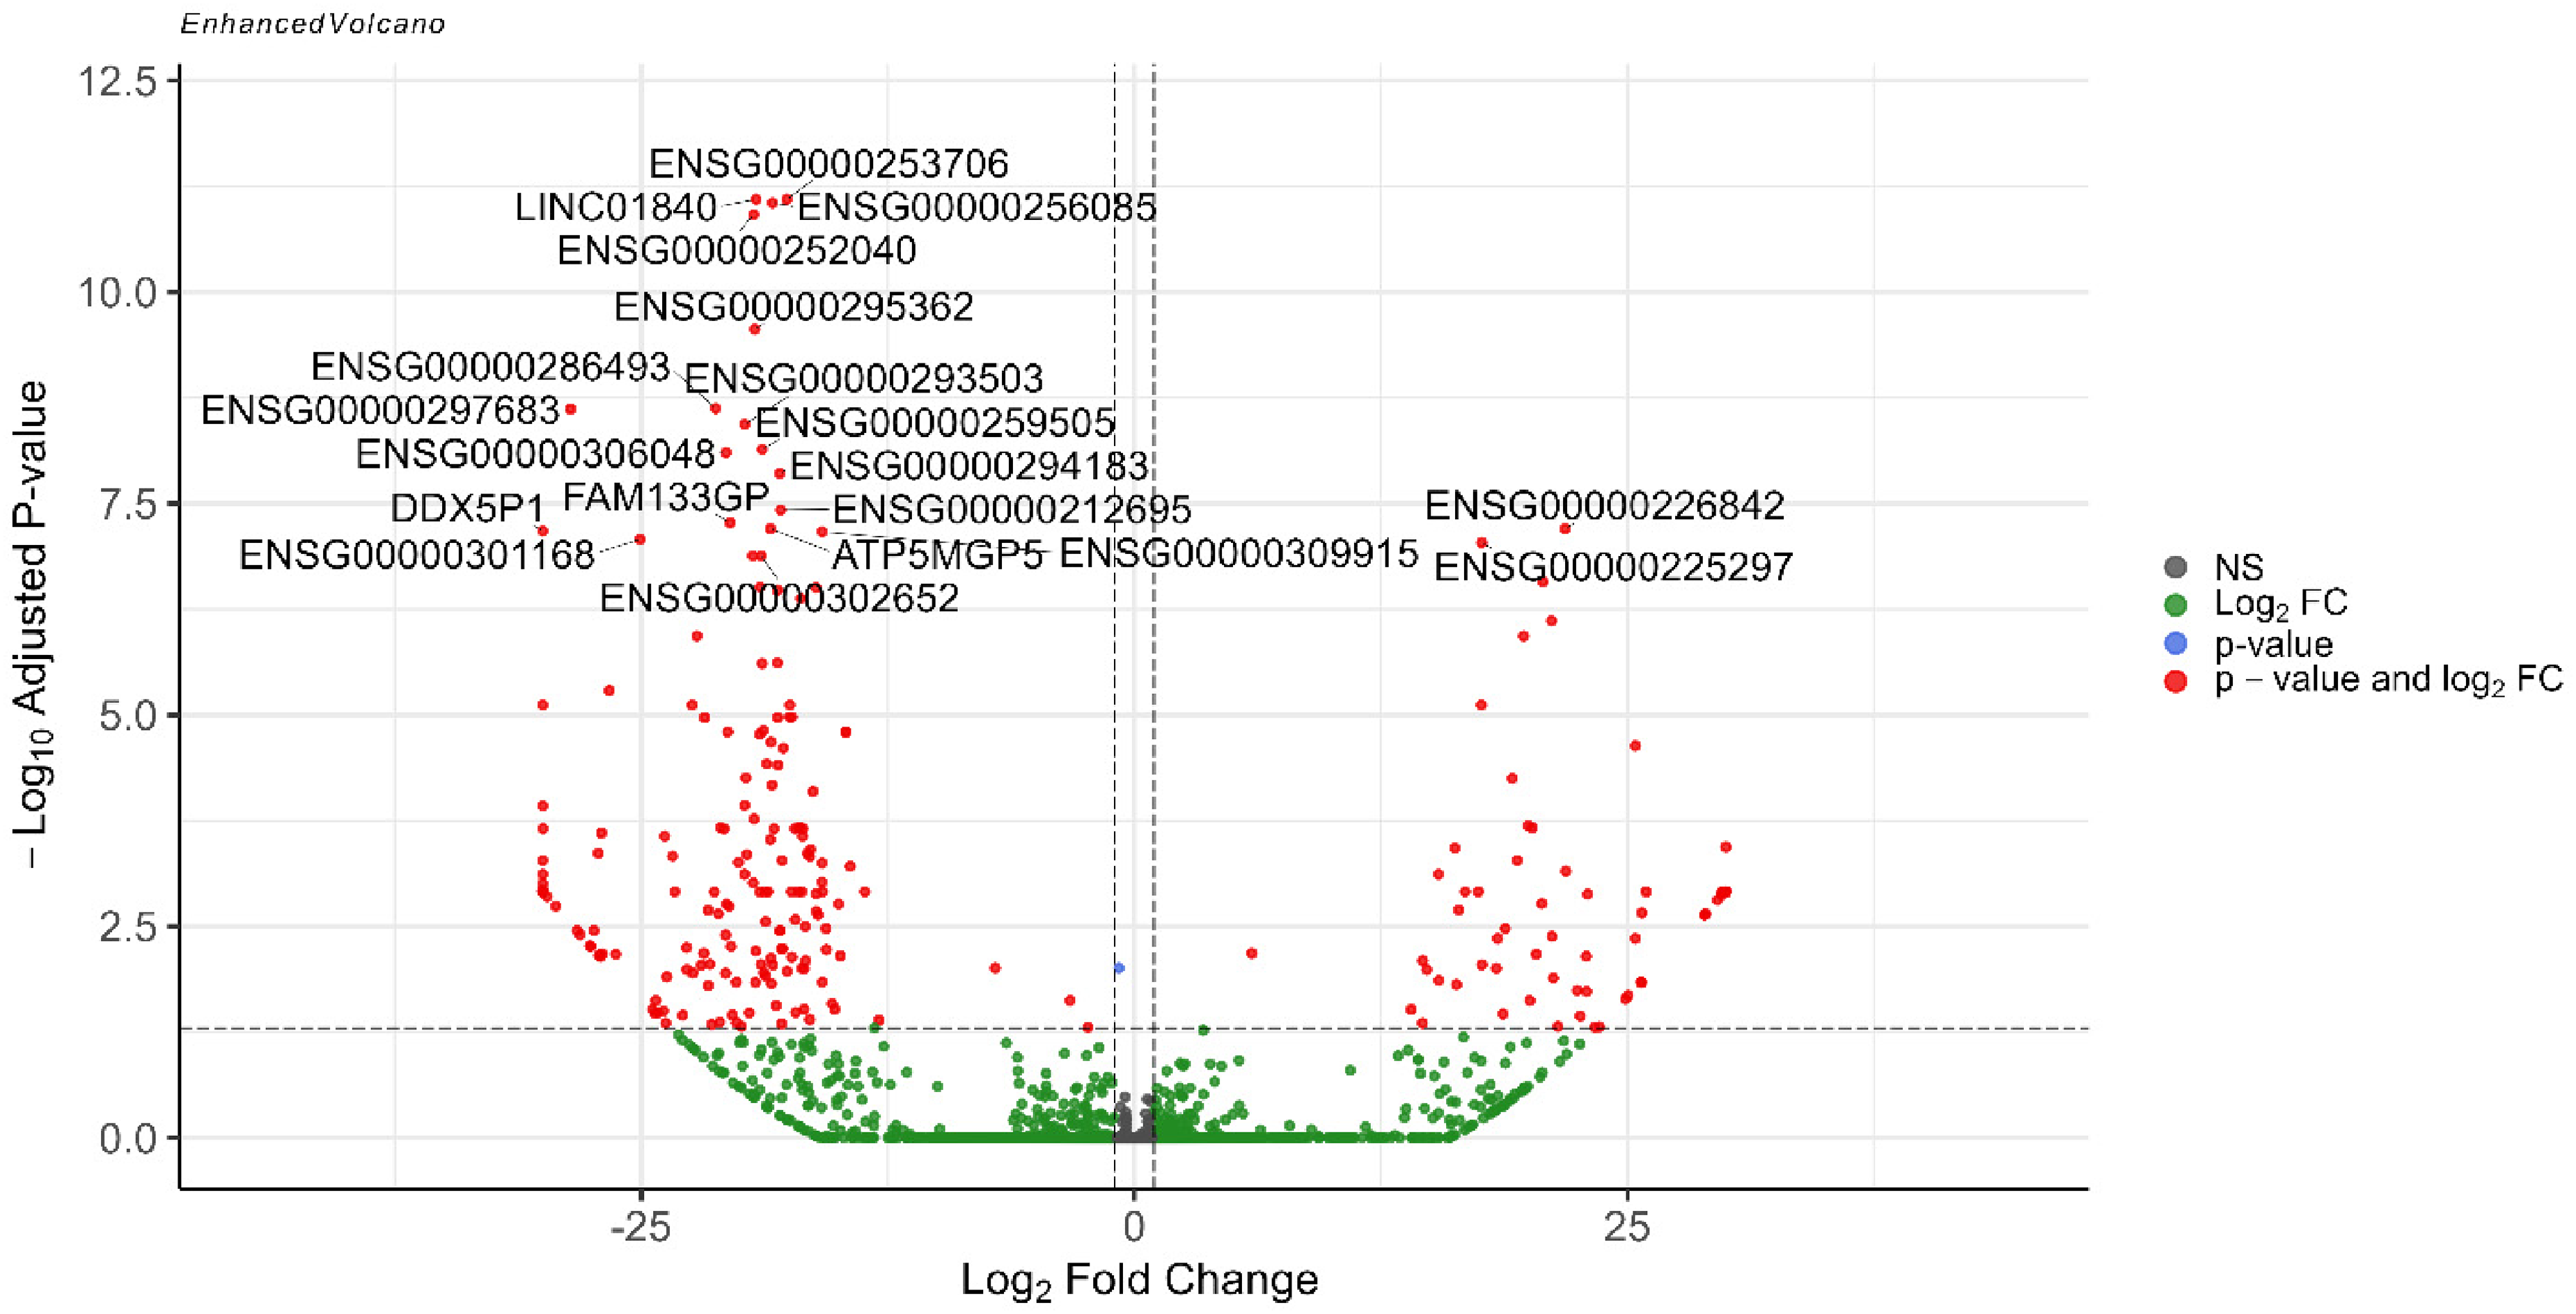
Volcano plot showing all differentially expressed genes identified from the sex and diagnosis interaction by considering the covariates (Color figure available online).
ROC AUC evaluation
AUC ROC investigation by the method of LOOCV was carried out on the 218 DEGs to discover potential disease biomarkers genes which revealed strong predictive performance. The top-ranked candidates that demonstrated a very strong effect size included: RASGRF2-AS1, ENSG00000302420, MAN1B1-DT, ENSG00000289885, ENSG00000280537, ENSG00000287918 and ENSG00000299227 (Table 1). Model performance was assessed by LOOCV which showed that several genes achieved high discriminative ability, with LOOCV AUC values ranging from 80 to 90%. Full model AUCs were consistently higher, indicating improved performance when trained on the complete dataset. Permutation testing confirmed the robustness of top candidate biomarkers with empirical p-values for LOOCV AUCs ranging from <0.001 to 0.001, indicating that the high predictive performance observed for these genes is highly unlikely to have arisen by chance, despite the limited sample size. Detection rates reached 1, indicating complete prediction coverage across the samples. Very low FDR-adjusted p-values for regression coefficients indicated that the top candidate genes remained significant after multiple testing correction. Differential expression analysis using DESeq2 revealed significant log2 fold changes for several genes (padj < 0.05), supporting their potential biological relevance. Notably, a subset of genes demonstrated clear sex-biased expression patterns, which may contribute to sex-specific differences in the phenotype under study. The rest of the genes with LOOCV ROC AUC of over 70% included ENSG00000225280, SYTL4, ENSG00000287452, ENSG00000226252, ENSG00000279821, ENSG00000258943, ENSG00000300533, ENSG00000262663, ENSG00000272986, ENSG00000305941, ENSG00000308609, ENSG00000310129, ENSG00000272277, RUSF1-DT, ENSG00000290683 and ENSG00000227757. Extended results with full details for all DEGs are available in Supplementary files 5 and 6.
ROC-AUC test values.

This table summarizes the predictive performance of DEGs identified as candidate biomarkers for Alzheimer's disease with effect size of very strong. Cross-validated AUC values were obtained using LOOCV, providing an unbiased estimate of generalization to unseen samples. LOOCV-AUC values in percent (with 95% confidence intervals) represent predictive accuracy for Alzheimer's disease diagnosis. In addition, the full AUC was calculated using all available samples to assess overall model performance on the entire dataset. Permutation p-values were computed from 1000 label shuffles to assess significance. For each gene, detection rate was calculated from LOOCV. Coefficient FDR corresponds to Firth logistic regression adjusted p-values. Log2 Fold Change and DESeq2-adjusted p-values reflect differential expression size and significance. Sex bias refers to whether a gene's predictive performance differs between males and females.
Hub genes from WGCNA
The eligible WGCNA modules which had significant FDR adjusted Student's t-test p-value for the trait of diagnosis included orange and mediumpurple3 which are marked in the association heatmap (Figure 7). The orange ME was significantly and positively correlated with the control (r = + 0.64, FDR-adjusted p-value = 0.009) which could explain about 41% of the variance, indicating that genes in this module are upregulated in controls whereas the mediumpurple3 module eigengene was significantly higher in AD (r = -0.56, FDR-adjusted p-value = 0.042), which could explain about 31% of the variance reflecting module-specific expression differences between two groups. Hub genes were defined as the top 10 genes in each module with the highest kWithin, representing the most strongly co-expressed genes. The hub genes for the orange module included PPP1R2, DCTN1-AS1, ZNF441, EEF1D, PSMG1, PCYOX1L, WAC-AS1, DNASE1, NEK10, and ICA1L (Figure 8). The hub genes for mediumpurple3 module included STIP1, JMJD6, DNAJB1, SERPINH1, SPR, HSPA5, HSPA6, PDIA4, HSPA1B, and JDP2 (Figure 9).
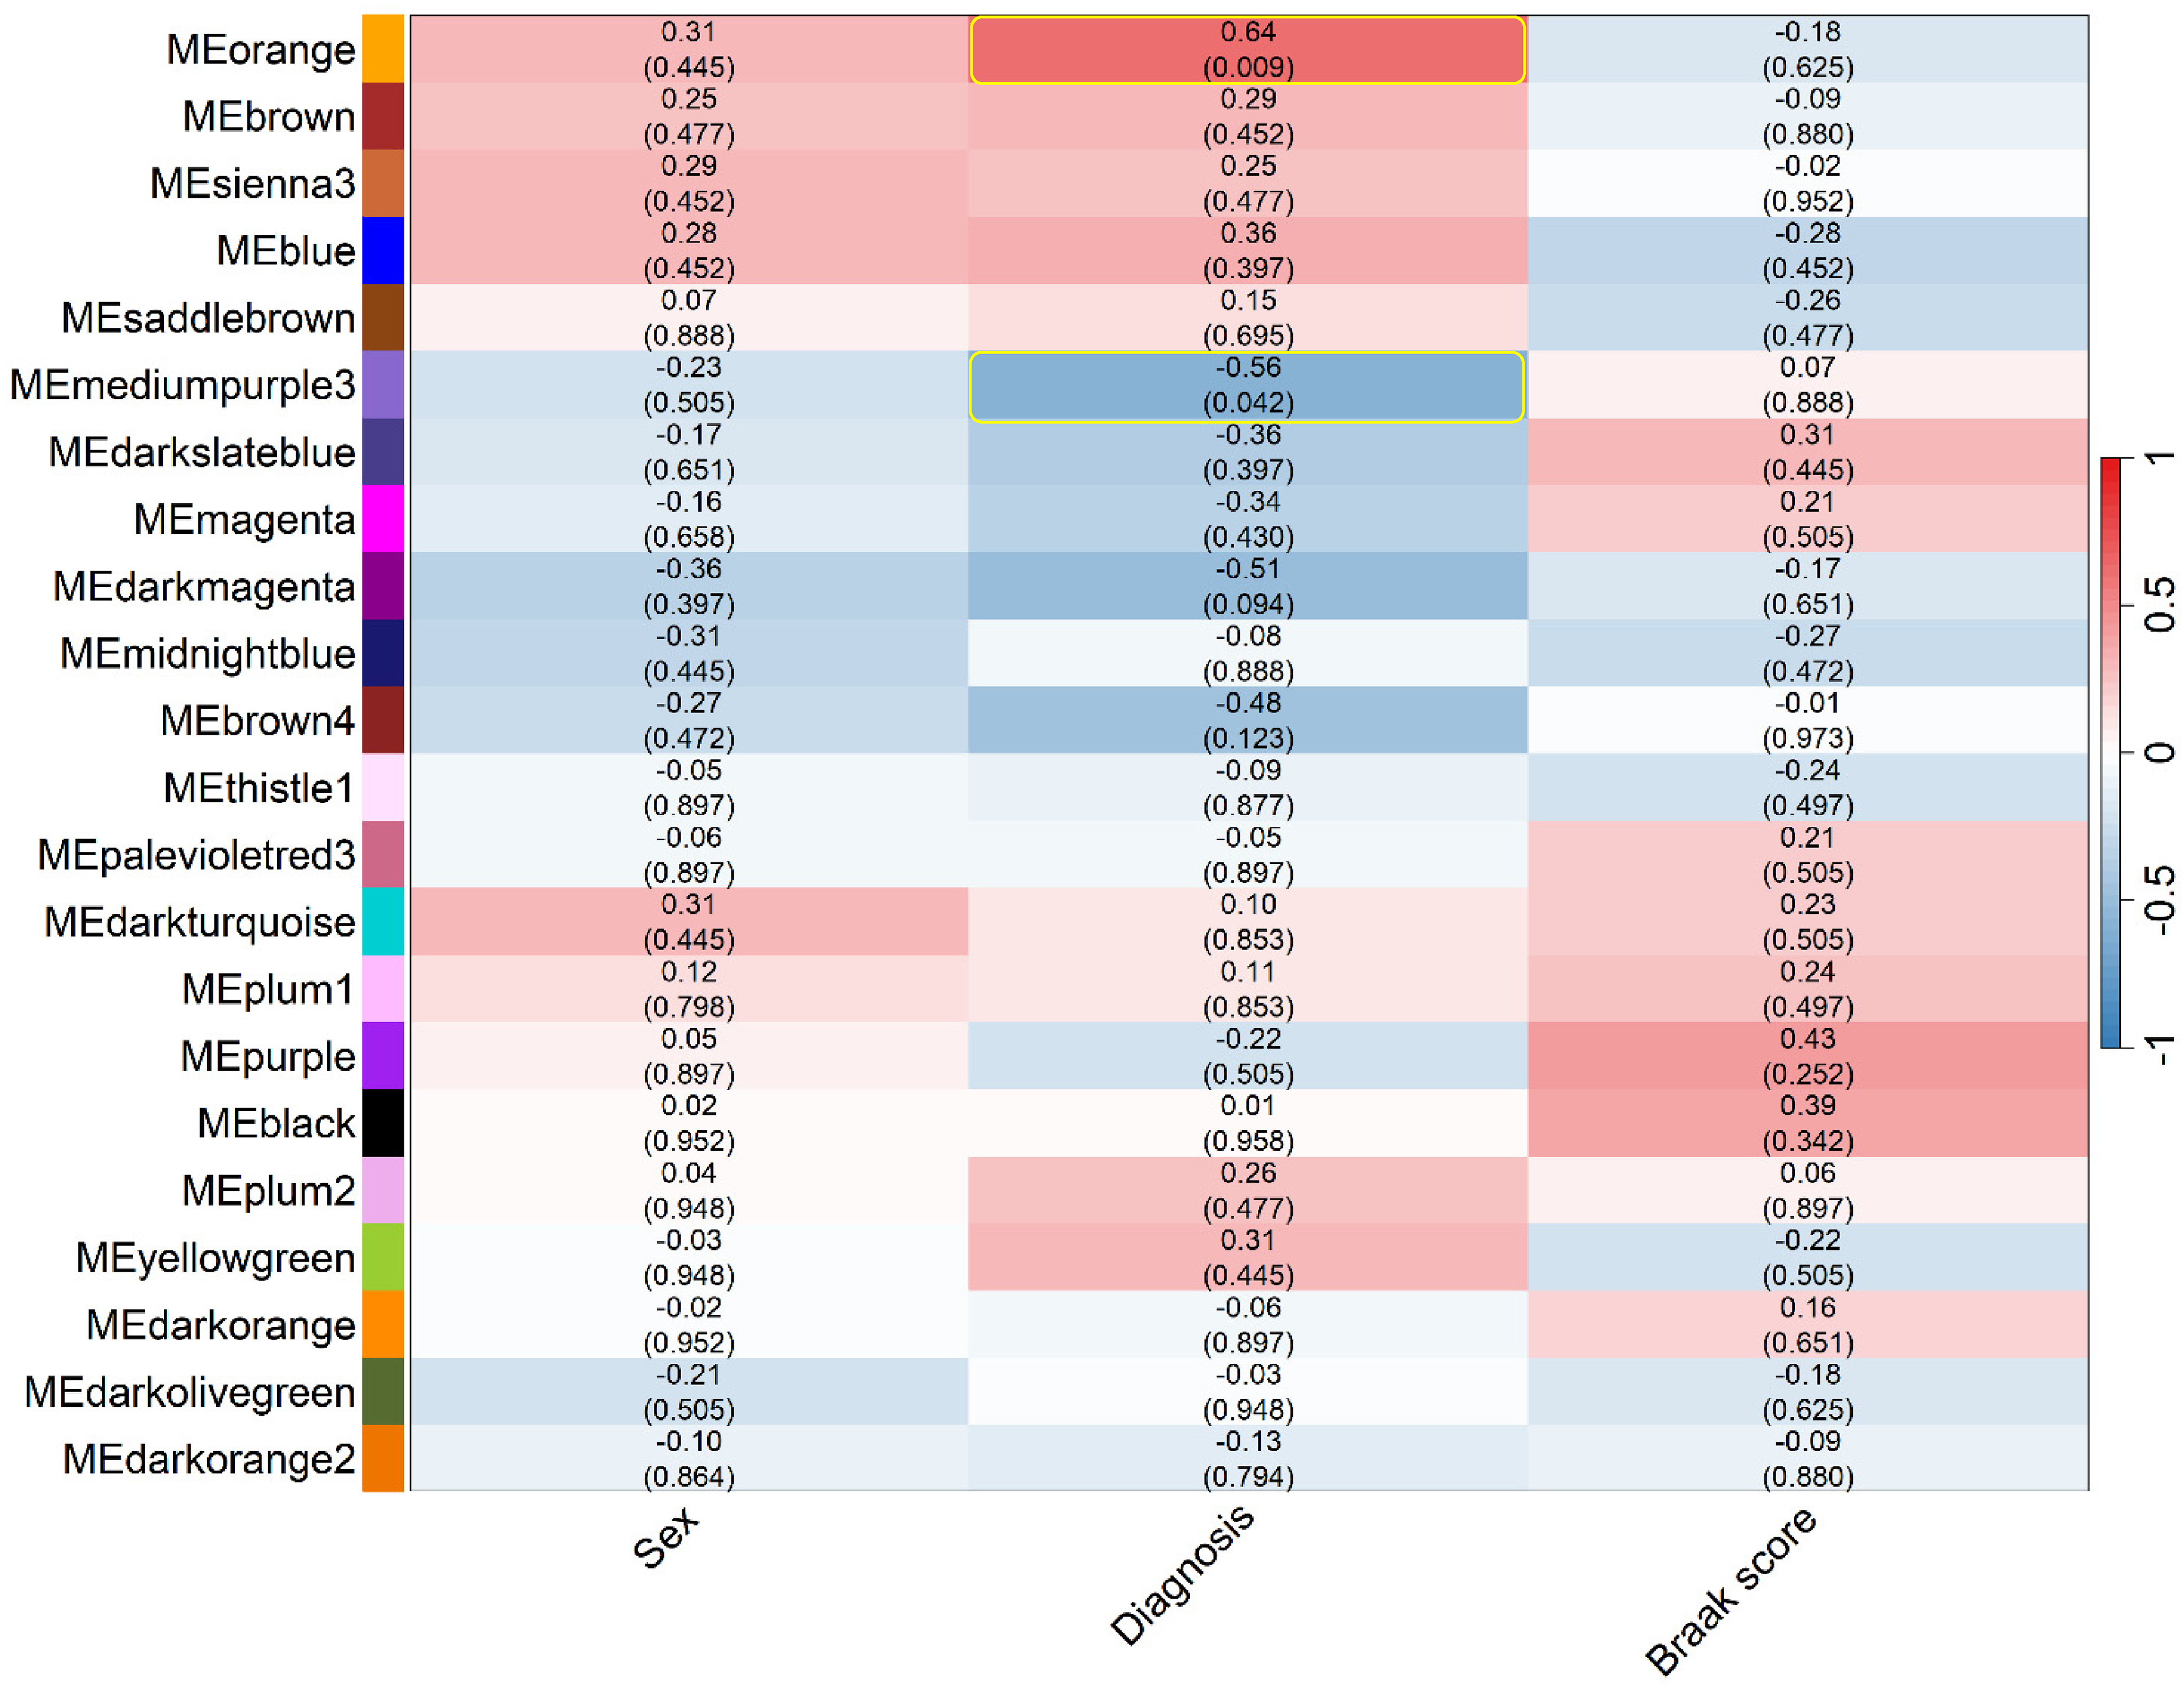
Merged module eigengenes trait association heatmap (Color figure available online).

The orange ME gene co-expression network with top hub genes (Color figure available online).
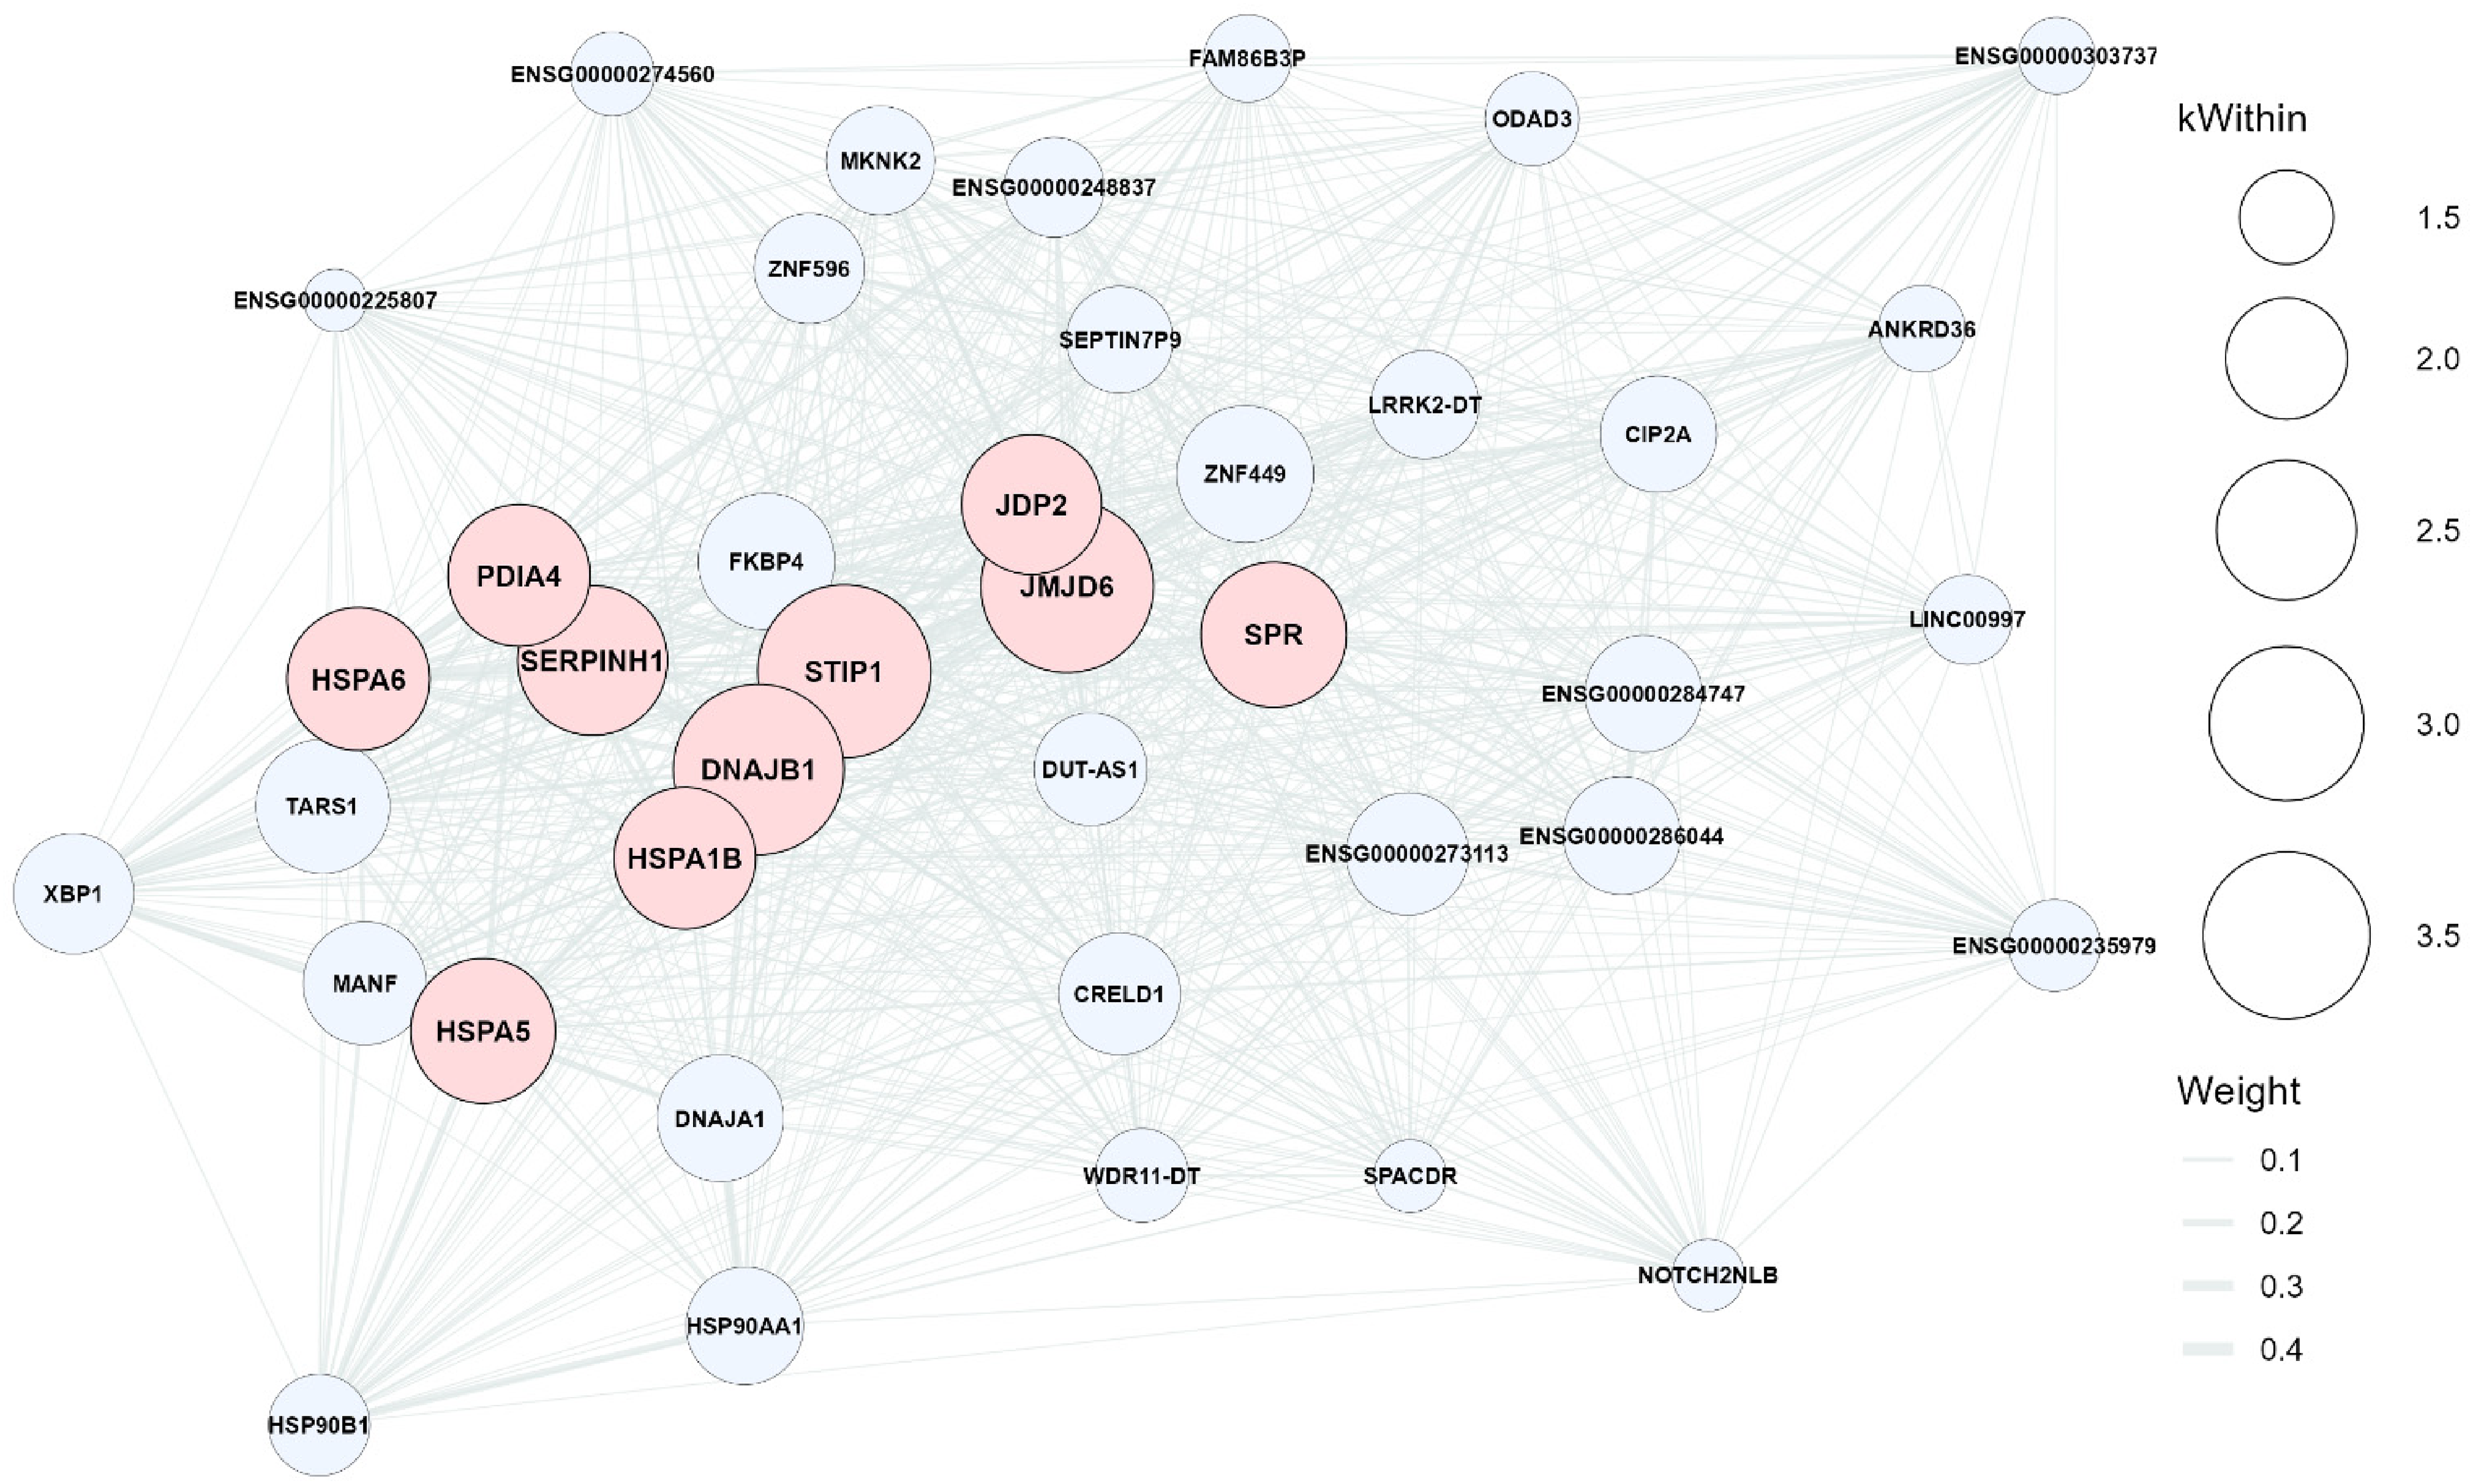
The mediumpurple3 ME gene co-expression network with top hubs genes (Color figure available online).
Transcription factor enrichment analysis by ChEA3 tool 18 with ENCODE ChIP-seq data 19 on the top 10 genes of mediumpurple3 module identified HSF1, as a transcriptional activator among 5 genes of STIP1, DNAJB1, SPR, HSPA6, and JMJD6 (FDR p-value = 2.31E-04 with odds ratio = 46.06), suggesting its profound significance for regulation of these genes in vulnerable AD patients. HSF1 functions as the master transcriptional regulator of the heat shock and cytosolic stress response, becomes dysregulated in AD patients. This failure represents an upstream effector that impairs the induction of key chaperone genes, compromising the cell's primary defense against misfolded proteins. 20 Overall, this finding based on this dataset reiterates the importance of HSF1 as a high-value target.
In silico prediction of the interaction of lncRNAs with miRNAs
The in silico predicted sponge activity between top 20 genes’ aggregated transcripts and 14 AD–associated miRNAs is depicted in a heatmap (Figure 10). Each cell in the aggregated heatmap represents the cumulative interaction score between a miRNA and a gene. Scores were first min–max normalized at the transcript level and then summed across all transcript isoforms of a gene to obtain a single aggregated gene-level score. This analysis revealed that a subset of lncRNA genes exhibited consistently strong predicted interactions with specific miRNAs, suggesting a higher potential for ceRNA activity at the gene level. It is evident from the heatmap that among all genes, upregulated lncRNAs of ENSG00000287452, ENSG00000280537, ENSG00000262663, and ENSG00000226252 had the highest score for the downregulated hsa-miR-153-3p, on the other side downregulated lncRNAs of ENSG00000287918 and RASGRF2-AS1 had the highest score for the upregulated hsa-miR-16-5p.
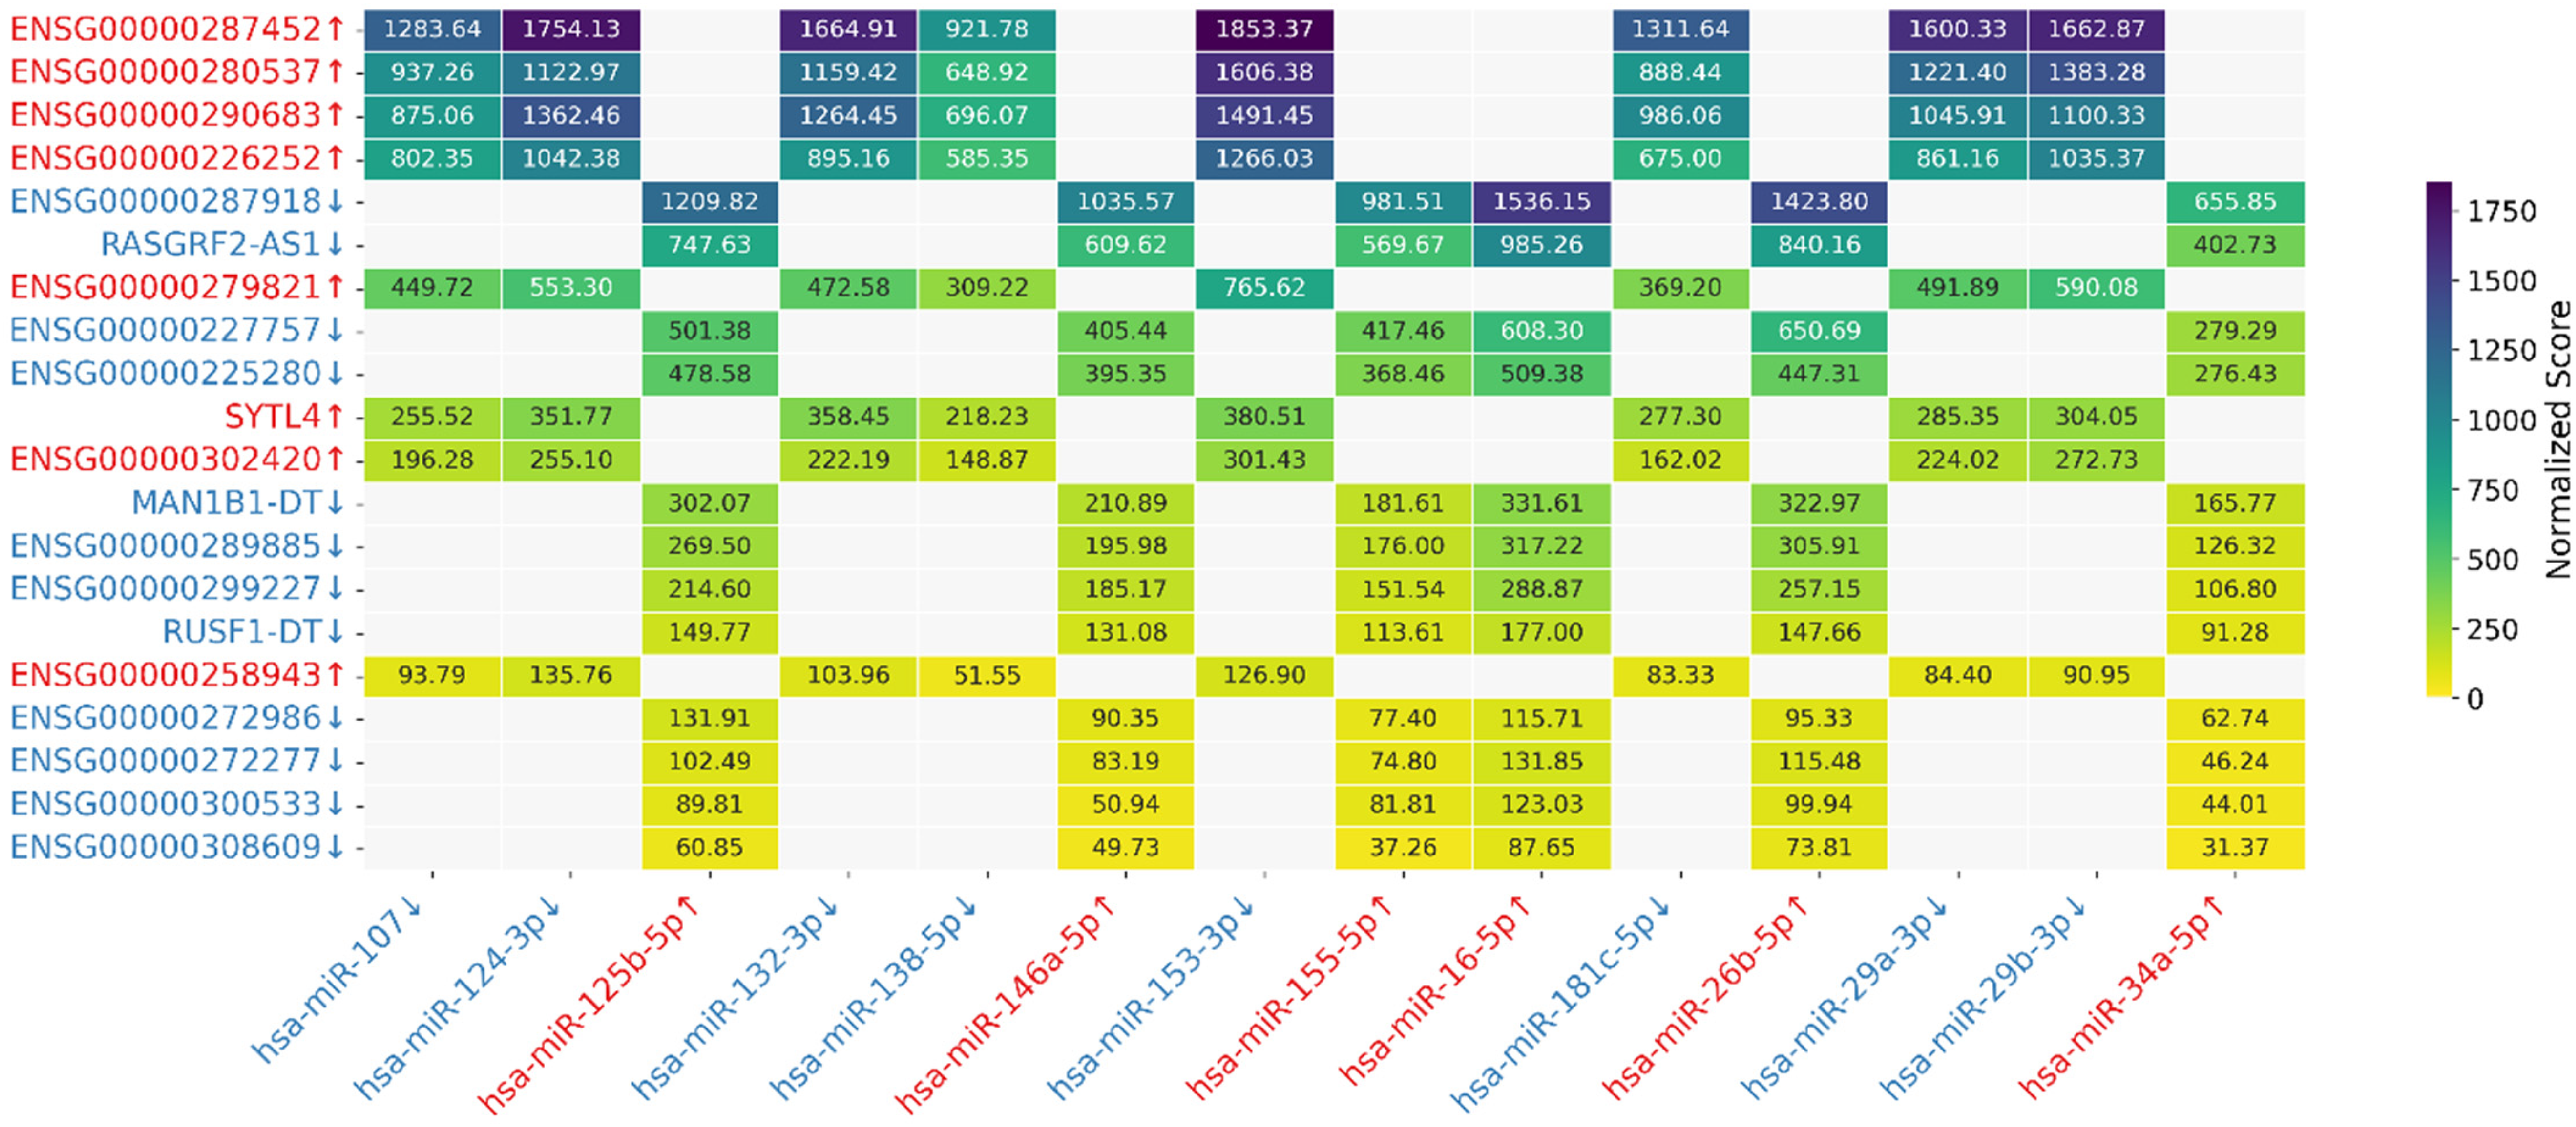
Heatmap of aggregated gene-level miRNA–lncRNA interaction (Color figure available online).
Discussion
The present study aimed to identify genes that govern the moderate stages of AD by inclusion of NFTs in fusiform gyrus tissue of both cases and controls. Although this study was limited to one transcriptomics analysis with 30 samples, the data were meticulously curated. The discovery of gene-based diagnostic biomarkers for AD can enhance our understanding of its pathology at gene levels and open new avenues for timely detection and or personalized therapeutic strategies. AD is a multifactorial disease that genetics plays a crucial role in various stages. In this study, potential diagnostic gene biomarkers were discovered based on top diagnostic DEGs. Furthermore, important connected genes were identified by WGCNA and discussed in the context of AD. Finally, bioinformatics analysis predicted potential capability of lncRNAs as sponge to explain their speculative mechanism of action.
Top diagnostic gene biomarkers
The investigated biomarkers of this study were among top genes from the diagnostic DEGs based on LOOCV ROC AUC assessment. Overall, these lncRNAs are poorly studied and there is scarce information regarding their role in AD or mechanism of action and they are speculatively reviewed. However, they might serve as non-invasive biomarkers in blood, cerebrospinal fluid, exosomes or extracellular vesicles for the mid-stages of AD. Furthermore, they can provide mechanistic insight for research as brain tissue cell-specific markers or in cell models as molecular signatures of the disease at this stage.
RASGRF2-AS1
In this transcriptomics analysis, downregulation of RASGRF2-AS1 (RASGRF2 antisense RNA 1) was demonstrated. RASGRF2-AS1 is an lncRNA located on the reverse strand of chromosome 5 opposite to around less than 1 kb of RASGRF2 gene. According to GTEx portal, 21 RASGRF2-AS1 has highest level of median expression in the brain tissue and RASGRF2 is highly expressed in the brain tissue as well. There is evidence that lncRNAs could have cis-regulatory function on nearby genes 22 and this effect could have an extensive spectrum of pre-transcriptional interaction with DNA, transcriptional interaction with RNA and posttranscriptional interaction with proteins. 23 RASGRF2 is involved in synaptic transmission and calcium modulation by coordinating the activation of MAPK signaling and calcium/calmodulin-dependent protein kinase II (CAMK2A) which is part of the N-methyl-D-aspartate receptor (NMDAR) signaling complex. 24 In the adult mouse hippocampus, RASGRF2 promoted neuron survival and long-term potentiation (LTP) via ERK (extracellular signal-regulated kinases) activation, whereas RASGRF2 knockout impaired neurogenesis, memory and synaptic plasticity. 25 Thus, RASGRF2 is essential for synaptic plasticity, learning, memory and dopamine-mediated behaviors. It functions as a calcium/calmodulin-regulated guanine nucleotide exchange factor (GEF) acting upstream of MAPK/ERK pathways and modulating dopamine neuron activity. 26 Downregulation of RASGRF2-AS1 may relieve inhibition on RASGRF2, increasing its expression. Elevated RASGRF2 enhances Rac1 activation, promoting LTP and dendritic spine formation. 27 As AD is marked by synaptic loss and impaired LTP, increased RASGRF2 could initially support synaptic function, similar to RASGRF1 upregulation improving cognition in hypoperfusion models. 28 However, excessive RASGRF2 activity might disrupt synaptic balance and induce excitotoxicity, contributing to neuronal damage in AD. RASGRF2 is also phosphorylated by p35/Cdk5, causing its accumulation with MAP1b. 29 Given that Cdk5 (Cyclin-Dependent Kinase 5) dysregulation promotes tau hyperphosphorylation and Aβ toxicity, 30 elevated RASGRF2 under these conditions could worsen AD pathology. The outcome may depend on the p35/p25 balance, which varies across AD stages. Additionally, it has been demonstrated that high expression of RASGRF2-AS1 acts as a competitive endogenous RNA (ceRNA) in non-small cell lung cancer, functioning as an miRNA sponge. 31 Overall, RASGRF2-AS1 downregulation may upregulate RASGRF2, leading to hyperactivation of calcium signaling and LTP, disturbing synaptic homeostasis, and exacerbating neurodegenerative processes such as tau pathology. In this DEG analysis RASGRF2, as expected was elevated, though slightly and insignificantly, indicating RASGRF2-AS1 should have other regulatory functions and or may be independently regulated. However, more research is required to unravel the role of RASGRF2-AS1 in the pathology and progress of the disease as a potential gene diagnosis biomarker.
ENSG00000302420
In this investigation the upregulation of ENSG00000302420 in AD patients was demonstrated. ENSG00000302420 is an uncharacterized gene that is located on the reverse strand of chromosome 17, antisense to about 40% of the gene arrestin beta 2 (ARRB2). β-Arrestin2 is significantly elevated in the brains of AD patients concurrent with frontotemporal lobar degeneration. Besides, overexpression of β-arrestin2 in cell cultures led to increased levels of total and phosphorylated tau, while knockdown of β-arrestin2 reduced these levels. This indicates that β-arrestin2 promotes stabilization of pathological tau protein and aggregation while oligomerized β-arrestin2 impairs the function of p62/SQSTM1, a key autophagy cargo receptor, thereby hindering the autophagic clearance of tau. This impairment consequently contributes to NFT formation and tau-mediated neurodegeneration. This study indicates that β-arrestin2 can upregulate tau levels and conversely, tau can enhance β-arrestin2 expression. This reciprocal relationship suggests a maladaptive positive feedback loop in frontotemporal lobar degeneration (FTLD), where increased β-arrestin2 exacerbates tau accumulation rather than mitigating it. Such a cycle may contribute to disease progression by promoting further tau pathology. 32 On the contrary, ARRB2 silencing or deletion decreases Aβ generation in cell and mouse models by reducing γ-secretase activity through its interaction with Aph-1a, a γ-secretase subunit. 33 However, complete β-arrestin2 loss impairs hippocampal autophagy, activates the Akt–mTOR pathway and disrupts mitochondrial function, leading to oxidative stress and reduced neuronal viability. 34 Since β-arrestin2 also regulates G protein-coupled receptor (GPCR) signaling —which is critical for synaptic plasticity and neuronal survival—its prolonged suppression could disrupt neurotransmission and cognition. Overall, β-arrestin2 has a dual role in AD: promoting Aβ and tau accumulation, yet maintaining essential neuronal signaling and autophagy. The upregulation of ENSG00000302420 may represent a compensatory mechanism mitigating the harmful effects of β-arrestin2 overexpression during moderate AD stages.
In this DEG analysis ARRB2 as the antisense transcript of ENSG00000302420 showed a negligible increase, suggesting ENSG00000302420 might exert it regulatory function in a different fashion. However, further research is required to elucidate its role in the course of AD.
MAN1B1-DT
MAN1B1-DT (MAN1B1 divergent transcript) is an lncRNA antisense to the known gene of MAN1B1-AS1 located on the reverse strand of chromosome 9 just upstream of MAN1B1. Although their transcribed regions do not overlap, their transcription start sites sit only about 40 bp apart, forming a divergent promoter arrangement. In this study MAN1B1-DT was downregulated in AD patients. GTXe recorded MAN1B1-DT with highest expression in pituitary gland, nerves and brain tissues. Similarly, MAN1B1 is expressed highest in brain and nerves as well. However, this DEG analysis demonstrated that the expression of MAN1B1 was insignificant and its modest downregulation indicates that it may exert its function through different regulatory mechanisms.
ENSG00000280537
ENSG00000280537 is located on chromosome 2q35 with two annotated transcripts that are considered chimeric read-through transcripts. The canonical transcript is predicted to encode a characterized 103–amino-acid protein (UniProt F8W735), but it is classified as a nonsense-mediated decay (NMD) transcript, suggesting that it is largely degraded and unlikely does not produce a stable protein. The other transcript is non-coding due to a retained intron and both can be considered as lncRNA. Overall, ENSG00000280537 represents a read-through gene (SLC23A3–NHEJ1) with minimal functional characterization and no experimentally validated protein product. A genome-wide linkage analysis was conducted in a large Belgian family exhibiting autosomal dominant dementia with Lewy bodies which significant linkage was identified on chromosome 2q35–q36, with a maximum LOD score of 3.01 at marker D2S1242 as a specific microsatellite marker. A putative locus for familial neurodegenerative dementia was therefore suggested near 2q35–q36. 35 However, despite extensive sequencing of candidate genes within this interval, no causal mutation or gene has been identified to date and it needs further research. On the other hand, this gene is antisense to another poorly characterized pseudogene called RN7SL764P which based on GTEx has very low expression in brain. In this study, the abnormally high expression of this read-through gene likely reflects failures in transcription termination, splicing fidelity or RNA surveillance, allowing normally degraded transcripts to accumulate and act as lncRNA. Despite elevated expression, they are predicted to be non-functional, with no evidence linking them to AD or tau pathology and there is room for further research to shed light on the true mechanism.
ENSG00000289885, ENSG00000287918, and ENSG00000299227
In this study ENSG00000289885, ENSG00000287918, and ENSG00000299227 were downregulated. These novel lncRNA genes that were identified as potential biomarkers have no protein product, functional annotation or known disease associations. Although these lncRNAs were mentioned as possible gene biomarkers, there are no studies regarding these novel lncRNAs and they do not overlap any gene on the opposite strand making it difficult to postulate their mechanism of action. However, they might act as ceRNAs and their aberrant expression could explain the detrimental symptoms of AD, however this requires further experimental validation.
SYTL4
Although not being among the top biomarkers, SYTL4 was the only coding gene among the high confidence LOOCV ROC AUC assessed biomarkers. SYTL4 encodes synaptotagmin-like protein 4 which is a synaptic vesicle trafficking protein that regulates exocytosis and neurotransmitter release in neurons. The presence of this intracellular protein in the bloodstream indicates neuronal damage. 36 SYTL4 could be a good protein biomarker in blood for mid-stages of AD due to its non-invasive nature which would explain the synapse dysfunction associated with tau-mediated neuronal damage. Thus, upregulation of SYTL4 in AD patients could confirm its compensatory heightened activity for this shortage. Likewise, it could be postulated that SYTL4 could serve as a gene biomarker in blood, given the fact that a non-coding transcript from this gene could act as an lncRNA. Moreover, its gene could be more suitable for cell specific research and modeling. Overall, SYTL4 is an interesting gene to further investigate.
Important AD-related hub genes from significant modules
The genes identified as hub genes from different co-expression modules are groups of genes whose expression levels rise and fall in a coordinated way, suggesting they work together in common biological processes. The network analysis highlighted two hub genes that were associated with diagnosis including control and AD. Here, important genes from these hub genes that are more relevant to AD are discussed.
The orange module
The orange module was significantly associated with diagnosis. The genes in this module were upregulated in the controls which might indicate why the resilient controls do not manifest cognitive impairment. Here important genes among the top 10 hub genes will be discussed.
PPP1R2
PPP1R2 (protein phosphatase 1 regulatory inhibitor subunit 2) regulates and binds to protein phosphatase-1 (PP1), a serine/threonine phosphatase that forms complexes with various regulatory subunits to dephosphorylate target proteins. In this study PPP1R2 was significantly associated with the cognitively resilient control phenotype. The phosphorylation state of tau protein is critically controlled by a balance between kinases and phosphatases. Hyperphosphorylated tau is a key component of NFTs and a hallmark of AD pathology. 37 However, it seems the reason that the resilient controls do not exhibit cognitive decline is not due to the presence of NFTs per se, but rather due to the dynamic regulation of phosphorylation of the state of tau aggregates. Experimental inhibition of PP1 and PP2A in the rat hippocampus using calyculin A induced tau hyperphosphorylation at AD-relevant sites (PHF-1: Ser396/404; 12E8: Ser262/356) and produced AD-like phenotypes, including impaired spatial memory. These findings indicate that PP1 and PP2A play a critical role in tau dephosphorylation in vivo and that their acute inhibition is sufficient to recapitulate tau pathology and cognitive deficits in rodent models.38,39 In this dataset, based on WGCNA association with diagnosis, PPP1R2 expression was higher in control samples compared to AD, consistent with the idea that reduced PPP1R2 in AD could alter PP1 activity and potentially contribute to increased tau phosphorylation. In resilient controls, higher PPP1R2 expression may contribute to more balanced regulation of PP1 activity, supporting proper tau dephosphorylation and potentially protecting against tau hyperphosphorylation. Importantly, early biochemical studies of AD brains demonstrated significantly reduced activities of PP1 and PP2A, supporting the concept that tau hyperphosphorylation arises, at least in part, from impaired dephosphorylation rather than solely from increased kinase activity. 40 Thus reduced phosphatase activity, could cause tau hyperphosphorylation and cognitive dysfunction, suggesting the phosphorylation state of tau rather than its aggregation alone directly impacts neuronal function. The role of PP1-mediated tau dephosphorylation was demonstrated using a dephosphorylation-targeting chimera (DEPTAC) called the D20 peptide, which selectively recruited PP1 to tau. Targeted recruitment of PP1 reduced phosphorylated tau at multiple AD–relevant sites in P301L and 3xTg mouse models. Repeated administration of D20 ameliorated tau-associated pathologies and improved cognitive function, indicating that enhancing tau dephosphorylation can improve tau-driven cognitive deficits in mouse models with established tau pathology. 39 Although historically described as an inhibitor, activator or chaperone of PP1, it was demonstrated that PPP1R2 stabilizes certain PP1 holoenzymes, such as PP1:RepoMan, by displacing the inhibitory C-terminal tail of PP1 and reinforcing subunit interactions. This stabilization enhances the dephosphorylation of PP1 substrates, indicating that PPP1R2 functions as a positive regulator of PP1 activity rather than a general inhibitor. 41 The elevated PPP1R2 expression in cognitively normal individuals with NFT pathology could represent an adaptive response that enhances PP1-mediated tau dephosphorylation, thereby preventing the accumulation of toxic hyperphosphorylated tau species and preserving cognitive function despite the presence of tau aggregates. In this proposed mechanism, upregulation of PPP1R2 stabilizes PP1 holoenzymes, enhances their activity toward tau substrates and maintains the critical balance between tau phosphorylation and dephosphorylation. Conversely, individuals who progress to dementia despite possessing similar NFT burden may fail to mount this compensatory response, leading to insufficient PP1-mediated tau dephosphorylation, accumulation of hyperphosphorylated tau, synaptic dysfunction and cognitive decline. This mechanism could explain why NFT presence represents a necessary but not sufficient condition for cognitive decline. Targeted Enhancement of PPP1R2 activity might therefore represent a potential mechanism to mitigate tau hyperphosphorylation. However, for direct causal role of PPP1R2 in AD further investigation is required.
PSMG1
PSMG1 (proteasome assembly chaperone 1) encodes a dedicated chaperone essential for 20S proteasome assembly, thereby maintaining the functional capacity of the ubiquitin-proteasome system (UPS). A study underscored its role in maintaining proteostasis by identifying it as a central hub gene in neurodevelopmental protein-interaction networks, highlighting its non-redundant importance in brain development and function. 42 Its elevated expression in cognitively normal older individuals suggests that preserved PSMG1 activity supports proteostatic resilience in the aging brain. This may protect against the accumulation of neurotoxic proteins, particularly Aβ oligomers, which have been shown to directly inhibit synaptic proteasome activity and deplete proteasomes from dendrites. By supporting proteasome biogenesis, PSMG1 could potentially counteract early synaptic proteasome dysfunction in AD, mitigating proteotoxic stress and helping to preserve synaptic integrity. This hypothesis is consistent with the evidence that Aβ-induced inhibition of synaptic proteasomes is sufficient to trigger memory deficits in mice. 43 Consequently, therapeutic strategies aimed at reinforcing proteasome assembly, including enhancing chaperone functions via PSMG1 represent a rational approach to sustain synaptic proteostasis and support cognitive function. However, more experimental validation of PSMG1 modulation in different models will be necessary to shed more light on this concept.
ICA1L
ICA1L (islet cell autoantigen 1 like) is a neuronal gene increasingly implicated in AD and cerebrovascular brain pathology. A proteome-wide association study revealed that higher genetically predicted brain levels of ICA1L are associated with control status, while lower levels correlate with increased AD risk. 44 This finding was independently supported by the largest AD genome-wide association study, which identified ICA1L as a prioritized tier 1 risk gene, placing it among a core set of 31 high-confidence candidate genes implicated in AD susceptibility. 45 Furthermore, a PWAS for cerebral small vessel disease (cSVD) identified a cis-pQTL (protein quantitative trait locus) regulating ICA1L protein abundance in the dorsolateral prefrontal cortex. Mendelian randomization analysis demonstrated that lower protein levels of ICA1L causally increased the risk of small vessel stroke and non-lobar intracerebral hemorrhage. 46 This compromised vascular environment increased neuroinflammation, impaired the clearance of metabolic wastes (including Aβ and tau), undermined blood-brain barrier health and induced cognitive impairment characteristic of AD. 47 Thus, ICA1L deficiency initiates a vascular pathology that actively fosters the neuropathological cascade and cognitive impairment characteristic of AD. As supported by another study, ICA1L exemplifies a genetically defined resilience factor. Its role is further reinforced by a multi-ancestry transcriptome-wide study demonstrating that downregulation of ICA1L is associated with both white matter hyperintensity and AD, underscoring its contribution to the shared pathology of vascular and neurodegenerative dementia. 48 Therefore, ICA1L supports the fundamental cellular health of the brain's vasculature and fundamental cellular housekeeping pathways to enhance neuronal resilience against NFTs.
DCTN1-AS1
DCTN1-AS1 (DCTN1 antisense RNA 1) is an lncRNA located on the forward strand of chromosome 2. It overlaps 6614 bp (around 21%) of DCTN1 (dynactin 1) on the reverse strand. DCTN1 encodes dynactin subunit 1, the largest component of the dynactin complex that associates with cytoplasmic dynein and is required for dynein-mediated long-distance retrograde transport along microtubules, with mutations linked to neurodegenerative disease including AD.49,50 In another study which also included the same dataset of this study, DCTN1-AS1 was identified as a differentially expressed lncRNA in both the hippocampus and fusiform gyrus of AD patients, where it was co-expressed with AD-related protein-coding genes, suggesting a potential regulatory role in AD pathology across these regions. 51 In this analysis, DCTN1-AS1 expression was increased in controls; however, DEG analysis of DCTN1 expression demonstrated a negligible decrease in AD, possibly indicating that the functional consequences of DCTN1-AS1 regulation in AD remain to be far more complex and might have other regulatory functions.
The mediumpurple3 module
The Mediumpurple3 module was significantly associated with diagnosis and the genes in this module were upregulated in AD. Most of these genes belong to the proteostasis pathways. Important genes from this module will be discussed in order to explain vulnerability of cognitively impaired AD patients.
HSPA5
The upregulation of HSPA5 (heat shock protein family A (Hsp70) member 5) or known as glucose-regulated protein 78 kDa (GRP78) or binding immunoglobulin protein (BiP) in vulnerable AD patients could provide a strong evidence for chronic activation of the unfolded protein response (UPR) in these individuals. HSPA5 is the master regulator of ER homeostasis, functioning as a molecular chaperone that assists in protein folding and serving as a gatekeeper for UPR activation through its interactions with the ER stress sensors protein kinase RNA-like endoplasmic reticulum kinase (PERK), inositol-requiring enzyme 1 (IRE1) and activating transcription factor 6 (ATF6). 52 Under normal conditions, HSPA5 binds to these sensors, keeping them inactive; however, the accumulation of misfolded proteins makes HSPA5 to dissociate from these sensors, triggering UPR signaling cascades. 53 Extensive neuropathological studies have demonstrated elevated HSPA5 (BiP/GRP78) expression in AD brains, with protein levels significantly increased in both the temporal cortex and hippocampus of affected individuals. Immunohistochemical analysis revealed that UPR activation occurs preferentially in neurons with diffuse phosphorylated tau rather than in mature NFTs, suggesting an early stress response in vulnerable hippocampal regions prior to overt degeneration. 54 The involvement of HSPA5 in AD-related proteostasis extends beyond its general ER chaperone role: in cultured cells expressing mutant amyloid precursor protein (APP), HSPA5 (GRP78) directly interacts with APP and inhibits its maturation, resulting in decreased Aβ production. 55 In a Taiwanese cohort, HSPA5 promoter polymorphisms were associated with AD susceptibility, with alleles modulating basal and ER stress-induced HSPA5 expression potentially influencing disease risk. 56 Furthermore, experimental evidence suggests that pharmacological or genetic enhancement of HSPA5 expression can confer neuroprotection in models of neurodegeneration, validating HSPA5 as a potential therapeutic target.57,58 In vulnerable neuronal populations, endogenous induction of HSPA5 (GRP78/BiP) occurs in response to proteotoxic stress and accompanies established pathology, but this reactive response is insufficient to prevent progressive neuronal loss. In contrast, experimental studies have demonstrated that proactive enhancement of HSPA5 expression prior to or during early stages of proteotoxic insult, reprograms unfolded protein response signaling, suppresses pro-apoptotic pathways and confers robust neuroprotection in animal models of α-synuclein–mediated neurodegeneration. 59 These findings highlight a critical temporal distinction between early/adaptive versus late/chronic activation of UPR. By the time chronic HSPA5 elevation is detectable in vulnerable patients, neurons have exhibited extensive functional impairment and pro-apoptotic pathways. These observations imply that therapeutic strategies targeting HSPA5 or other UPR components may require intervention at very early disease stages to recapitulate protection observed in experimental models; however, proposing a definitive mechanism requires further investigation.
HSPA1B
WGCNA revealed significant upregulation of HSPA1B (HSP72/HSP70-1B) in vulnerable AD patients as the major stress-inducible cytosolic heat shock protein. HSPA1B is one of two nearly identical stress-inducible HSP70 genes along with HSPA1A that encodes a 70-kDa molecular chaperone that recognizes and binds to short exposed hydrophobic peptide segments on misfolded proteins, utilizing ATP hydrolysis to facilitate either refolding or delivery to degradation pathways. 60 Studies in cellular and animal models have demonstrated that stress-inducible HSP70s interact with misfolded tau, suppress tau aggregation and attenuate tau-mediated toxicity, in part by limiting the accumulation of aggregation-competent tau species, suggesting that HSPA1B might also share similar protective functions. The stress-inducible HSP72 directly interacts with tau protein. However, this endogenous upregulation appears to occur too late to prevent pathology. The protective capacity of stress-inducible Hsp70s depends on tau's interaction state: the Hsp72 isoform promotes tau ubiquitination and degradation through recruitment of the E3 ligase C-terminus of hsc70-interacting protein (CHIP) when tau is released from microtubules, whereas tau that engages alternative pathways or modifications is not efficiently cleared. 61 It is postulated that the HSPA1B upregulation in vulnerable patients likely represents an insufficient reactive response after proteostasis crisis. The efficacy of Hsp70-mediated tau quality control is context dependent. Experimental studies have demonstrated that the stress-inducible Hsp70 paralog Hsp72 (HSPA1A) promotes tau turnover when stable chaperone–tau complexes are formed, whereas transient or weaker interactions favor tau retention. These findings suggest that the strength of Hsp72-tau engagement may determine the efficiency of tau clearance. 62 Thus, in this study HSPA1B elevation could represent a reactive, belated response contrasting with resilient individuals who maintain proteostasis through preventive mechanisms that avoid triggering late-stage stress responses.
PDIA4
PDIA4 (protein disulfide isomerase family A member 4) also known as endoplasmic reticulum protein, 72 kDa (ERp72) is a member of the protein disulfide isomerase (PDI) family of endoplasmic reticulum (ER) oxidoreductases, enzymes that catalyzes thiol–disulfide interchange reactions during oxidative protein folding and contribute to ER quality control. PDIA4 expression is increased in response to ER stress, consistent with its role in handling misfolded proteins within the ER lumen. 63 Although PDI upregulation is classically considered as an adaptive component of the ER stress and unfolded protein response, evidence from studies in cancer and other chronic stress contexts suggests that persistent dysregulation of PDI family members, including PDIA4, may reflect a broader ER proteostasis imbalance rather than a strictly protective response. By analogy, similar mechanisms could contribute to chronic ER stress observed in neurodegenerative diseases such as AD, which is characterized by tau pathology. 64 In the context of AD, PDIA4 upregulation likely reflects chronic ER stress and an activated, but ultimately maladaptive, UPR. While PDI upregulation is initially protective by promoting oxidative protein folding, disulfide bond isomerization and ER-associated degradation, prolonged or dysregulated PDI activity may contribute to oxidative stress and activation of apoptotic signaling pathways. Such mechanisms have been proposed to contribute to selective neuronal vulnerability in tau- and amyloid-rich regions during neurodegeneration, 65 suggesting that PDIA4 could be a component or mediator of proteostatic failure in neurodegeneration. Members of the PDI family have been implicated in neurodegenerative disease through their roles in protein folding and ER stress. Immunohistochemical analyses of AD brains demonstrate that PDI (PDIA1), the archetypal family member, localizes to NFTs composed of hyperphosphorylated tau, suggesting an association between PDI dysfunction and tau pathology. 66 The functional consequences of PDIA4 and related PDI family member upregulation in AD remain complex. While PDI enzymes facilitate proper protein folding under physiological conditions, sustained UPR activation and chronic oxidative stress in neurodegeneration can lead to S-nitrosylation of catalytic cysteines, inhibiting PDI enzymatic activity and paradoxically exacerbating protein misfolding. 67 Nitrosative stress can induce S-glutathionylation of PDI, providing a mechanism for sustained inhibition of its enzymatic activity and prolonged UPR activation. 68 It could be postulated that the temporal dynamics of PDI induction are critical: early UPR activation with PDI upregulation which may represent an adaptive response in neurons experiencing initial protein misfolding stress, whereas persistent elevation, as observed in our vulnerable AD cohort, reflects a failed compensatory response in cells already undergoing irreversible proteostatic collapse. The convergent elevation of PDIA4 alongside HSPA5 and stress-inducible HSP70 (HSPA1B) in vulnerable AD patients underscores the comprehensive activation of ER and cytosolic proteostasis networks in response to tau and amyloid pathology. This dysfunction in molecular strategy may be a fundamental determinant of cognitive impairment in AD neuropathology.
DNAJB1
DNAJB1, also known as Hsp40, is a member of the Hsp40/DnaJ co-chaperone family which interacts with aggregation-prone tau species, including seeding-competent oligomers and mature fibers, via its C-terminal domain II. By targeting these aggregation-prone tau species, DNAJB1 inhibits primary nucleation and slows down elongation, thereby suppressing tau aggregation. While DNAJB1 does not significantly bind to tau monomers, its complementary activity with other Hsp40 family members, such as DNAJA2, which can bind to both monomers and fibers, provides a broader protective effect against tau amyloid formation. 69 In AD, DNAJB1 expression shows region-specific alterations. It is downregulated in the parietal cortex and among chaperone-related genes in the cingulate gyrus, consistent with altered molecular chaperone activity in these regions. 70 However, in this study, DNAJB1 was upregulated in fusiform gyrus of AD patients. Paradoxically, upregulated DNAJB1—despite its protective chaperone function—could contribute to tau pathology through mechanisms analogous to other DnaJ/Hsc70 co-chaperones. For example, DnaJC5 has been shown to facilitate the Hsc70-dependent extracellular release of tau from neurons, suggesting that increased chaperone activity might inadvertently increase the pool of aggregation-prone tau available for potential extracellular seeding and intercellular propagation.71,72 These released aggregation-prone tau species could potentially accumulate in brain regions where DNAJB1 expression and amyloid burden are high, thereby promoting the progression of tau pathology during the mid-stages of AD. However, further research is required to confirm this mechanism.
STIP1
STIP1 (Stress-Inducible Phosphoprotein 1) or Hsp70–Hsp90 organizing protein (HOP) is a co-chaperone that links Hsp70 and Hsp90 chaperone systems, contributing to protein folding and cellular proteostasis. Interestingly, while many cancers show elevated Hop levels, the aging healthy human brain exhibits a decline in Hop. 73 In AD, STIP1 function is dysregulated, which may impair the handling of misfolded proteins, including hyperphosphorylated tau, indirectly promoting tau aggregation and NFT formation. STIP1 binds to Hsp70 and its altered activity, along with other co-chaperones such as CHIP, FKBP52 (FK506-Binding Protein 4) and Cdc37 (Cell Division Cycle 37), are associated with disrupted chaperone networks that exacerbate tau pathology. Understanding STIP1's role in these chaperone complexes may guide the development of therapeutic strategies aimed at reducing tau accumulation or promoting its clearance in AD. 74 In this study, STIP1 was found to be expressed higher in the diseased, suggesting that increased expression of this co-chaperone might contribute to impaired protein homeostasis (proteostasis) and the progression of AD.
JMJD6
JMJD6 (jumonji domain containing 6) is a nuclear enzyme of the Jumonji C (JmjC) family that functions primarily as a lysyl hydroxylase and is a putative arginine demethylase. It regulates histone modifications, RNA splicing and transcriptional processes, playing critical roles in epigenetic control, development and cellular homeostasis, including neuronal differentiation. 75 A predictive-network analysis integrating transcriptomic and genomic data from human AD brains identified JMJD6 as a neuron-specific key driver, suggesting a central regulatory role in neuronal gene networks associated with AD pathology. Functional validation in human iPSC-derived neurons demonstrated that shRNA-mediated knockdown of JMJD6 significantly increased the neurotoxic Aβ42/Aβ40 ratio and the phosphorylated tau (p231-tau)/total tau ratio, indicating a dual impact on core AD pathological outcomes. Genome-wide RNA sequencing following knockdown revealed that JMJD6 perturbation altered the expression of hundreds of downstream genes. Network analysis of these changes, integrated with the predictive models, positioned JMJD6 at an upstream regulator within a network of key drivers, ultimately converging on known AD-relevant factors such as REST and VGF. These data identify JMJD6 as a validated key driver whose perturbation directly modulates both amyloid and tau pathology in neurons, supporting its role as a potential upstream node in AD-associated molecular cascades. 76 The observed upregulation of JMJD6 in AD brains in this study may reflect a compensatory or stress-responsive mechanism in neurons. Given its role as a regulator of transcription, RNA splicing and protein hydroxylation, increased JMJD6 expression could represent an adaptive response to counteract the accumulation of neurotoxic Aβ and phosphorylated tau.
SPR
Sepiapterin reductase (SPR) appeared as a distinct gene that is involved in tetrahydrobiopterin (BH4) metabolism which has been demonstrated to be dysregulated in AD Brains. 77 It has also been demonstrated that in the temporal lobe of patients with AD, a specific defect in BH4 metabolism is observed, resulting in reduced total biopterin levels. 78 SPR catalyzes the final step in the de novo BH4 synthesis and it has been demonstrated that peripheral administration of BH4 increased cognitive power and rescued memory deficits in 3xTg-AD mice, while also reversing high-fat diet–induced glucose intolerance, without affecting Aβ or tau pathologies. 79 An increase in sepiapterin reductase (SPR) expression in AD is biologically plausible as a compensatory response to BH4 deficiency due to oxidative stress which could also originate from proteostasis failure. Upregulation of biosynthetic enzymes under metabolic stress has been observed in other neurodegenerative disorders, such as the increased expression of SPR in Parkinson's disease 80 ; however, this interpretation should be independently verified in AD.
Proposed mechanisms of cognitive decline
The presence of NFTs in cognitively normal controls indicates that NFT pathology alone is insufficient to drive cognitive decline. As mentioned earlier, this observation is well-supported by multiple lines of evidence showing that cognitive resilience can occur even in individuals with substantial NFT burden corresponding to Braak stages III-IV. Indeed, an epidemiological study had demonstrated that an approximately a quarter of cognitively normal individuals aged older than 75 years exhibited AD–like neuropathological changes, including NFTs, 81 underscoring that the mere presence of tau aggregates cannot fully account for clinical dementia. It appears that at this stage the resilient controls with NFTs preserve their cognitive power through maintenance of efficient proteostasis which is compromised in AD patients. On the contrary, patients suffering from cognitive decline demonstrate chronic dysregulation of proteostasis of protein folding, stabilization and stress response. In this analysis most of the compromised genes (STIP1, DNAJB1, HSPA5, HSPA6, 82 HSPA1B, PDIA4, and SERPINH1 83 ) which encode molecular chaperones and ER quality-control proteins, have a role to prevent protein misfolding and aggregation during cellular stress. Others function as regulatory stress-responsive transcription and epigenetic control modulators (JDP2 84 and JMJD6) or oxidative stress modulator (SPR). Neuronal proteostasis is critical for maintaining proper protein folding, trafficking and degradation which its disruption is a central feature of AD. When proteostasis fails, misfolded and aggregation-prone proteins such as tau accumulate and overwhelm molecular chaperones, the ubiquitin-proteasome system and autophagy pathways. This imbalance triggers ER stress and activates the UPR as a compensatory mechanism aimed at restoring homeostasis. 85 While initially protective, chronic ER stress leads to sustained activation of the PERK–eukaryotic translation initiation factor 2 alpha subunit (eIF2α) branch of the UPR, resulting in prolonged repression of global protein synthesis. Consequently, neurons fail to produce essential synaptic and plasticity-related proteins, leading to synaptic dysfunction, impaired communication and early cognitive deficits. Experimental evidence from tauopathy mouse models shows that high levels of misfolded tau aggregates activate PERK–eIF2α signaling, reducing global translation and synaptic protein levels, while pharmacological inhibition of PERK restores protein synthesis, preserves synaptic function and prevents neurodegeneration. Beyond translational repression, prolonged UPR activation drives pathological tau modifications. PERK signaling enhances the activity of kinases such as glycogen synthase kinase-3 beta (GSK3β), promoting tau hyperphosphorylation at disease-relevant sites. 86 Human postmortem studies of AD and other tauopathies demonstrate a strong association between UPR activation markers such as protein kinase-like endoplasmic reticulum kinase (pPERK) and phosphorylated inositol-requiring enzyme 1 (pIRE1) and phosphorylated tau in hippocampal neurons, even in early disease stages independently of amyloid pathology. Double-staining analyses indicate that UPR activation predominantly occurs in neurons exhibiting diffuse phospho-tau, suggesting a direct mechanistic link. Hyperphosphorylated tau disengages from microtubules, disrupts axonal transport, aggregates and further exacerbates cellular stress, creating a vicious cycle of worsening proteostasis failure. 87 Over time, these combined chaos of persistent translational repression, synaptic dysfunction and toxic tau accumulation could lead to progressive neuronal loss, particularly in memory-critical regions such as the hippocampus and or fusiform gyrus which is responsible for visual recognition, ultimately manifested as cognitive decline and dementia.
Collectively, these observations indicate that cognitive decline in AD is not solely determined by the presence of NFTs. Instead, maladaptive proteostasis responses, chronic ER stress and sustained UPR overactivation creates a cellular environment in which tau pathology amplifies neuronal dysfunction. This mechanistic framework could explain why some resilient individuals with similar NFT loads do not exhibit cognitive deficits through effective proteostasis, adaptive UPR responses and protected synaptic function, whereas in AD these systems are overwhelmed, driving the progression of cognitive impairment.
lncRNAs and miRNAs
Most of the investigated gene biomarkers have been focused on protein-coding genes and most of these protein-coding genes lie in pathways related to Aβ such as APP, PSEN1, 88 and PSEN2 89 or tau phosphorylation such as MAPT 90 or involved in lipid metabolism or immune response such as APOE, 91 while based on GWAS studies there are non-coding RNAs (ncRNAs) such as miR-16-5p that specifically interact with biomarkers associated with amyloid plaques. Noteworthy, miR-143-3p, miR-146a-5p, miR-26a-5p, miR-16-5p, miR-124-3p and let-7b-5p are associated with biomarkers related to NFTs. On the other side, the lncRNAs such as THORLNC and LINC01956 are related to both NFTs and Aβ. 90 LncRNAs are emerging players in the molecular pathways which can control other transcripts such as microRNAs. In addition to these ncRNAs, circular RNAs, such as circPSEN1 which has been shown to be upregulated in the brain, have been hypothesized that can act as sponge similar to lncRNAs, causing neuroinflammation or synaptic dysfunction. 92 All these information show that the role of lncRNAs should never be neglected since approximately 70% of known human microRNAs are expressed in the brain, revealing their significance in the vast network of non-coding genes. 93 On the other hand, these microRNAs are themselves controlled by certain lncRNAs at a higher level. Robust studies have demonstrated that microRNAs such as miR-26b-5p 94 and miR-16b-5p 95 were upregulated and on the other side miR-181c-5p, 96 miR-29a-3p, 97 miR-29b-3p 98 and miR-153-3p 99 were downregulated in brain tissues and these miRNAs might be a target of predicted lncRNAs. As observed, ENSG00000280537 could code an uncharacterized protein from a nonsense-mediated decay transcript and this could also act as an lncRNA before destruction given its high expression. The benefit of investigation of lncRNAs is that a more realistic understanding of the mechanism of the disease at the transcript level is revealed and could provide possible interventions in the future in order to not only diagnose it earlier but also to stop the progress of the disease.
Conclusion
This single cross-sectional cohort study was the first one of its kind to investigate the gene signatures confined to fusiform gyrus loaded with NFTs at Braak stages III–IV of both AD patients and cognitively-healthy controls. This small cohort identified 218 significant DEGs based on diagnosis by considering all available covariates. Although the number of samples was limited, high quality samples were shortlisted based on RIN to retrieve genuine data. This study also found out that a small portion of DEGs at this stage of AD are sex-specific and more pronounced in females. LOOCV ROC AUC analysis on 218 diagnostic DEGs, highlighted seven candidate genes with high discriminatory performance. These lncRNAs might have other regulatory functions and or sponge effect which may both serve as mechanistic contributors and potential biomarkers. AD is marked mainly by protein-folding and proteostasis deficits, where normal quality control mechanisms fail. In this analysis, WGCNA demonstrated that cognitive resilience is characterized by early compensatory mechanisms of tau phosphorylation homeostasis (PPP1R2), proteostasis (PSMG1) and brain vascular health (ICA1L). Overall, these findings suggest that therapeutic strategies aimed at enhancing these genes to improve tau dephosphorylation, maintain proteasome function or preserve vascular health of brain could mimic the molecular signatures of resilient individuals and provide promising approaches for preventing cognitive decline in at-risk individuals. On the contrary, cognitive vulnerability reflected late, compromised stress responses of chaperons in ER (HSPA5), protein folding dysregulation (PDIA4), compromised cytosol stress responses (HSPA1B) along with other regulators (DNAJB1, STIP1, and JMJD6) and also dysregulation in BH4 metabolism (SPR) after irreversible damage has occurred. It is noteworthy that HSF1 appeared as a key upstream player in regulating some key AD-associated hub genes. Overall, these findings suggest therapeutic strategies should focus on enhancing proactive and preventive mechanisms to stop the progress of the disease in a timely manner. In silico hybridzation analyses predicted thermodynamically favorable interactions between some transcripts of lncRNA which belonged to the diagnostic DEGs and 14 AD-related miRNAs. ENSG00000280537 becomes more prominent, as it is also among the top biomarkers with highest upregulation in the top candidate biomarkers. However, these in silico predicted candidates require empirical validation and the next practical steps from this report could be experimental validation by wet-lab methods such as qPCR or digital PCR on the candidate genes in independent tissue cohorts and or single-cell type resolved experiments. However, the information revealed from this dataset could lay the groundwork for subsequent research to clarify the definitive gene networks and mechanisms which govern moderate stages of AD.
Supplemental Material
sj-xlsx-1-alz-10.1177_13872877261452277 - Supplemental material for Identification of candidate diagnostic biomarkers and gene networks for moderate stages of Alzheimer's disease in fusiform gyrus exhibiting neurofibrillary tangles
Supplemental material, sj-xlsx-1-alz-10.1177_13872877261452277 for Identification of candidate diagnostic biomarkers and gene networks for moderate stages of Alzheimer's disease in fusiform gyrus exhibiting neurofibrillary tangles by Abbas Beh-Pajooh in Journal of Alzheimer's Disease
Supplemental Material
sj-xlsx-2-alz-10.1177_13872877261452277 - Supplemental material for Identification of candidate diagnostic biomarkers and gene networks for moderate stages of Alzheimer's disease in fusiform gyrus exhibiting neurofibrillary tangles
Supplemental material, sj-xlsx-2-alz-10.1177_13872877261452277 for Identification of candidate diagnostic biomarkers and gene networks for moderate stages of Alzheimer's disease in fusiform gyrus exhibiting neurofibrillary tangles by Abbas Beh-Pajooh in Journal of Alzheimer's Disease
Supplemental Material
sj-xlsx-3-alz-10.1177_13872877261452277 - Supplemental material for Identification of candidate diagnostic biomarkers and gene networks for moderate stages of Alzheimer's disease in fusiform gyrus exhibiting neurofibrillary tangles
Supplemental material, sj-xlsx-3-alz-10.1177_13872877261452277 for Identification of candidate diagnostic biomarkers and gene networks for moderate stages of Alzheimer's disease in fusiform gyrus exhibiting neurofibrillary tangles by Abbas Beh-Pajooh in Journal of Alzheimer's Disease
Supplemental Material
sj-xlsx-4-alz-10.1177_13872877261452277 - Supplemental material for Identification of candidate diagnostic biomarkers and gene networks for moderate stages of Alzheimer's disease in fusiform gyrus exhibiting neurofibrillary tangles
Supplemental material, sj-xlsx-4-alz-10.1177_13872877261452277 for Identification of candidate diagnostic biomarkers and gene networks for moderate stages of Alzheimer's disease in fusiform gyrus exhibiting neurofibrillary tangles by Abbas Beh-Pajooh in Journal of Alzheimer's Disease
Supplemental Material
sj-xlsx-5-alz-10.1177_13872877261452277 - Supplemental material for Identification of candidate diagnostic biomarkers and gene networks for moderate stages of Alzheimer's disease in fusiform gyrus exhibiting neurofibrillary tangles
Supplemental material, sj-xlsx-5-alz-10.1177_13872877261452277 for Identification of candidate diagnostic biomarkers and gene networks for moderate stages of Alzheimer's disease in fusiform gyrus exhibiting neurofibrillary tangles by Abbas Beh-Pajooh in Journal of Alzheimer's Disease
Supplemental Material
sj-pdf-6-alz-10.1177_13872877261452277 - Supplemental material for Identification of candidate diagnostic biomarkers and gene networks for moderate stages of Alzheimer's disease in fusiform gyrus exhibiting neurofibrillary tangles
Supplemental material, sj-pdf-6-alz-10.1177_13872877261452277 for Identification of candidate diagnostic biomarkers and gene networks for moderate stages of Alzheimer's disease in fusiform gyrus exhibiting neurofibrillary tangles by Abbas Beh-Pajooh in Journal of Alzheimer's Disease
Footnotes
Acknowledgements
I would like to truly dedicate this paper to all brave men and women in the land of Persians and those who fought against the tyranny of their era and sacrificed their lives for the sake of freedom.
I would also like to thank Professor George Perry and his colleagues for their assistance in publishing this paper.
Ethical considerations
Not applicable.
Consent to participate
Not applicable.
Consent for publication
Not applicable.
Author contribution(s)
Funding
The author received no financial support for the research, authorship, and/or publication of this article.
Declaration of conflicting interests
The author declared no potential conflicts of interest with respect to the research, authorship, and/or publication of this article.
Data availability statement
All related data are available within the paper, supplementary files and online resources as mentioned.
Supplemental material
Supplemental material for this article is available online.
References
Supplementary Material
Please find the following supplemental material available below.
For Open Access articles published under a Creative Commons License, all supplemental material carries the same license as the article it is associated with.
For non-Open Access articles published, all supplemental material carries a non-exclusive license, and permission requests for re-use of supplemental material or any part of supplemental material shall be sent directly to the copyright owner as specified in the copyright notice associated with the article.