



Abstract
Background
Alzheimer's disease (AD) is a neurodegenerative disorder linked to mitochondrial energy metabolism dysfunction. This study investigated differentially expressed genes (DEGs) related to this process.
Objective
We aimed to identify key mitochondrial energy metabolism-related DEGs in the blood of patients with AD, construct their regulatory networks, evaluate their diagnostic potential, and explore their link with the immune microenvironment.
Methods
We analyzed AD datasets from gene expression datasets (GEO) and mitochondrial genes from GeneCards using R to identify DEGs. Hub genes were screened via protein–protein interaction (PPI) network analysis. Functional enrichment analysis, gene ontology (GO), Kyoto Encyclopedia of Genes and Genomes (KEGG), gene set enrichment analysis (GSEA), and regulatory network construction (mRNA-miRNA, mRNA-TF) were performed. Immune infiltration and receiver operating characteristic (ROC) analyses assessed immunological associations and diagnostic value.
Results
Fifteen mitochondrial energy metabolism-related DEGs were identified. PPI analysis revealed nine hub genes. Regulatory networks were successfully constructed. ROC analysis confirmed the strong diagnostic potential of these hubs, which also showed significant correlations with eleven immune cell types
Conclusions
We developed an AD diagnostic framework based on mitochondrial metabolism DEGs. These findings reveal mitochondrial–immune interactions in AD and provide novel candidate biomarkers for early diagnosis.
Introduction
The incidence of Alzheimer's disease (AD) is steadily increasing, making it a major global health concern. 1 This debilitating neurodegenerative disorder currently affects millions of individuals worldwide. Extensive research efforts have explored various aspects of AD, spanning genetic predisposition (e.g., APOE and PSEN mutations), amyloid- and tau-related pathology, neuroinflammation, and the development of biofluid biomarkers. Increasing evidence highlights mitochondrial bioenergetic dysfunction as a central feature of AD pathogenesis, characterized by impaired electron transport chain activity, excessive reactive oxygen species (ROS) production, and defective mitophagy.2,3 Key regulatory molecules such as PGC-1α and SIRT3 exhibit altered expression patterns that correlate with metabolic deficits and disease progression. 4 Moreover, mitochondrial interactions with amyloid precursor protein derivatives contribute to calcium dysregulation and exacerbate neuronal energy failure. Neuroimaging studies further support this by demonstrating consistent patterns of cerebral glucose hypometabolism in AD. 5 Collectively, these findings position mitochondrial energy metabolism not only as driver of disease pathology but also as a promising therapeutic target aimed at restoring neuronal bioenergetic homeostasis.
While mitochondrial dysfunction is well-established in AD brains, its manifestation in accessible peripheral tissues remains underexplored despite potential clinical utility for early diagnosis. High-throughput transcriptomic analyses of public datasets enable systematic identification of conserved mitochondrial pathways across tissues, offering cost-effective prioritization of therapeutic targets.6–8 Mitochondria are multifunctional organelles that play pivotal roles in wide range of cellular processes. In addition to serving as the primary site of adenosine triphosphate (ATP) production via oxidative phosphorylation, mitochondria are involved in critical biological functions such as the biosynthesis of key biomolecules, regulation of cellular redox homeostasis, and clearance of metabolic byproducts. These diverse activities are sustained by a complex network of genes and proteins encoded by both mitochondrial and nuclear genomes, which together ensure the coordinated regulation of mitochondrial function. Disruption of any component within this network can compromise cellular homeostasis. In the context of AD, integrated bioinformatics approaches reveal dysregulation of genes involved in mitochondrial energy metabolism that impair neuronal energy supply, thereby contributing to disease pathogenesis. Understanding these networks is critical for deciphering AD mechanisms and identifying diagnostic biomarkers with clinical translational value.
Although the central nervous system (CNS) is the primary site of AD pathology, peripheral blood leukocytes have emerged as a valuable surrogate for studying transcriptional alterations in neurodegenerative diseases. Several studies have demonstrated that leukocytes share common transcriptional regulatory mechanisms with neuronal cells, including pathways related to inflammation, oxidative stress, and mitochondrial function. 9 Moreover, leukocytes are accessible and allow for repeated sampling, facilitating longitudinal studies. Notably, transcriptomic profiles in blood have been shown to reflect disease-related changes in the brain, including in AD. For instance, immune activation and mitochondrial dysfunction observed in AD brains are also detectable in peripheral blood, supporting the use of leukocyte transcriptomes as a proxy for CNS pathology.10–12
Methods
Data acquisition
The Gene Expression Omnibus (GEO) database is a public repository for high-throughput gene expression data. The GEO database provided the AD-related datasets GSE18309 and GSE63060, 13 which we obtained using the R tool GEOquery. 14 The GSE18309 and GSE63060 datasets were obtained from humans using blood as the tissue source. GPL570 is the microarray platform for GSE18309, while GPL6947 is the platform for GSE63060. The details are enumerated in Table 1. Both the GSE18309 and GSE63060 datasets are derived from peripheral blood samples of human subjects. In particular, only 3 AD samples and 3 control samples were used in this investigation out of the 3 AD, 3 mild cognitive impairment (MCI), and 3 control samples included in the dataset GSE18309. Of the 145 AD specimens, 80 MCI specimens, and 104 control specimens in the dataset GSE63060, only 145 AD specimens and 104 control specimens were used in this investigation.
GEO microarray chip information.
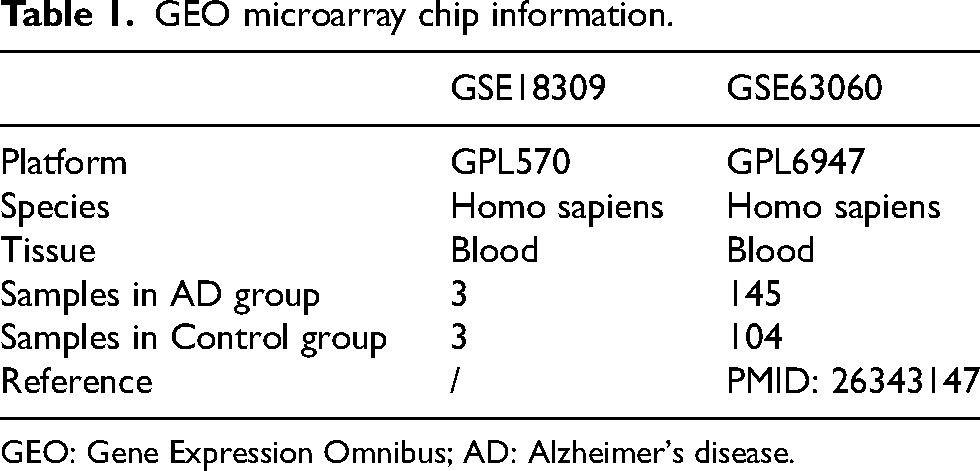
GEO: Gene Expression Omnibus; AD: Alzheimer's disease.
We collected mitochondrial energy metabolism-related genes (MEMRGs) through the GeneCards database. Comprehensive data on human genes may be found in the GeneCards database. Additionally, the search keyword “mitochondrial energy metabolism, retain only” protein-coding “MEMRGs, received 220 MEMRGs. We obtained published datasets 15 related to mitochondrial energy metabolism with the keyword “Mitochondrial Energy Metabolism” on the PubMed website, a total of 188 MEMRGs. After merge and de-duplication, we obtained a total of 385 MEMRGs, with specific information listed in Supplemental Table 1.
To work with the batch of GSE18309 data sets and GSE63060, we combine the GEO data set (combined datasets) using the R tool sva. 16 Lastly, we annotated, normalized, and merged the GEO datasets using the R program limma. 17
Genes differentially expressed in AD related to mitochondrial energy metabolism
The AD group and control group were created from the sample grouping of the combined GEO datasets. Gene differential expression analysis was conducted between the AD group and the control group using the R package limma. For differentially expressed genes (DEGs), adj p < 0.05 and |logFC| > 0.25 were the cutoff values. Among these, the genes with logFC > 0.25 and adj p < 0.05 were classified as up-regulated genes and the genes with logFC < −0.25 and adj p < 0.05 as down-regulated genes. Using the R tool ggplot2, the differential analysis findings were displayed.
We created a Venn diagram by taking the intersection of all DEGs obtained by differential analysis in the combined GEO datasets with a threshold of |logFC| > 0.25 and adj p < 0.05 and MEMRGs in order to produce MEMRDEGs linked with AD. To illustrate, we created a heat map using the R package heatmap and a chromosomal localization map using the R tool RCircos. 18 The relatively low logFC threshold was chosen to improve the sensitivity of differential gene detection, given that expression differences are usually weak in AD-related peripheral blood. This practice is also consistent with recent literature, 19 which has suggested that appropriately lowering the logFC threshold in the exploratory analysis phase can facilitate the discovery of potentially biologically relevant genes. This strategy helps to screen as many candidate genes as possible for subsequent functional and network analyses.
Gene ontology (GO) and KEGG pathway enrichment analysis
For large-scale functional enrichment analysis, encompassing biological process (BP), cellular component (CC), and molecular function (MF), GO 20 is a popular technique. A popular database that contains data on genomes, biological processes, illnesses, and medications is the Kyoto Encyclopedia of Genes and Genomes (KEGG). 21 MEMRDEGs were subjected to GO and KEGG pathway enrichment analysis using the R program clusterProfiler. 22 The Benjamini-Hochberg (BH) p value correction method was used, and the item selection criteria were adj p < 0.05 and FDR value (q value) < 0.25, all of which were deemed statistically significant. To comprehensively investigate the altered biological processes in AD, we performed GO and KEGG pathway enrichment analyses on DEGs identified between AD and control groups.
Gene set enrichment analysis
In order to ascertain a gene's contribution to a trait, Gene Set Enrichment Analysis (GSEA) 23 is utilized to assess the distribution trend of genes within a gene expression dataset in relation to a predetermined gene set. The genes in the combined GEO datasets (Combined Datasets) were first categorized in this study based on the logFC value median. Next, we conducted GSEA on each gene in the combined GEO datasets (Combined Datasets) using the R package clusterProfiler. The GSEA settings were as follows: the number of seeds (2020), the minimum and maximum numbers of genes per gene set (10 and 500, respectively). The gene set c2.cp.all.v2022.1.Hs.symbols.gmt that we obtained from the Molecular Signatures Database (MSigDB) was used for GSEA. Adj p < 0.05 and FDR value (q value) < 0.25 were the filter requirements for GSEA, and Benjamini-Hochberg (BH) was the p value correction technique.
Construction of protein-protein interaction (PPI) networks and screening of hub genes
The proteins in the PPI network interact with one another. A database that looks for known and expected interactions between proteins is called the STRING database. 24 The minimum score > 0.40 [minimum necessary interaction score: medium confidence (0.40)] MEMRDEGs is the basis for interaction in this study. The DEGs connected with MEMRDEGs related to the PPI network are constructed using STRING data. In addition, we employed the following five algorithms included in the cytoHubba 25 plugin of Cytoscape: 26 Maximal Clique Centrality (MCC), Degree, Maximum Neighborhood Component (MNC), Edge Percolated Component (EPC), and Closeness. 27 The top 10 MEMRDEGs were chosen after we first computed the scores of the MEMRDEGs in the PPI Network and ranked them based on those values. Ultimately, we created a Venn diagram and examined the points where the genes derived from the five distinct algorithms intersected. These intersection genes were identified as hub genes associated with mitochondrial energy metabolism.
Construction of regulatory networks
microRNAs, also known as miRNAs, are key players in the regulation of numerous target genes as well as the growth and evolution of organisms. Multiple miRNAs can also control the same target gene. We obtained miRNA related to hub genes for mitochondrial energy metabolism through the TarBase database, 28 retaining only miRNA with “up_down = DOWN,” and used Cytoscape software to visualize the mRNA-miRNA regulatory network in order to examine the relationship between hub genes and miRNAs.
Transcription factors (TFs) regulate gene expression by interacting with their target genes (mRNAs) at the post-transcriptional stage. Since hTFtarget 29 and ChIPBase 30 database access of transcription factors, only retained samples found several upstream, and the downstream samples found the number “sum is greater than 5 transcription factors. Later, we aimed at these transcription factors associated with mitochondrial energy metabolism regulation function of key genes detection, and using Cytoscape visualization software will mRNA-TF control network.
Differences in expression of hub genes and ROC analysis
A grouped comparison plot based on the expression levels of hub genes related to mitochondrial energy metabolism was created in order to investigate further the differences in hub gene expression between AD groups and control groups in the integrated GEO datasets (Combined Datasets). Lastly, we plotted the ROC curve of hub genes related to mitochondrial energy metabolism using the R package pROC, and we computed the area under the curve (AUC) of the ROC curve to assess the diagnostic impact of hub genes related to mitochondrial energy metabolism expression level on the incidence of AD. The ROC curve's AUC typically ranges from 0.5 to 1. The more closely the AUC approaches 1, the stronger the diagnostic impact. An AUC of more than 0.5 indicates that the molecule's expression encourages the occurrence of the event. AUC has poor accuracy when it falls between 0.5 and 0.7 and certain accuracy when it falls between 0.7 and 0.9.
Immuno-infiltration analysis
One method of measuring the relative quantity of each immune cell type infiltration is single-sample gene set enrichment analysis, or ssGSEA (single-sample Gene-Set Enrichment Analysis). Through the published study materials of tumor immune infiltration papers, the algorithm retrieves 28 gene sets that are utilized to identify distinct tumor immune cell types, such as activated B cells, activated CD4T cells, activated CD8T cells, and other varied immune cell subtypes in people. The infiltration level of each immune cell type in each sample was represented by the enrichment score computed from the ssGSEA analysis based on GSVA in the R package. Samples with a p-value < 0.05 were filtered out to create the immune cell infiltration matrix. Through the use of grouped comparison plots, we illustrate the differences in immune cell infiltration abundance between the AD group and the control group in the integrated GEO datasets (Combined Datasets). Additionally, we plot correlation heat maps resulting from correlation analyses between immune cells and hub genes (hub genes) using the R package heatmap. For weak or non-correlation, the correlation coefficient's (r value) absolute value is less than 0.3; for weak correlation, it is between 0.3 and 0.5; and for moderate correlation, it is between 0.5 and 0.8.
Statistical analysis
The R program, version 4.3.0, was utilized for all analyses. Continuous variables are presented as mean ± standard deviation. Non-parametric tests (Wilcoxon rank-sum test) were used for group comparisons due to the non-normal distribution of gene expression data, as confirmed by Shapiro–Wilk tests. Spearman correlation was employed for correlation analyses.
To control for multiple comparisons, the false discovery rate (FDR) was applied using the Benjamini–Hochberg method. A significance threshold of FDR < 0.05 was used for differential expression and enrichment analyses. For ROC analysis, AUC values were reported without further correction due to the exploratory nature of the biomarker evaluation.
A post-hoc power analysis was conducted using the R package pwr to estimate the minimum sample size required to detect a logFC of 0.25 with 80% power at α = 0.05. The analysis indicated that approximately 100 samples per group would be needed, which is consistent with the combined sample size used in this study (AD = 148, Control = 107).
Results
Flow chart of this study
The detailed workflow of the data integration and analytical process is illustrated in Figure 1. We first merged and normalized gene expression data from the GSE18309 and GSE63060 datasets. Then, MEMRGs were identified and further analyzed to detect DEMRDs and MEMRDEGs. Subsequently, a PPI network was constructed to identify hub genes. Finally, immune infiltration analysis using ssGSEA, GSEA, GO and KEGG enrichment analyses, and regulatory network analyses including mRNA–mRNA and mRNA–TF interactions were performed.
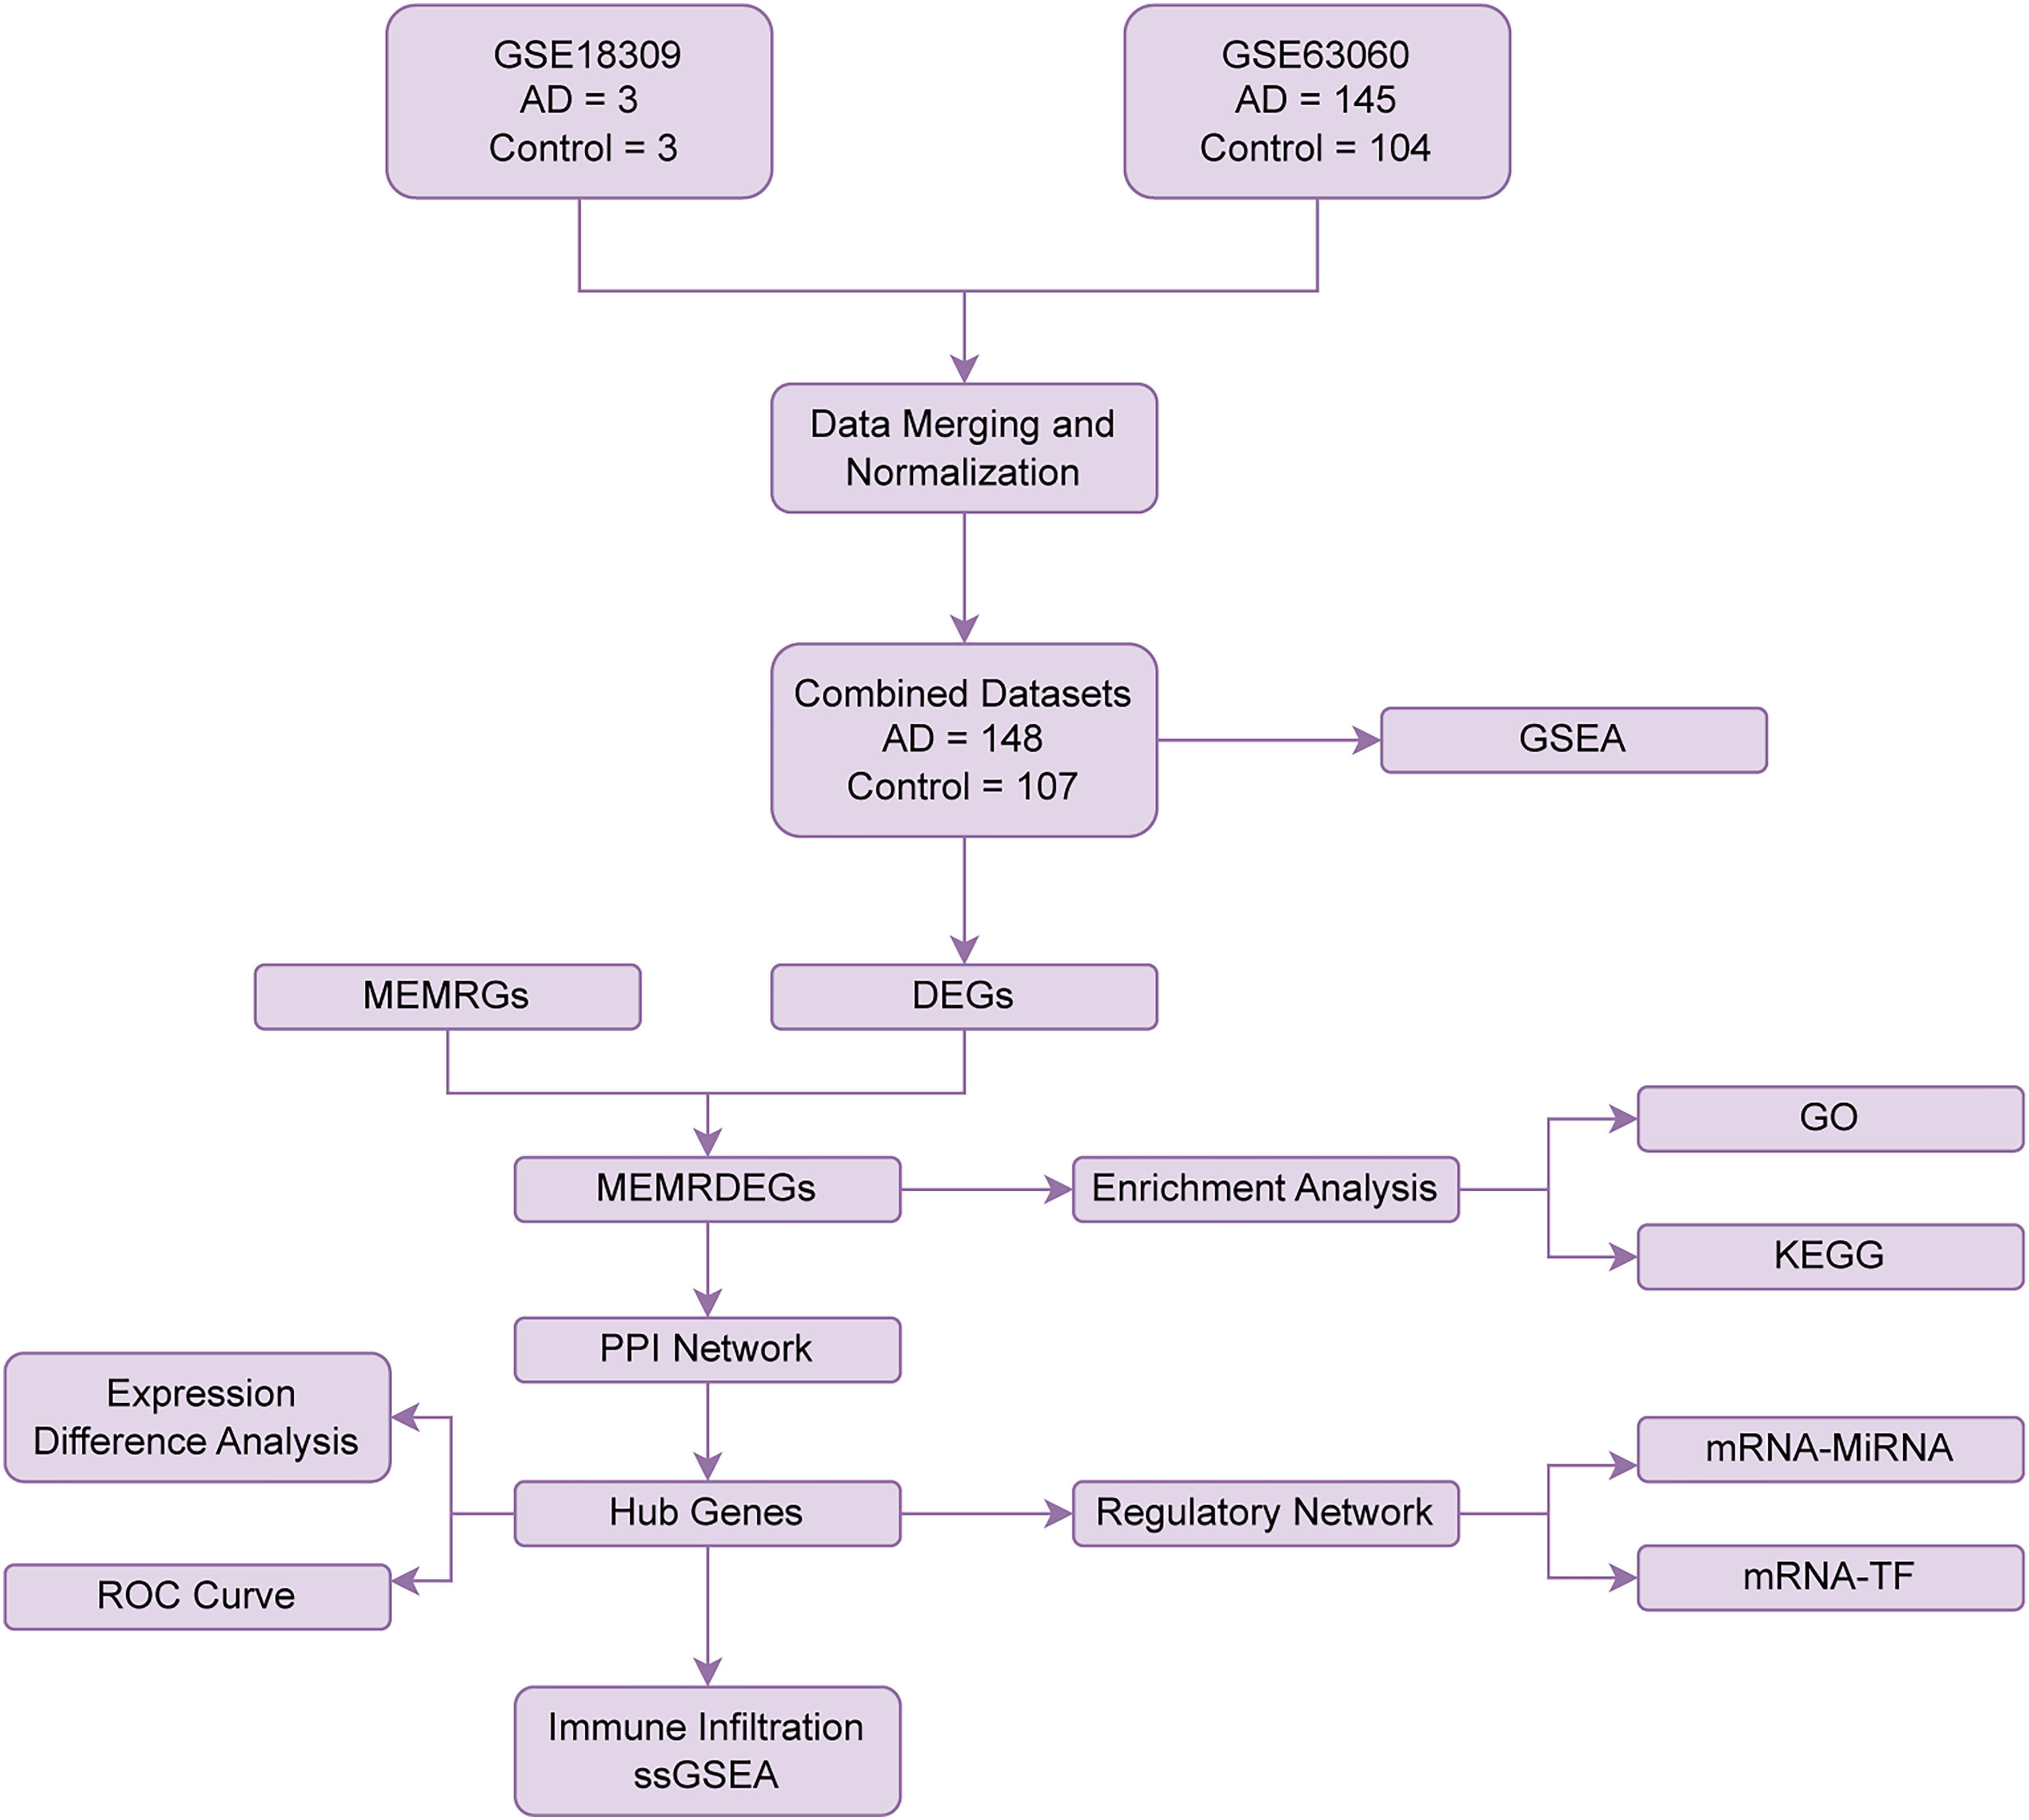
Flow chart for the comprehensive analysis of MEMRDEGs. AD: Alzheimer's disease; DEGs: differentially expressed genes; MEMRGs: mitochondrial energy metabolism-related genes; MEMRDEGs: mitochondrial energy metabolism-related differentially expressed genes; GSEA: gene set enrichment analysis; GO: Gene Ontology; KEGG: Kyoto Encyclopedia of Genes and Genomes; PPI: protein-protein interaction; ssGSEA: single-sample gene-set enrichment analysis; ROC Curve: receiver operating characteristic curve; TF: transcription factor.
Consolidation of AD datasets
The AD datasets GSE18309 and GSE63060 were first processed using the R program sva to eliminate batch effects, resulting integrated GEO datasets (Combined Datasets). Principal Component Analysis (PCA) and box plots were used to assess the datasets before and after batch effect correction (Figure 2A–D). Following adjustment, both the grouped box plot and PCA plots indicated that the batch effects were effectively in combined AD dataset.
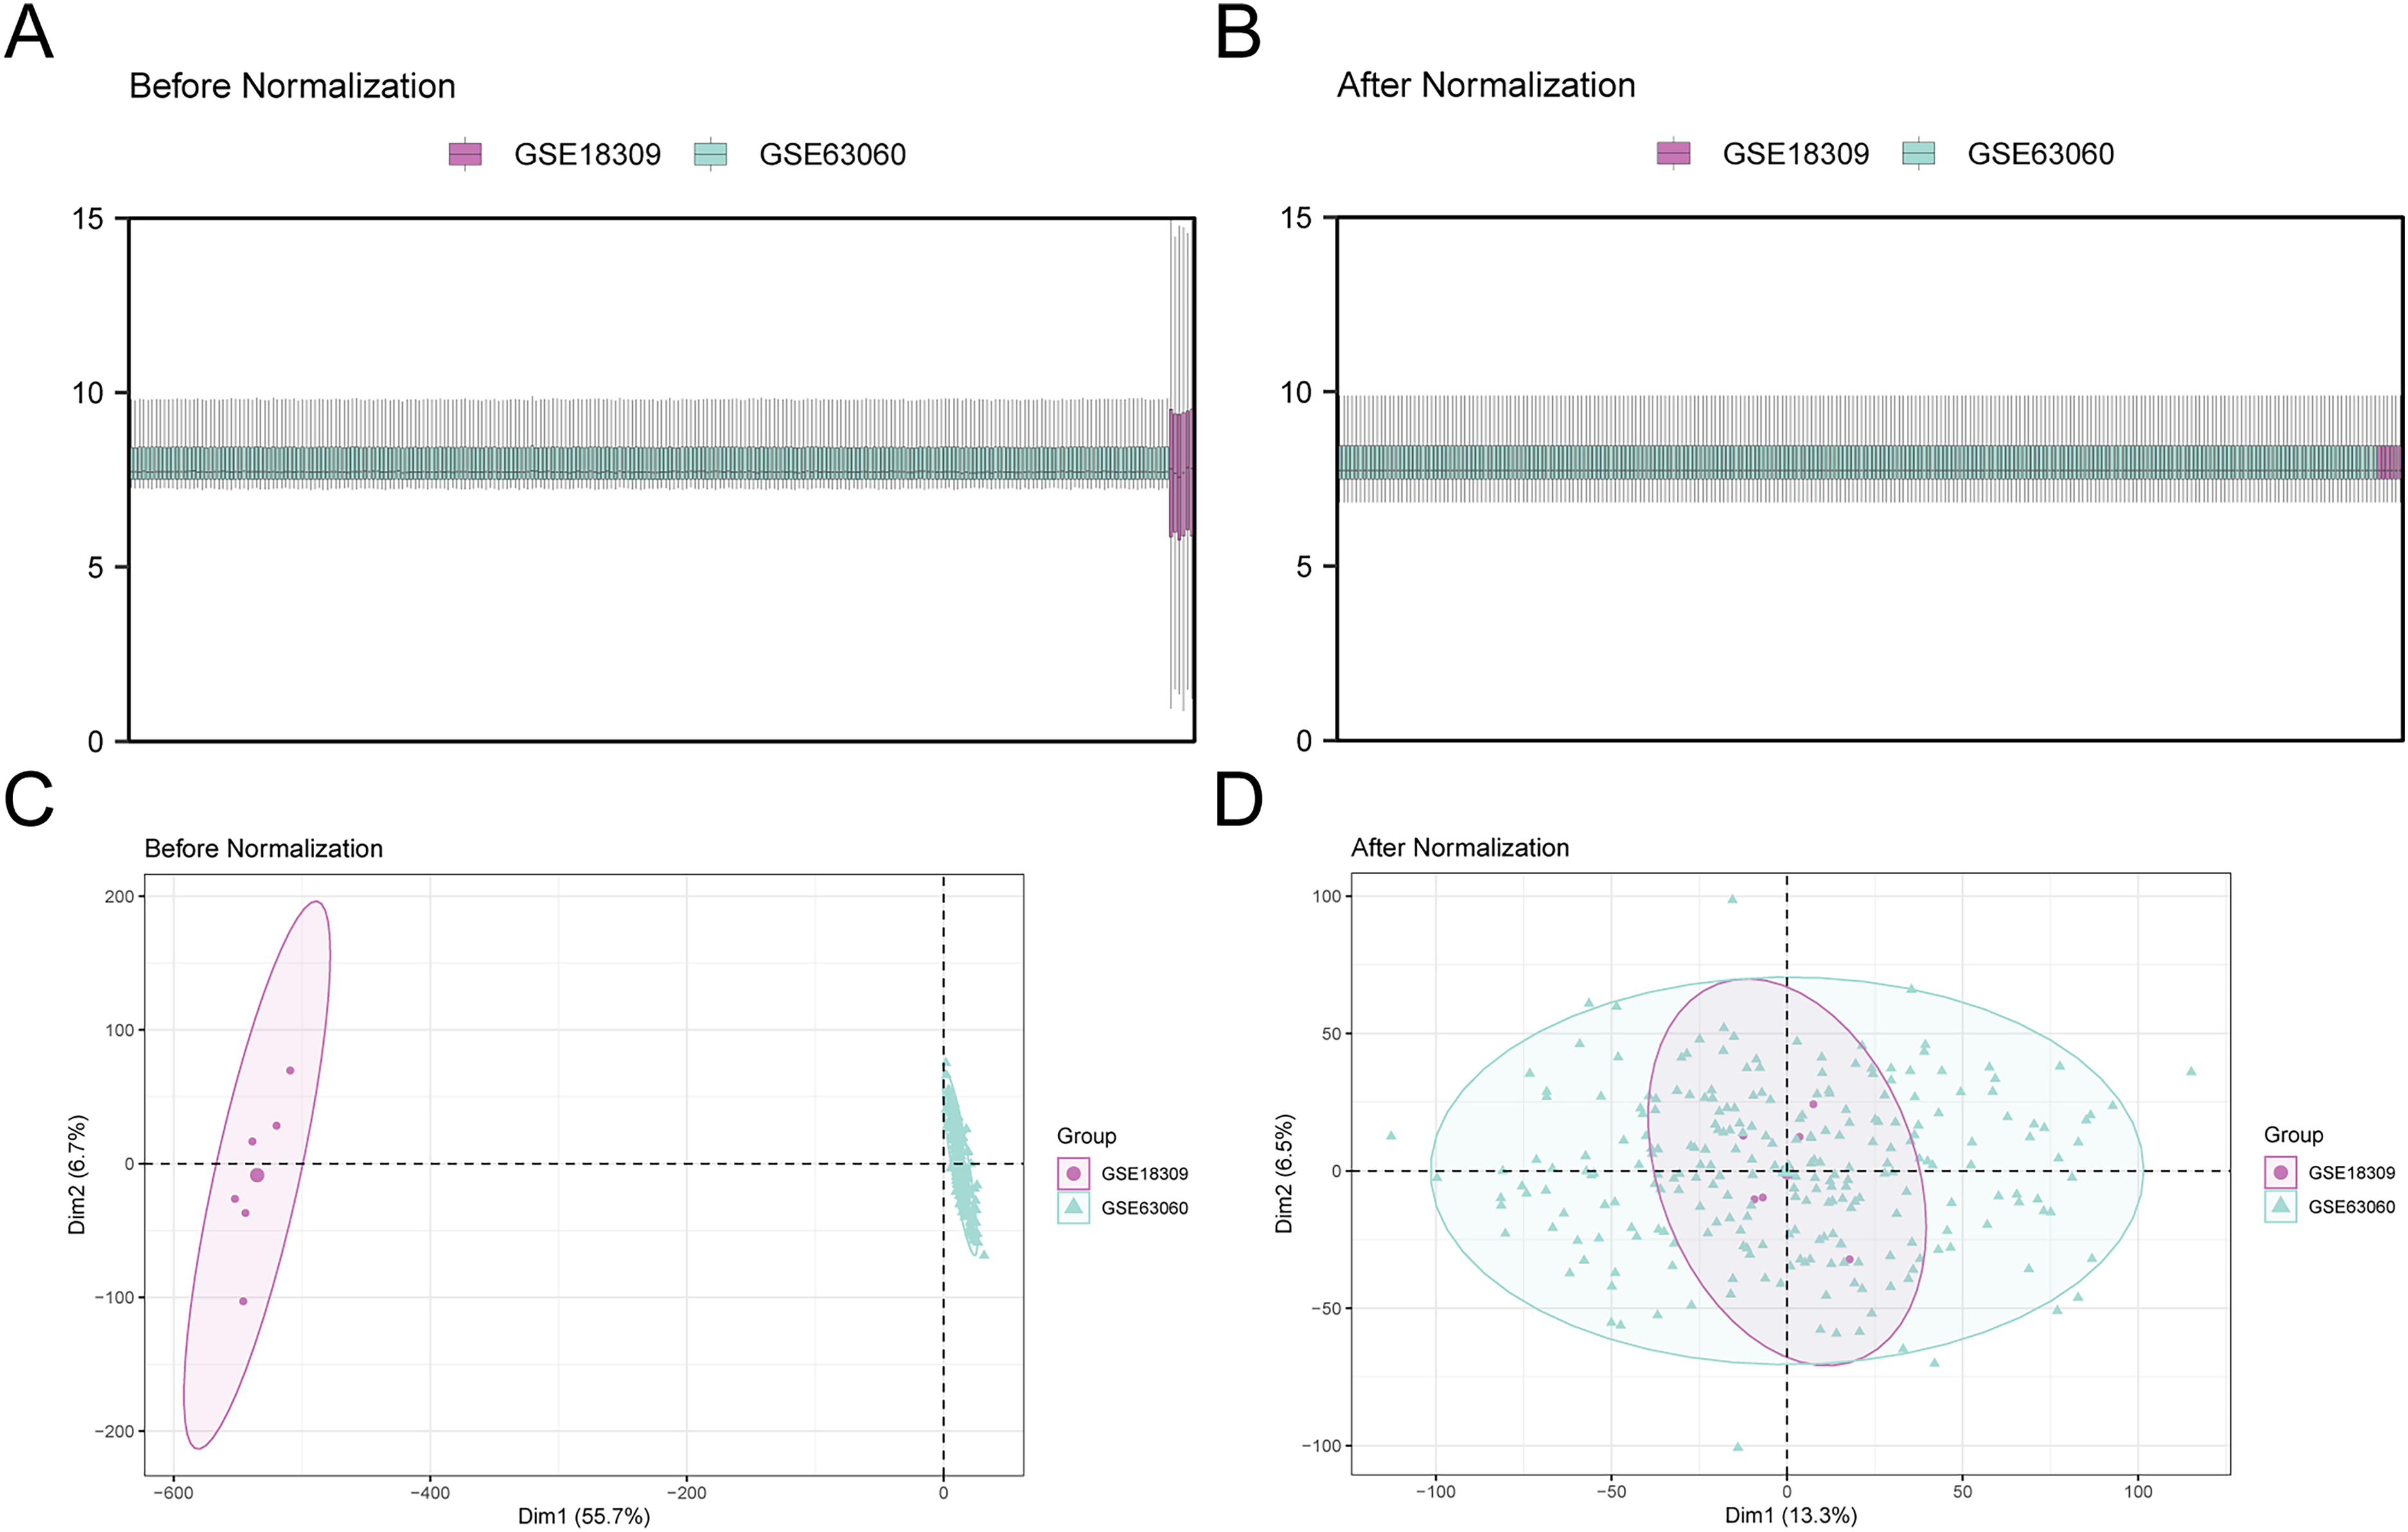
Batch effects removal of GSE18309 and GSE63060. (A) The box plot of the data set distribution before batch processing. (B) The distribution box plot of the integrated GEO datasets after batch processing. (C) The PCA plot of the dataset before batch processing. (D) The PCA plot of the integrated GEO datasets after batch processing. AD: Alzheimer's disease; PCA: principal component analysis. Purple represents GSE18309, and green represents GSE63060.
Analysis of AD-related DEGs associated with mitochondrial energy metabolism
The combined GEO datasets were divided into groups: AD and control. Differential expression analysis was performed using the R package limma to identify gene expression differences between these two groups. A total of 171 differentially expressed genes (DEGs) met the criteria of adjusted p < 0.05 and |logFC| > 0.25, including 156 downregulated genes (logFC < –0.25) and 15 upregulated genes (logFC > 0.25). A volcano plot was generated to visualize the distribution of DEGs (Figure 3A). To identify mitochondrial energy metabolism-related DEGs (MEMRDEGs), we intersected the set of DEGs with mitochondrial energy metabolism-related genes (MEMRGs), resulting in 15 overlapping genes: ACAT1, COX6C, MDH1, NDUFB3, COX7B, NDUFA1, COX17, NDUFA4, NDUFS4, NDUFB2, COX7C, PPA1, SSBP1, MTIF3, and SOD1 (Figure 3B). A heatmap was constructed using the R package pheatmap to visualize the expression patterns of these 15 MEMRDEGs across AD and control samples (Figure 3C). Additionally, chromosomal localization of the MEMRDEGs was analyzed using the R package RCircos, revealing that several genes—including NDUFA4, NDUFB2, and SSBP1—are clustered on chromosome 7 (Figure 3D).
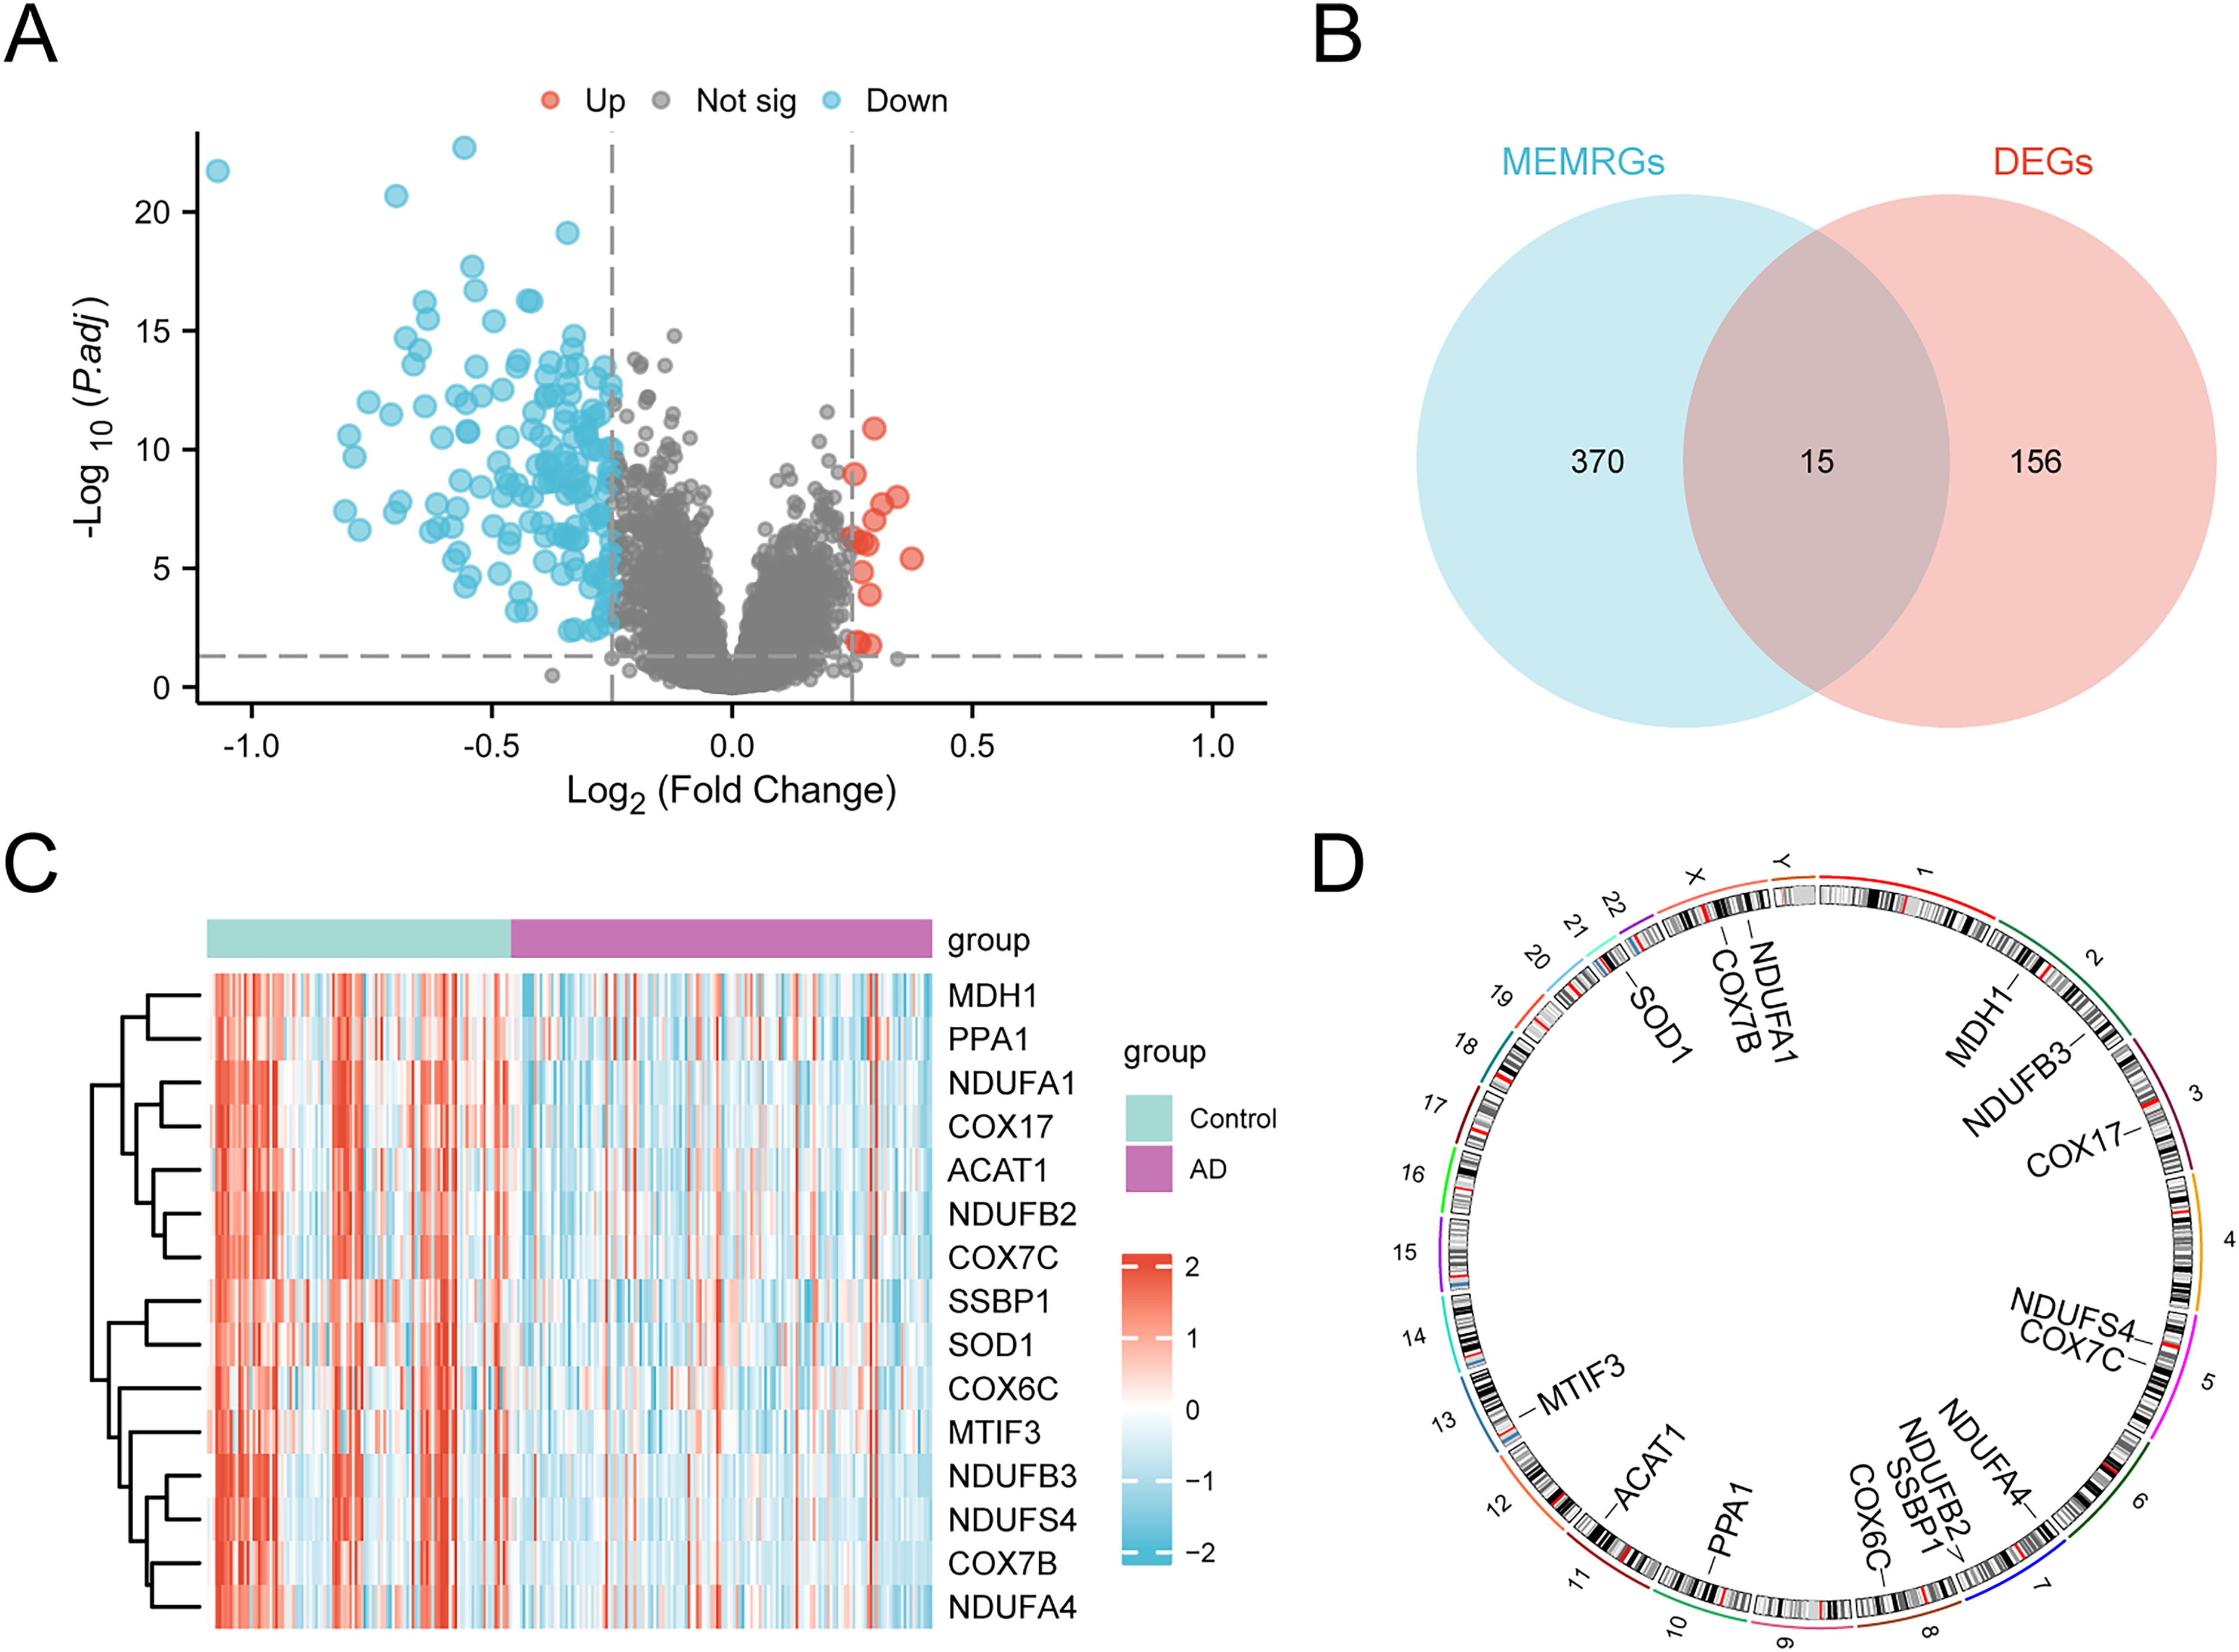
Differential gene expression analysis. (A) volcano plot showing the analysis of differentially expressed genes (DEGs) between the AD group and the control group in the integrated GEO datasets (combined datasets). (B) Venn diagram showing the intersection of differentially expressed genes (DEGs) and mitochondrial energy metabolism-related genes (MEMRGs) in the integrated GEO datasets (Combined Datasets). (C) Heat map showing the expression values of mitochondrial energy metabolism-related differentially expressed genes (MEMRDEGs) in the integrated GEO datasets (Combined Datasets). (D) Chromosomal localization plot of mitochondrial energy metabolism-related differentially expressed genes (MEMRDEGs). AD: Alzheimer's disease; DEGs: differentially expressed genes; MEMRGs: mitochondrial energy metabolisms-related genes; MEMRDEGs: mitochondrial energy metabolism-related differentially expressed genes. Purple represents the AD group, and green represents the control (Control) group.
GO and KEGG enrichment analysis
To comprehensively explore the altered biological processes in AD, GO and KEGG pathway enrichment analyses were performed on all 171 DEGs identified between AD and control groups. The results revealed significant enrichment of these genes in pathways related to mitochondrial function, energy metabolism, inflammatory response, and immune regulation (see Supplemental Table 4). These findings suggest that, beyond mitochondrial energy metabolism-related genes, AD is broadly characterized by dysregulation in metabolic and immune-related pathways. (Complete enrichment analysis outcomes for all DEGs have been provided in the supplementary materials section.)
To further investigate the functional relevance of the 15 MEMRDEGs, GO and KEGG enrichment analysis were conducted to evaluate their association with biological processes (BP), cell components (CC), molecular functions (MF), and biological pathways (Pathway). Representative enrichment results are presented in Table 2. The MEMRDEGs were primarily associated with REDOX activity, transmembrane transport, NAD (P) H dehydrogenase (quinone) activity, and mitochondrial electron transport chain components. Key enriched biological themes included mitochondrial respiration, respiratory chain complexes, mitochondrial membrane protein complexes, and aerobic electron transport processes.
Result of GO and KEGG enrichment analysis for MEMRDEGs.
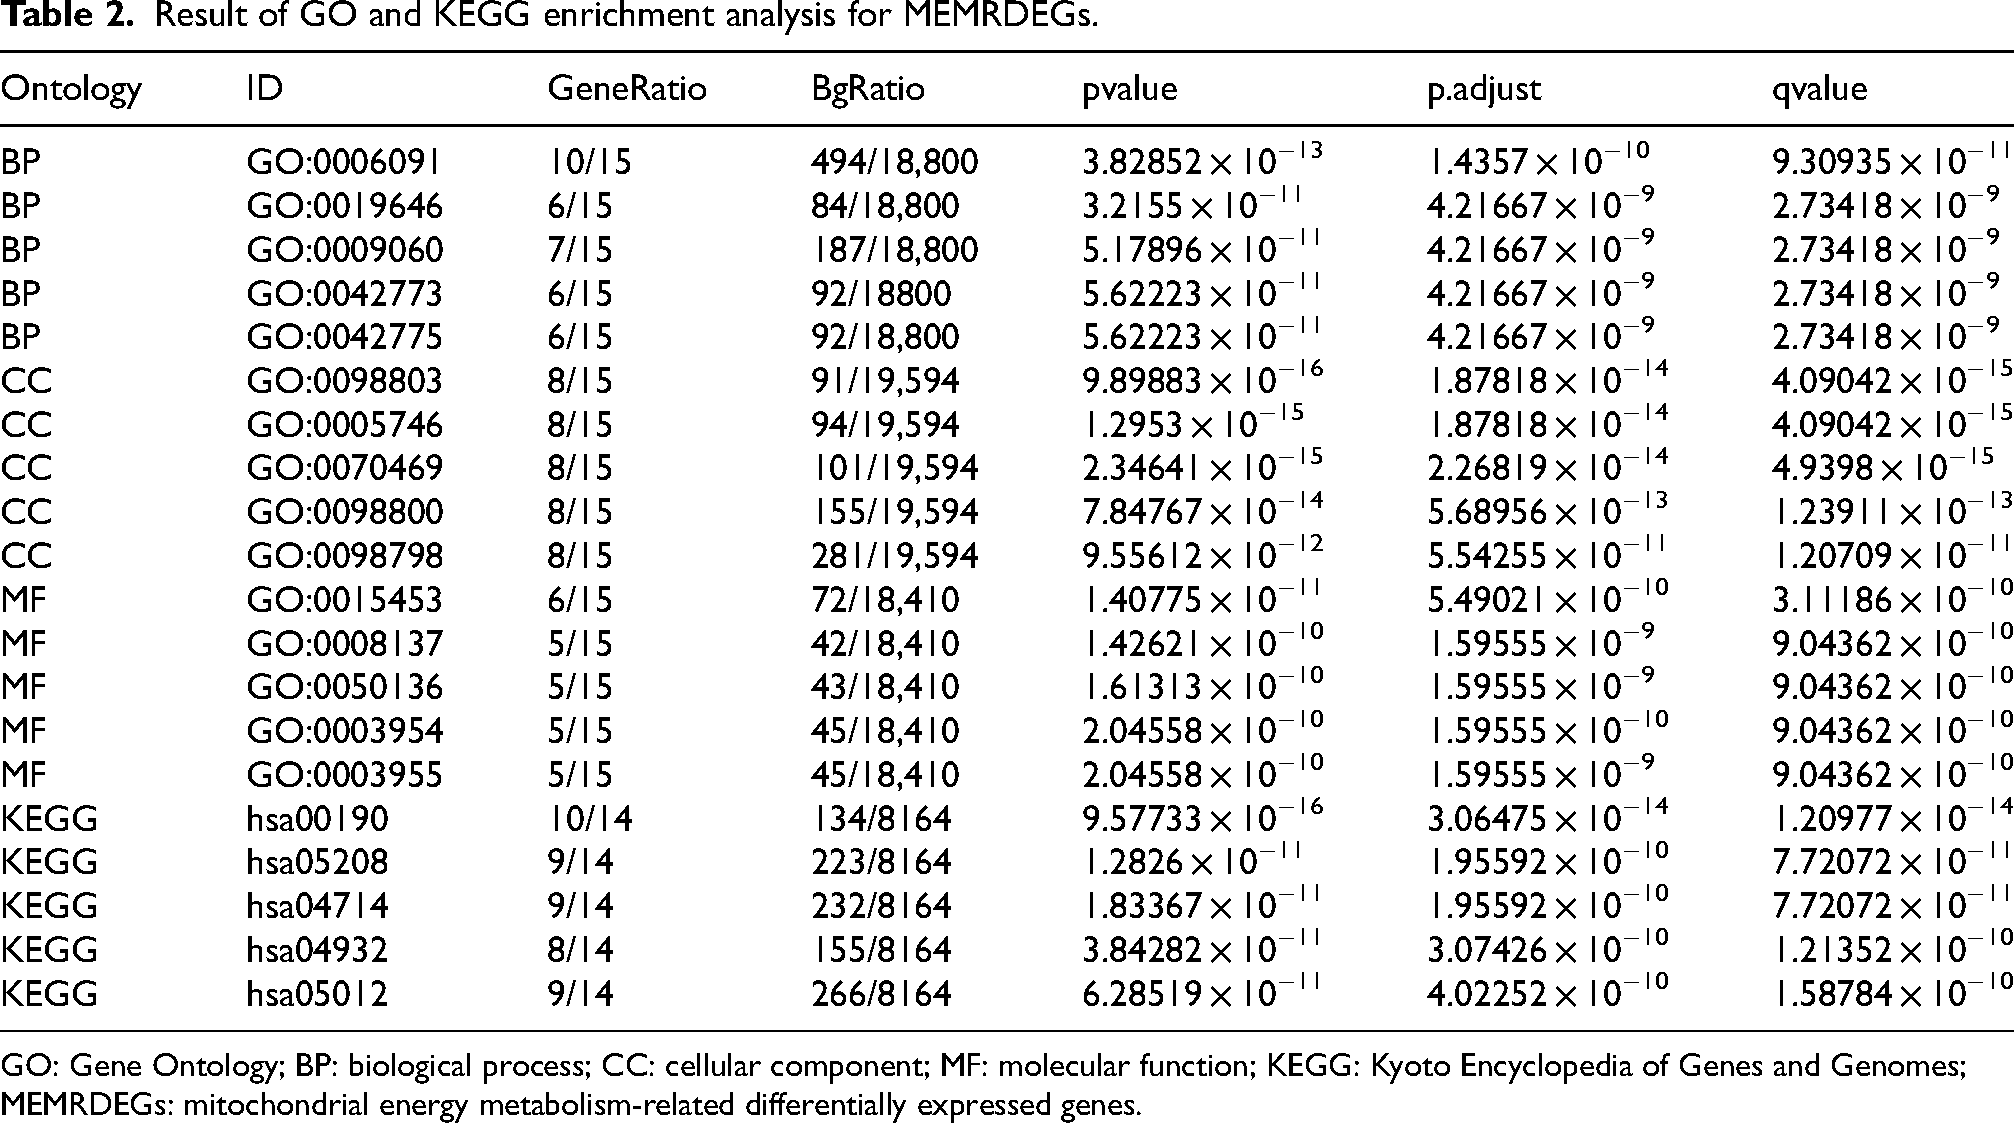
GO: Gene Ontology; BP: biological process; CC: cellular component; MF: molecular function; KEGG: Kyoto Encyclopedia of Genes and Genomes; MEMRDEGs: mitochondrial energy metabolism-related differentially expressed genes.
In terms of pathways, the MEMRDEGs were significantly enriched in oxidative phosphorylation, Parkinson's disease, chemical carcinogenesis (reactive oxygen species), thermogenesis, and non-alcoholic fatty liver disease. The enrichment results were visualized using bar charts (Figure 4A) and bubble plots (Figure 4B). Additionally, a network graph was constructed based on GO and KEGG findings to illustrate the relationships between enriched terms and associated genes in BP, CC, MF, and pathway categories (Figure 4C–F). Nodes representing terms with more associated genes appear larger in the network.

Go and KEGG enrichment analysis for MEMRDEGs. (A) Bar chart showing the KEGG pathway enrichment analysis and GO findings of mitochondrial energy metabolism-related differentially expressed genes (MEMRDEGs). (B) Bubble chart showing the KEGG pathway enrichment analysis and GO findings of MEMRDEGs. (C-F) Network graphs showing the KEGG pathway enrichment analysis and GO findings of MEMRDEGs: BP (C), CC (D), MF (E), and KEGG (F). Green nodes represent items, purple nodes represent molecules, and connecting lines represent the relationship between items and molecules. MEMRDEGs: mitochondrial energy metabolisms-related differentially expressed genes; GO: Gene Ontology; BP: biological process; CC: cellular component; MF: molecular function; KEGG: Kyoto Encyclopedia of Genes and Genomes. The screening criteria for Gene Ontology (GO) enrichment analysis were adj p < 0.05 and FDR value (q value) < 0.25. The p value correction method was Benjamini-Hochberg (BH).
Gene set enrichment analysis
To evaluate the impact of global gene expression changes on AD, we performed GSEA on combined GEO datasets to identify associations with molecular functions, cell components, and biological processes relevant to AD (Figure 5A). Detailed results are provided in Table 3. The analysis revealed significant enrichment of several biologically relevant signaling pathways, including the IL-4 signaling pathway (Figure 5B), JAK-STAT signaling pathway (Figure 5C), MAPK Pathway (Figure 5D) and the TGF- β receptor signaling pathway (Figure 5E).
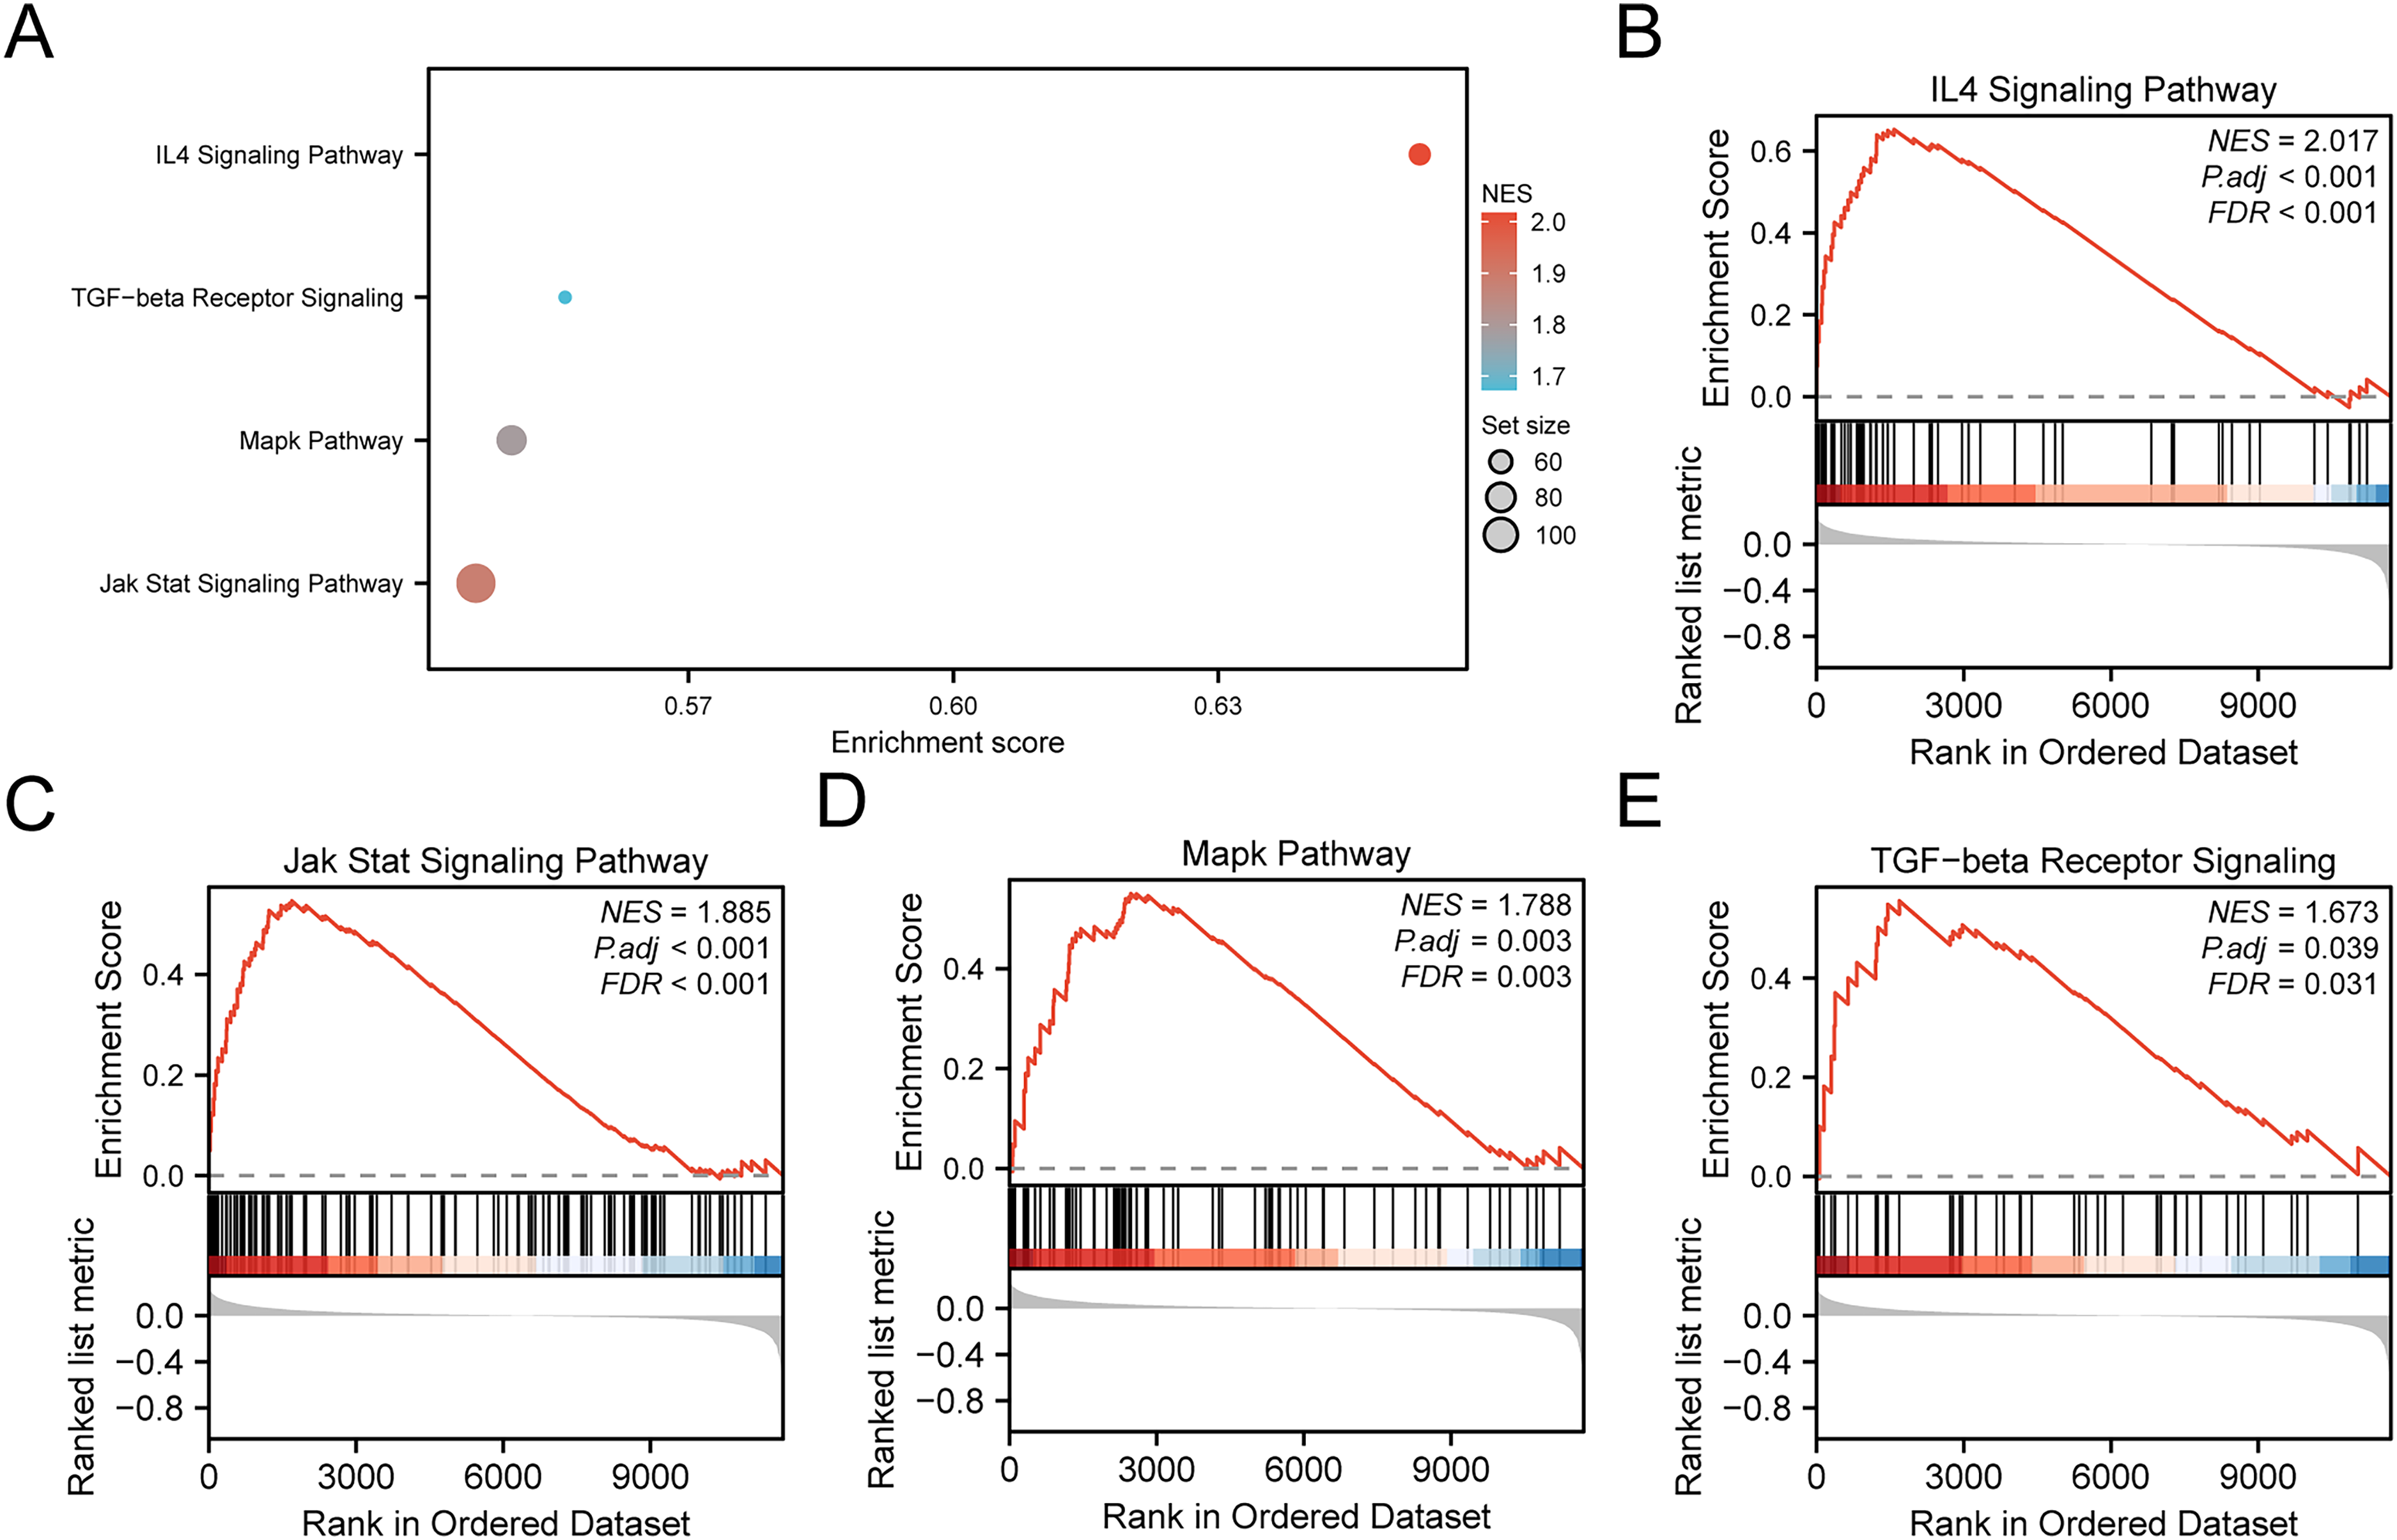
GSEA for combined datasets. (A) Bubble chart showing the four biological functions of the gene set enrichment analysis (GSEA) of the combined GEO datasets. (B-E) Gene set enrichment analysis (GSEA) showed that AD was significantly enriched in the IL4 Signaling Pathway (B), Jak Stat Signaling Pathway (C), Mapk Pathway (D), and TGF−beta Receptor Signaling (E). GSEA, Gene Set Enrichment Analysis; AD, Alzheimer Disease. The screening criteria for gene set enrichment analysis (GSEA) were adj p < 0.05 and FDR value (q value) < 0.25, and the p value correction method was Benjamini-Hochberg (BH).
Results of GSEA for combined datasets.

GSEA: gene set enrichment analysis.
Screening of protein-protein interaction networks and hub genes
PPI analysis of the 15 MEMRDEGs was conducted using the STRING database, and the resulting PPI network was built for 15 MEMRDEGs (Figure 6A). The P The analysis revealed interactions among 12 of the 15 MEMRDEGs: ACAT1, SSBP1, NDUFB3, NDUFB2, COX7B, NDUFS4, COX7C, COX6C, NDUFA4, COX17, NDUFA1 and SOD1. To identify key regulatory genes, we applied five algorithms from the cytoHubba plugin in Cytoscape: Maximal Clique Centrality (MCC), Degree, Maximum Neighborhood Component (MNC), Edge Percolated Component (EPC), and Closeness. For each algorithm, the top 10 MEMRDEGs were visualized in individual PPI networks: MCC (Figure 6B), Degree (Figure 6C), MNC (Figure 6D), EPC (Figure 6E), and Closeness (Figure 6F). Node color gradients from red to yellow indicate rankings from highest to lowest. Finally, the intersection of the top-ranked genes from all five algorithms was determined, and a Venn diagram was generated (Figure 6G). This analysis identified nine overlapping hub genes related to mitochondrial energy metabolism: COX7C, NDUFB2, COX6C, NDUFA1, COX7B, NDUFS4, NDUFB3, NDUFA4, and COX17.
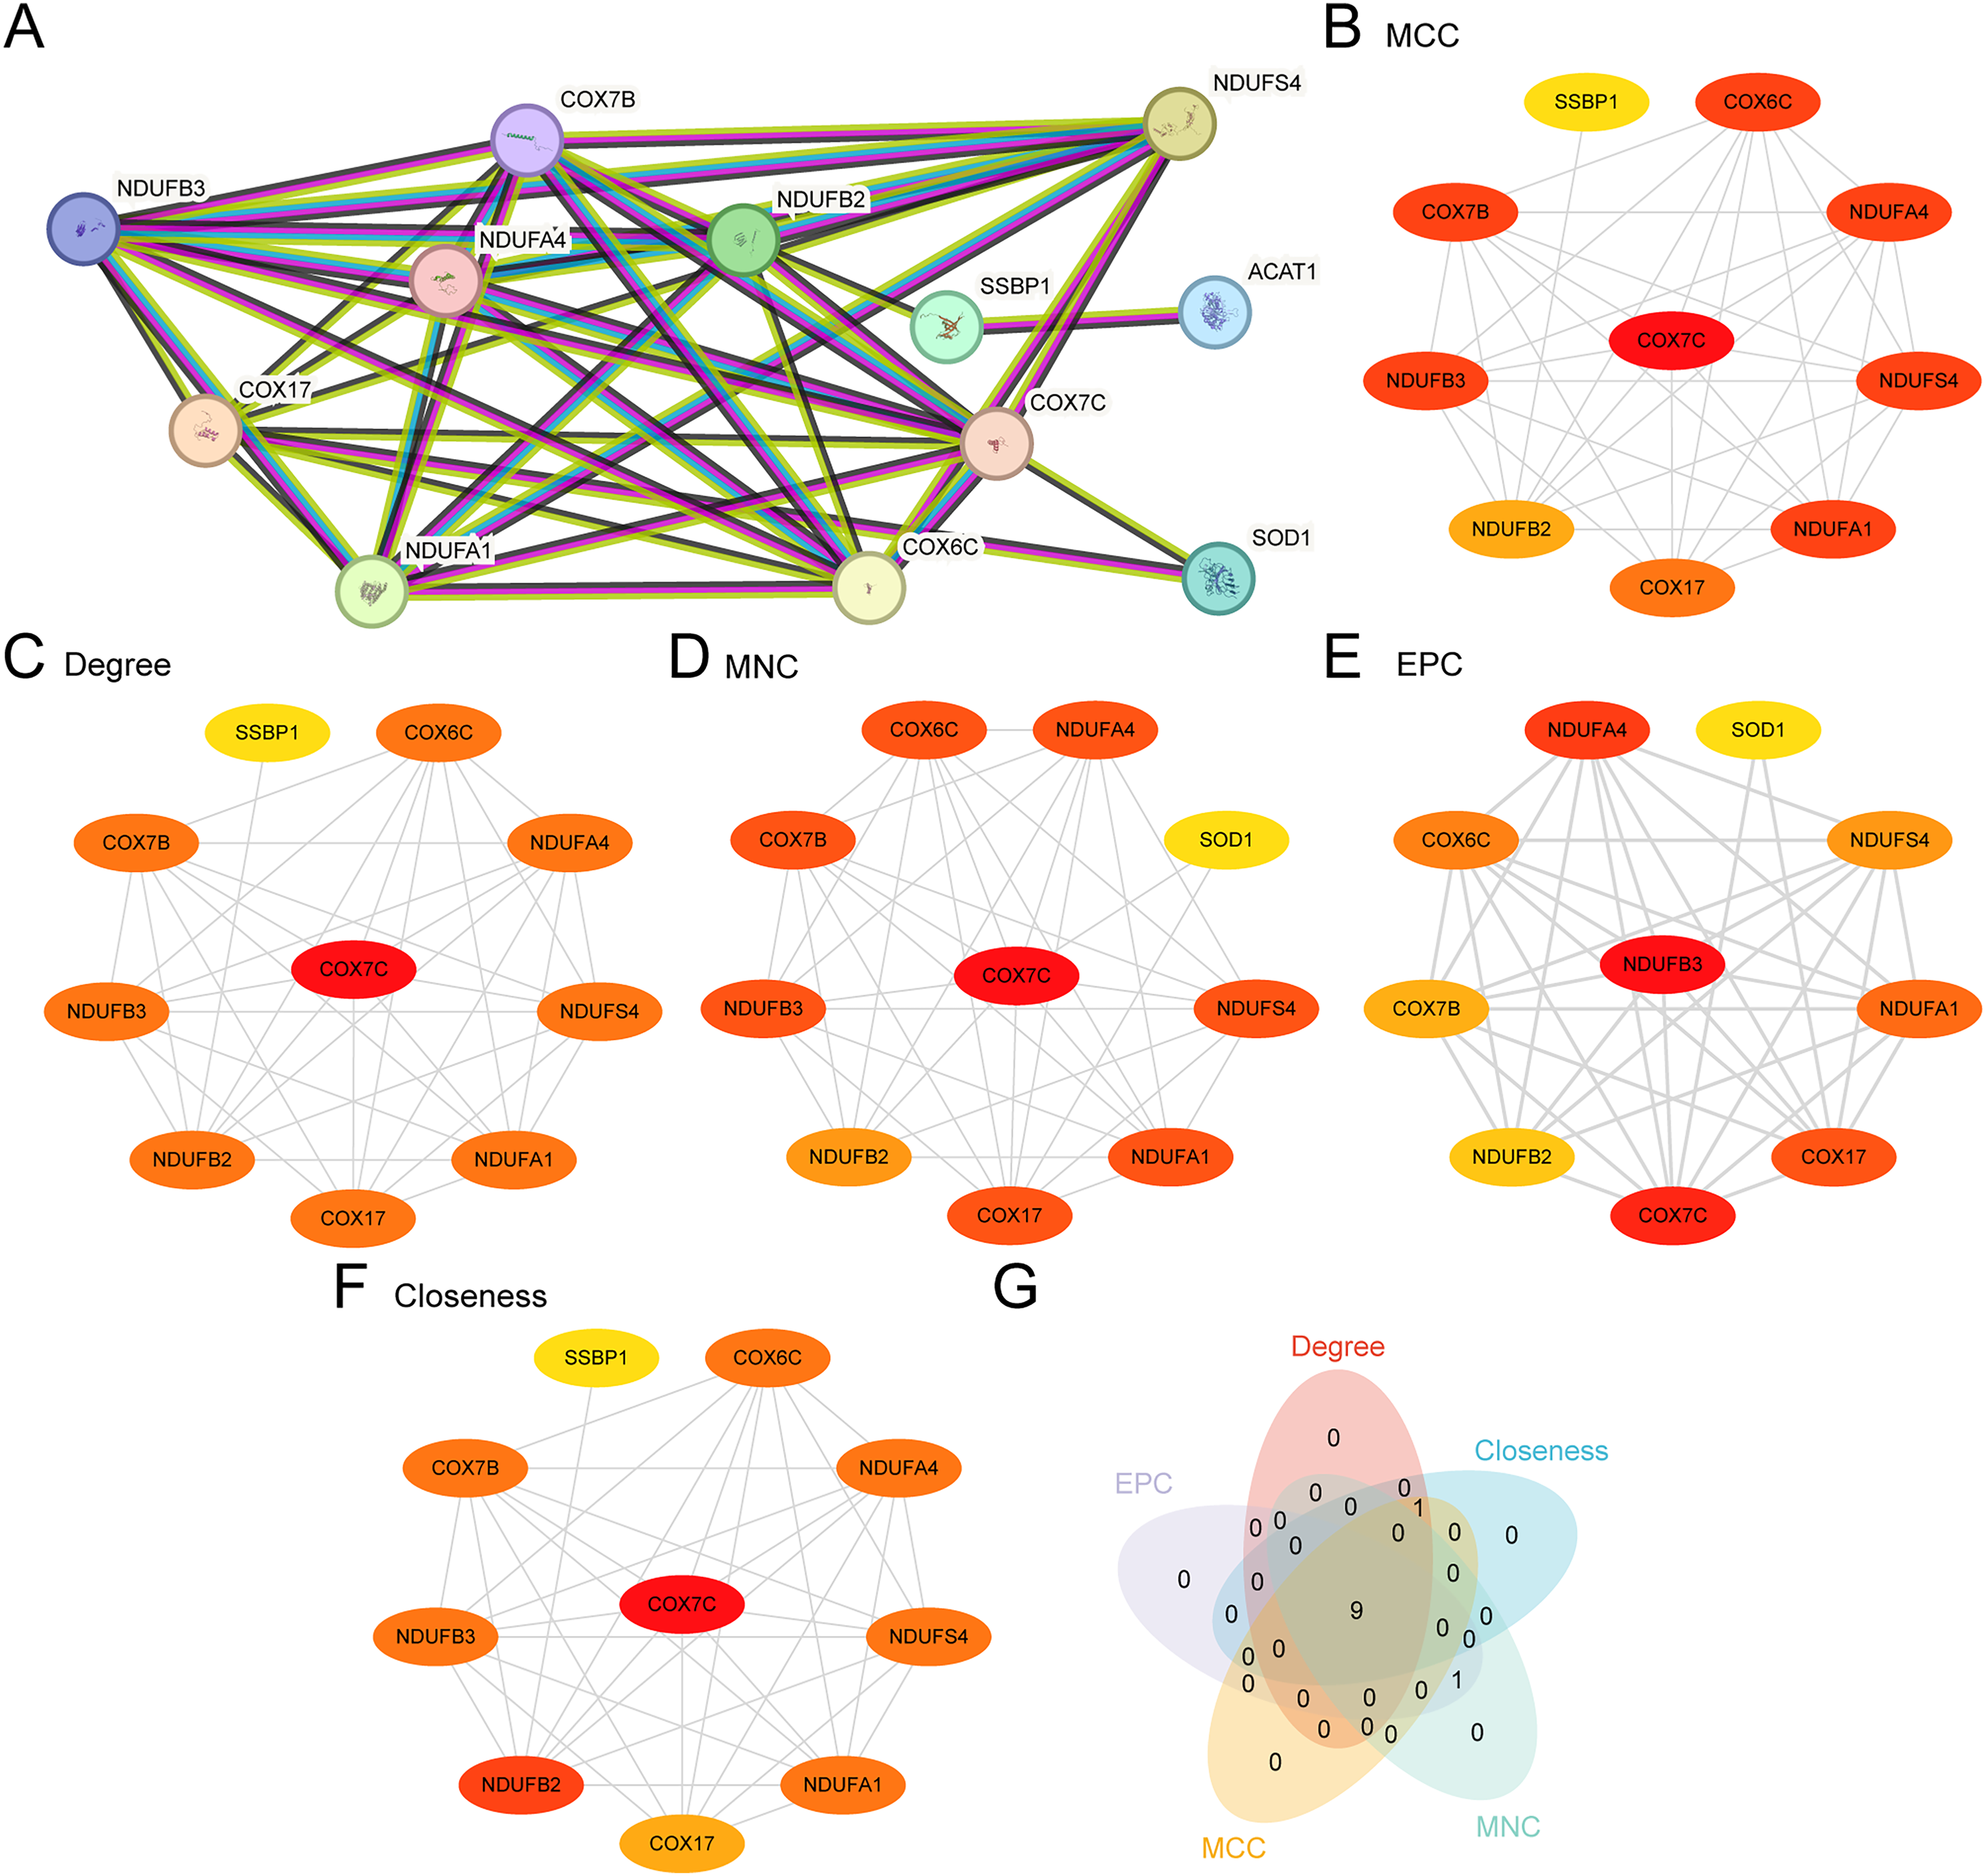
PPI network and hub genes analysis. (A) PPI Network of MEMRDEGs calculated by STRING database. (B-F) PPI Network of the top 10 MEMRDEGs calculated by five algorithms of the cytoHubba plugin, including Closeness (B), Degree (C), EPC (D), MCC (E), and MNC (F). (G) Venn diagram of the top 10 MEMRDEGs of five algorithms of the cytoHubba plugin. AD: Alzheimer's disease; PPI: protein-protein interaction; MEMRDEGs: mitochondrial energy metabolisms-related differentially expressed genes; MCC: maximal clique centrality; MNC: maximum neighborhood component; EPC: edge percolated component.
Construction of regulatory networks
To investigate post-transcriptional and transcriptional regulation of mitochondrial energy metabolism-related hub genes, we constructed both mRNA–miRNA and mRNA–transcription factor (TF) regulatory networks. Experimentally validated miRNA–mRNA interactions were retrieved from the TarBase v9.0 database, and the resulting mRNA–miRNA network was visualized using Cytoscape (Figure 7A). This network comprises 9 mitochondrial energy metabolism-related hub genes and 33 associated miRNAs; detailed information is provided in Supplemental Table 2.

Regulatory network of hub genes. (A) mRNA-miRNA regulatory network of mitochondrial energy metabolism-related hub genes. (B) mRNA-TF regulatory network of mitochondrial energy metabolism-related hub genes. TF, Transcription Factor. Red circles represent mRNA, blue circles miRNA, and yellow circles transcription factors.
For transcriptional regulation analysis, TFs targeting the hub genes were identified by intersecting data from the ChIPBase v2.0 and hTFtarget databases. The overlapping TF–mRNA pairs were used to construct the mRNA–TF regulatory network, which was also visualized with Cytoscape (Figure 7B). This network includes 7 hub genes and 51 TFs, with specific details listed in Supplemental Table 3.
Expression difference of hub genes and ROC analysis
To validate the differential expression of the nine mitochondrial energy metabolism-related hub genes COX7C, NDUFB2, COX6C, NDUFA1, COX7B, NDUFS4, NDUFB3, NDUFA4, and COX17 between AD groups and control groups in the integrated GEO datasets (Combined Datasets), we performed the Wilcoxon rank sum test. The results were visualized using grouped comparison plots (Figure 8A). The expression differences of all hub genes were statistically significant (p value < 0.001) in the AD group and the control group, respectively: ACAT1, SSBP1, NDUFB3, NDUFB2, COX7B, NDUFS4, COX7C, COX6C, NDUFA4, COX17, NDUFA1, and SOD1.
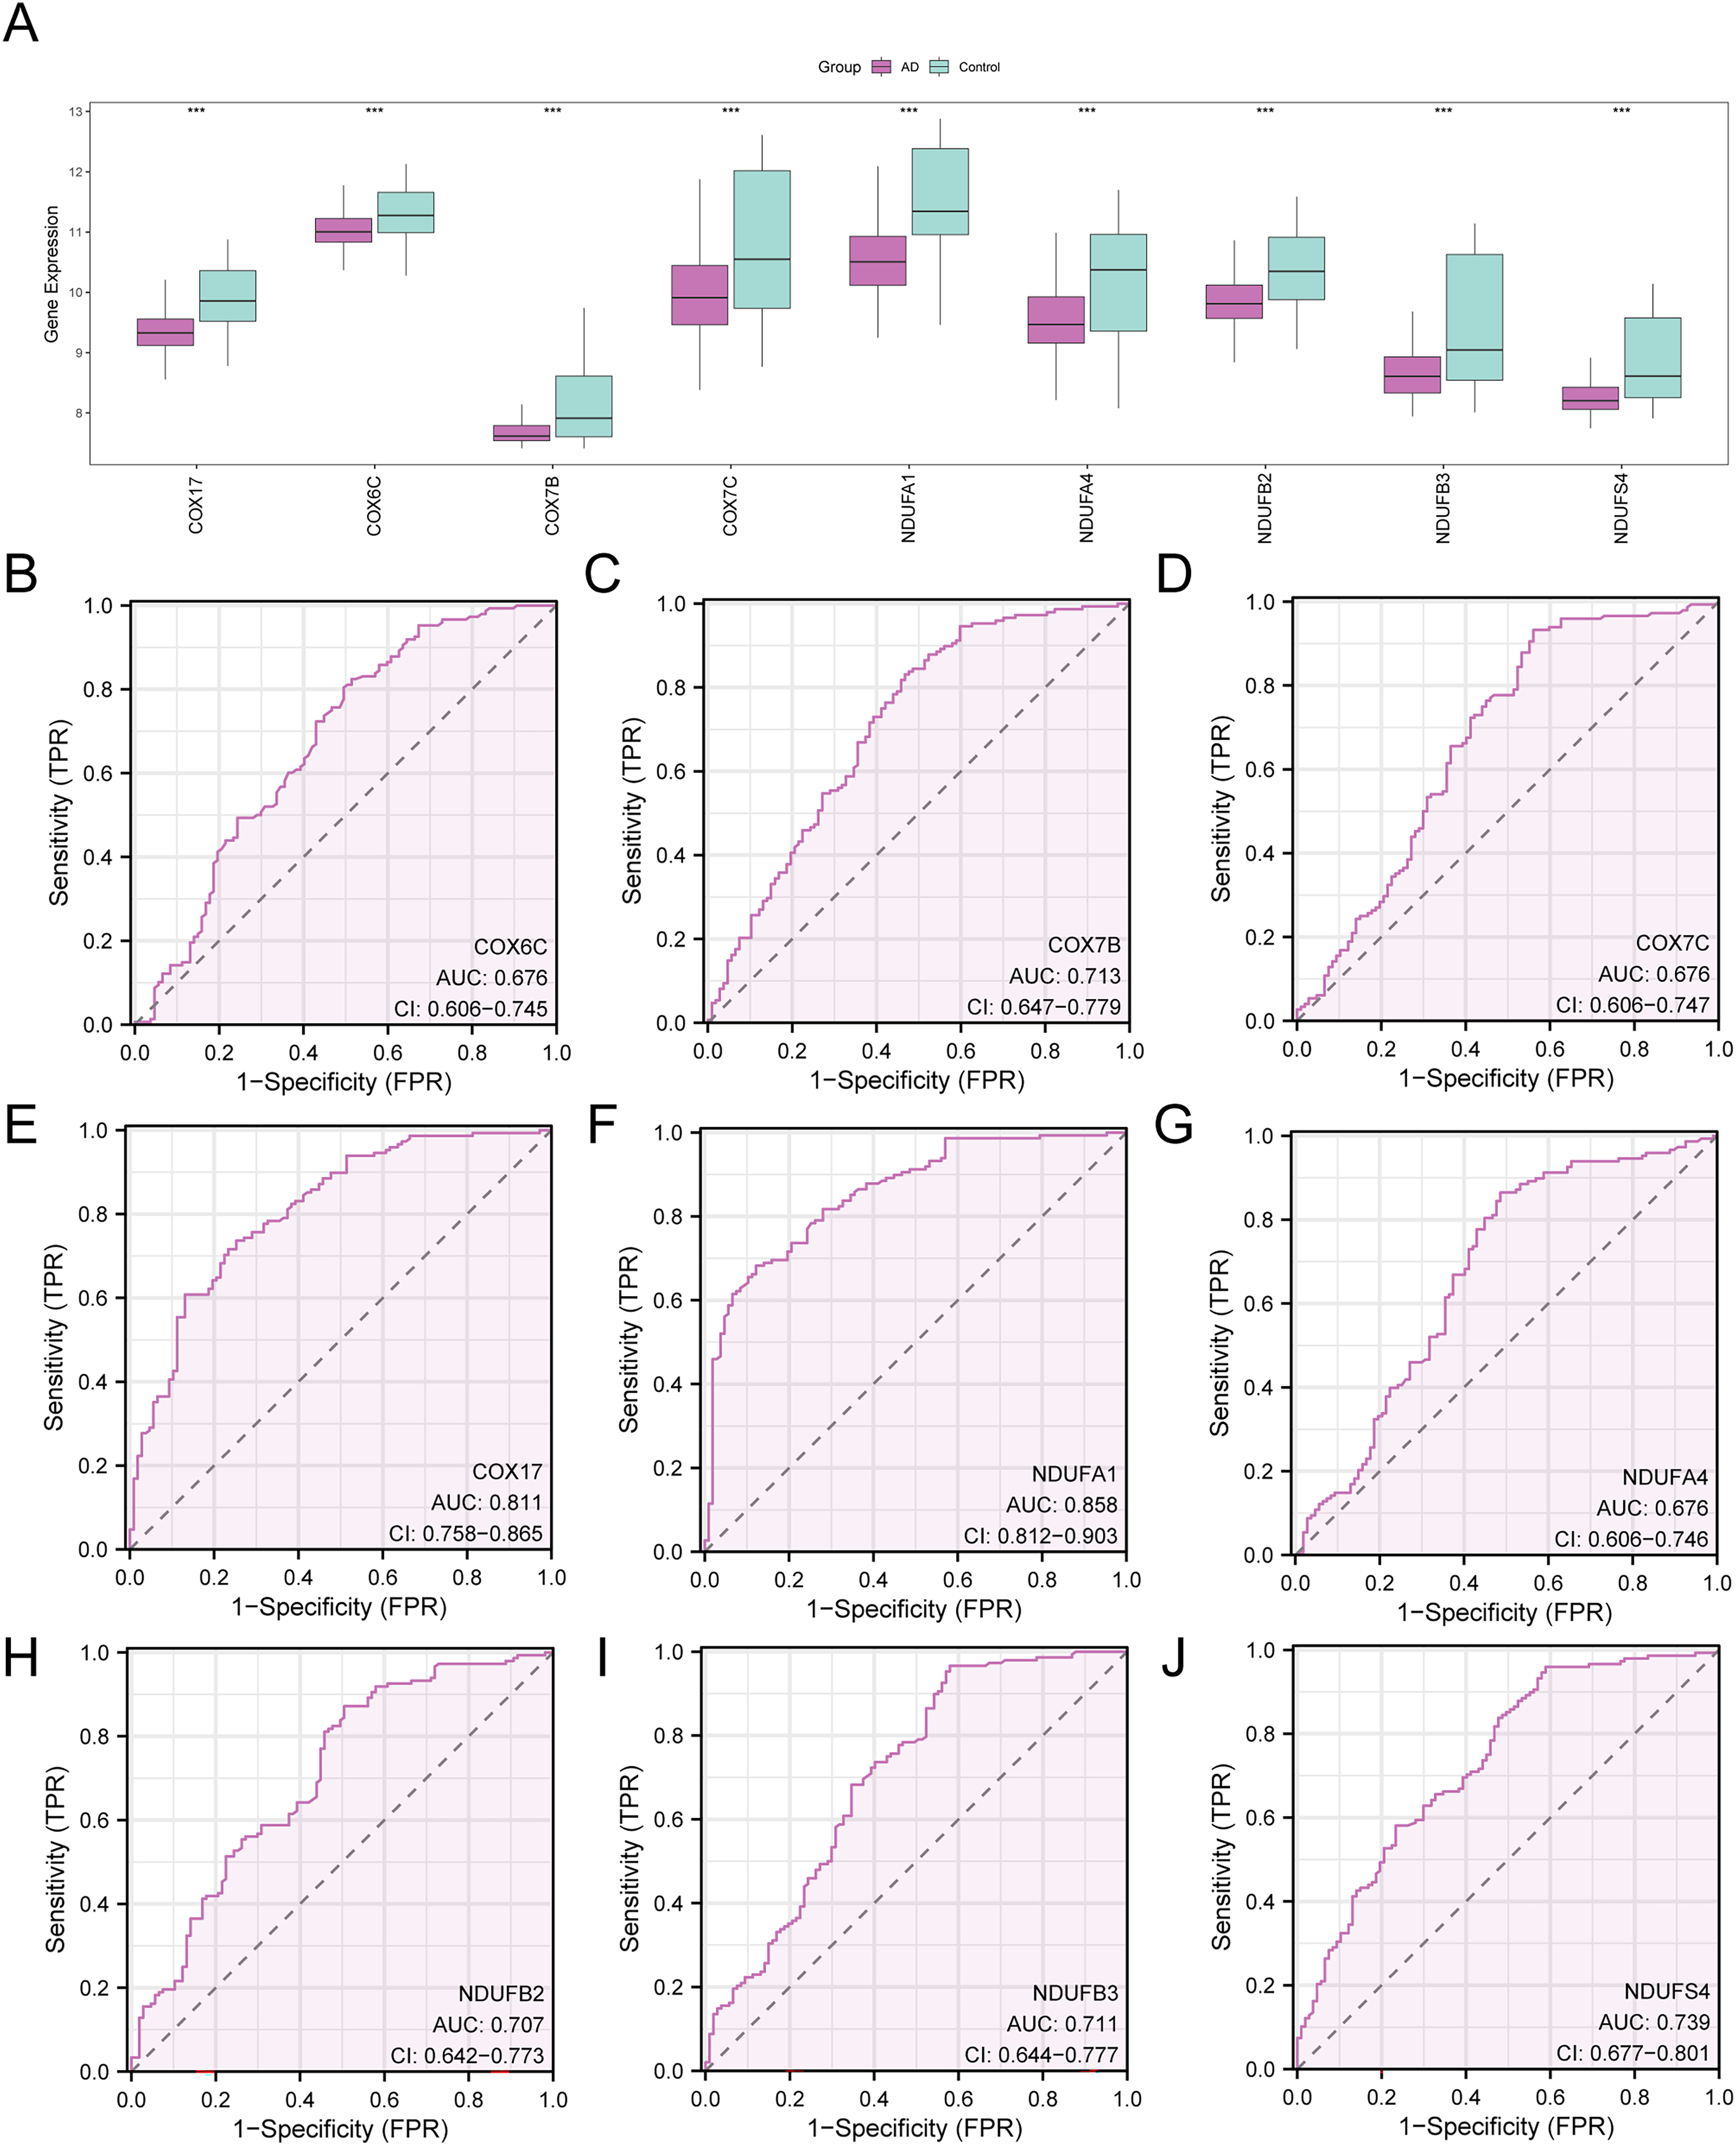
Expression difference and ROC curve analysis. (A) Group comparison graph of mitochondrial energy metabolism-related hub genes (hub genes) in the integrated GEO datasets (Combined Datasets). (B-J) ROC curves of the mitochondrial energy metabolism-related hub genes (hub genes) COX6C (B), COX7B (C), COX7C (D), COX17 (E), NDUFA1 (F), NDUFA4 (G), NDUFB2 (H), NDUFB3 (I), and NDUFS4 (J) with significantly different expression values in the grouped comparison graph. AD: Alzheimer's disease; ROC: receiver operating characteristic curve. ***p < 0.001, statistically significant. The higher the diagnostic impact, the closer the AUC is to 1. Its accuracy is reduced when the AUC falls between 0.5 and 0.7. AUC has a specific level of accuracy when it falls between 0.7 and 0.9. Purple represents the AD group and green represents the control (Control) group.
To evaluate the diagnostic potential of the nine hub genes with significant expression differences, we constructed receiver operating characteristic (ROC) curves (Figure 8B–I). The analysis revealed that the expressions of COX7B (AUC = 0.713, Figure 8C), COX17 (AUC = 0.811, Figure 8E), NDUFA1 (AUC = 0.858, Figure 8F), NDUFB2 (AUC = 0.707, Figure 8H), NDUFB3 (AUC = 0.711, Figure 8I), and NDUFS4 (AUC = 0.739, Figure 8J) had certain accuracy (0.7 < AUC < 0.9) in diagnosing AD; the expressions of COX6C (AUC = 0.676, Figure 8B), COX7C (AUC = 0.676, Figure 8D), and NDUFA4 (AUC = 0.676, Figure 8G) showed lower diagnostic accuracy (0.5 < AUC < 0.7) in diagnosing AD.
Immuno-infiltration analysis of AD datasets
To assess immune cell infiltration in AD, we applied the ssGSEA algorithm to the combined GEO datasets, quantifying the relative abundance of 28 immune cell types. The analysis revealed significant differences in immune cell infiltration between AD and control groups. Specifically, 11 immune cell types exhibited statistically significant differences (p < 0.05), as illustrated in (Figure 9A). Among these, five cell types—Activated CD8T cells, CD56^dim^ natural killer cells, Effector memory CD4T cells, Gamma delta T cells, and Myeloid-derived suppressor cells (MDSCs)—showed highly significant differences (p < 0.001). Additionally, Activated CD4T cells, Immature dendritic cells, and Natural killer T cells demonstrated significant differences (p < 0.01), while Central memory CD4T cells, Regulatory T cells, and T follicular helper cells showed differences at the p < 0.05 level. Subsequently correlation analysis among these 11 immune cell types revealed both positive and negative associations, as depicted in (Figure 9B). Notably, a moderate positive correlation (0.5 < r < 0.8) was observed between Activated CD8T cells and Activated CD4T cells. Weaker positive correlations (0.3 < r < 0.5) were identified between Effector memory CD4T cells and Activated CD8T cells, Gamma delta T cells and Activated CD8T cells, as well as Natural killer T cells and CD56^dim^ natural killer cells. Conversely, a weak negative correlation (−0.5 < r < −0.3) was observed between MDSCs and Activated CD8T cells.
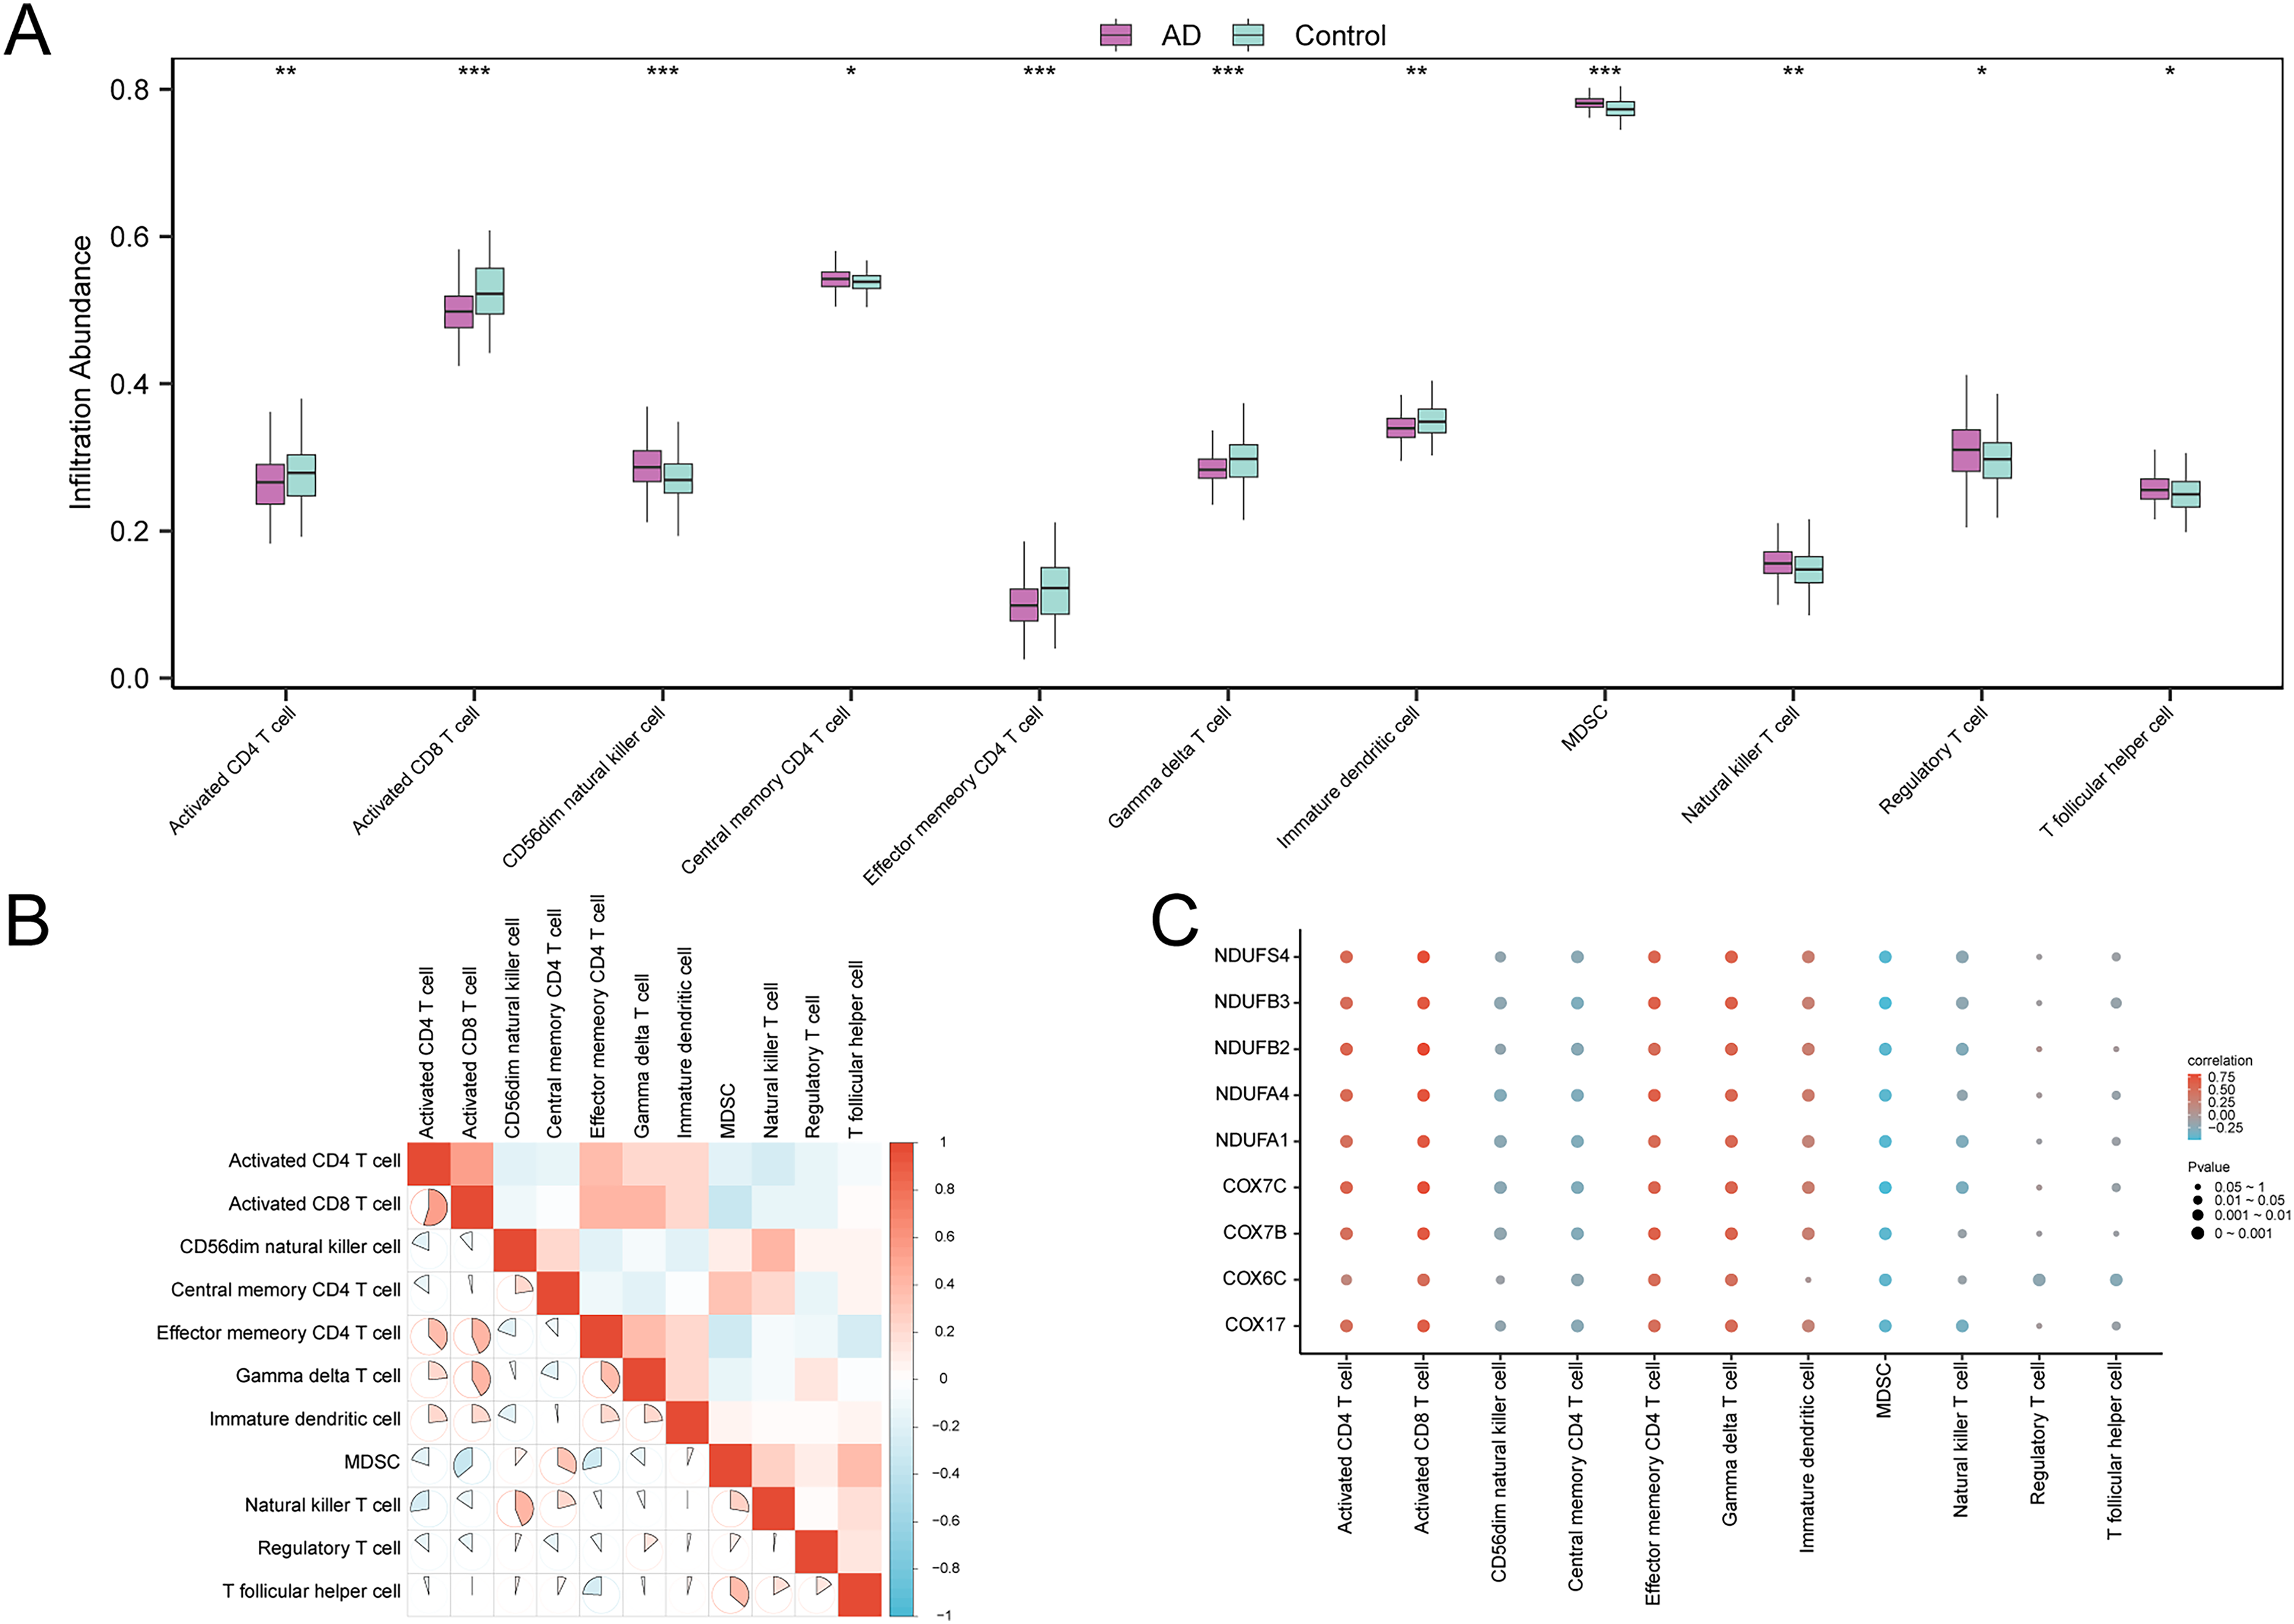
Immune infiltration analysis of combined datasets using the ssGSEA algorithm. (A) Graph comparing the grouped differences in immune cell infiltration abundances between Alzheimer disease (AD) group and control (Control) group. (B) Correlation heat map of the grouped differences in immune cell infiltration abundances with significantly different infiltration abundances among the combined GEO datasets. (C) Correlation heat map of mitochondrial energy metabolism related hub genes (hub genes) with the infiltration abundances of 7 kinds of immune cells in the integrated GEO datasets (Combined Datasets). AD: Alzheimer's disease; ssGSEA: single-sample Gene-Set Enrichment Analysis. *p < 0.05, statistically significant; **p < 0.01, highly statistically significant; ***p < 0.001, extremely statistically significant. The absolute value of the correlation coefficient (r value) is considered weak or not correlated if it is less than 0.3, weak correlated if it is between 0.3 and 0.5, and moderate correlated if it is between 0.5 and 0.8. Purple represents the AD group and green represents the control (Control) group.
Furthermore, the correlation between 9 mitochondrial energy metabolism-related hub genes and the pooled GEO datasets infiltration abundances of 11 different types of immune cells (Combined Datasets) was displayed by the correlation heat map (Figure 9C). The result of the correlation heat map shows that immune cells Activated CD8T cell, Effector memory CD4T cell, and Gamma delta T cell show significant positive correlation with hub genes, and immune cells MDSC show significant negative correlation with hub genes.
Discussion
AD devastates patients through progressive cognitive decline, functional impairment, and personality alterations. 31 Despite advances in understanding its genetic underpinnings, pathological protein dynamics ,32,33 early diagnostic approaches 34 and non-pharmacological interventions, 35 curative therapies remain elusive approaches. Mitochondria the cellular powerhouses-maintain functional stability by producing ATP via oxidative phosphorylation. This process is tightly regulated by genes encoded in both nuclear and mitochondrial genomes. These genes govern electron transport, ATP synthase function, mitochondrial biogenesis, and quality control dynamics.36–39 Disruption of these processes compromises neuronal bioenergetics and homeostasis, making mitochondria central to AD pathogenesis.
In this study, we identified nine differentially expressed core genes related to mitochondrial energy metabolism (COX7C, NDUFB2, COX6C, NDUFA1, COX7B, NDUFS4, NDUFB3, NDUFA4, and COX17) These genes are primarily involved in mitochondrial respiration and oxidative phosphorylation. Enrichment analyses revealed that they contribute to ATP synthesis and redox processes, suggesting that their dysregulation may impair neuronal energy supply and promote oxidative stress, thereby contributing to disease progression.
Each gene plays a distinct role in mitochondrial function. For example, COX7C, COX6C, COX7B, and COX17 are subunits or assembly factors of cytochrome c oxidase, the final complex in the electron transport chain. Alterations in these genes may impair electron transfer and ATP generation.40–43 NDUFB2, NDUFB3, NDUFA1, NDUFS4, and NDUFA4 are components of complex I. Mutations or dysregulation in these genes reduce the efficiency of NADH oxidation, disrupt proton gradient formation, and contribute to increased reactive oxygen species production.44–48 Collectively, dysfunction in these hub genes compromises mitochondrial ATP production and elevates oxidative damage—both of which are hallmarks of AD neurodegeneration.49,50
Experimental studies support this model. For instance, Zhang et al. 51 showed that impaired mitochondrial function in an AD mouse model reduced ATP production and increased neuronal death in memory-associated brain regions. Similarly, in vitro studies have demonstrated that inhibition of mitochondrial metabolism impairs synaptic function and induces neuronal apoptosis. 52 In addition to mitochondrial dysfunction, immune dysregulation is increasingly recognized in AD. Activated CD8T, effector memory CD4+ T cells, and γδ T cells infiltrate AD brains and may contribute to neuroinflammation and neuronal injury.53–55 MDSCs, which typically suppress inflammation, appear dysregulated in AD and may fail to counterbalance chronic immune activation. 56 In our study, expression of the mitochondrial hub genes was positively correlated with activated CD8+ T cells, effector memory CD4+ T cells, and γδ T cells, and negatively correlated with MDSCs, highlighting the potential interplay between mitochondrial dysfunction and immune alterations in AD.
The dysregulation of mitochondrial energy metabolism-related genes in leukocytes may indeed reflect functional impairments in these cells. For example, mitochondrial dysfunction in leukocytes has been linked to reduced chemotaxis, phagocytosis, and oxidative burst capacity, which are critical for immune surveillance and response.57,58 In AD, impaired leukocyte function could contribute to systemic inflammation and reduced clearance of amyloid-β, exacerbating disease progression.59–61 However, further functional validations (e.g., metabolic assays, phagocytosis tests) are needed to directly correlate transcriptomic changes with leukocyte functional deficits in AD.
Our integrative bioinformatics approach offers several key contributions: 1) Peripheral blood biomarkers: a) The diagnostic potential of hub genes (NDUFA1 AUC = 0.858, COX17 AUC = 0.811) should be validated through: Measurement of protein levels in CSF/serum from preclinical AD cohorts. b) Longitudinal tracking of gene expression in MCI-to-AD converters. c) Integration with established biomarkers (Aβ42/p-tau) to enhance predictive accuracy. 2) Mito-immune interactions: The correlation between hub genes (NDUFA1, NDUFS4) and immune cells (CD8+ T, MDSCs) suggests testable mechanisms: (a) In vitro models assessing mitochondrial function in immune cells from AD patients. (b) Animal studies examining how NDUFA1 knockdown alters T-cell infiltration. (c) Therapeutic targeting: Hub genes represent novel targets for mitochondrial-boosting compounds in combination with immunomodulators.
While leveraging public data, this is the first study to: (1) Identify a mitochondrial gene network (COX17-NDUFA1-NDUFS4) in peripheral blood that mirrors AD brain bioenergetic failure. (2) Demonstrate significant correlations between mitochondrial gene expression and 11 immune cell subtypes. (3) Propose COX17 as a novel blood-based biomarker (AUC = 0.811) linking copper dyshomeostasis to AD pathology. Publicly available blood transcriptome datasets remain limited in size and heterogeneity. However, our rigorous batch correction and multi-algorithm validation provide: (1) Prioritized targets for immediate bench validation (e.g., COX17 protein quantification in AD neurons). (2) Testable hypotheses for mitochondrial-immune crosstalk (e.g., does NDUFA1 knockdown alter T-cell cytokine profiles?). (3) Clinical translation pathways through existing AD cohorts with banked blood samples.
Limitations of the study
This study relies on microarray data from two platforms (GPL570 and GPL6947), which differ in probe design, coverage, and sensitivity. While both platforms provide genome-wide expression profiles, GPL570 (Affymetrix U133 Plus 2.0) contains more probes per gene and broader coverage compared to GPL6947 (Illumina HumanHT-12 V3.0). These differences may introduce platform-specific biases, although we mitigated this through rigorous batch correction and normalization.
Microarray technology is limited by its dependence on predefined probes, which may miss novel transcripts or isoforms detectable by RNA sequencing (RNA-seq). RNA-seq offers higher dynamic range, better detection of low-abundance transcripts, and the ability to identify novel splicing events.62–64 However, microarrays remain cost-effective for large cohorts and demonstrate strong reproducibility for well-annotated genes.65,66 Future studies would benefit from RNA-seq validation to capture a more comprehensive transcriptomic landscape.
Additionally, the sample sizes, though publicly available, are modest, and the use of peripheral blood may not fully capture brain-specific changes. Future work should include larger, multi-tissue cohorts to validate these findings.
In summary, this study reinforces mitochondrial energy metabolism dysfunction as a core contributor to AD pathogenesis and identifies key genes with potential diagnostic and therapeutic relevance. By transforming bioinformatics predictions into actionable validation pipelines, we bridge computational findings with experimental neurology. The identified mito-immune axis provides a mechanistic framework for future investigations into AD pathogenesis.
Conclusion
This study systematically analyzed the gene expression profiles in the Alzheimer's disease-related GEO database, identifying 15 differentially expressed genes associated with mitochondrial energy metabolism. Among these, PPI network analysis pinpointed nine key genes: COX7C, NDUFB2, COX6C, NDUFA1, COX7B, NDUFS4, NDUFB3, NDUFA4, and COX17. Functional enrichment and GSEA analyses revealed that these genes primarily participate in crucial biological processes such as mitochondrial respiration and redox reactions. ROC curve analysis indicated that some of these key genes (COX7B, COX17, NDUFA1, NDUFB2, NDUFB3, and NDUFS4) have moderate diagnostic value for AD. Furthermore, immune infiltration analysis identified significant correlations between these genes and specific immune cell populations. Overall, our findings underscore the potential of mitochondrial energy metabolism-related genes as diagnostic biomarkers and promising targets for future immunotherapy in AD.
Footnotes
Acknowledgements
We extend our sincere gratitude to the researchers and participants of the publicly available GEO datasets (GSE18309 and GSE63060) for their invaluable contributions. We also acknowledge the developers of the R packages and bioinformatics tools used in this study, which greatly facilitated our analyses.

Ethical considerations
This study utilized publicly available gene expression data from the GEO database. All original studies from which the data were derived had obtained appropriate ethical approval and participant consent. Therefore, no additional ethical approval was required for the present secondary analysis.
Consent to participate
As this study is based on previously published and de-identified genomic data, informed consent from participants was not required.
Author contribution(s)
Funding
The authors disclosed receipt of the following financial support for the research, authorship, and/or publication of this article: The project received funding from multiple sources, including the Henan Provincial Medical Science and Technology Youth Research Plan jointly supported by the Province and the Ministry (SBGJ202103003), and the Henan Provincial Science and Technology Research Plan (RXK20002016).
Declaration of conflicting interests
The authors declared no potential conflicts of interest with respect to the research, authorship, and/or publication of this article.
Data availability statement
The datasets analyzed during the current study are available in the Gene Expression Omnibus (GEO) repository under accession numbers GSE18309 and GSE63060. The mitochondrial energy metabolism-related gene list is available in the GeneCards database. Other supporting data are included in the Supplemental Material of this article.
Supplemental material
Supplemental material for this article is available online.
References
Supplementary Material
Please find the following supplemental material available below.
For Open Access articles published under a Creative Commons License, all supplemental material carries the same license as the article it is associated with.
For non-Open Access articles published, all supplemental material carries a non-exclusive license, and permission requests for re-use of supplemental material or any part of supplemental material shall be sent directly to the copyright owner as specified in the copyright notice associated with the article.
