



Abstract
This study takes a sociology of quantification approach in exploring the impact of ‘commensurative’ processes in data journalism, in which distinct incidents and entities are rendered similar, aggregated, and shaped into elaborate abstract constructs. This literature emphasizes the political-economic contexts of data production and predicts a heavy reliance on government data, use of national over local data, and a tendency to take data categories for granted, with inconsistent scrutiny. A content analysis of data journalism projects at legacy and non-legacy outlets reveals some support for the expectations from this literature. Findings show an increasing tendency to portray events as abstract metrics and decreasing attention to personal, lived anecdotes. Findings also show a growing tendency to provide indeterminate data sources and limited overt and accessible evidence of data scrutiny. We also see a higher percentage of national-level sourcing than local sourcing across all years, and a decline in government sourcing coupled with a rise in self-gathered, crowdsourced data online. Legacy outlets were more likely than non-legacy outlets to use local data sources, to provide anecdotal reporting in connection with the data presentation, and to use government data sources. Non-legacy outlets were more likely to produce complex abstract metrics.
Scholarship in the growing sociology of quantification literature reminds us that the particulars of our world are not naturally organized for statistical analysis (Desrosieres, 1998; Espeland and Stevens, 2008). Discrete, unique incidents, events, and people – the stuff of journalistic anecdotes – must be ‘commensurated’, or rendered as similar, so that abstract categories may be created and compared (Espeland and Stevens, 2008). Commensurated numerical categories are typically constructed at an institutional level and shaped by political-economic needs. They may be used for their intended functions or borrowed for unintended functions. These categorical constructs provide political-economic players with powerful tools for taming an idiosyncratic social terrain, for rendering it as naturally ordered and rationally comparable. These constructs thereby support broad governance across the terrain – for example, programs for apportioning revenue, for assessing risk for investors, for instituting social reform, and so on (Desrosieres, 1998; Diaz-Bone, 2016). Quantitative categories at the institutional level tend to be abstruse and opaque, they come to be viewed over time as given and unquestionable (Porter, 1995), and they influence public communication substantially. The recent enthusiasm over data journalism, as well as journalists’ dependence on institutions for information (e.g. Bennett, 1988; Cook, 2005; Ryfe, 2017), including data sets (Cushion et al., 2017), are consistent with these dynamics.
Data journalists and data scientists often overlook the full nature of data categories, as noted by data scientist Jake Porway in his recounting of an online debate over data visualizations showing ‘stop and frisk’ incidents in New York. Porway says the debate focused on whether or not the maps’ color shading skewed the proximity of guns to the incidents, but few questioned the categories that the New York Police Department created to structure the data in the first place: ‘There was little or no concern about political and social bias involved in creating these taxonomies before even getting into the visualization’ (Bertini and Stefaner, 2014).
Journalism studies research on data journalism and computational journalism (the use of data, automation, and algorithms in the service of journalism) has addressed key questions about new emerging practices and norms, occupational and discursive boundary work with data science, implications for traditional journalism and journalism practice, and enhanced possibilities for crowdsourced, ‘co-created’ content (Borges-Rey, 2016; Bucher, 2017; Coddington, 2015; Hermida and Young, 2017; Karlsen and Stavelin, 2014; Lewis and Westlund, 2014; Parasie and Dagiral, 2012). But to date, the nature and origins of data categories – that is, the structure of structured journalism, which is at the heart of data and computational journalism – have received little attention. Sociological research on quantification offers a helpful framework for understanding data knowledge construction. This scholarship explores how and why popular abstract constructs – for example, Gross National Product, Human Development Index, and Body Mass Index – emerge, develop, gain authority, and persist. This scholarship also focuses on the political-economic contexts of these dynamics (Desrosieres, 1998; Diaz-Bone, 2016; Espeland and Stevens, 2008; Porter, 1995; Starr, 1987).
These processes are relevant to journalism, not only because of the growing popularity of big data and data visualization but because journalists derive legitimacy and authority from the political-economic institutions that produce most of the data sets. When this dependence is strong, it does little to encourage journalists’ critical thinking. Also, quantitative accounts and data categories, and the scientific practices used to create them, have an aura of authoritative objectivity, and this appeals to beleaguered journalists and news outlets, beset with charges of bias and challenges to their authority.
The ease of computer-enabled searching, crowdsourcing, and data scraping may be shifting some control from institutions to everyday citizens (Bertini and Stefaner, 2014; Borges-Rey, 2016; Parasie and Dagiral, 2012). Such a shift could reduce dependence on institutionally created data sets and those who report them, though it may also bypass knowledge of data production found in the expertise and encoded routines of official agencies. Some journalists have advocated use of citizen-generated data, which is increasingly common outside of traditional journalism, but journalists’ heavy reliance on official data continues. Journalists revere the idea of the democratic public (Anderson, 2013), but the public is more imagined than experienced first-hand (Lowrey, 2009), and citizen-based efforts, whether produced individually or with foundation support, have relatively low institutional standing and low legitimacy.
We consider these issues of data and authority through an exploratory analysis of data journalism projects. More specifically, we examine the origins of data in these projects, the degree to which journalists scrutinize origins and quality of data, the degree to which constructed abstract categories in data projects are proliferating, and whether or not the emphasis on data at the national and international levels – the levels at which ready-made data sets are most often produced – is increasing in comparison to local and anecdotal knowledge. We note that we are not attacking the use of quantification or category construction. In fact, we use these methods in this study of data projects, as they are helpful for revealing the scope and contexts of mechanisms and consequences, and their changes across time.
The eager use of data is not new to journalism (Anderson, 2017). But the recent enthusiasm over ‘big data’ in journalism suggests now is a good time to look critically at the logic that underlies the production of data. Before examining the data projects, we explore literatures on the sociology of quantification and data journalism.
Data, institutions, and changing journalism practices
Coordinating the collection and production of reliable, large-scale statistics requires a lot of work and a lot of resources. Historically, state and commercial institutions have been the main producers (Porter, 1995). Bureaucratic states have enlisted statistics (note the common root) to help them imagine, envision, and administer their vast domains, as ‘seeing something is the first step to controlling it’ (Espeland and Stevens, 2008: 415). The invention of commensurated statistics – that is, distinct recordable events rendered as similar and then calculated/aggregated – allowed political authorities to produce reports of their administrative areas in practicable ways, in contrast to writing and reading pages and pages of qualitative anecdotes. Such reports were easier for higher level administrators to digest. They manufactured order out of idiosyncratic disorder, and they facilitated comparison and therefore decision-making about resource distribution (Espeland and Stevens, 2008; Starr, 1987).
Journalists’ use of quantitative data has ebbed and flowed across changing routines and cultural contexts (Anderson, 2017), but as a form of knowledge, data sets generally fit well with normative ideas about objectivity in Anglo-American journalism. US political thinker and journalist Walter Lippmann, concerned about inadequacies of the ‘pictures’ of the world in citizens’ minds, called on journalists to use data from official experts (Schudson, 2010). Since, routine practices in Anglo-American journalism have been largely consistent with Lippmann’s remedy, for better and for worse. Journalists tend to rely on official sourcing to confer legitimacy on stories (McLeod and Hertog, 1998), to save time, and to ensure a steady stream of information (Cook, 2005; Hickerson et al., 2011).
Journalists have had little recourse but to use data sets that are institutionally prepared, given the resources required to produce such data (Splendore et al., 2015). Although it is not uncommon for journalists to investigate data for officials’ tampering (Parasie, 2015), journalists are less likely to question the fundamental logic and structure of the categories, metrics, indices, and demographic groups that are baked into data sets. It is also less routine for journalists to account fully for the granularity of data composition – for example, normality of distribution or statistical outliers. These tendencies are consistent with journalists’ co-dependent relationships with the powerful institutions from which they derive legitimacy and the resulting routinized practices (Cook, 2005; Ryfe, 2017). The knowledge and time resources that data work demands are another factor (Parasie, 2015): The growing emphasis on data journalism projects in newsrooms, coupled with shrinking newsroom staffs, encourages an uncritical reliance on data pre-prepared by officials (Fink and Anderson, 2015). Related to this, the inconsistency of data-gathering/statistical expertise and resources across both local news outlets and local-level source institutions may encourage greater reliance on national and pan-national data sources, to the detriment of local reporting (Fink and Anderson, 2015).
However, entrepreneurial data projects from non-legacy outlets outside of mainstream journalism are emerging online, and these seem to be influencing traditional journalism practice (Borges-Rey, 2016; Lewis and Westlund, 2014; Parasie and Dagiral, 2012). Some of these efforts use practices such as crowdsourcing and social media data mining that present challenges to institutional, national-level control over the construction of data and data categories. But it is not clear how common these practices are (Fink and Anderson, 2015; Knight, 2015), and how much these outlets focus on informing, relative to advocating (Parasie and Dagiral, 2012) and entertaining (Knight, 2015) – or how much legacy journalists will use these citizen-friendly practices or projects themselves. It is also unclear how much these non-legacy digital outlets are using or not using government data: Some new data project tools come with built-in government data sets.
Data categories: Constructions and black boxes
Although journalists’ reliance on institutionally pre-structured data categories are attributable to the unique relationships between journalists and officials, to the allure of data’s aura of neutrality, and to the disconnect between journalists and citizens, the nature of data construction itself and the political-economic forces that drive this construction are also factors. As the sociology of quantification scholarship shows, abstract categorical constructs tend to become increasingly elaborate, gaining social and political legitimacy and taken-for-grantedness and becoming black-boxed ends in themselves (Desrosieres, 1998; Espeland and Stevens, 1998, 2008). ‘Commensuration’, or ‘the transformation of different qualities into a common metric’ (Espeland and Stevens, 1998: 314), is at the root of this process: ‘It makes no sense to count people if their common personhood is not seen as somehow more significant than their differences’ (Porter, 1986: 25). boyd and Crawford (2012) question this process in journalism: ‘Not every connection is equivalent to every other connection … Data are not generic’ (p. 671).
The emergence of the abstract construct of unemployment in the United Kingdom in the 1800s and early 1900s – and its eventual connection with human subsistence – provides a helpful historical example of the complex process by which statistics emerge from changing social, political, and economic contexts; are commensurated; and become taken-for-granted and naturalized within the public sphere. The growth of bureaucratized firms and the advent of labor-friendly legislation in the United Kingdom in the 1800s encouraged the government to try to systematize the concept of ‘risk’ in labor situations, so compensation could be figured and minimized. The spread of bureaucratic practices led to more regularized, homogeneous labor situations, making it easier to put boundaries around the concept of labor situations and report loss of labor as a compensable risk. Individual, distinct work situations were commensurated, aggregated, and quantified, and the previously unknown construct of ‘employment’ was invented, as well as metrics for measuring it. Around the same time, social reformers were pushing political efforts to assess conditions of poverty in the United Kingdom, in response to economic problems. In order to report on conditions and derive policies for alleviating poverty and for buffering the middle and upper classes from the poor, a systematic, legitimated mechanism was needed for defining and stratifying the poor, the middle class, and so on. A way was needed to commensurate and categorize individual economic situations – situations that were particular and varied, in actuality. The recently constructed metrics of ‘employment’ served the purpose. Over time, unemployment became linked in the social consciousness with poverty – quite a feat of abstraction at the time, given that ‘employment’ had only recently come to be associated with subsistence (Desrosieres, 1998). Unemployment metrics found a place in the routine reporting and decision-making of government and political agencies, and eventually, news organizations, which depend on information from these agencies.
As Porter (1995) notes, commensurated, black-boxed categories have staying power:
Legions of statistical employees collect and process numbers on the presumption that the categories are valid. Newspapers and public officials wanting to discuss the numerical characteristics of a population have very limited ability to rework the numbers into different ones. They thus become black boxes, scarcely vulnerable to challenge except in a limited way by insiders. Having become official, then, they become increasingly real. (p. 42)
According to Espeland and Stevens (1998), the process of commensurating unique entities can lead to ‘dazzling’ statistical composites, as entities that had been qualitatively distinct can now be calculated together because they have common units. While such abstractions can seem ‘increasingly real’, as Porter notes, there is also an unreality to them, as they are increasingly distanced from distinct, discrete, lived experiences.
March and Simon (1993) describe the similar process of ‘uncertainty absorption’ in organizations. Premises behind the numbers disappear as raw information collected empirically at the organization’s lower level boundaries is processed into simplifying calculations that add legitimacy and ease consumption by upper level decision makers. Processed, polished numbers are powerful tools in meetings, and consensus may be reached too easily. Starr (1987) observes, ‘The more that processing is completed in the deep recesses of the bureaucracies, the less able are [others] to unscramble the categories, change the assumptions, and generate alternative data’ (p. 29). In journalism, uncertainty absorption via uncritical acceptance of statistical metrics could encourage decoupling from, and devaluing of, anecdotal, shoe-leather reporting – and so, further diminish knowledge of personal, lived experiences in our communities. Or not: In a case study of one data journalism project, Parasie (2015) found that map data were reshaped so they conformed to the traditional narrative reporting.
Of course, it is not unreasonable for an abstract construct like unemployment to be linked with another like poverty. There is logic in the connection. The sociology literature merely makes the point that such constructs and connections are neither natural nor inevitable. They are human constructions that emerge from particular agencies and particular social, political, and economic circumstances, and they tend to accrue considerable authority over time (Espeland and Stevens, 2008; Porter, 1995). Presumably, more abstract constructs are emerging all the time to shape our future public sphere.
A relevant aside: There are both institutional and instrumental (technical) reasons for the advent of popular practices such as ‘data visualization’ and ‘computational journalism’. Selznick’s (1957) definition of ‘institutional’ is helpful here. A thing is institutional if it becomes ‘infused with value beyond the technical requirements of the task at hand’ (p. 17). Data journalism may be pursued for ‘institutional’ reasons beyond its utility: because it is all the rage, and signals that the news outlet is progressive. As Petre (2015) warns, ‘At a time when data analytics are increasingly valorized, we must take care not to equate what is quantifiable with what is valuable’.
Scholarship on data journalism
Much of the journalism scholarship on data and computational journalism has focused on ‘big data’, its scale and scope, the digital machinery needed to process it, and journalism’s response to the incursion of knowledge and norms from data science (e.g. Lewis and Westlund, 2014). This literature has explored the concept of journalistic control: the primacy of traditional narrative and reporting relative to raw data or ‘structured’ accounts (Bucher, 2017; Coddington, 2015; Parasie and Dagiral, 2012); positioning for authority, and competing and blending logics between data experts and journalists within newsrooms (Borges-Rey, 2016; Bucher, 2017; Hermida and Young, 2017); journalists’ control over data vs citizens’ access to data; and questions over claims that raw, granular data constitute objective accounts (boyd and Crawford, 2012; Lewis and Westlund, 2014; Parasie and Dagiral, 2012).
This literature has paid much less attention to processes of data and category construction, but there have been relevant observations. Gynnild (2014) encouraged journalists to engage in ‘abstract reasoning’ (p. 725) when they work with large data sets, and Bucher (2017) discouraged the thinking of computational journalism as naturalized ‘matter of fact’ (p. 919). Thurman (2011) noted that companies offering personalized news services provided pre-constructed news coverage categories. The concepts of control and citizen involvement in this literature are also relevant. Theoretically, construction of data sets through crowdsourcing or by giving citizens access to raw data could further challenge the control that officials and legacy news outlets have over data sets and categories. The idea that journalists should avoid controlling the data with their own frames and categories has gained popularity, though some have criticized this as hamstringing the watchdog (Parasie and Dagiral, 2012).
Some research notes that data journalism production is time-consuming and costly (Gynnild, 2014), especially in the context of shrinking newsroom resources (Parasie, 2016). Consequently, data projects can often be shallow and rely heavily on official sources (Fink and Anderson, 2015; Knight, 2015; Parasie, 2015). Fink and Anderson (2015) detailed the ‘profound differences’ between data journalism practices at larger news outlets vs small and midsized outlets, which have less time, staff, status, and expertise, and fewer technological tools and legal resources (pp. 8–9).
Definitions and research questions
Precise definitions of ‘data journalism’ in the literature have been scarce. Scholars point to the term’s contested, diffuse nature (Fink and Anderson, 2015; Lewis and Westlund, 2014) and tend to identify multiple dimensions rather than a singular definition (boyd and Crawford, 2012; Lewis and Westlund, 2014). Concepts in Lewis and Westlund’s (2014) description of ‘big data’ are consistent with the sociology of quantification: ‘emerging ideas about, activities for, and norms connected with data sets, algorithms, computational methods, and related processes and perspectives tied to quantification as a key paradigm of information work’. We also connect visualization (graphic presentation) with the notion of public data, which require intelligible communication – a likely reason that graphic tabulation and statistics co-emerged, historically (Desrosieres, 1998; Starr, 1987). Ultimately, we define ‘data journalism’ narrowly, in terms of content rather than process: informational, graphical accounts of current public affairs for which data sets offering quantitative comparison are central to the information provided. 1
Concepts and findings from the sociology of quantification and data journalism literature suggest a number of research questions about the impact of quantification and commensuration on news content. The integration of data science and journalism indicates this impact may differ between non-legacy outlets outside the traditional journalism field and traditional legacy news outlets. Individuals at non-legacy outlets may be less socialized to, and less constrained by, traditional reporting practices and more open to experimentation with citizen-based data practices such as crowdsourcing. Organizational/professional policies, connections with officials, and in-person reporting are likely more prevalent in legacy outlets, and these may affect source types used, as well as the likelihood that data will be scrutinized. Because of changing dynamics due to the recent surge in enthusiasm over data journalism, we also examine change over time.
According to sociology of quantification research, historically, significant resources have been required to collect, organize, and distribute large data sets, and institutions at the national and pan-national levels (e.g. UN agencies) are more likely to possess these resources than are institutions at the local level. By implication, increase in the use of data journalism may diminish attention to the local context. This suggests the following research questions:
What is the relative frequency of local, national, and pan-national sources for data in data journalism projects? How does this vary between legacy and non-legacy outlets? Across time?
According to sociology literature, the tendency toward quantification of information is driven by a need for uneven and diverse incidents, situations, and individuals to be reported in systematic and efficient ways. This affords comparison, enhances the perceived rationality and legitimacy of the information, and reduces, or hides, uncertainty, all of which help those who interpret and make decisions about the information (officials, journalists, etc.). This quantification process involves the commensuration of discrete, particular entities into abstract categories, which are calculated and aggregated. Powerful computing technology eases commensuration. So, increasing emphasis on data in journalism may encourage invention of elaborate, abstruse, abstract constructs. These constructs afford comparison and analysis of scale, typically through institutionally derived metrics produced in particular political-economic contexts, but they also obscure particularity.
How common is the use of abstract constructs in data journalism projects? How does this vary between legacy and non-legacy outlets? Across time?
An increasing emphasis on abstract categories and constructs, metrics, and indices may diminish the traditional attention to personal, narrative anecdotes in journalists’ reporting. How commonly do data journalism stories provide these unique anecdotes?
How common is it for data graphics to be accompanied by reporting of individual incidents and personal anecdotes? How does this vary between legacy and non-legacy outlets? Across time?
The sociology literature suggests commensurated statistical categories and metrics tend to be accepted with little scrutiny, becoming black-boxed and unquestioned. In addition, increasingly constrained resources in news organizations may make it less likely that journalists will check validity and reliability of the data sets they receive and use. The degree to which data journalism producers scrutinize data and report limitations is in question, as is the likelihood that outlets will use government data sets rather than self-collect the data (via open source, etc.).
How common is the scrutiny of data reported in data projects? How does this vary between legacy and non-legacy outlets? Across time? How common is it for data to be obtained from official sources’ data sets rather than gathered and composed by data journalism project producers? How does this vary between legacy and non-legacy outlets? Across time?
Methods
To address research questions, we analyzed the content of 194 data journalism projects published in the United States and the United Kingdom from 2011 to 2016. 2 These countries were selected because of similarity in media systems 3 and professional norms (Mancini, 2000), and because the language is accessible to researchers.
The study is exploratory. No comprehensive sampling frame of data journalism projects exists, and so researchers constructed a non-probabilistic sample from online news story databases, which included mostly legacy outlets, and from online collections of data projects, some of which mixed legacy and non-legacy, and some of which were only non-legacy. We defined legacy outlets as organizations with a primary mission of producing traditional public interest news and which have print or broadcast products that pre-date the online product. Non-legacy outlets include all outlets that do not meet all of these criteria – most are digital-only outlets produced/funded by foundations, non-profit or activist organizations/associations, or individuals. We expect that non-legacy outlets are less likely to be governed by traditional reporting norms and routines, providing variability in dependence on official sources. The study’s definition of ‘data journalism’ guided the sampling. We also sought variability in legacy/non-legacy, years (2011–2016), and community size (population).
Data journalism projects 4 are derived from (1) the NewsBank database of US daily newspapers, using search terms ‘data’ and ‘investigat*’ or ‘special report’; (2) the Investigative Reporters and Editors library of NICAR 5 award submissions, using the search term ‘data’; (3) the Data Driven Journalism site; (4) Global Editors Network Data Journalism Awards; (4) data project collections from the Guardian, Wall Street Journal, New York Times, and Bloomberg sites, and the Best of Online Journalism site; (5) the Data Stories data visualization site; and (6) the Information Is Beautiful site’s list of data visualizations. 6 Six projects were not accessible due to firewalls or faulty sites, or did not meet the definition of data journalism. They were removed. In the final sample of 194 projects, 113 (58.2%) were produced by legacy news operations and 81 (41.8%) by non-legacy outlets. Among the 57 legacy outlets based in geographical communities and without a national audience, most were from large cities, but 14 had populations of less than 1 million, with Athens, Ohio, the smallest at 24,000.
For data projects with multiple information sources, we coded only the first three sources, 7 resulting in a total of 343 sources for the 194 data projects. The final sample of data projects and sources is purposive: We do not claim generalizability beyond the projects studied here, and parametric statistics (significance testing) are not used.
Following training on a content analysis protocol and an informal intercoder assessment for two student coders, a formal intercoder reliability test was conducted in which 20 randomly selected data projects (~10% of the sample) not used in the study were analyzed. Cohen’s Kappa coefficients were calculated for all categorical variables, resulting in low coefficients for half of the variables. After re-training and a second reliability test, all but one variable had Kappas between .68 and .78. This one variable (active reporting) was removed. 8 The variable abstract constructs is ratio level, and so bivariate correlation analysis was used, r = .60.
We measured localness of data source by coding sources for data sets as local, national, statewide, regional, national, pan-national, non-locational, self-gathered, or missing/cannot determine. 9 We measured abstract constructs by counting the number of constructs created by statistically combining quantitative measures (i.e. measures ‘commensurated’ into common units). This type of construct represents an abstraction derived from calculating multiple factors, rather than some single concrete thing and its frequency (e.g. the ‘cost of gun violence’ is an abstract construct because it is an index of different kinds of cost rather than only a death count or money count). Examples include well-known constructs such as gross domestic product (GDP), as well as constructs created by the data project producer – for example, a ‘loneliness measure’ and a US state ‘integrity score’. Anecdotal reporting was measured by coding for ‘quotes or paraphrased comments that express perceptions of particular everyday people who are affected by the issue or problem being reported’, as stated in the codebook. Anecdotal reporting appeared either in traditional written stories in which the data project was embedded or within the data graphic. We measured reporting of data scrutiny by coding for comments near, or that obviously linked near, the visualization, which informed readers on ‘the quality of the data used, such as acknowledgment of limitations, indications of omitted data, potential bias or inaccuracy’. 10 Official source was a government source, coded as government, pan-national, commercial, non-profit/foundation, academic, professional, news publication, self-gathered, and cannot determine. We also gathered year and month of data project publication, and community population.
Findings
The first research question asks how commonly data projects used local, national, and pan-national sources, and how this varied between legacy and non-legacy outlets, and across time. The sample consists of 343 sources total: 135 for data projects at non-legacy outlets and 208 for data projects at legacy outlets. Of the sources named, most were national level at 32.1 percent (n = 110), and 9.0 percent (n = 31) were pan-national; 13.7 percent (n = 47) of the sources were coded as local, 9.9 percent (n = 34) as statewide, and 0.6 percent (n = 2) as regional; 14.9 percent (n = 51) were ‘non-locational’ (academic organizations or foundations) and 9.0 percent (n = 31) were ‘self-gathered’ by the data graphic producer (e.g. collecting incidents via Google search, website scraping, social media analytics); and 10.8 percent (n = 37) of the sources were either missing or too vague to determine.
Across the years, percentage of sources that are national declined, from 36.6 percent in 2011 down to 25.3 percent in 2016. There has also been a recent rise in percentage of sources that are missing or indeterminate (see Figure 1). Other trends in source use – for local, state, regional, pan-national, non-locational, and self-gathered data – were either flat or there was no clear pattern.

Percentage of data projects (N = 194) with abstract constructs and anecdotes, and percentage of data sources (N = 343) that are government sources or indeterminate, over time.
Sources for legacy outlet data projects were more commonly local/state (26.9% of legacy project sources) than non-legacy projects (18.5%) (see Table 1) and were also more commonly national/pan-national (45.2%) than for non-legacy projects (34.8%). There was also a substantial difference in self-gathered sourcing (crowdsourcing, website scraping, etc.), more common for non-legacy outlet projects (14.8% of non-legacy project sources) than for legacy outlet projects (5.3%), and in percentage of missing/indeterminate sources: 17.0 percent for non-legacy projects and 6.7 percent for legacy projects.
Percent comparison of data projects and sources from legacy vs non-legacy outlets.
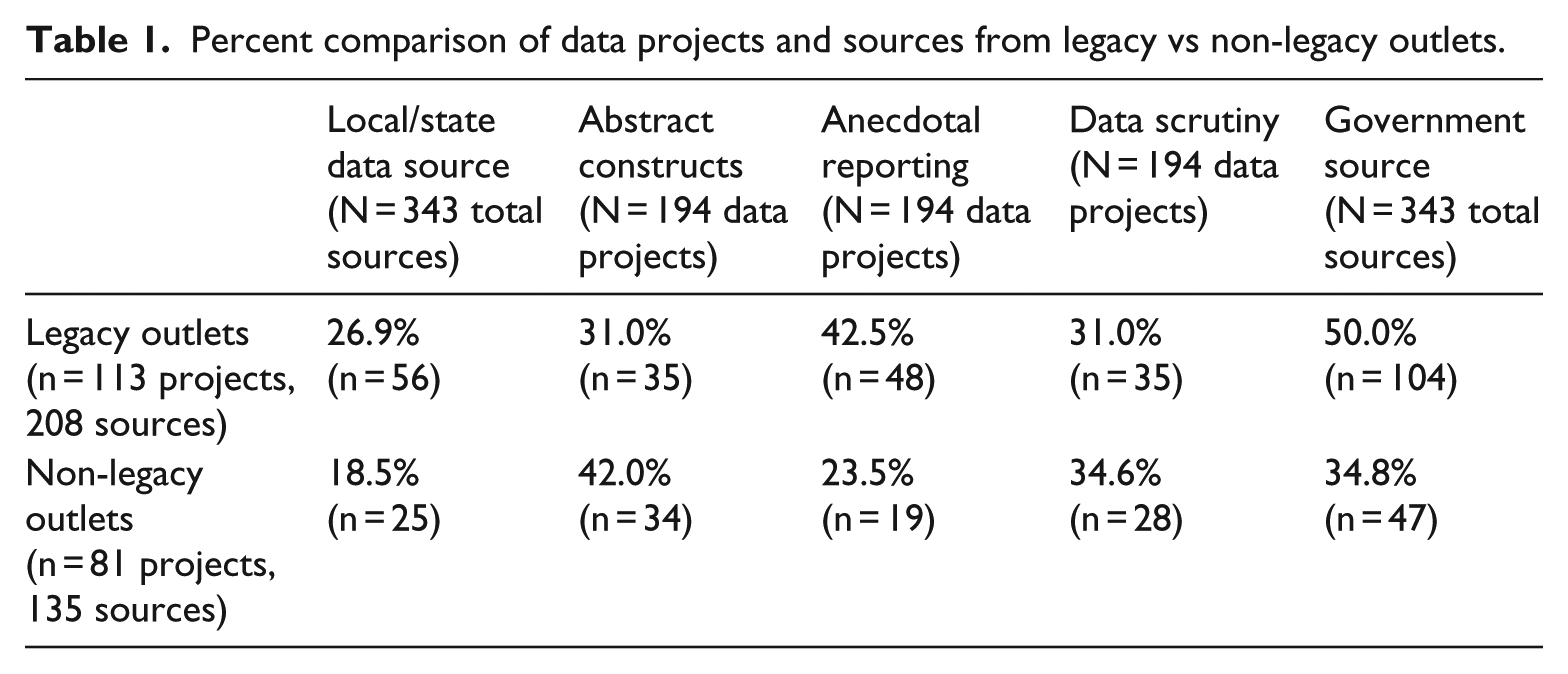
The second research question asks about prevalence of abstract constructs in data projects, their variability between legacy and non-legacy outlets, and across time. Just over a third (35.6%, n = 69) of all data projects included abstract categorical constructs. Sociology of quantification literature suggests these likely will increase over time, given tendencies to commensurate, quantifying distinct concepts for aggregation. Findings offer some support. The number of data projects in the sample providing abstract constructs grew steadily from 16.0 percent in 2011 to 46.0 percent in 2016 (see Figure 1). Abstract constructs were more common in data projects at non-legacy outlets: 42.0 percent of data projects in non-legacy outlets used abstract constructs compared to 31.0 percent of legacy outlets (see Table 1). Examples of abstract constructs varied widely across topics: for example, an index of income inequality, an LRA (Lord’s Resistance Army) incident rating, a measure of civic hacker collaboration, a metric assessing contexts for crying (e.g. ‘distribution of intensity of cries’), an ideological consistency scale, and a sports team skill-level metric.
To illustrate benefits and problems from commensurated ‘abstract constructs’, two examples from the study’s sample are provided here. In one, a legacy news outlet offers an interactive visualization of a global ‘Gender Gap Index’. The user enters country name and gender, clicks, and watches an animated, illustrated weight scale with a man and a woman rising or falling depending on a gender equity score – a ranking among the world’s nations. Users are encouraged to share the graphic on social media. The graphic includes a link to a report, which, several clicks down, reveals the index scores and categories constituting the index. No rationale is provided for the choice of the categories used, or for how they are aggregated, and no ‘un-commensurated’ anecdotes are provided.
In the second, a non-legacy outlet provides a visualization of a ‘Global Hospitality Index’, consisting of a colorful arrangement of icons representing nations, ranked by index scores. No anecdotal information is provided, and no information is provided about the index on the graphic page. A source at the bottom cites a ‘Refugees Welcome Index’, and Googling this term leads to a report. At the end of the report, we learn the index is based on a mean score of values assigned to different survey question responses. Rationale for the particular values assigned or for the question choice is not provided.
The benefits of these two visualizations are clear: The information, derived from worldwide samples, is publicly important. The visualizations are engaging and professionally rendered, likely to engage readers in information they might not otherwise notice. Potential problems are less obvious: Information about aggregated categories is buried, with no real rationale for their selection and no validating anecdotal information. Social media sharing is encouraged, suggesting that the surface information will spread, as it seems unlikely many will dig for deeper context.
Linkage between anecdotal reporting (reporting on individual incidents in stories that accompany the graphic or that are within the graphic) and data projects was explored. Anecdotal reporting was linked with more than a third (34.5%, n = 67) of all data projects, and this percentage decreased from 44.0 percent in 2011 to 26.0 percent in 2016 (see Figure 1). Legacy media projects more commonly included anecdotal reporting than non-legacy projects (42.5%–23.5%; see Table 1).
Level of reporting of data scrutiny was also explored, and a third (32.5%, n = 63) of the data projects included comments about the quality of the data itself – for example, limitations of the sample or measurement. There was no discernible pattern in level of scrutiny over time, with all but 1 year’s data in the 25 to 45 percent range. There was also little discernible difference between legacy (31.0%) and non-legacy outlets (34.6%), though the slightly higher non-legacy percentage is unexpected. Still, around two-thirds of legacy and non-legacy projects showed no overt, easy-to-find evidence of reporting data scrutiny, as defined in this study.
The final research question asked how frequently data projects used ‘official sources’, defined here as government officials or divisions. Across the entire sample of sources, government sources were by far the most common (as predicted by the sociology scholarship), at 44.0 percent (n = 151). Percentage of sources that are government sources decreased from 53.7 percent in 2011 to 37.4 percent in 2016 (see Figure 1). Sources for legacy outlet projects were more frequently government sources (50.0%) than were sources for non-legacy projects (34.8%) (see Table 1).
Finally, additional analysis was conducted on the 29 data projects that used self-gathered data – that is, data that the data journalists collected through website scraping (13 projects), social media analysis (6 projects), and online solicitation/surveys or personal observation (10 projects). This subsample of 29 is small, and results should be interpreted cautiously, but this subsample of projects showed substantial differences from the overall sample: 44.8 percent included comments about data quality compared to 32.5 percent of the entire sample, 51.7 percent included abstract constructs (entire sample = 35.6%), and 27.6 percent included anecdotal reporting (entire sample = 34.5%).
Discussion
This exploratory study applies concepts and expectations from the sociology of quantification to a journalism context, and findings offer some support for this literature: In these data projects, we see an increase in use of abstract constructs, a decrease in use of anecdotal knowledge, and relatively limited evidence of reporting data scrutiny – at least evidence that is overt and easily accessible. We also see a heavy use of national-level government data, though non-legacy outlets used government data less frequently and used self-collected data more frequently than legacy outlets. Construction of abstract metrics and use of national-level data from official sources suggest less emphasis on the granularity of situations, and they suggest heavy institutional influence. But such work also affords comparison and analysis of scope and scale, with reasonably high levels of expertise.
Across the sample, findings showed an increasing use of abstract constructs, in the form of calculated metrics and aggregated indices that were both adopted and invented by the data project producer. These are more prevalent in data projects at non-legacy media and in projects using self-gathered data (web-scraped data, social media data, etc.). The trending growth of non-legacy outlets suggests the possibility of more abstract constructs in the future. Findings also showed that nearly two-thirds of data projects provided no results of anecdotal reporting, and there was a decrease across years in projects that connected data presentation with anecdotal information. We also found less use of anecdotal reporting in non-legacy data projects and in projects using self-gathered data – again, suggesting the possibility of more abstraction and less personal, less granular reporting in the future. It is likely that some projects without anecdotal information have been separated from narrative stories they once accompanied, and that these now persist only in (commensurated) data graphic form. The de-bundling and long shelf life of online news could therefore play a role in this absence of anecdotal information.
Abstract constructs, through their aggregation of particulars, can efficiently offer new perspectives on the overall landscape. But the processes of commensuration and abstraction can also lead to broad constructs that frame public discussion and public life in simple, powerful ways, becoming unquestioned and naturalized. These processes also frame the way we think about particular events and instances – important to consider, especially in a time of lean reporting staffs and revenue worries, which constrain ‘shoe-leather’ reporting.
More evidence of broad scope over granularity: The use of data from national and pan-national sources across the sample far outweighs use of local and state sources. This finding is consistent with theoretical expectations that large, well-resourced institutions are most likely to produce large, complex data sets. Findings showed no evidence that locally sourced data were decreasing, but there were substantially less local/state sourcing in non-legacy outlets than in legacy outlets. Assuming continued growth in non-legacy outlets and continued diminishing resources in traditional community-based media, we could see less local sourcing for data projects in the future.
There is relatively little evidence of overt, easy-to-find data scrutiny reporting across the sample, as measured in this study: Around a third of data projects mentioned limitations in data sampling, measures, and so on. It seems likely that limitations overtly mentioned in the projects do not reflect all the data scrutiny taking place, which interviews with data producers could reveal. However, it is also the case that many of these projects were award winners, award submissions, or projects collected as examples of best practices. Notably, the level of data scrutiny at legacy outlets is on par with the level of scrutiny at non-legacy outlets. Data projects using self-gathered data, such as data scraped from websites, mined from social media, and solicited from users, demonstrated a higher level of scrutiny. This was a small subsample, but perhaps data journalists with more knowledge of data gathering methods – whether at legacy or non-legacy media – are more experienced in reporting on methodological limitations and more likely to do so because there are more details about the process to convey. Nevertheless, overall findings suggest a need for greater access to training in data sampling and construction at both the student and professional levels.
Finally, the sociology literature emphasizes the dominant, necessary role that government and other large institutions have played in the production of large data sets, and for this sample, government sources were dominant, making up close to half of all sources. However, we also saw a decrease across recent years in government sources and a rise in self-gathered data. Also, non-legacy outlets, becoming more prevalent, were less likely to use government sources than legacy outlets and more likely to self-collect data than legacy outlets. Implications are mixed. On one hand, this finding suggests a less uncritical acceptance of government-generated information. We might expect non-legacy outlets to self-collect data more than legacy outlets and rely less on government data, given that these data producers seem less likely to be socialized to the regular, ongoing relationship between journalists and officials, and also less likely to have access to such officials. On the other hand, the limited evidence of data scrutiny reporting and increase in indeterminate sourcing raises questions about some non-legacy outlets’ journalistic competencies related to verification and public transparency. They may also be less likely to communicate with officials who have valuable expert knowledge of the data that is codified in their agencies. As data journalism literature suggests (e.g. Borges-Rey, 2016; Gynnild, 2014; Lewis and Westlund, 2014), the future quality of data journalism may depend on successfully integrating the complex knowledge and norms of data science with the complex knowledge and norms of journalism and officials.
In sum, the sociology of quantification perspective finds some support here, with increasing abstraction and decreasing attention to personal, lived anecdotes. We see a growing tendency for data source information to be difficult to find and a relatively low level of data scrutiny reporting that is overt and easy to find (though no meaningful change across years). We also see higher percentages of national-level sourcing than local sourcing across all years, and a decline in government sourcing coupled with a rise in self-gathered data. These findings and the concerns they raise become more poignant when we consider that many of the data projects examined here have been held up as model efforts.
The study’s limitations are found primarily in the sampling. The 194 data projects were not sampled randomly from a comprehensive population list and tended to skew toward larger outlets. Also, the great variability in project formats made content analysis challenging. Interviews with data journalists would have aided the validity of the study’s measures of data scrutiny and metric construction, shedding more light on the contexts and mechanisms that shape data journalism practices and processes. The sociology of quantification literature points to the problem of losing particular contexts and differences in quantitative analysis: Qualitative analysis of data journalism production is a logical next step.
While we have looked at data construction here with a critical eye, we are not arguing that commensuration and aggregation are intrinsically dysfunctional for journalism or the public. Of course, they are potentially powerful tools for explaining societal-level problems, for challenging public officials, and even for involving everyday citizens in the process of generating public knowledge. But we should not embrace these processes uncritically, and this is not only because of misuse of statistical techniques. Statistical categories and metrics are alluring: They are increasingly easy to produce, they are increasingly in accord with ‘progressive’ ideas about journalism’s future, and they cast an aura of objective truth. They are, however, social, political, and economic constructs and not objective reflections of the world. News managers, journalists, and audiences should be aware of the tendency for quantitative constructs to become black-boxed, unquestioned, and naturalized, and aware of the role that political-economic power plays in the creation of these constructs.
Footnotes
Funding
The author(s) received no financial support for the research, authorship, and/or publication of this article.