
Abstract
This article explores the relationship between financial development and growth in manufacturing and service sectors in 77 developing economies over the period 1984–2013. Specifically, we examine whether the size of the financial sector matters and if it does, whether the size of the financial sector in these countries is of a sufficient scale for credit and liquidity expansion to benefit the economy. Using the two-step system generalized method of moments, we find a u-shaped relationship between either manufacturing or services growth and financial size, indicating that a critical level of financial scale has to be achieved for financial expansion to positively affect the growth. For some 50%–90 per cent of the economies in the sample, there is a robustly long-run adverse effect of financial expansion on both manufacturing and services growth, indicating a case of ‘too little’ finance, likely explained by a combination of weak institutions, market failures and the existence of large and lumpy investments that require sufficient financial scale.
Keywords
Introduction
The financial development-economic growth nexus is vast, yet there appears to be no clear consensus on the effects, causal or otherwise, of financial development on growth.
On the one hand, there are studies that posit and find a positive impact of financial development on growth. The theoretical underpinnings of these can be traced to the works of Bagehot (1873), Schumpeter (1911) and Hicks (1969), who argued that a well- functioning financial system primarily plays the vital role, not only in facilitating the mobilization of capital towards the most productive activities, but also in mitigating information asymmetry problems, in achieving transactions cost-minimizing economies of scale and in diversifying risks that enable technological and process innovations and overall economic development. 1 These theoretical arguments have undergone further development in two classes of growth models that incorporate the beneficial effects of financial systems on either the rate of capital accumulation (Greenwood and Jovanovic, 1990; Lucas, 1988; Rebelo, 1991; Romer, 1986) or the rate of technological and process innovation (Aghion and Howitt, 1992; Grossman and Helpman, 1991; Romer, 1990). Much of the empirical literature in the 1990s and the early 2000s, beginning with the seminal work of King and Levine (1993a, 1993b), has sought to establish a positive, causal relationship between financial development and growth (see also, for instance, Beck, Levine and Loayza, 2000; Levine, Loayza and Beck, 2000; Rajan and Zingales, 1998).
On the other hand, some studies find that the financial sector has, at best, no key role in growth and development (Lucas, 1988). Robinson (1952: 86) even turns the causal relationship on its head in stating that ‘where enterprise leads finance follows’. Levine (1997) observes that this disregard for financial intermediation as a key to growth is blatantly apparent in its absence in the works of the ‘pioneers of development economics’. Indeed, a more recent, growing body of evidence shows that financial development—particularly in terms of credit and liquidity indicators—can have at best, no significant effect on growth due to weak institutions and poor macroeconomic policies and at worst, even have a negative short-run impact on growth, which may either be due to ‘credit surges’ that often precede banking crises (Beck and Levine, 2004), or to a lack of financial scale which is often attributable to the existence of weak institutions and market failures that are more pronounced in developing economies (Sutton and Jenkins, 2007).
Despite the vast literature on the relationship between finance and growth, however, there are only a few studies that examine the role of the size of the financial sector and the existence of potential non-linearities in the financial development-growth nexus. For middle-income and high-income economies over the period 1960–2010, Arcand, Berkes and Panizza (2011), for example, find a case of ‘too much finance’, or ‘too-large-a-scale’ effect in that there are diminishing returns to financial expansion when private credit (as % of GDP) is higher than the 80%–100 per cent range. Furthermore, this finding appears to be specific to more developed economies. Indeed, while Deidda and Fattouh (2002) and Rioja and Valev (2004) both find a positive and significant effect of financial expansion on growth in economies with greater financial depth, this effect vanishes for economies with shallower levels of financial depth. Confining the sample to 44 developing countries from 1974 to 2001, Dawson (2008), for example, finds a negative relationship between financial depth (measured by M3-to-GDP ratio) and growth, using a two-way fixed-effects model.
This study seeks to contribute to the literature on the finance-growth nexus in developing countries, given the seeming dearth of studies for this group of countries and for which the financial development-growth dynamic appears to be distinct. 2 Specifically, we examine whether the size of the financial sector (using four alternative measures of credit and liquidity often used in the literature) matters for the growth rates of the manufacturing and services sectors and, if it does, assess whether the size of the financial sector in these countries is of a sufficient scale for credit and liquidity expansion to benefit the economy. We examine whether non-linearities in the financial development-growth relationship exist, and the role, if any, played by weak institutions and other characteristics observed in developing countries and which may affect the finance-growth nexus. We focus on the manufacturing and services sectors, because these sectors have been the main drivers of growth in low- and middle-income economies in recent years, especially in the post-global financial crisis period, growing on average rates of at least 7 per cent, around 3 to 4 percentage points higher than that in high-income economies.
We employ Blundell and Bond’s (1998) and Windmeijer’s (2005) two-step system generalized method of moments (SGMM) to account for the endogeneity of regressors on an unbalanced panel data set of 77 developing countries with gross national incomes (GNIs) per capita of not more than $10,000 over six periods of five-year averages from 1984 to 2013. We use four alternative variables that are commonly used as indicators of financial development (all computed as percentages of GDP), particularly the size of the financial sector, as measures of financial development: domestic credit (credit extended by the financial system to the domestic economy), private credit (credit extended by the financial system to the private sector), bank credit (credit extended by banks to the private sector) and broad money (M3).
To preview our results, we find a robustly u-shaped relationship between each of our measures of financial development (credit and liquidity measures) and either manufacturing or services growth, indicating the existence of an optimal financial scale threshold above which financial expansion can have a positive effect on growth. Our estimates, however, reveal a case of ‘too little’ finance: Given that more than half of the financial systems (in most cases, even reaching to as high as between 90% and 95%) in this sample of low- and lower- middle-income economies are operating well below the minimum efficiency scale, financial intermediation expansion has a negative effect on both manufacturing and services growth.
While the lack of financial scale in developing economies may potentially be attributed to more prevalent institutional weaknesses and market failures that prevent financial systems from attaining such financial scale economies, which, in turn, is key to expanding economic opportunities (Sutton and Jenkins, 2007), the negative effect of financial expansion on manufacturing and services growth up to a critical level of financial scale may be explained by the existence of large and lumpy investments that are particularly more costly to finance in developing economies and that require a minimum amount of financial resources to be installed and rendered operational and useful in growth-enhancing production. Moreover, in developing economies where the opportunity for productive activities is more difficult to detect given more severe problems of asymmetric information, marginal financial expansion given a lack of sufficient financial scale is likely to flow towards less productive, even more speculative sectors (e.g., financial services and real estate) that might stunt, destabilize and even adversely affect long-run manufacturing and services growth.
The rest of the article is organized as follows: Section II is a brief review of related literature. Section III presents the empirical model and the data. Section IV discusses the results. Finally, section V proffers some conclusions and policy implications.
Review of Related Literature
In the 1990s up to the early 2000s, a number of cross-country, panel data analyses, that employ a variety of instruments and econometric techniques, shows a positive causal link between financial development and growth. See, for instance, the works of King and Levine (1993a, 1993b), Rajan and Zingales (1998), Beck et al. (2000) and Levine et al. (2000). In particular, Beck et al. (2000) use both dynamic panel estimators and cross-sectional instrumental-variable estimators on 74 countries from 1960 to 1995 to show that financial development is positively associated with economic growth.
In contrast, a burgeoning strand in the financial development-growth literature finds a non-positive effect of financial development on growth, using data sets that restrict the sample to less-developed economies and include more recent data. This non-positive effect is attributed to weak institutions (Arestis, Demetriades and Luintel, 2001; Demetriades and Hussein, 1996; Demetriades and Law, 2006) and poor macroeconomic policies (Rousseau and Wachtel, 2002). Dynamic panel data estimation studies show that among economies with less developed financial sectors over the period 1960 to 2004 (Rousseau and Wachtel, 2011) and in a sub-sample of 12 Latin American countries from 1960 to 1989 (De Gregorio and Guidotti, 1995), financial development adversely affects growth, citing the fact that rapid and excessive credit growth erodes financial institutions, which in turn, raises the likelihood of growth-inhibiting financial crises. Using a two-step generalized method of moments (GMM), Saci, Giorgioni and Holden (2009) find a negative short-run (annual) effect of private credit expansion on growth for 30 developing economies over the period 1988–2001. Ben Naceur and Ghazaouani (2007) find similar results for 11 southern and eastern Mediterannean countries, using dynamic panel GMM methods. Ayadi et al. (2013) extend the analysis to include both developed and developing Mediterranean countries over the period 1970–2009 and find the same negative short-run impacts of bank development and credit measures on growth.
A considerably shorter strand in the literature takes into account the existence of non- linearities in the financial development-growth nexus. For middle-income and high-income economies over the period 1960–2010, Arcand et al. (2011) find that the coefficient of the squared value of the financial development measure is negative and significant, indicating the existence of diminishing returns to financial expansion when private credit (as % of GDP) is higher than the 80%–100% range: a case of ‘too much finance’. This result is robust to controlling for macroeconomic instability, banking crises and institutional quality. Indeed, while Deidda and Fattouh (2002) and Rioja and Valev (2004) both found a positive and significant effect of financial expansion on growth in economies with greater financial depth, this effect vanishes for economies with shallower levels of financial depth. 3 By confining the sample to 44 developing countries from 1974 to 2001, Dawson (2008) finds a negative relationship between financial depth (measured by M3-to-GDP ratio) and growth, using a two-way fixed-effects model.
Evidently, size matters. A financial system that falls short of the threshold level for scale economies to kick in is unable to benefit from (a) the cost advantages that enable a better management of information asymmetry problems, and (b) the scale advantages, which enable the financial sector to effectively channel large flows of financial capital towards large-scale, growth-promoting industrial activities that often require large and lumpy investments. In the presence of weak institutions and markets and a dearth of opportunities for more productive investments, further financial expansion, given a lack of financial scale, instead renders the economy vulnerable to the dangers of rapid financial expansion, as financial resources are often diverted to less efficient and/or more speculative activities in the economy. Indeed, rapid liquidity and credit growth, as was experienced before the Asian financial crisis of 1997 and the more recent global financial crisis of 2008–09, are often harbingers of growth-destabilizing economic crises due to a false assessment of risks that accompanies, a relaxation of credit standards and financial regulation and supervision, exacerbating moral hazard problems. Also, an environment of easy credit and liquidity often results in a diversion of funds from more productive, growth-enhancing activities to more speculative activities (Tobin, 1984). Furthermore, rapid financial expansion due to a surge of capital inflows, often result in an overvalued currency, which harms the tradables-dominated manufacturing sector.
To sum, weak institutions, poor macro- economic policies, and a lack of financial scale or ‘too little’ finance have been cited as some factors that give rise to a non-positive effect of financial development on growth—apparently same reasons that polarize the empirical literature on the financial development-growth nexus.
Apart from accounting for the possible existence of non-linearities in the relationship between financial development and the growth rates of the manufacturing and services sectors that may be specific to developing economies, this article improves on the previous body of work by: (a) employing alternative measures of financial credit and liquidity (i.e., domestic credit, private credit, bank credit and broad money) to verify if these have distinct effects on either manufacturing or services growth; and (b) using a more recent, more expanded data set of 77 developing (low- and middle- income) economies for the period 1984–2013.
Empirical Model and Data
We employ Blundell and Bond’s (1998) and Windmeijer’s (2005) two-step system GMM procedure (SGMM) to estimate Equation (1) 4 :

where yit is either the annual growth rate of manufacturing or services value added (in real terms) in country i in period t; FDit represents the financial development indicator; Xit is a vector containing predetermined and endogenous regressors, which may include the lagged values of the dependent variable; Zit is a vector of strictly exogenous regressors; hi is the unobserved fixed-individual effect; and eit is the error term. The model is patterned after the typical cross-country growth equations.
We estimate separate equations for manufacturing growth and services growth as FD might have distinct effects on the sectors due to two reasons: (a) the existence of a large informal services sector in developing economies; 5 and (b) the inclusion of financial intermediation services and real estate in the services sector. Indeed, the latest UN International Labour Organization (ILO) report estimates that around 61 per cent of the world’s employed population (2 billion workers) are in the informal sector (around 25% in Europe and Central Asia, 40% in the Americas, 68.2% in Asia and 85.8% in Africa) and most of these are in the services sector in emerging and underdeveloped economies. As such, financial expansion, which is in terms of formal credit and liquidity expansion, may only be available to formal services sector firms, leaving at a distinct disadvantage informal sector firms (Farazi, 2014). The inclusion of financial intermediation and real estate in the services sector can be another source of difference in the effects of FD on manufacturing and services growth. Periods of rapid credit and liquidity expansion often favour the growth of these sectors, which are also the ones that are the most vulnerable to speculation and excessive risk-taking, which exposes the entire services sector more vulnerable to systemic risk and overall financial instability, which is injurious to the sector’s long-run growth prospects (see for instance, Carbó-Valverde, Marqués-Ibáñez and Fernández, 2011; Dell’Ariccia and Marquez, 2006; Rajan, 1994; Reinhart and Rogoff, 2009; Tornell and Westermann, 2002).
The two-step SGMM allows treatment of the endogeneity of the regressors through the inclusion of lagged values of both the dependent and independent variables as instruments. It also treats the Nickell bias, which is ubiquitous in macro panel data sets with large n (cross-section length) and small t (number of periods). Moreover, Windmeijer’s two-step correction procedure generates more consistent and more efficient estimates, mitigating the finite-sample bias. Furthermore, its advantage over Arellano and Bond’s (1991) difference-GMM model is that SGMM is more appropriate for dealing with variables that are or close to ‘random walk’, which most, if not all macroeconomic variables are purported to be. Lastly, information loss due to differencing in unbalanced panel data sets is less severe with SGMM than with the difference-GMM model.
For the financial development variable, FDit, the following measures of credit and liquidity as defined in the World Bank’s World Development Indicators are alternatively employed:
Domestic credit provided by the financial sector as a percentage of GDP or domestic credit, includes all credit issued by the central bank, deposit money banks and other financial corporations, such as finance and leasing companies, money lenders, insurance corporations, pension funds and foreign exchange companies. This measure represents the overall level of development of the financial sector. Domestic credit expansion, which is made available to both private and public sectors by both private and state-owned financial firms, is more likely to be subject to the inefficiencies in the public sector and used for financing fiscal deficits and debts, which can crowd out private investment and inhibit growth. Moreover, there is the concern that state-owned banks and financial institutions might be politicizing financial resource allocation, diverting financial resources from more productive to less productive sectors (Harris, 2003) and may, thus, adversely affect growth in these sectors. Domestic credit to the private sector as a percentage of GDP or private credit, which is the most common measure used in finance-growth studies Beck and Demirgüç-Kunt, 2008; Beck Demirgüç-Kunt and Levine, 2007; Beck et al., 2000; Edison et al., 2002; Favara, 2003; Levine, 2002; Loayza and Rancière, 2006; Saci et al., 2009). Private credit excludes credit extended to the government, but may include credit issued to public enterprises, as such, may also be subject to politicization and diversion from more to less productive activities, particularly to state-owned enterprises. Bank credit to private sector as a percentage of GDP or bank credit, which is used in several studies including Beck and Levine (2004) and Levine and Zervos (1998). Bank credit excludes credit issued by development banks and credit issued to the government, but can include credit issued to public enterprises in some countries. In the years leading to the global financial crisis (GFC), domestic credit diverged significantly from private credit as banks—especially in developed economies—veered away from their traditional intermediary role and engaged vigorously in ‘shadow banking’ activities, which engendered a build-up of financial systemic risks that ultimately led to the GFC (Financial Stability Board, 2017). Broad money as percentage of GDP or broad money, which is a measure of liquid liabilities of the financial sector (sum of currency outside banks, demand deposits, time, savings and currency deposits of residents, bank and traveller’s checks, and other securities excluding those of the central government’s). Broad money is often used as a measure of financial depth or the overall size of the financial intermediary sector (King and Levine, 1993; Levine et al. 2000). Broad money expansion is, however, more likely to finance more consumption spending than growth-inducing investment activities. The latter result is in line with Adu et al. (2013), who finds a negative effect of broad money on Ghana’s growth. We also include the squared values of these financial development indicators to account for possible non-linearities in the financial development-growth nexus. If α and β are significant (up to the 10% level of significance), the critical mean value of FD is
which is obtained by getting the derivative of (1) with respect to FD and setting it to zero. Thus, the total marginal effect of FD on y is:
where we let FD be equal to the sample median so that a positive marginal effect of FD on y implies that for at least half of the economies in the sample, there is a positive effect of financial intermediation expansion on growth.


The X vector comprises the following controls
6
:
The lagged values of the dependent variable, which are also used as instruments in the regressions; Fixed capital formation as a percentage of GDP, which is purported in theory as the main driver of output growth and which the manufacturing sector uses more intensively as an input than either the services or the agricultural sector; The log of the real exchange rate; The ratio of the value added of services to the value added of manufacturing, which is a measure of the relative size of the services sector. This is expected to have a negative, significant coefficient, which is in line with ‘development progeria’ in which the rapid, premature expansion of the nontradables-dominated services sector potentially harms further economic growth prospects (Daway and Fabella, 2015). In particular, development progeria
is the phenomenon where a poor country with a per capita income, say, of less than $5,000, displays the industrial share dynamics of a rich mature economy. The phenomenon is characterized by the progressive retreat of the shares in total value added of the Industry sectors, notably of Tradable Industry, such as Manufacturing, and the increasing share of the Service sector. (Fabella, 2013: p. 1) Net inflows of foreign direct investment as a percentage of GDP or net FDI, is included to account for the role that FDI plays, not only as an additional source of capital for productive activities, but also as a vehicle of transfers of technology and ‘best practices’ from abroad (Findlay, 1978; Wang and Bloomstrom, 1992) and as a facilitator linkages between foreign and domestic firms and among domestic firms within the supply chain, thereby generating spillover effects and enhancing production efficiency (Hirschman, 1958; Rodriguez-Clare, 1996); and Personal remittances as a percentage of GDP or remittances, comprise personal transfers and compensation of employees, as defined in the IMF’s Balance of Payments Manual 6th edition. This is included to account for the fact that remittances as a percentage of gross domestic product (GDP) ranged from around 10 per cent to 43 per cent in more than 30 developing countries in 2014,
7
and that remittance flows have already reached the half-trillion-dollar mark. There is thus much conjecture regarding the nature of the channels and mechanisms by which remittances affect a recipient developing economy’s growth prospects. While remittances represent additional disposable incomes to domestic households that enable both higher consumption and investment expenditures and potentially serve as buffers against economic downturns, contributing to poverty alleviation (Ducanes, 2015; Ratha, 2013), much of the literature on remittances and growth find a ‘Dutch Disease’ effect or a negative effect of remittances on growth. This is due to a real appreciation (of the local currency) effect, which may adversely affect export-led growth (See, for instance, Acosta, Baerg and Mandelman, 2009; Amuedo-Dorantes and Pozo, 2004; Bourdet and Falck, 2006; Hyder and Mahboob, 2005; Lartney, Mandelman and Acosta, 2012; Petri and Saadi-Sedik, 2006).
The Z vector consists of a measure of tropical land area to account for country- specific characteristics and of period dummies to control for common macroeconomic trends or time-related shocks. The inclusion of tropical land area is in line with Sachs’ (2001) ‘tropical underdevelopment’, which is based on the observation that countries closer to the tropical zone have lower per capita incomes than countries in more temperate climates. In particular, Sachs (2001) argues that both history-dependent factors and the existence of ecological barriers to the diffusion of temperate-specific technologies in growth- critical areas such as health, agriculture, military, energy utilization and manufacturing in tropical areas have played a major role in the underdevelopment of tropical economies.
All series, except for the ICRG index, are from the World Development Indicators database. The data set is an unbalanced panel of 77 developing countries with real GNIs per capita of at most $10,000 spanning six periods from 1984 to 2013 and with inflation rates below 50 per cent. 8 Each period is a five-year average, as is common in cross-country growth regressions, to minimize the impact of business cycles or short-run fluctuations on the estimated parameters. Table 1 presents the descriptive statistics of the data used in the estimations. 9
Descriptive Statistics
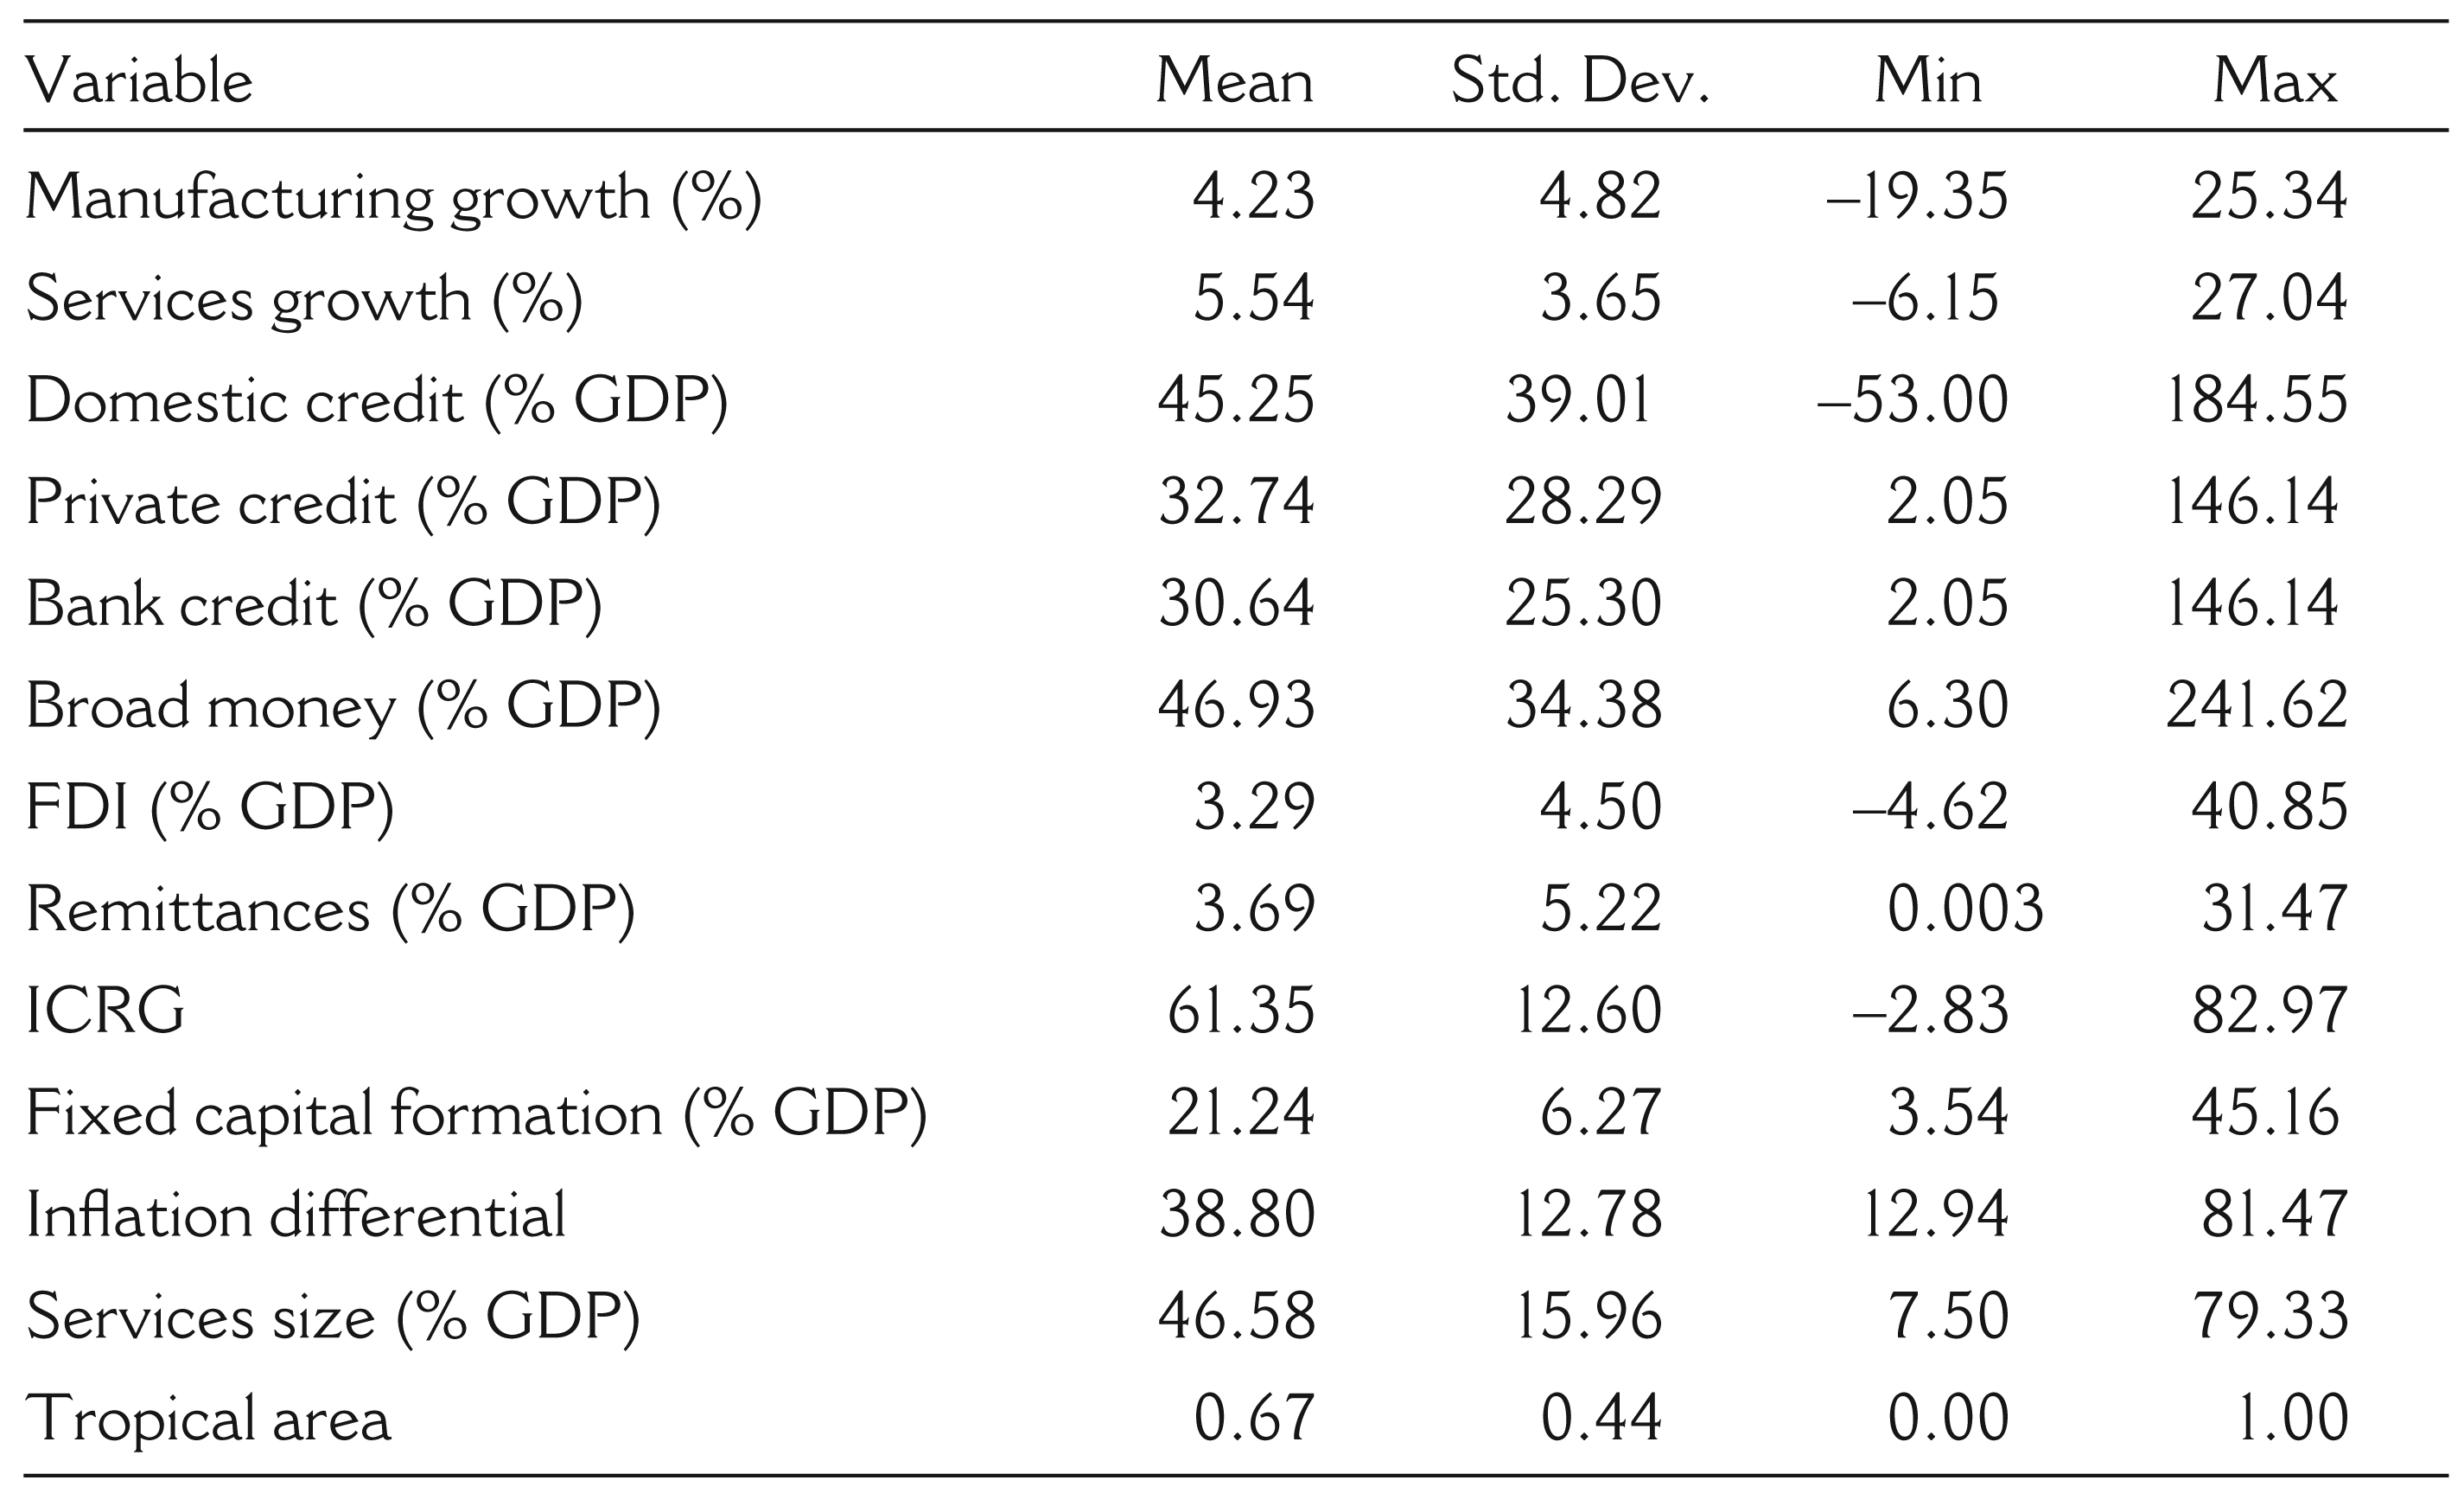
Figure 1 presents the contributions of manufacturing and services to GDP averaged over the periods 1999–2006, 2007–09 and 2010–13 for low-income countries (LICs), middle-income countries (MICs) and high-income countries (HICs). 10 In all sub-periods, both manufacturing and services value added (% GDP) in HICs outstrip manufacturing and services value added (% GDP) in LICs. However, the manufacturing value added (% GDP) in MICs started exceeding that in HICs in the period 2002–09. The average contribution of manufacturing to GDP in LICs and HICs for the period 1999–2013 is 10.2 per cent and 15.7 per cent, respectively, while that in HICs for the same period is 18.8 per cent. The average contribution of services to GDP in LICs and MICs for the period 1999–2013 is 45.5 per cent and 49.0 per cent, respectively, while that in HICs for the same period is 72.7 per cent.

In terms of growth rate, however, Figure 2 shows that manufacturing and services grew faster in LICs than in HICs in all subperiods. 11 While manufacturing growth in both country groups declined during the 2007–09 global financial crisis, the average manufacturing growth rate in HICs was negative at –2.6 per cent. By 2010–13, manufacturing growth rates have already recovered in both country groups.
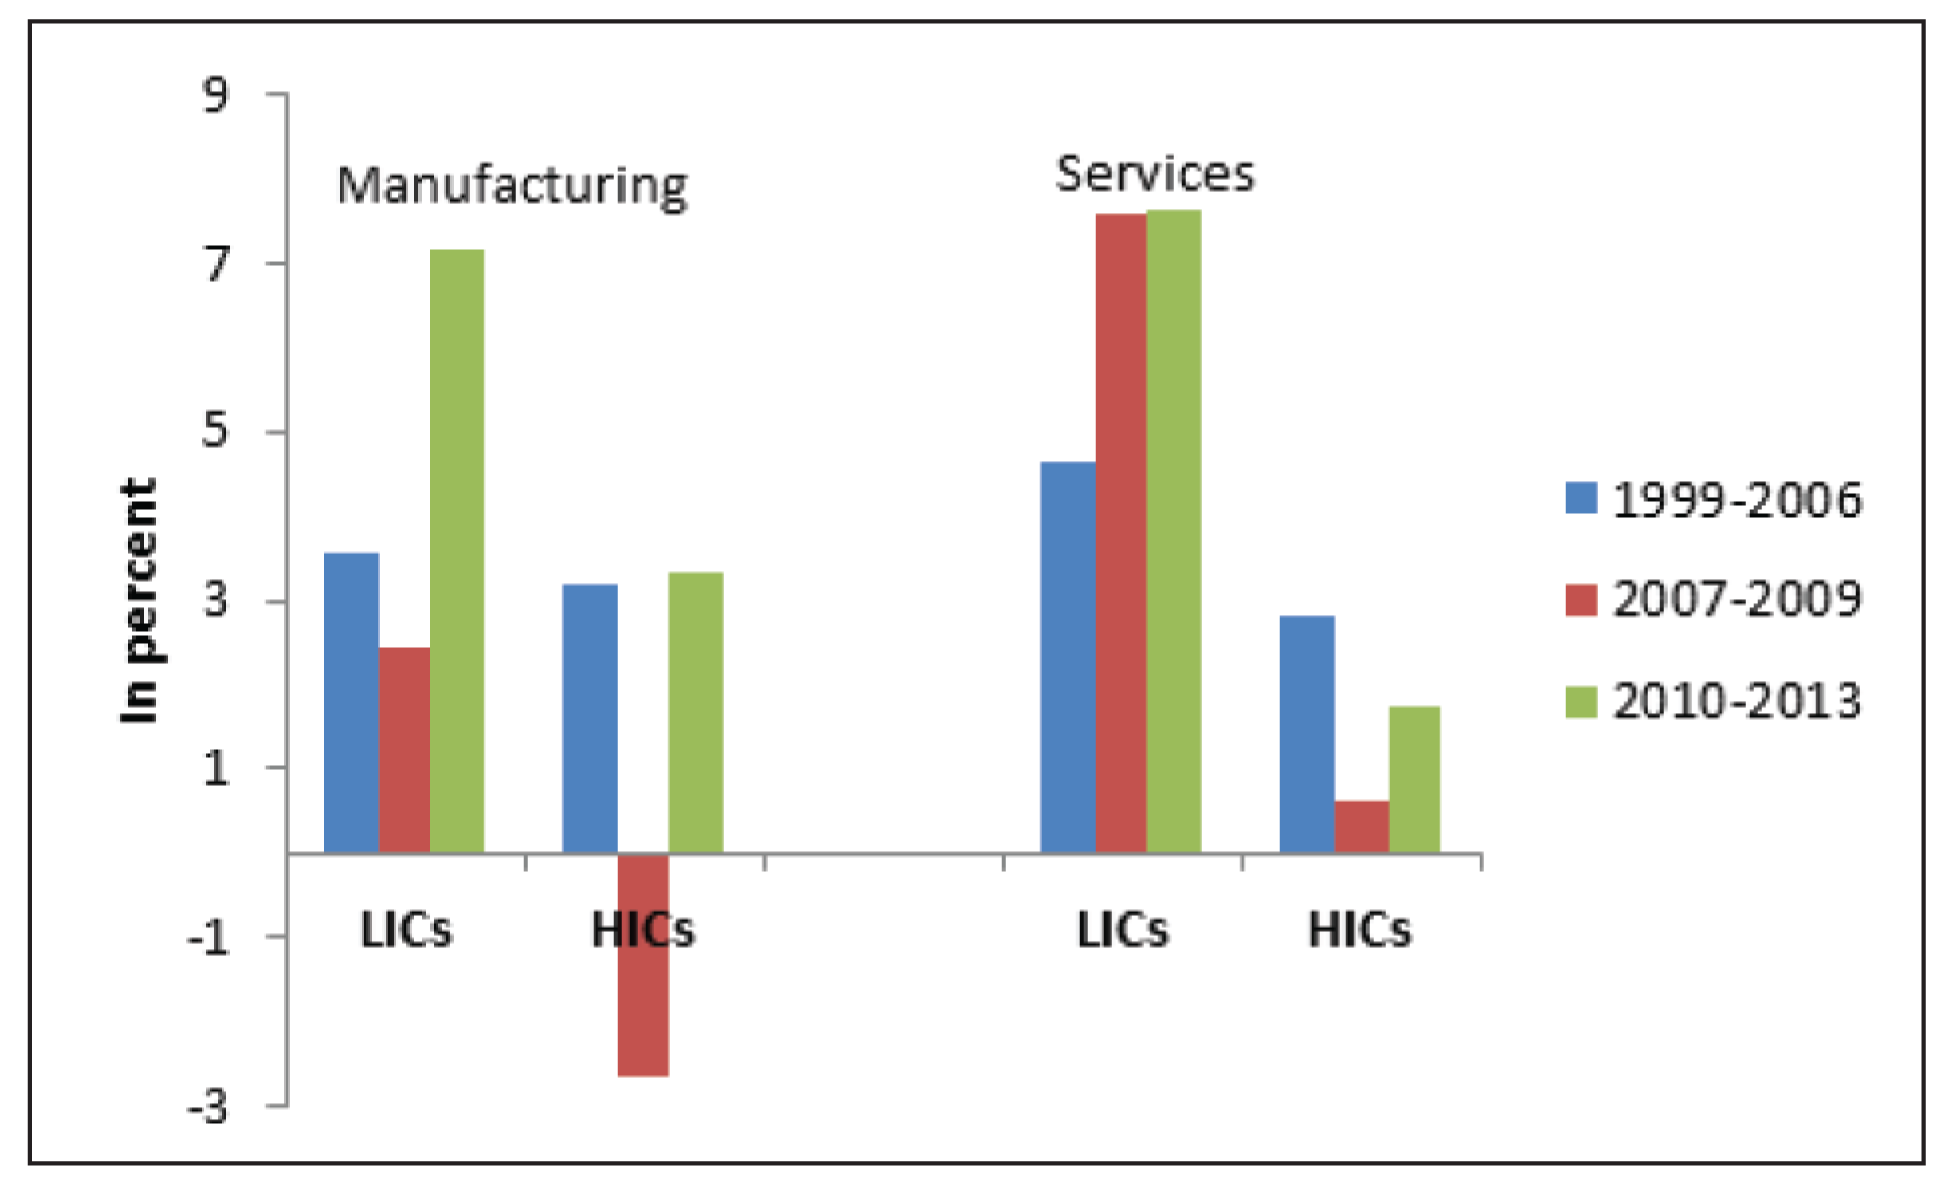
While services growth also slowed down in HICs during the period 2007–09, it remained positive at an average 0.61 per cent. In contrast, services grew even faster from 4.7 per cent in 1999–2006 to 7.6 per cent in 2007–13 in LICs. This is due to the deluge of capital flows that fled developed economies in favour of developing or emerging economies. Much, if not all, of these capital inflows (into developing countries) were channelled through the services sector as financial intermediation services and real estate and property development. Moreover, the services sector in developing economies owes its vibrancy to business process outsourcing and offshoring activities that became even more attractive in the face of the economic downturn in the developed world.
In terms of the relative sizes of the financial sector, Table 2 shows the great divide between HICs on the one side and LICs and MICs on the other. Domestic credit (as % of GDP) is, on average, around seven times larger in HICs than in LICs and more than twice as large as that in MICs. Private credit (as % of GDP) is, on average, about nine times bigger in HICs than that in LICs and more than twice as big as that in MICs. Bank credit (as % of GDP) is around eight times bigger in HICs than in LICs and almost twice as big as in MICs. Broad money (as % of GDP) in HICs is, on average, quadruple that in LICs.
Financial Development Indicators by Income Group (as % of GDP)

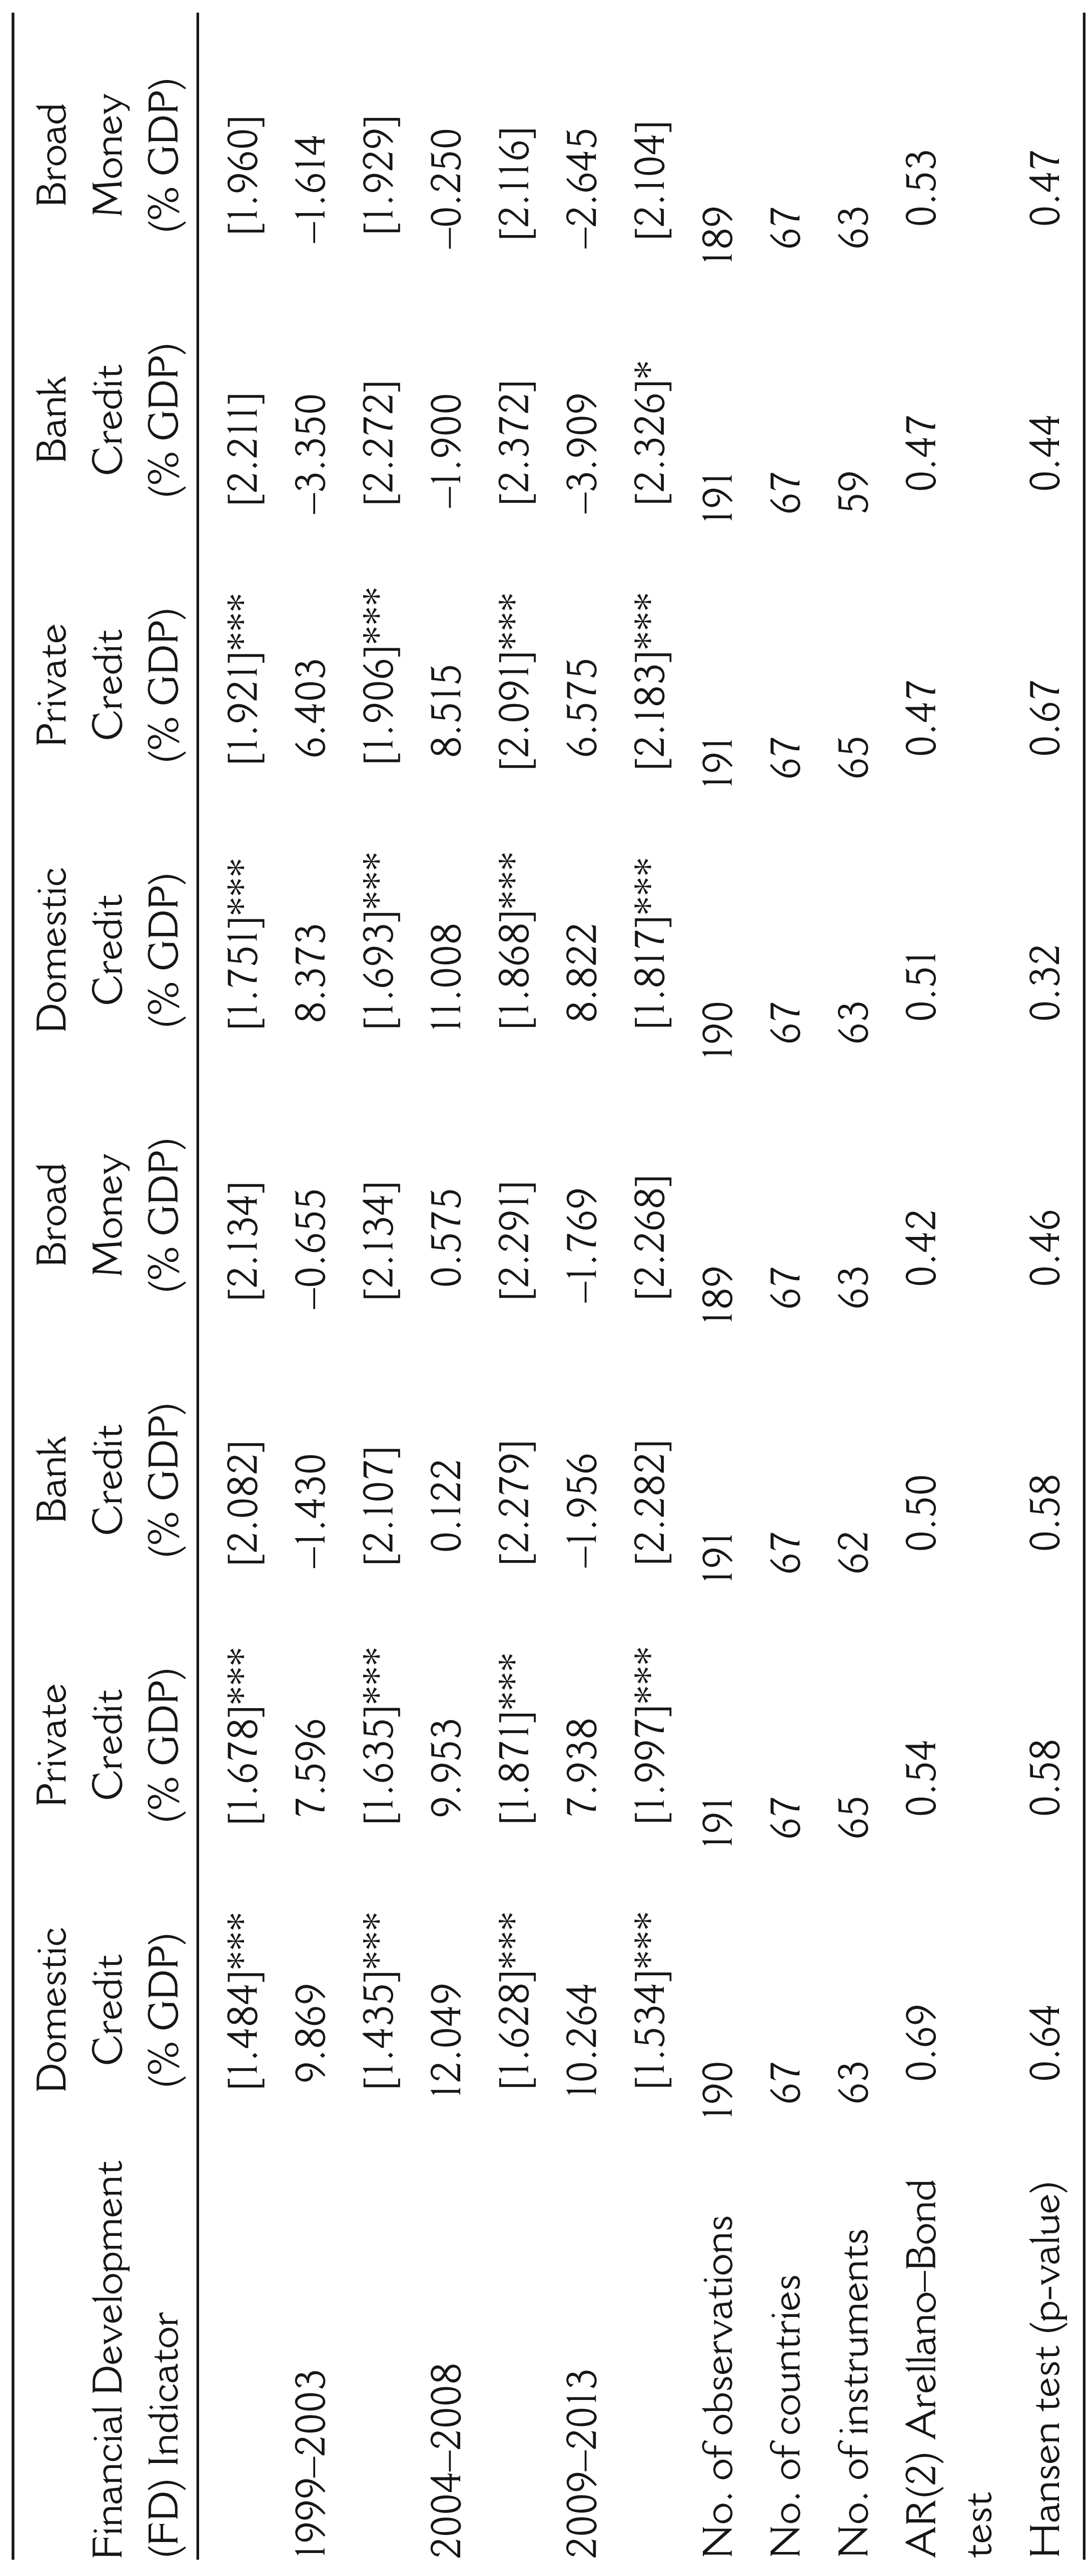
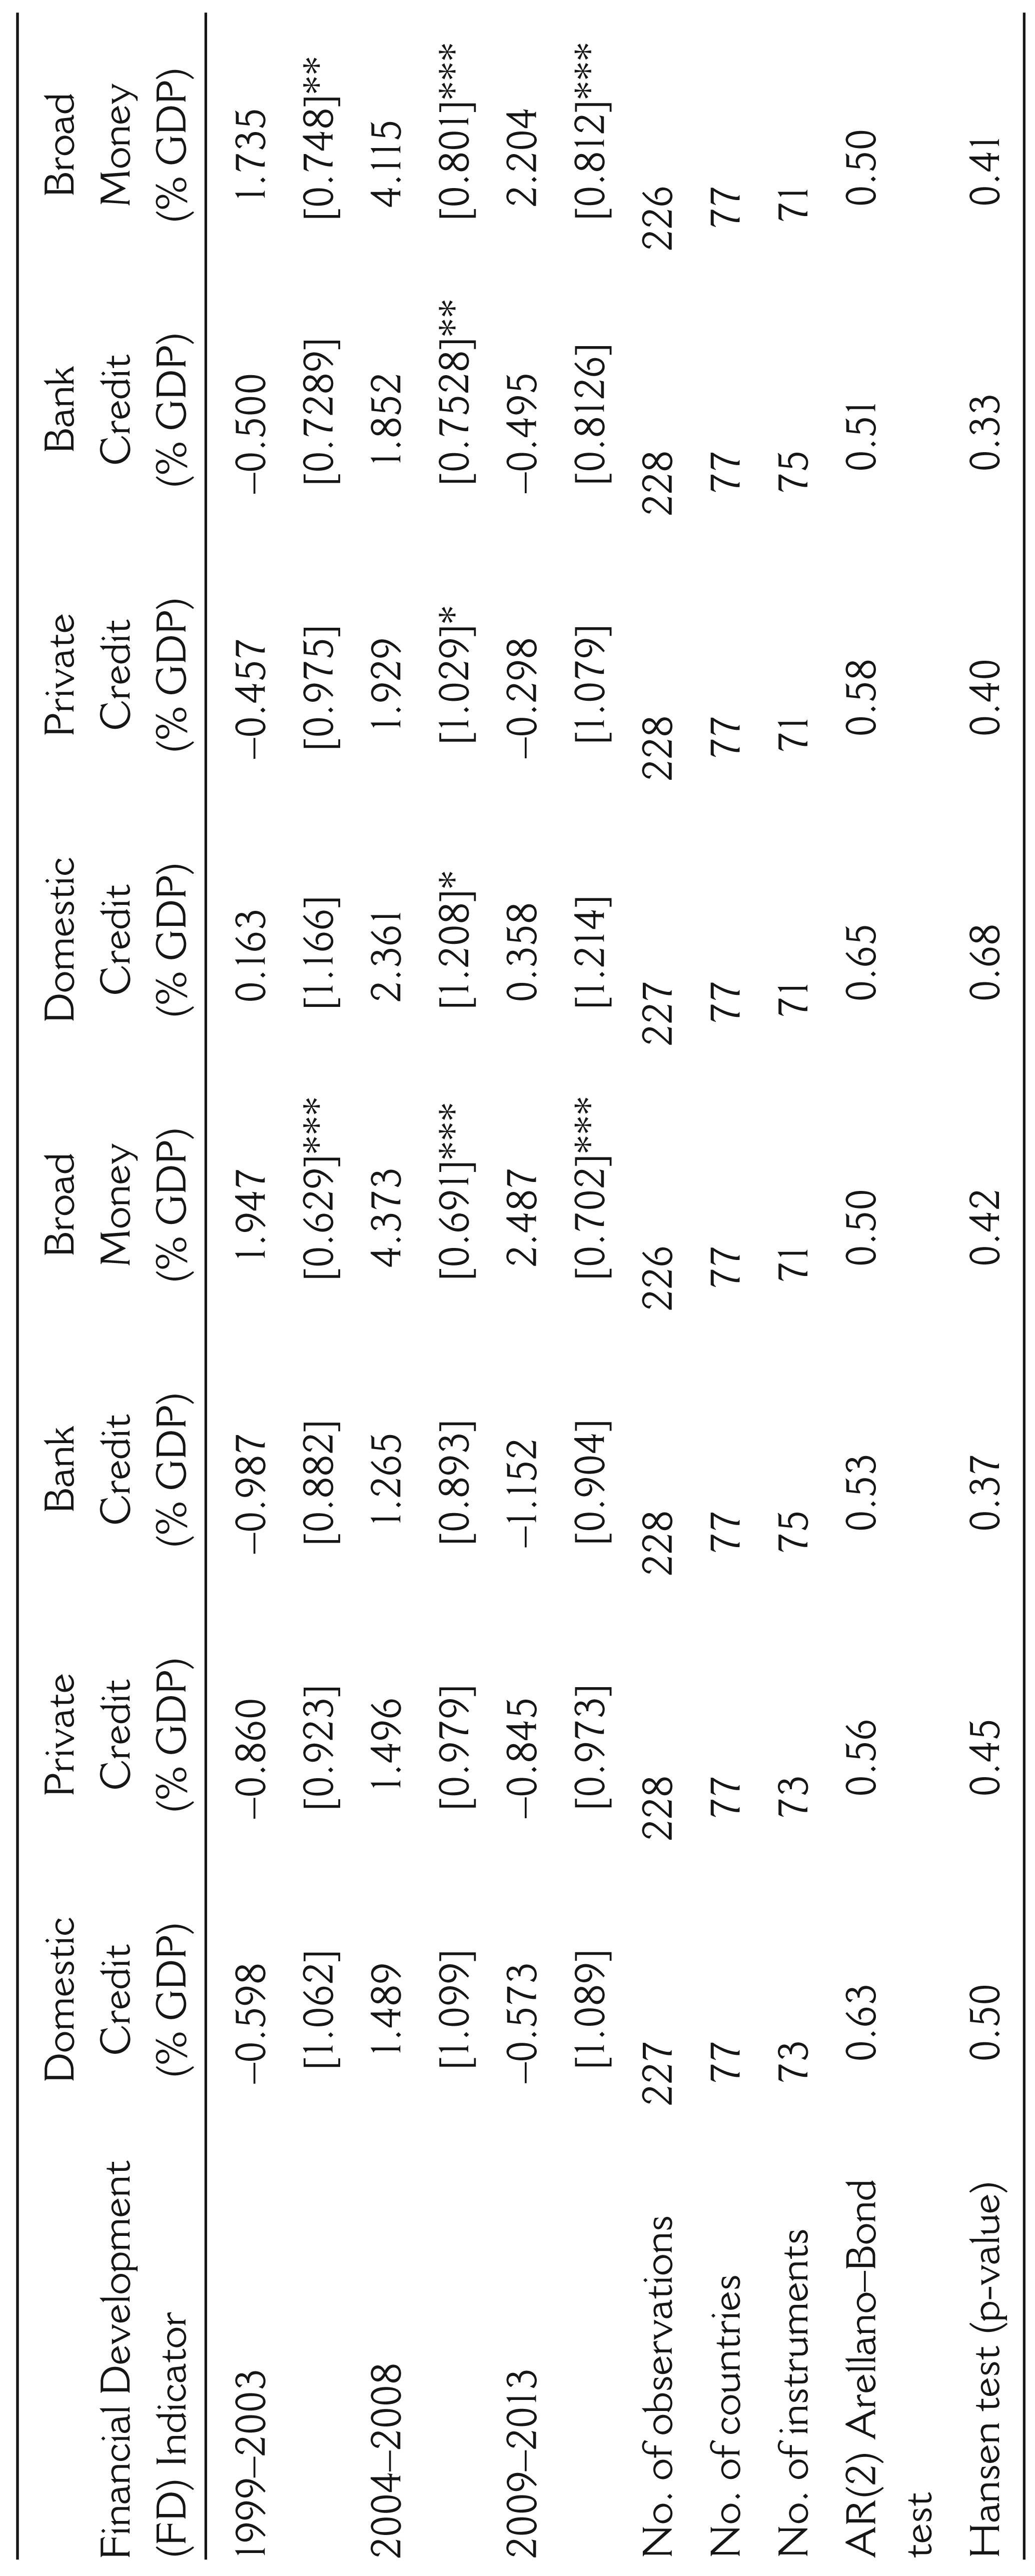
The estimated results in Tables 3 and 4 present evidence of a long-run negative effect of financial intermediation expansion on growth. Table 3 presents the estimation results for manufacturing growth, while Table 4 shows services growth.
Manufacturing Growth and Financial Development

Manufacturing Growth and Financial Development
Services Growth and Financial Development

Columns (1)–(4) in Table 3 show the baseline results. All measures of financial development (the linear terms) have robustly negative and significant coefficients, while the squared terms are robustly positive and significant, indicating that there is a minimum scale of financial development that has to be reached before financial expansion can have a positive impact on long-run manufacturing growth. This is in accordance with the Financial Development Report (2012), which finds that bank-based systems that are unhampered by regulatory constraints are able to take advantage of economies of scale in mitigating information asymmetries and enhancing industrial growth (p. 7). The following are the critical values of the financial intermediation variables (see Table 2) for financial intermediation expansion to have a positive effect on manufacturing growth:
Domestic credit (% of GDP) has to be at least 49.81 per cent of GDP, but the median is only at 35.33 per cent of GDP. Private credit (% of GDP) has to be at least 86.50 per cent, but the median is only at 21.37 per cent.of GDP. Bank credit (% of GDP) has to be at least 73.30 per cent, but the the median is only at 20.44 per cent of GDP. Broad money (% of GDP) has to be at least 128.50 per cent, but the the median is only at 33.53 per cent of GDP.
From Table 2, these threshold values are within the range of the mean values for MICs and HICs—except for domestic credit, which is within the LIC–MIC range. The median values of the financial indicators show that at least half of the financial systems of the countries in the sample are operating considerably well below the minimum efficient scale of financial intermediation. In fact, considering private credit, for instance, the 90th percentile value is 68.04 per cent, which is still below the critical value of 86.50 per cent, indicating at least 90 per cent of the countries in the sample are below the minimum efficient scale in terms of credit to the private sector. Similarly, for bank credit with 90th percentile value of 61.47%, at least 90% in the sample are below the critical value of 73.30 per cent. For broad money, the 95th percentile value is 92.97 per cent, which still falls considerably short of the threshold value of 128.50 per cent.
The total marginal effects of financial expansion on manufacturing growth (evaluated at the median levels) are as follows:
–0.02 for domestic credit (as % of GDP), indicating that a percentage-point increase in domestic credit results in a 0.02-percentage-point decline in manufacturing growth. This implies that a percentage increase in domestic credit (as % of GDP) results in a 0.16 per cent decline in manufacturing growth. This total marginal effect is significant at the 1 per cent level of significance; –0.04 for private credit (as % of GDP), indicating that a percentage-point increase in private credit results in a 0.04-percentage-point decline in manufacturing growth. This implies that a percentage increase in private credit (as % of GDP) results in a 0.20 per cent decline in manufacturing growth. This total marginal effect is significant at the 5 per cent level of significance; –0.05 for bank credit (as % of GDP), indicating that a percentage-point increase in bank credit results in a 0.05-percentage-point decline in manufacturing growth. This implies that a percentage increase in bank credit (as % of GDP) results in a 0.23 per cent decline in manufacturing growth. This total marginal effect is not significant even at the 10 per cent level of significance; and –0.08 for broad money (as % of GDP), indicating that a percentage-point increase in broad money results in a 0.08-percentage-point decline in manufacturing growth. This implies that a percentage increase in broad money (as % of GDP) results in a 0.61 per cent decline in manufacturing growth. This total marginal effect is significant at the 1 per cent level of significance.
Thus, the results indicate that for at least half of the countries in the sample, there is a long-run adverse effect of financial expansion on the manufacturing growth. This negative relationship may be explained by the following non-mutually exclusive channels:
Periods of upswings in liquidity and credit cycles are often reinforced by slacker lending practices and looser monetary regulation and supervision and the proliferation of financial innovations that aggravate information asymmetry problems and excessive risk-taking behaviour, especially on the end of lending institutions, resulting in excessive systemic risk, asset bubbles and in overall financial instability detrimental to growth Carbó-Valverde et al., 2011; Dell’Ariccia and Marquez, 2006; Rajan, 1994; Reinhart and Rogoff, 2009; Tornell and Westermann, 2002). In environments of easy credit and liquidity, lending to high-risk sectors and activities, such as real estate and property development, become even more likely. These sectors might even pose as competitors for funding of manufacturing firms. This danger was recognized even earlier by Tobin (1984: 14–15), who says, ‘We are throwing more and more of our resources, including the cream of our youth, into financial activities remote from the production of goods and services, into activities that generate high private rewards disproportionate to their social productivity. I suspect that the immense power of the computer is being harnessed to this “paper economy” not to do the same transactions more economically but to balloon the quantity and variety of financial exchanges. For this reason perhaps, high technology has so far yielded disappointing results in economy-wide productivity. I fear that, as Keynes saw even in his day, the advantages of the liquidity and negotiability of financial instruments come at the cost of facilitating nth-degree speculation which is short- sighted and inefficient’. Upsurges in credit and liquidity brought about by external financial inflows into the domestic economy often result in a real appreciation of the local currency, eroding the competitiveness of tradables that dominate the manufacturing sector: A classic ‘Dutch Disease’ story. In developing economies, where the overall quality of institutions—and thus, that of financial institutions—are less likely to be conducive to growth than in developed economies, these effects are likely to be more pronounced and more severe. This is in line with panel data studies that find a negative short-run relationship between bank sector development and growth, primarily due to financial repression, weak financial institutions and inefficiencies in credit allocation that predominantly favour public enterprises (Ayadi et al., 2013; Ben Naceur and Ghazaouani, 2007).
All the control variables have the expected effects. Fixed capital formation, which is purportedly the main driver of the more capital- intensive manufacturing growth, has a robustly positive and highly significant (at 1% level of signficance) effect on long-run manufacturing growth. Institutional quality (measured by ICRG) also has a positive and highly significant effect in testament to the new institutional economics battle cry, ‘Institutions matter!’ 12 Inflation has the expected negative and highly significant effect on manufacturing growth. In line with ‘development progeria’, services size has a negative impact on the tradables- dominated manufacturing sector. Tropical area also has the expected negative effect, although not significant, indicating that the availability of capital, the level of financial development and policy and institutional quality have more bearing on the manufacturing sector than geography, especially because more than half of these countries are already well within the tropical zone.
In terms of financial inflows, both FDI and remittances also have the expected signs. FDI has a robustly positive and highly significant coefficients, emphasizing the key role it plays in bolstering domestic productive activity. Remittances have a robustly negative and highly significant impact on manufacturing growth. In addition to being another buttress for the ‘Dutch Disease’ story (see, for instance, Acosta et al., 2009; Amuedo-Dorantes and Pozo, 2004; Bourdet and Falck, 2006; Daway-Ducanes, 2018; Hyder and Mahboob, 2005; Lartney et al., 2012; Petri and Saadi-Sedik, 2006; Rabbi, Chowdhurry and Hasan, 2013), the negative impact of remittances on long-run manufacturing growth might be due to the observation that the additional remittances are primarily used for smoothing consumption instead of financing growth-enhancing investment (see, for instance, Combes and Ebeke, 2011; Ducanes, 2015; Mohapatra, Joseph and Ratha, 2012; Pajaron, 2017; Yang, 2008).
To further corroborate the assertion that it is the lack of scale that hinders a positive effect of financial expansion on growth, we re-estimate the models, including interaction terms between the measures of financial development and remittances. Columns (5)–(8) in Table 3 report the results. Indeed, except for the equation with broad money, all the coefficients of the interaction terms in other equations are positive, indicating that an increase in the flow of remittances conditional on a more developed financial credit system can have a positive effect on manufacturing growth. One interpretation is that remittance-receiving countries are less financially-constrained than countries that do not receive remittances. To the extent that relatively underdeveloped countries, who also tend to have less developed financial systems and for numerous reasons, including the lack of an independent monetary policy, are constrained in the amount of domestic credit or fiscal spending they can implement, remittances help to alleviate financial constraints and serve to level the field in addressing the lack of financial development in relatively underdeveloped countries.
It is noteworthy, however, that the total marginal effects of financial expansion on manufacturing growth are still negative. To wit: –0.03 for domestic credit; –0.06 for private credit; –0.06 for bank credit and –0.04 for broad money. 13 This is not surprising given that the corresponding threshold values required for financial expansion to positively affect manufacturing growth are still substantially higher than the 90th percentile values. The threshold values are: 67.11 per cent for domestic credit; 95.90 per cent for private credit; 77.67 per cent for bank credit and 100.50 per cent for broad money. 14
Financial Development and Services Growth
As with manufacturing growth, all the measures of financial development (linear terms) are robustly negative and highly significant (at the 1% level of significance), while the squared terms are all positive and highly significant, again indicating the existence of scale economies that have to be attained before the economy can benefit from an expansion of the financial sector. The threshold values of the financial intermediation variables are (see columns (1)–(4) in Table 4):
125 per cent (of GDP) for domestic credit, which has a median of only 36.48 per cent of GDP; 82.5 per cent (of GDP) for private credit, which has a median of only 24.89 per cent of GDP; 79.5 per cent (of GDP) for bank credit, which has a median of only 24.40 per cent of GDP; and 164.5 per cent (of GDP) for broad money, which a median of only 38.73 per cent of GDP.
All the threshold values are within the range of mean values for MICs and HICs—apart from that for broad money, which is considerably greater than the mean value for HICs even in the period 2010–13. the corresponding median values of the financial indicators indicate that at least half of the financial systems of the countries in the sample are operating considerably well below the minimum efficient scale of financial development. Indeed, for domestic credit, the 90th percentile-value of 96.3 per cent is still below the critical value of 125 per cent. For private credit, the 90th percentile value is 82.7 per cent, which is barely above the critical value of 82.5 per cent. For bank credit, the 90th percentile value is 71.9 per cent, which is still below the critical value of 79.5 per cent. For broad money, the 90th percentile value is 116.1 per cent, while the 95th percentile value is 180.1 per cent, signifying that at least 95 per cent, but less than 99 per cent of the countries in the sample have financial intermediary sectors that are yet to attain their threhold size.
The total marginal effects of financial intermediation growth on services growth are:
–0.04 for domestic credit (as % of GDP), indicating that a percentage-point increase in domestic credit results in a 0.04-percentage-point decline in services growth. This implies that a percentage increase in domestic credit (as % of GDP) results in a 0.29 per cent decline in manufacturing growth. This total marginal effect is significant at the 1 per cent level of significance; –0.06 for private credit (as % of GDP), indicating that a percentage-point increase in private credit results in a 0.06-percentage-point decline in services growth. This implies that a percentage increase in private credit (as % of GDP) results in a 0.30 per cent decline in manufacturing growth. This total marginal effect is significant at the 1 per cent level of significance; –0.07 for bank credit (as % of GDP), indicating that a percentage-point increase in bank credit results in a 0.07-percentage-point decline in services growth. This implies that a percentage increase in bank credit (as % of GDP) results in a 0.34 per cent decline in manufacturing growth. This total marginal effect is significant at the 1 per cent level of significance; and –0.05 for broad money (as % of GDP), indicating that a percentage-point increase in broad money results in a 0.05-percentage-point decline in services growth. This implies that a percentage increase in broad money (as % of GDP) results in a 0.38 per cent decline in manufacturing growth. This total marginal effect is significant at the 1 per cent level of significance
The preceding values indicate that financial expansion also has a long-run negative impact on services growth, for at least half of the economies in the sample. This may be explained as follows: While in the short-run, excess credit and liquidty often find their way into financial innovations and real estate and property development (Shiopou and Siegfried, 2006), which invigorate the services sector and further result in an expenditure boom, the effects of this expenditure boom on output and employment are often only transitory. The events that unfolded in the Asian financial crisis of 1997 and the more recent global financial crisis attest to these effects. For one, sustaining a consumption boom in small open economies depends on a continuous influx of short-term capital. As these inflows are highly vulnerable to speculative attacks, sudden reversals are not few and far between. For another, residential construction booms, on the average, last from but a few months to a few years. Also, a rapid expansion of the real estate sector and the attendant relaxation of credit standards, supervision and regulation render the economy vulnerable to an asset price bubble—and the inimical effects of a ruptured bubble can potentially last longer than the beneficial effects of the preceding boom.
Fixed capital formation (as % of GDP) and ICRG are still robustly positive and significant. 15 Tropical area is now robustly negative and significant. This might be explained by the fact that the services sector in developing countries are now largely dominated by foreign- owned business process outsourcing and offshoring (Soubbotina and Sheram, 2000) firms, whose decisions to locate outside their home economies would most likely be affected by the climate conditions of the target locale. In terms of external financial inflows, the co- efficients of FDI are still robustly positive and significant, again, revealing the importance of these long-term sources of external funding. The coefficients of remittances are not robustly negative and significant, as in the estimates for manufacturing growth. Indeed, remittances may even have a positive and significant effect on services growth (as in columns (1) and (7)). This is reasonable in light of the fact that remittances often finance consumption durables and residential fixed investments that are complementary to the services sector (see, for instance, Buckley and Mathema, 2007; Mottaleb, Sene and Mishra, 2016).
Again, to further verify that the negative effect of financial expansion on services growth is primarily due to a lack of financial scale, we re-estimate the equations including interaction terms between remittances and the financial development indicators. While the total marginal effects of financial expansion on services growth are still negative, the magnitudes are smaller than that in the previous estimates: –0.04 for domestic credit; –0.03 for private credit; –0.04 for bank credit; and –0.05 for broad money.
Scale Matters
The negative effect of financial expansion on both manufacturing and services growth in developing economies can be explained by the presence of large and lumpy investments (such as production plants and heavy equipment) in productive sectors. The received wisdom is that financial credit and liquidity expansion implies more financial resources that can be used to finance more productive, growth-enhancing investments. This is not so with large and lumpy investments: A marginal increase in credit and liquidity may not be enough to finance a new investment project. Moreover, in developing economies, where there is an adverse combination of a lack of productive opportunities for investment and a proliferation of challenges in financing of lumpy investments in the form of institutional challenges—particularly, burdensome bureaucratic red tape and highly politicized and protracted contract-awarding and procurement processes, financial expansion is given a lack of sufficient financial scale is likely to flow towards less productive, even more speculative sectors (e.g., financial services and real estate) that might stunt and even adversely affect long-run manufacturing and services growth. Lumpy investments are also even more pronounced in the manufacturing sector than in the services sector, where capital-labour intensities are higher on average in the former than in the latter (Nilsen et al., 2009).
Moreover, there is also the issue of financial allocation efficiency where state-owned enterprises are involved (Harris, 2003). There is the concern that state-owned financial institutions might be diverting financial credit (especially domestic credit) and liquidity from the more dynamic private sector to the usually less- productive state-owned firms (Aizenmann, 2015), thereby exacerbating moral hazard problems and affecting adversely the long-run growth prospects of more productive firms in the manufacturing and services sectors.
Manufacturing versus Services Growth
In terms of the direction of impact, the regression results show no difference between the impacts of financial development on manufacturing and services growth: A lack of financial scale disables further financial expansion from having positive effects on both manufacturing and services growth. We also verify the same results when we lump together manufacturing and services growth, as a proxy for non-agricultural value added growth rate (see Table A4 in the Appendix).
In terms of the size of the effect, however, the adverse marginal effects of financial credit expansion (in terms of domestic, private and bank credit) are larger on services growth (ranging from –0.38% to –0.34% given a percentage increase in the financial scale/development indicator) than on manufacturing growth (ranging from –0.23% to –0.16% for a percentage increase in the financial development indicator). This corroborates the earlier assertion that financial expansion might adversely affect the services sector more due to the presence of a large informal services sector in developing economies and the inclusion of potentially destabilizing services sectors, such as financial intermediation and real estate services.
Conclusion
This article’s main contribution lies in its examination of whether the size of the financial sector matters and if it does, whether the credit and liquidity expansion benefit both manufacturing and services growth in 77 economies with per capita GNIs of not more than $10,000 over periods of five-year averages from 1984 to 2013, taking into consideration the existence of non-linearities in the financial development-growth nexus. We employ four common, alternative indicators of financial development: domestic credit, private credit, bank credit and broad money—all measured as percentages of GDP. The two-step GMM estimates indeed reveal non-linearities in the nexus: there exist minimum economies of scale that the financial sector has to attain before financial expansion can have a positive long-run effect on growth. These threshold values are within the range for that of middle- and high-income economies, suggesting that the positive financial development-growth nexus is a result more specific to higher-middle-income and high-income economies. Indeed, in our sample of low- and lower-middle-income economies, financial intermediation has robustly a negative long-run effect on both manufacturing and services growth for at least half of the sample.
This lack of scale economies may be explained by prevailing institutional weaknesses and market failures in lower-income economies that prevent financial systems from attaining such financial scale economies, which, in turn, is a key to expanding economic opportunities via the financial sector (Sutton and Jenkins, 2007). Financial scale enables financial institutions to benefit from the pooling of scarce and diverse assets and resources and the diversification of risk from these pooled resources. Moreover, larger financial institutions are also better able to engage in costly activities that would minimize the adverse effects of both adverse selection and moral hazard, such as borrower information-gathering, screening and monitoring.
In this regard, Gochoco-Bautista et al. (2014) emphasize the importance of domestic financial sector development in reducing the investment sensitivity to cash flows of firms and reducing external financial constraints, especially for small firms. These, in turn, have implications for more inclusive and stable growth.
Indeed, in this further connection, we find that for remittance-receiving countries, financial development, which is typically low by conventional measures, is apparently not as financially underdeveloped as it would seem using conventional measures, since remittances may alleviate financing constraints. The exact channel may be through the supply side, where remittances enter the formal financial sector and are lent out to firms in manufacturing and services, and/or through the demand side, as remittances received by households boost consumption demand for goods produced by both sectors. In either case, remittances appear to positively affect the effect of financial development on both manufacturing and services growth.
Accordingly, fostering an institutional and policy environment and developing infrastructure and technology (i.e., physical and human capital and information and communications technology) that attract greater foreign capital inflows, particularly foreign direct investments, are crucial in achieving financial sector scale economies. Indeed, Hausman, Rodrik and Velasco (2005) and Gourinchas and Jeanne (2004) attribute the observed lack of gains from financial integration in emerging economies to dismal lack of capital inflows from more developed economies mainly due to political and legal obstacles that result in a lack of proper delineation and enforcement of property rights and of appropriability of returns to investment, and also infrastructure deficiencies that unnecessarily raise transaction costs and reduce venture profitability.
Our measures, however, only account for the size of the financial sector. Measures of financial sector efficiency, financial access and financial conditions, such as are used in Gochoco-Bautista et al. (2014) may provide further insights into the link between financial development and growth in lower-income economies.
Declaration of conflicting interests
The authors declared no potential conflicts of interest with respect to the research, authorship and/or publication of this article.
Funding
The authors received no financial support for the research, authorship and/or publication of this article.
Footnotes
Acknowledgements
The authors would like to thank Thorsten Beck and the participants of the 2016 International Conference on Financial Development and Economic Stability held in Durham University for their useful comments and suggestions. Any remaining errors are those of the authors.
Appendix
SGMM Estimates for Manufacturing and Services Growth and Financial Development

| Financial Scale (FS) Indicator |
||||
| Domestic Credit (% GDP) | Private Credit (% GDP) | Bank Credit (% GDP) | Broad Money (% GDP) | |
| Manufacturing & services growth (–1) | 0.12 | 0.11 | 0.14 | 0.12 |
| [0.04]*** | [0.03]*** | [0.03]*** | [0.03]*** | |
| FS indicator | –0.08 | –0.17 | –0.17 | –0.05 |
| [0.01]*** | [0.03]*** | [0.04]*** | [0.01]*** | |
| FS indicator-squared | 0.0004 | 0.001 | 0.001 | [0.0002 |
| [0.00]*** | [0.00]*** | [0.00]*** | [0.00]*** | |
| FDI net inflows (% GDP) | 0.05 | 0.05 | 0.05 | 0.06 |
| [0.03]* | [0.03]* | [0.02]** | [0.02]*** | |
| Remittances (% GDP) | 0.001 | 0.03 | 0.01 | –0.04 |
| [0.04] | [0.02] | [0.02] | [0.01]** | |
| ICRG | 0.01 | 0.03 | 0.04 | 0.03 |
| [0.02] | [0.01]* | [0.02]* | [0.01]* | |
| Fixed K formation (% GDP) | 0.13 | 0.12 | 0.07 | 0.07 |
| [0.03]*** | [0.03]*** | [0.03]** | [0.02]*** | |
| Inflation differential | 0.01 | 0.01 | 0.003 | 0.01 |
| [0.03] | [0.02] | [0.03] | [0.01] | |
| Services size (% GDP) | 0.03 | 0.03 | 0.03 | –0.006 |
| [0.017]* | [0.02]* | [0.02]** | [[0.01] | |
| Tropical area | 0.32 | 0.45 | 0.21 | –0.03 |
| [0.29] | [0.26]* | [0.28] | [0.18] | |
| Period dummies | Yes | Yes | Yes | Yes |
| Number of observations | 148 | 149 | 149 | 147 |
| Number of countries | 55 | 55 | 55 | 55 |
| Number of instruments | 49 | 52 | 54 | 54 |
| AR(2) Arellano–Bond test (p-value) | 0.15 | 0.16 | 0.18 | 0.17 |
| Hansen test (p-value) | 0.46 | 0.42 | 0.61 | 0.48 |