




Abstract
Despite their potential for yielding an understanding of the conceptualisation being developed, diagrams remain one of the least utilised tools in the analytical process. They have been used by interpretive investigators at various stages of the research process, for example, as artefacts to stimulate discussion in interviews, assisting the researcher in formulating ideas, refining conceptualisations in the process of theory building and communicating ideas to others. This article has two main objectives: first, to begin to explore some of the intricacies associated with the use of diagrams in grounded theory, and second, to use case study material from two separate projects, which adopted individual approaches to grounded theory, to investigate young peoples’ attitudes towards physical activity; it outlines the ways in which diagrams and drawings were used differently by researchers at various stages to support the research process and ongoing analysis of data.
Introduction
There are a number of ways of supporting the process of research at various stages, which can take forms other than written or typed text. Such forms of alternative representation can be used to gain insights into the setting and its participants. These insights can be represented visually or textually at different points in a project through to the final manuscript. Thus, diagrams, pictures, images, photographs, conceptual maps, matrices, tables and charts not only serve as visual representations of what is being discovered through analysis but also as generative/analytical techniques and communicative tools. Pederson (2008) explains how pictures assist in describing abstract and complex feelings, opinions, experiences, concerns, attitudes and worries into tangible objects. Diagrams and images can present insights that are increasingly independent from discursive relations because the image has the ability to create alternate ways of understanding social relations. In comparison with linguistic systems, it could be argued that they have a broader and more open content than a single word or sentence (Kjørup, 1991). However, various types of diagrams and images can be used in different ways and have subtle potentialities at different phases of the research. More complex diagrams at the later stages of the research may very well stand alone as an explanation of intricate phenomena, while earlier, more simplistic diagrams might act to augment and clarify analysis and text. Diagrams, therefore, serve several purposes, for example, to act as a direct and indirect means of analysis, representation and catalyst for discussion. Davison (2006) argues that images are optic devices, like a telescope, which are used to investigate the subject, not just re-present it. Importantly, as part of this collaborative venture between the researcher and liminal world of those being researched, diagrams can be used to ‘flush out’ cultural and social contextual issues. Diagrams thus serve a multiplicity of roles, not just an explanatory role.
Diagrams can act as an effective instrument of thought and a valuable tool in conveying thoughts to others. As such, they may be usefully employed to act as representations of a research domain and provide for stimulus materials in interviews (Crilly et al., 2006). Diagrams can thus be an extremely powerful tool in that they can have relevance at all stages of the research process. This includes providing an alternative form of communication for interviewees, acting as a source of data in themselves, clarifying the process of research for both investigator and reader, acting as a stimulus in field work and interviews, exploring the relationships between emerging concepts and categories and acting as a tool for representation of theoretical complexity.
Diagramming as a form of graphic representation in qualitative research
Graphic representation in research is distinguished in terms of structural composition. For instance, Banks (2001) identifies a spectrum at the ends of which there is the ‘linear flow of language’ (verbal) and the open-endedness of a photograph (visual) (p. 24). Logically, graphic representations occupy a space between these two ends of the continuum. In this way, drawings – composed primarily of visual signs and symbols – are closest to the open-ended dimension of the continuum, while tables and lists are nearer to the linear (verbal) end of the spectrum. In comparison, diagrams, albeit holding textual elements in the form of labels, are more fluid and less predictable structures than tables and lists (Banks, 2001: 24), but more structured than drawings.
Many qualitative research texts advocate the use of visual representations in the data analysis process (e.g. Dey, 1993; Miles and Huberman, 1994; Ryan and Barnard, 2003). In this capacity, diagrams are often regarded as a useful tool for generating, exploring and recording ideas. Diagrams can be particularly effective in a range of circumstances. Hart (1999), for example, explains that in health-care settings, when working with people with learning disabilities, understanding can be enhanced using diagrams and symbols. They also provide a powerful tool when working with other respondents where understanding of text is problematic, such as very young children. Goulding (1999) has argued that diagramming is necessary to create meaningful picture of the masses of data collected in a qualitative project to make it immediately accessible to the reader. Cousin (2009) explains that visual research also works well with those who prefer graphic to text-based material, including those with less confidence with literacy or language skills. In addition, she argues that images associate with an emotional dimension that text-based research does not reach. To develop this, she cites Harper’s (2002) view that as a species, we began with pictures and progressed to the word; therefore, images can evoke deeper elements of human consciousness. Furthermore, diagrams are unlike text in that they cannot be read, but they are also unlike images because they do not normally correspond to our sense of perceptions of any physical object (Ittleson, 1996). Thus, rather than imitating the appearance of things, ‘diagrams are most suitable for visualisations of conceptual knowledge … modelling reality as we understand it’ (Kazmierczak, 2001: 177). A potential advantage is that ‘visual representation often clarifies the author’s thinking and increases the reader’s comprehension’ (Whetten, 1989: 491). Furthermore, Orna (1997) suggests that ‘if the researcher is unable to graphically depict “what all is going on here” he or she is probably not genuinely clear of the process yet’ (p. 181).
While diagrammatical representation can offer researchers invaluable resources for conceptualising and representing complex data, the authors of this article acknowledge that diagrams should not be thought of as neutral with regard to mechanisms of hierarchy and power. We are aware that diagrams should be regarded as closely implicated in processes of discipline and control. They fall within the class of phenomena that Foucault describes as technologies of representation: sign systems that impose power structures upon knowledge and experience by encoding relations (Sheridan, 1980). Within the context of grounded theory, Clarke’s (2005) recent work on reinterpreting situational analysis encourages a reflexive approach in her intent to develop a grounded theory that preserves empirical realities without resorting to reductionist analyses, or wholly relying on the basic social process (BSP) model that Glaser (1978) has long argued is central to grounded theory. In addition, Clarke emphasises that maps provide one way of positively using the existing knowledge, which researchers bring to social situations. However, she also suggests that researchers complicate their stories rather than oversimplifying reports which seek to identify a BSP. Complexities inherent in social situations are represented through a process of mapping to help us see the potential range of positions. Such a strategy can, through the use of diagrams and text, make transparent elements of the research process and reduce the potential biases associated with post-modern criticisms of data analysis and reductionism. Drawing is a central activity in design that facilitates the exploration of possible solutions to a problem by providing a medium for visual and spatial thinking (Dorst, 2003: 118). Thus, those involved in the process of designing a drawing or diagram could be considered to be engaged in ‘conversation’ with the drawing (Schön, 1991: 78). Importantly, therefore, diagrams add a new dimension to representing the research process, and can help researchers to be more reflexive as they encourage careful thought about what is going on and make the process more transparent, reducing the potential for being reductionist. One way of providing a check is to share diagrams with other researchers to triangulate interpretations of the data, and the very act of representing text in an alternative way provides for an internal check on personal understanding. Diagrams form part of that analysis which can be used to augment text to provide new insights into portions of the analysis. They are very versatile and can be used in many ways. Diagrams, either individually or in juxtaposition with other forms of visual representation and/or text, can more accurately reflect the complexity of the situation. Furthermore, they have the potential to create smooth transitions between elements of the developing story. In this way, ‘visual data encourage the construction of narratives that segue easily from one level to another’ (Grady, 2008).
Several computer-assisted qualitative data analysis software (CAQDAS) support theorising by offering the capacity to map out ideas in diagrams or conceptual networks (e.g. ATLAS.ti, NVivo). Many programs now have tools that enable a researcher to produce charts, diagrams or networks and link the object in them to things like quotations, codes, documents and memos in the project. The use of CAQDAS as a tool for such analysis is contested and beyond the scope of this article. However, such programs are increasingly used to support the analysis of data in grounded theory studies. They can help facilitate the process of axial coding as both source and derived data documents, together with memos and diagrams, which can be viewed concurrently and compared. Radnofsky (1996) has argued that software packages offering visual displays of semantic nets, concept diagrams and graphs do not necessarily draw upon the reader’s deep reflection on the data, or on the researcher’s interpretation and criticism of them. The researchers in both case studies found that diagramming as a reflective activity in the early stages of theory generation was more emancipating than using CAQDAS and that drawing diagrams by hand on paper and whiteboards was a useful strategy, which could be discussed readily with colleagues. In addition, such packages have been accused of developing a mechanistic approach to the analysis and presentation of data (David and Sutton, 2004). The authors of this article would agree that while computer software might have a useful role in assisting the researcher to make sense of large amounts of text, the full potential of diagramming lies in supporting the researcher’s and audience’s understanding of theoretical complexity, which is typically associated with studies using grounded theory at all stages of the process. Using drawings and diagrams or relying on theory-building CAQDAS software will likely have an impact on how the research develops; however, how well the investigator follows the chosen research methodology and applies the selected research methods will have a greater impact than whether CAQDAS is used or not.
Diagramming in the process of grounded theory
Diagramming has been an integral part of grounded theory since its emergence. Indeed, at certain points during grounded theory’s intriguing history, it was something that was expected, as Wilson and Hutchinson (1996) describe a period when the ‘methods police’ serving as reviewers for articles demanded that any grounded theory published must include a visual diagram locating the categories and their relationships. However, the place of diagrammatical representation within the process of grounded theory has become less clear as the method has evolved. While it has been claimed that grounded theory is the most widely used qualitative method in social science research (Locke, 2001), the range of interpretations has resulted in a lack of clarity and arguably a consequent lack of confidence within the grounded theory community.
Diagrams unlike other visual artefacts may depict physical as well as conceptual subject matter, adopting various degrees of graphic abstraction. This affords an overview of the topic that is unavailable by other means. In addition, diagrams enhance the conceptualisation process by encouraging the researcher to see theoretical codes related to properties, conditions, strategies and consequences (Glaser, 1978). Constructing diagrams helps to show the ways in which categories relate to each other and the relationship with theoretical codes. During the process of research, the use of diagrams can help the researcher make sense of relationships that may not have been previously explicit. In this way, they become an active part of the theory generation and not only support developing conceptualisation but also actively encourage clarity of thought. Allatt and Dixon (2004) argue that researcher attention to the potential of visual data helps the researcher to ‘see’ what he or she may not have noticed, and support a thick description.
The use of diagrams has been recommended by both the original authors of grounded theory: Strauss and Corbin (1990) support their use throughout the research process. They suggest that memos and diagrams help the analyst gain analytical distance from materials and help them move from working with data to conceptualising. Furthermore, they argue that these two procedures are crucial to the process of grounded theorising (Strauss and Corbin, 1998). However, Glaser (1998) has warned against the excessive use of creating and following diagrams and rules for proper memoing. Buckley (1997) developed many elements associated with a Glaserian approach, although he used diagrams extensively throughout the research. However, in order to align with the tenets of this Classic Grounded Theory (Hernandez, 2008) approach, it is important to ensure that diagrams emerge from the data to avoid what Glaser has called forcing. Glaser accepts epistemological diversity inherent in many methodologies (Glaser, 2003) and points out that much of the debate regarding the epistemology of different methodologies relates to the perceived accuracy of the data. As grounded theory aims for conceptualisation, not description, accuracy, in this sense, becomes an irrelevant issue. Glaser emphasises the flexible nature of grounded theory and appears open to developments as long as they remain true to leaving aside preconceived concepts and theories in order to trust in emergence (Glaser, 1978, 1998). For example, despite his concerns regarding the use of CAQDAS, Glaser (2003) does acknowledge that computers are now an accepted part of everyday life and that increasing numbers of researchers expect to be able to use them to support their work, in more ways than just word processing. In response to the concern of preventing computers from eroding and remodelling grounded theory to general qualitative data analysis, he states, the resolution … is logically in the hands of youth who are unbelievably computer fluent, who are not formed in competing QDA methods and who do GT as I have laid it out, often enough to experience its procedures sufficiently to weave them into computer software with minimal to no eroding. (Glaser, 2003: 43)
There are many examples of exponents of the Glaserian approach who have used diagrams (e.g. Fernández, 2003; Scott, 2007 and Wood, 2009). Charmaz (2006) explains that all qualitative researchers use strategies such as diagramming; however, grounded theorists use this strategy in service of the theoretical (her emphasis) development of their analysis. For Glaser (1998), diagrams and images might form part of the developing theory as he emphasised that ‘all is data’ and therefore that ‘whatever [type of data] may come the researcher’s way in his substantive area of research is data for Grounded Theory’ (p. 8). Diagrams used to support the generation of theory would not use existing models; however, diagrams to clarify methodological approaches might borrow ideas from models already in existence. Morse (1994) emphasises that within grounded theory, ‘Diagramming is used to enhance understanding and identifying the basic social process (BSP) that accounts for most of the variation in the data’ (p. 39). Furthermore, it is often considered central to the coding processes. Initially in the coding process, logic diagrams such as flowcharts are used.
Within certain approaches to qualitative research, such as grounded theory, diagrams can arguably form an integral aspect in the process of both data analysis and the formulation of theory. In a post-positivist era, diagrams promote credibility through triangulation as they increase sources and methods used in collection and analysis. However, it should be noted that while diagrams constructed by the analyst can be used to augment/facilitate the analysis of the data, they will be influenced by the researcher’s epistemological position and interpretation of grounded theory. In this way, it is recommended that the process of member-checking could also be related to diagrammatical representation of emergent theories in order to minimise bias. Therefore, at various stages, the researcher is encouraged to share and discuss diagrams constructed by the researcher to represent either the developing storyline or greater familiarisation of the research process to ensure, as far as possible, a shared interpretation with interviewees, supervisors, other research professionals and/or co-researchers.
Many studies that claim to use grounded theory have incorporated the use of diagrams, and some use such devices to explicate the storyline (e.g. Coyne and Cowley, 2006; Madill et al., 2000; Giacobbi et al., 2003; Mehmetoglu and Altinay, 2006). However, a recurring theme is that while many make mention of them in the text, they are not often explicitly identified within the final manuscript. In this way, a key potential offered by diagrams in grounded theory, that is, their power to communicate complex theories, is not exploited. There are relatively few examples of grounded theory studies in the disciplines associated with sport and physical activity, although some of these make the use of diagrams explicit (e.g. Holt and Dunn, 2004; Jevon and Johnston, 2003).
Strauss and Corbin (1994) identify different types of diagrams that can be used at various stages of the research process. Strauss (1987) suggests that the strategy of diagramming encourages theory building and a clearer understanding of data. Diagrams, according to Strauss and Corbin (1990), can take the form of logic diagrams, which show the logical sorting of relationships between categories and their subcategories, and integrative diagrams, which are used to try and show conceptual linkages. Clarke (2005), for example, views axial coding as elaborating a category and uses diagramming to integrate relevant categories. For her, an integrative diagram aims to link categories with categories to form a substantive theory of action. In grounded theory, when undertaking higher level analysis, researchers are encouraged to use both the conditional/consequential matrix and integrative diagramming, illustrating the complex interplay between the different levels of conditions (Strauss, 1987; Strauss and Corbin, 1990, 1998). However, there is limited guidance on how using these diagrams in data collection scenarios might enhance researchers’ analysis and theorising activities. Even within ‘Straussian’ grounded theory, which fully supports both the production of diagrams and the discussion of theories with interviewees (Strauss and Corbin, 1998), there is a small mention on how these two activities might be connected. Diagrams are considered to be one of the private analytic tools of the researcher and ‘are rarely seen by anyone but the analyst’ (Strauss and Corbin, 1998: 218). While this approach acknowledges that diagrams are effective instruments of thought, it fails to exploit their potential for eliciting responses that can improve the accuracy, comprehensiveness and parsimony of the diagram used in theory-building activities.
Case study examples of using diagrams to support grounded theory analyses
Children’s sport, physical activity and physical education have become areas of great interest to researchers due in part to concerns relating to increasing levels of obesity and sedentary behaviour (Waring et al., 2007). There are, however, few studies in these areas that have employed grounded theory. Using case study material from two separate projects relating to children’s attitudes towards physical activity, the remainder of this article highlights some of the issues associated with using diagrams at different stages of the process within particular versions of the method. There are arguably epistemological and methodological differences between the original authors of grounded theory (Morse et al., 2009). The disputes between the original authors of the method have been well documented and rehearsed (e.g. Buckley and Waring, 2009; Greckhamer and Koro-Ljungberg, 2005; Melia, 1996; Mills et al., 2006; Piantanida et al., 2004). The authors of this article argue that while there may be various approaches and interpretations of grounded theory, diagrams can go some way into transcending potential epistemological boundaries associated with the various interpretations. The reflexivity encouraged by the use of diagrams increases awareness of the relativity inherent in the empirical world with its multiple realities, as well as enhancing awareness of our own analyses. Diagramming promotes researcher scrutiny as it offers an alternative form of representation and thinking about the data as well as provides the reader with greater access to the ways in which the researcher has interpreted the emerging theory and methodology. In complementing text, their fluidity allows for a more refined representation of our complex world. This strength enables, ‘often through the use of graphic metaphor, the visual representation of the otherwise invisible’ (Richards, 2002: 91). The consequence of this is that subsequent memos are rich as they represent a more thoughtful and reflexive account of the emergent theory, especially as the researcher is encouraged to create space and use diagrams to make concepts more visible. Waring (1995) adopted many of the recommended strategies proposed by Strauss and Corbin, while Buckley (1997), also in a study on physical activity but with younger children, used many of the principles associated with Glaser’s version of grounded theory. Both writers used diagrams extensively throughout their work to provide a transparent and reflexive approach to analysing and reporting data. Waring used diagrams to help support conceptual understanding of the methodological complexities associated with the approaches and levels of coding recommended by Strauss and Corbin. Buckley found diagrams particularly useful in making sense of data as concepts, and categories started to emerge within Glaser’s approach to encouraging emergence and not forcing data.
Using diagrams in the early stages to clarify methodological process
Perhaps one of the major differences between Glaser and Strauss and Corbin is in their approach to coding and theoretical sampling. For example, the Paradigm Model suggested by Strauss and Corbin (1998) is designed to support analysts during this process. Waring adapted the Paradigm Model (see Figure 1) to suit the context of the research and accommodate cultural nuances. This process, whereby the researcher generates a ‘frame’ comprising the various elements of the Model and associated descriptions in the form of memos, is also recommended by Borgatti (2004). This was found to be a useful strategy to help visualise various aspects of the coding process. Representing the more complex approach of Strauss and Corbin in this way allows the researcher to clarify and structure key methodological tools and, in this case, show the ways in which they mesh with the emergent theory. The action/interactional strategies identified within the Paradigm Model allow the relevant specific aspects in the area of research to be identified, thus enabling a clearer focus to be achieved. In addition, the Model also facilitates the aim of the research process in grounded theory, which is to explain relationships rather than simply describe phenomenon.

Paradigm Model.
Various forms of diagrammatical representation of grounded theory procedures can aid researchers in making sense of the complexities of grounded theory. Writers sometimes use this strategy in academic papers to explicate their approach to grounded theory; see, for example, Coyne and Cowley (2006) who used a simple diagram to illustrate a series of overlapping steps that were revisited at different points in the analysis. Waring (2003) devised the Helix Model (Figure 2) to illustrate a systematic framework for grounded theory that reflects the initial analysis, representing an isolated ‘portion’ of the theoretical framework, which generates theory from the grounded data. Such a diagram can be used as an analytical tool for the researcher. The model is not meant to imply a linear passage but simultaneous coding, sampling and review through the process. There should be movement in both directions around the Helix so as to remain flexible enough within this introductory framework to suit the research situation and expertise of the researcher as the study evolves. The flexible approach encapsulated in the Helix Model allows the researcher to identify and develop categories, disclaiming or accepting emergent data and ideas while directing and conducting further investigations through which the emergent categories are established and new ones evolved. The authors’ experience of using grounded theory is that it is very complex, even if researchers only adhere to the basic tenets. Visual representation of the researcher’s understanding of various stages of this complex process can help the investigator and others contemplating to use the method develop a clearer understanding of the framework.
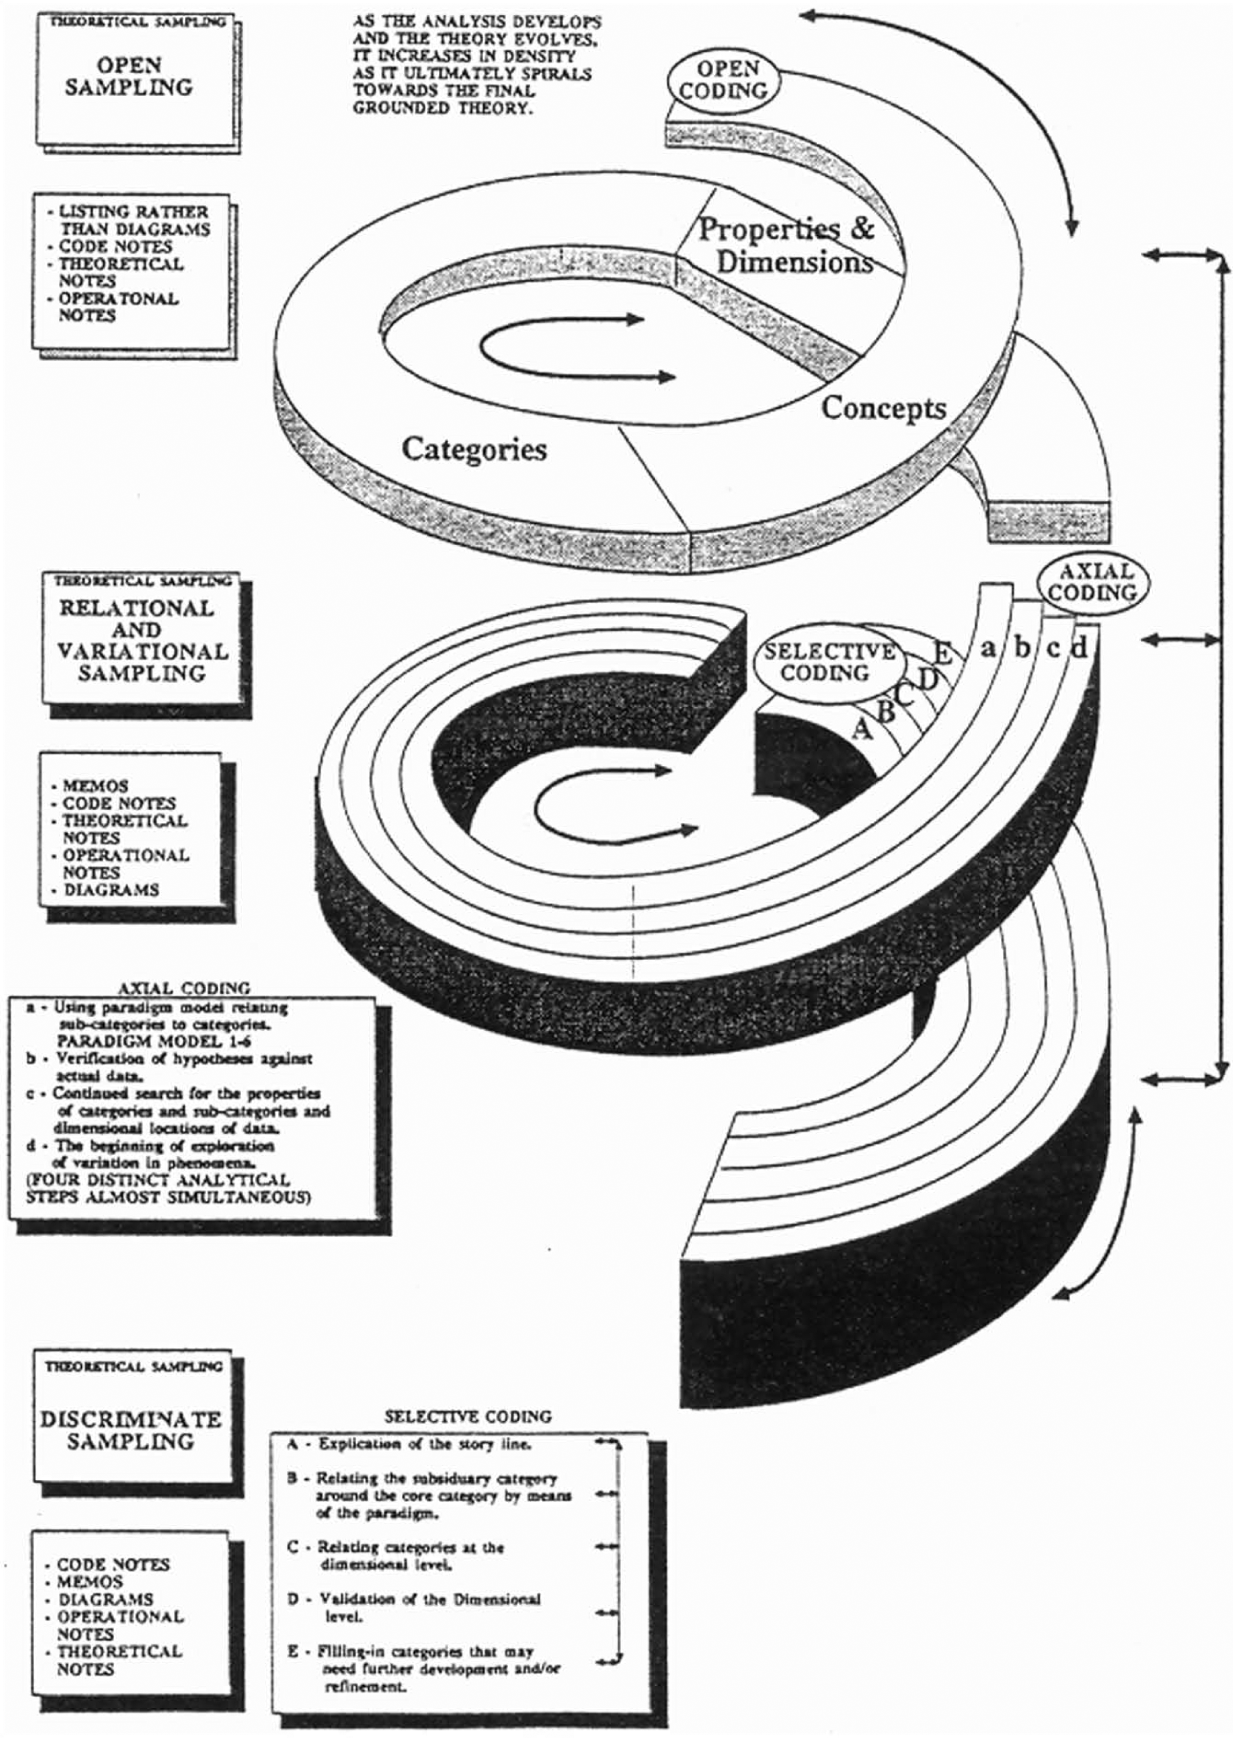
Waring’s (2003) Helix Model.
Embryonic relationship diagrams to guide theory development in the early stages of research
Simple diagrams and drawings were used in the early stages of each research project to identify tentative links between emergent concepts. The first of these (see Figure 3) from Waring’s study illustrates a drawing where the ‘raw’ data are presented on the sheet in handwritten form as a means of exploring the data. At this early stage in the research process, the investigator can juxtapose emergent open codes with lines in creative ways to help start to formulate possible relationships in the data. Diagrams such as these were used after several interviews had taken place and the researcher had started to generate some open codes; yet, the relationships between such codes were still unclear. They can be used to guide theoretical sampling both in terms of new respondents and information to illuminate the emerging relationships. Buckley’s study incorporated attempts to make links between families of open codes. In the very early stages of the study, following unstructured and then semi-structured interviews with children, an emergent dynamic appeared to be the importance of friendship relations in affecting choices in various physical activity contexts. Fickle friendship patterns among younger children were evident together with certain patterns of relationships, which had started to emerge. A useful way of capturing the transient nature of this dynamic was to use arrows to indicate the trend in relationships, which had emerged between various identities (see Figure 4). This process was also useful to the researcher for the important principle in grounded theory studies relating to theoretical sampling as it supported and guided the future selection of children for interview and/or re-interview. The researcher was able to identify children who, in discussion with interviewees, would likely display traits associated with one of the identities. Additionally, conceptual density was developed though re-interviewing specific children. This process helped the researcher to more fully saturate emerging identities and discover a number of nuances associated with each, which led to the production of a series of diagrams similar to Figure 5. Prior to this, it is recommended that the researcher might use simple hand-drawn pictures with names of children appearing through the interview process and to connect them by lines with the children to confirm with the focus group where friendship patterns are. Such diagrams can be revisited in future interviews with the same children and any new child added to the group as a result of theoretical sampling (which can be informed by the diagrams discussed with children) to establish developments and changes.
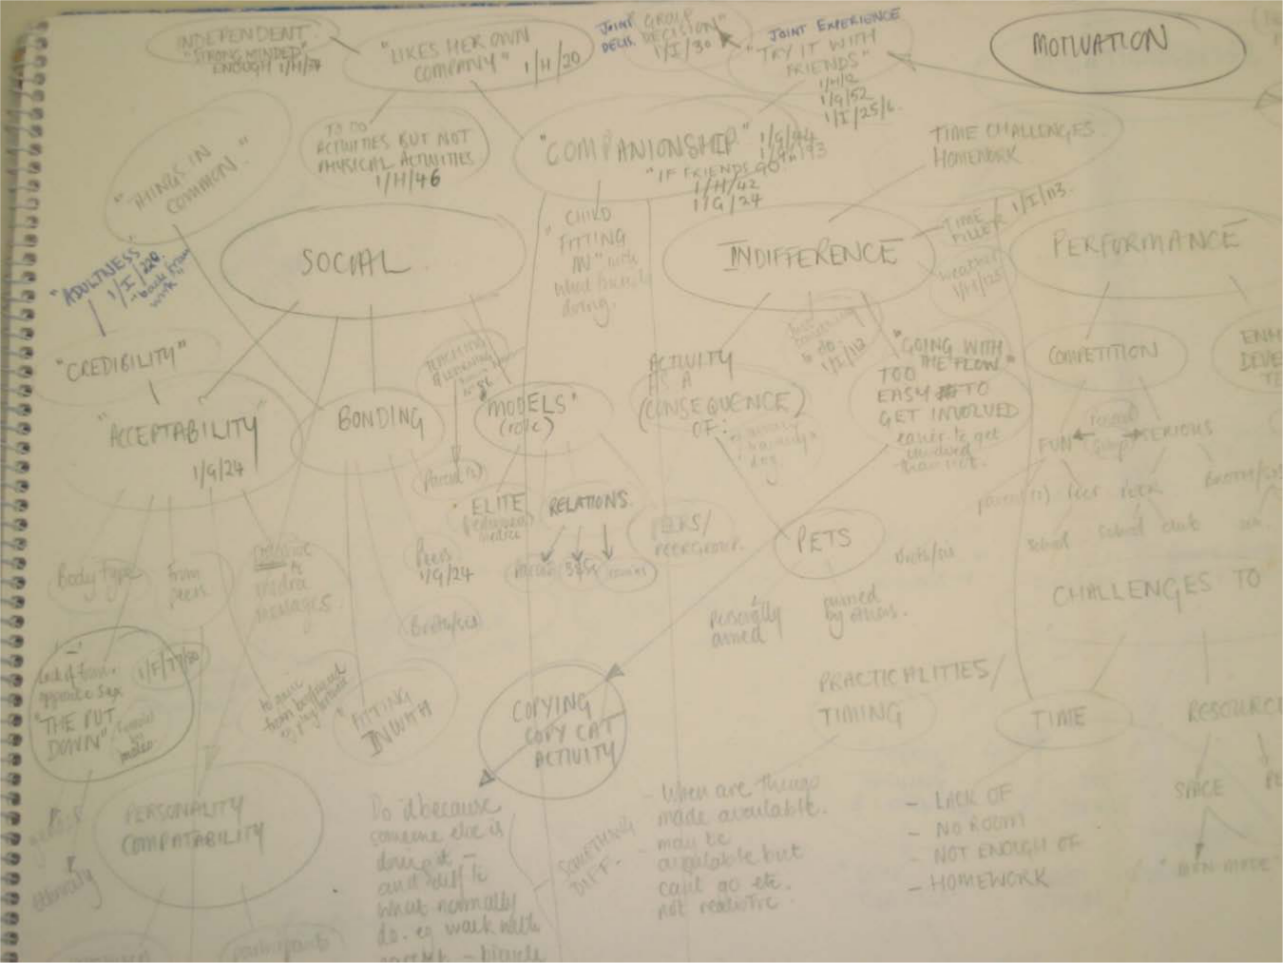
Hand-drawn raw data.
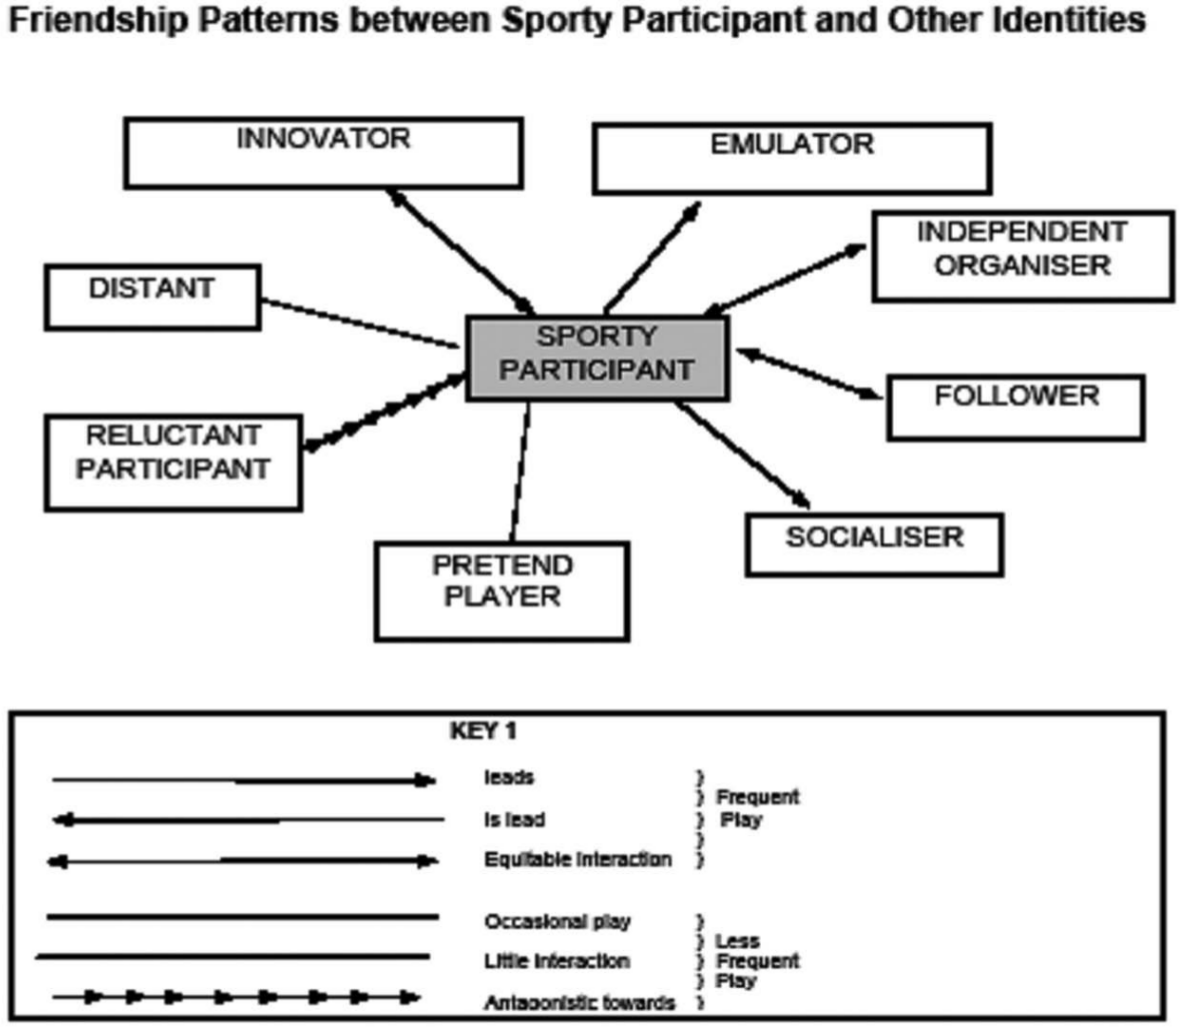
Friendship patterns from Buckley’s study (Buckley, 1997).
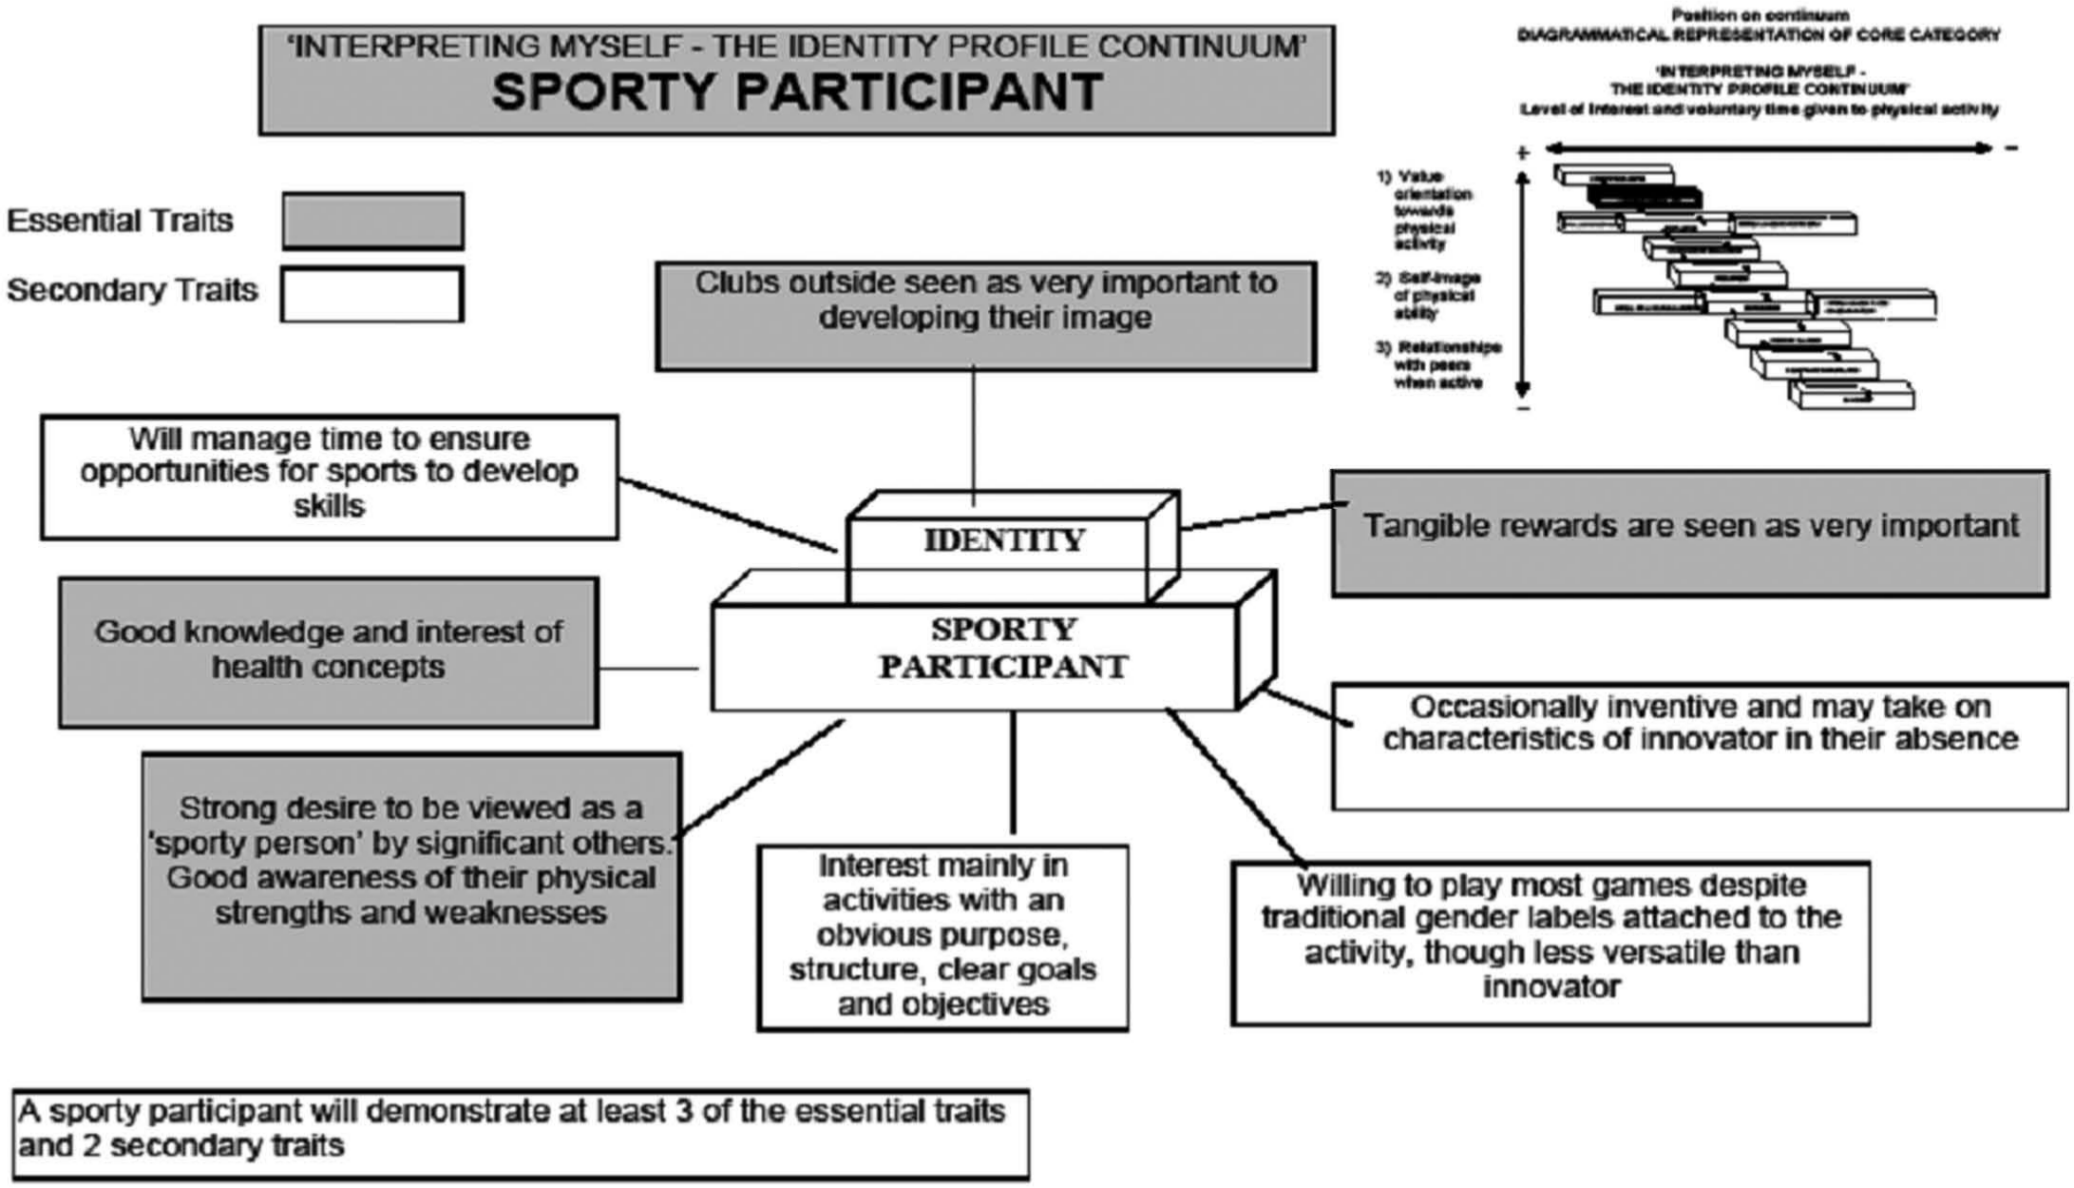
The ‘Sporty Participant’ from Buckley’s study (Buckley, 1997).
The importance of identity was also starting to emerge in the early stages of Buckley’s study, and diagrams used at this stage assisted in the process of theoretical development by linking open codes and establishing tentative relationships between them to identify possible concepts. Such emergent concept diagrams provided a way of communicating and gaining feedback at research seminars. In both this and Waring’s study, the levels of abstraction were deliberately kept to a minimum to ground the developing theory in the context of the idiosyncratic nature of childhood discourse. This happened in tandem with both researchers using the strategy of employing in vivo codes for a substantial part of the studies. In this instance, in vivo is taken to represent a code based on a verbatim term uncovered in one or more data sources. This encouraged the researchers to spend time reflecting on the language used by children and gain insights into the meanings attached to the idiosyncrasies of childhood culture.
More sophisticated diagrams could then be drawn with some confidence as the study progressed. An example of this is shown in Figure 5; ‘The Sporty Participant’ diagram exemplifies the researcher’s more advanced level of theoretical refinement at the mid stages of the project. This was a useful aid to reinforcing conceptual linkages and can be used in dissemination activities with colleagues. For example, both researchers presented preliminary findings at international conferences using emergent category diagrams. The inset in the diagram represents the final core category diagram, and this was found to be a useful strategy in linking the various levels of theoretical analysis. ‘The Sporty Participant’ identity was one of many emergent in the study; the way in which codes and theoretical notes contribute to the development of these is shown in Figure 6. This type of diagram, although rich in text, was found to be useful, in conjunction with associated memos, to act as a stimulus for discussion with colleagues in the later stages of the research. It helps the researcher in revisiting codes that contributed to the emergent theory and opens up the relationships between codes so that the reader is more able to see how the analyst developed the story. Perhaps most importantly, diagrams such as these can provide a window of transparency for those wishing to understand the ways in which aspects of data interrelate to theoretical developments and provide insights into the researcher’s thought processes, and how data were interpreted and theories constructed. This is particularly important in studies using a grounded theory approach as it opens a window into the researcher’s epistemological approach, indicates which version of grounded theory they have most closely followed and provides a clearer storyline for the reader to follow.

Diagram providing window of transparency.
Diagrams produced by children as an alternative to verbal responses to interview questions
Punch (2002) argues that when working with children, the emphasis should shift towards working with the research subjects’ preferred methods and familiar sources or techniques. Children are more used to visual and written techniques at school, and there should be more attempts to tap into their interests. Buckley’s study, in the initial stages, involved a cross-sectional sample of children aged between 7 and 12 years of age. The ‘Draw and Write’ technique was used early in the research process. Wetton (e.g. Wetton and McWhirter, 1998) pioneered the use of the ‘Draw and Write’ technique for researching children’s ideas of health. It involves asking them to draw a picture of their ideas and then write words or sentences to explain the picture. The technique was used to investigate a range of health issues with children aged 4–11 years in a nationwide study of English, Irish and Welsh children’s views about health (Wetton and McWhirter, 1998; Wetton and Moon, 1988). It needs to be recognised, however, that as Backett-Milburn and McKie (1999) suggest, ‘health education research with children must involve taking children seriously as social actors and query the assumption that drawing enables children to communicate their thought any more than does conversational language’ (p. 387). Horstman et al. (2008) also suggest that the method needs to be used carefully and sensitively if children are to become active participants in revealing their world as they see it. In Buckley’s study, children were asked to draw a picture of a healthy and unhealthy person (see Figures 7 and 8) to augment some of the verbal responses they gave in interviews. The advantage of using drawing with children is that it can be creative and fun, and can encourage children to be more actively involved in the research. To increase trustworthiness when using this technique, Buckley ensured that sufficient time was given to individual children to discuss the nuances of the drawings they had produced. These provided the researcher and children with another dimension with which to share and explore the idea of what ‘healthy’ meant to them. The second drawing, for example, by an older child (10 years), has been accompanied by text. This was the child’s choice, and subsequent dialogue revealed the influence of both parents and teachers in the way that children assimilate some messages about the complexity of health.
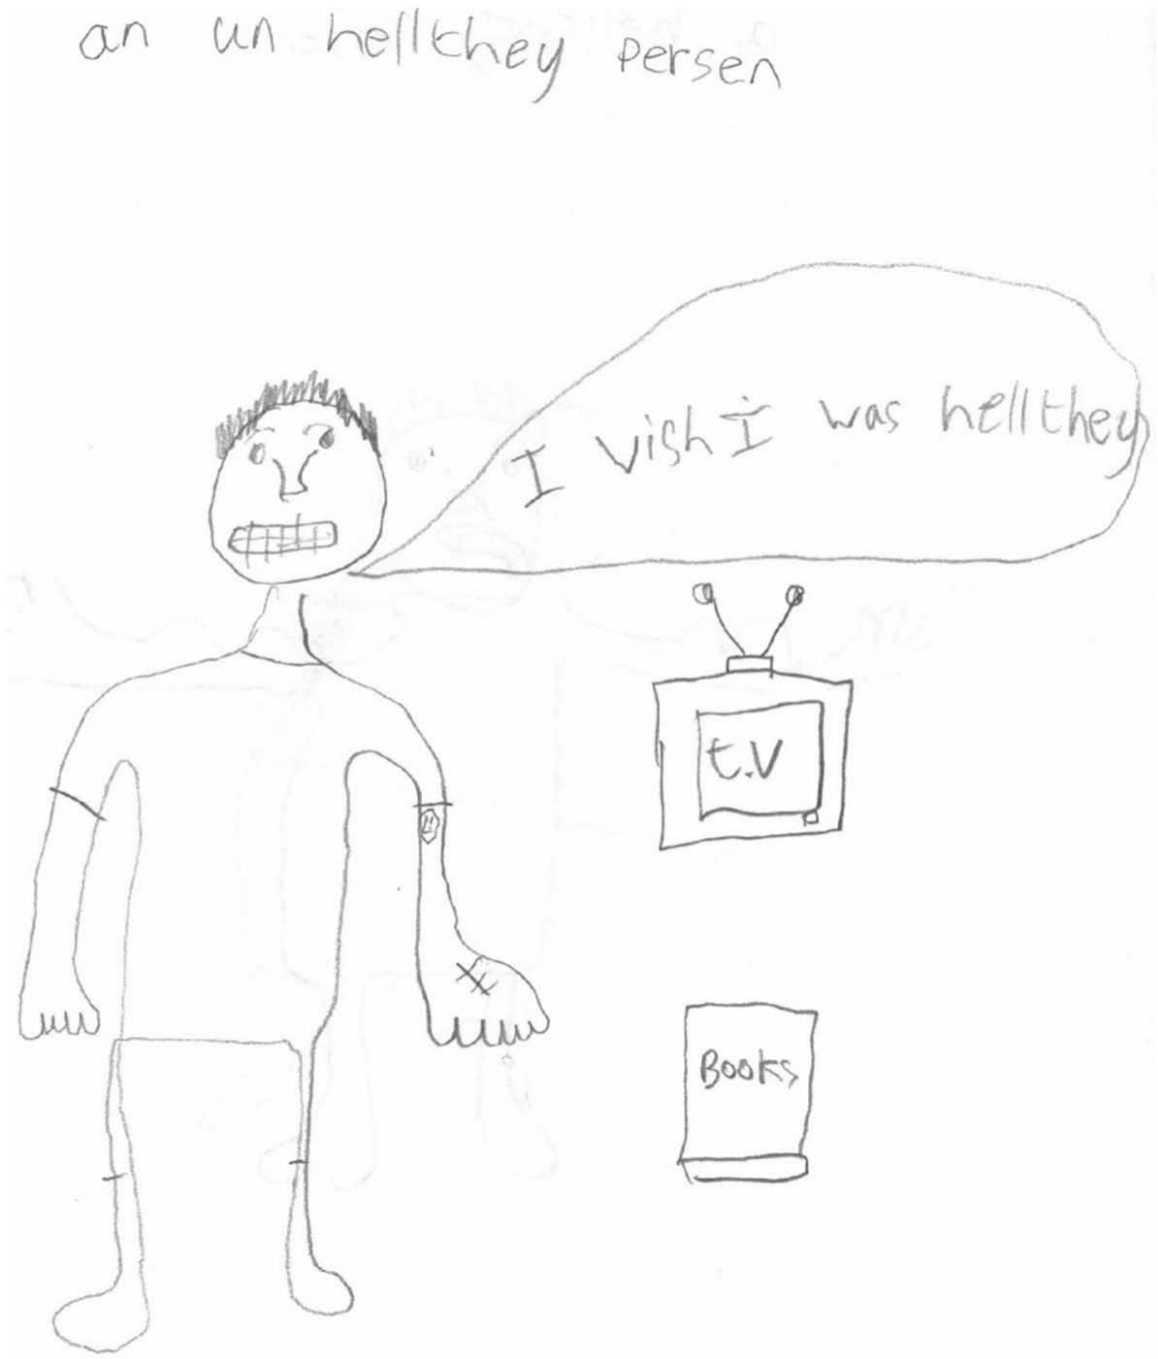
‘Draw and Write’ – picture of a healthy and unhealthy person drawn by a 9-year-old child.
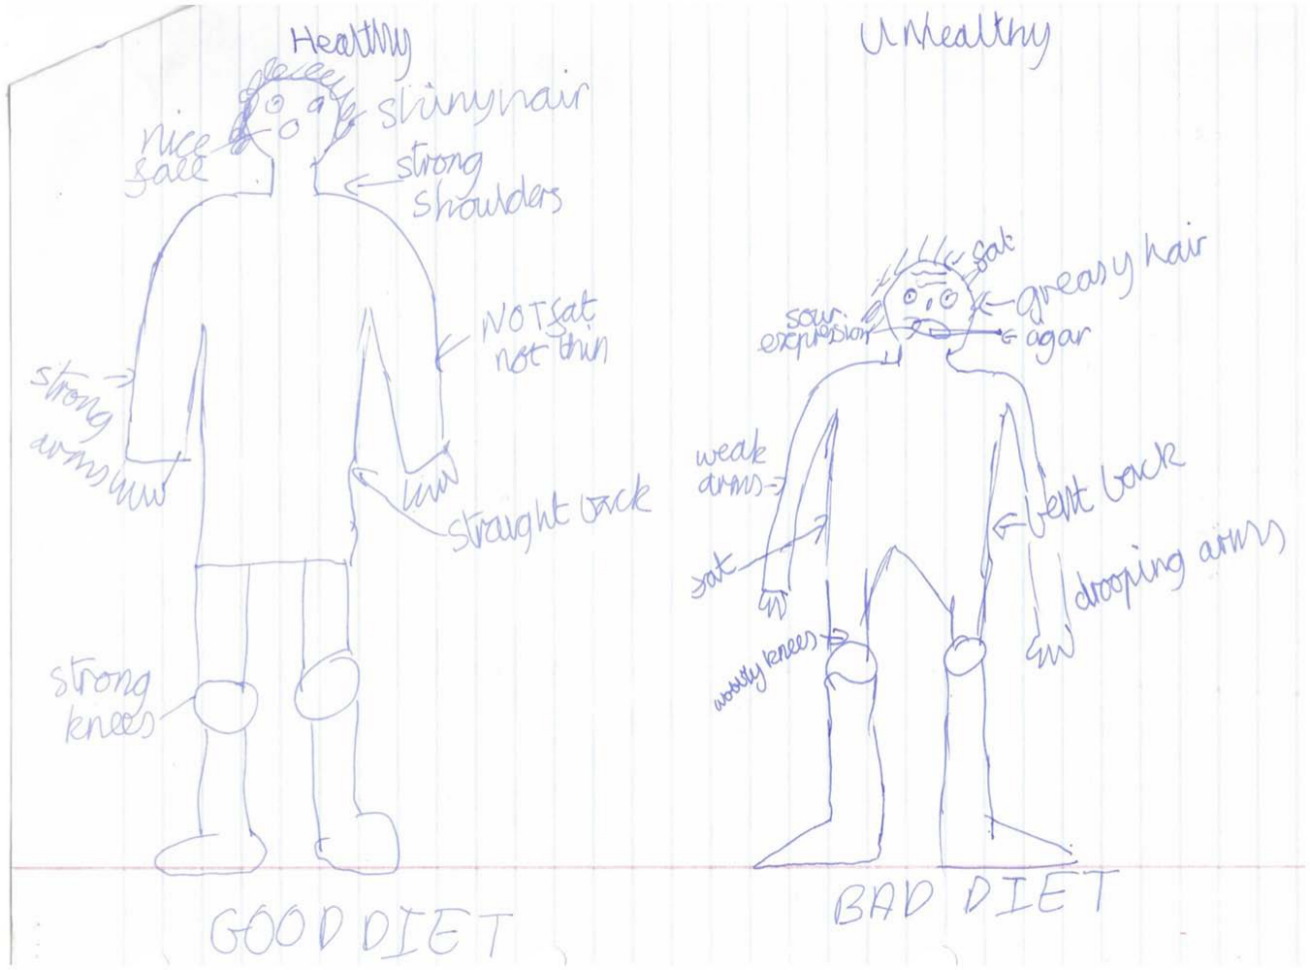
‘Draw and Write’ – picture of a healthy and unhealthy person drawn by a 10-year-old child.
In addition, the drawings can provide a stimulus for discussion to encourage a more interactive atmosphere in focus group interview situations. The use of drawing gives children time to think about what they wish to portray and can provide a break for younger children who typically have limited concentration spans compared with adults. However, the researcher should remember that drawings are not a simple, ‘natural’ method to use with children as it depends on children’s actual and perceived ability to draw. In this study, it was found that even younger children were sometimes self-conscious about their drawings and wanted to maintain an element of privacy. To minimise this potential bias, Buckley, who had a background in teaching primary school children, used open-ended questions to explore what children thought they were trying to represent through their drawings. In addition, gaining insights into the personalities through discussions with their teacher provided another source of data. A further way in which diagrams were employed in this study was as part of the co-construction of diagrams/images as part of the interview dialogue. An example of this was where the researcher drew a very simple sketch of the playground of the school and surrounding areas so that the children could point to areas that they most often frequented.
Diagramming to explicate the story
Diagrams facilitate both the development and presentation of the researcher’s emerging interpretations or theories. For example, both authors engaged in discussion and debate with one another and other researchers around flow diagrams that represented existing conceptions and related literature (see Figure 9). The resultant dialogue helped to sensitise the researchers to their own preconceptions and existing theory. In addition, diagrams can be used throughout the research process to explore and articulate methodological understandings. This is particularly important in grounded theory because of the perceived variety of interpretations of this methodology. Waring, particularly in the embryonic stages, would construct diagrams to generate methodological discussion as well as theoretical discussion of the analysis. The Helix Model and the Paradigm Model are the manifestation of the methodological/procedural discussions. Their usefulness therefore extends throughout the whole process of research in a grounded theory study. By adopting literal, metaphorical and arbitrary conventions, diagrams are able to convey meaning in a variety of ways, which is not possible using text alone (Crilly et al., 2006). A good example of this is Figure 10, which represents the core category and related subcategories for Buckley’s study. The core category refers to a process through which children unconsciously assimilate and, at the same time, consciously manipulate, their relative position based on contextual, relational and biographical dimensions of perceived realities. The labels do not refer to particular children, rather they indicate processes that account for types of behaviour and have cross-cultural relevance. It soon became apparent that childhood behaviour and culture are highly transient and dynamic processes influenced by a wide range of factors. Figure 10 shows that those identities higher up the continuum value activity more than those lower down, as well as having a more positive physical self-image and better relationships with peers when involved in physical activity. The lateral axis shows that identities towards the left of the continuum, that is, sporty innovators and sporty participants, have higher levels of interest and tend to give up more of their voluntary time to physical activities.
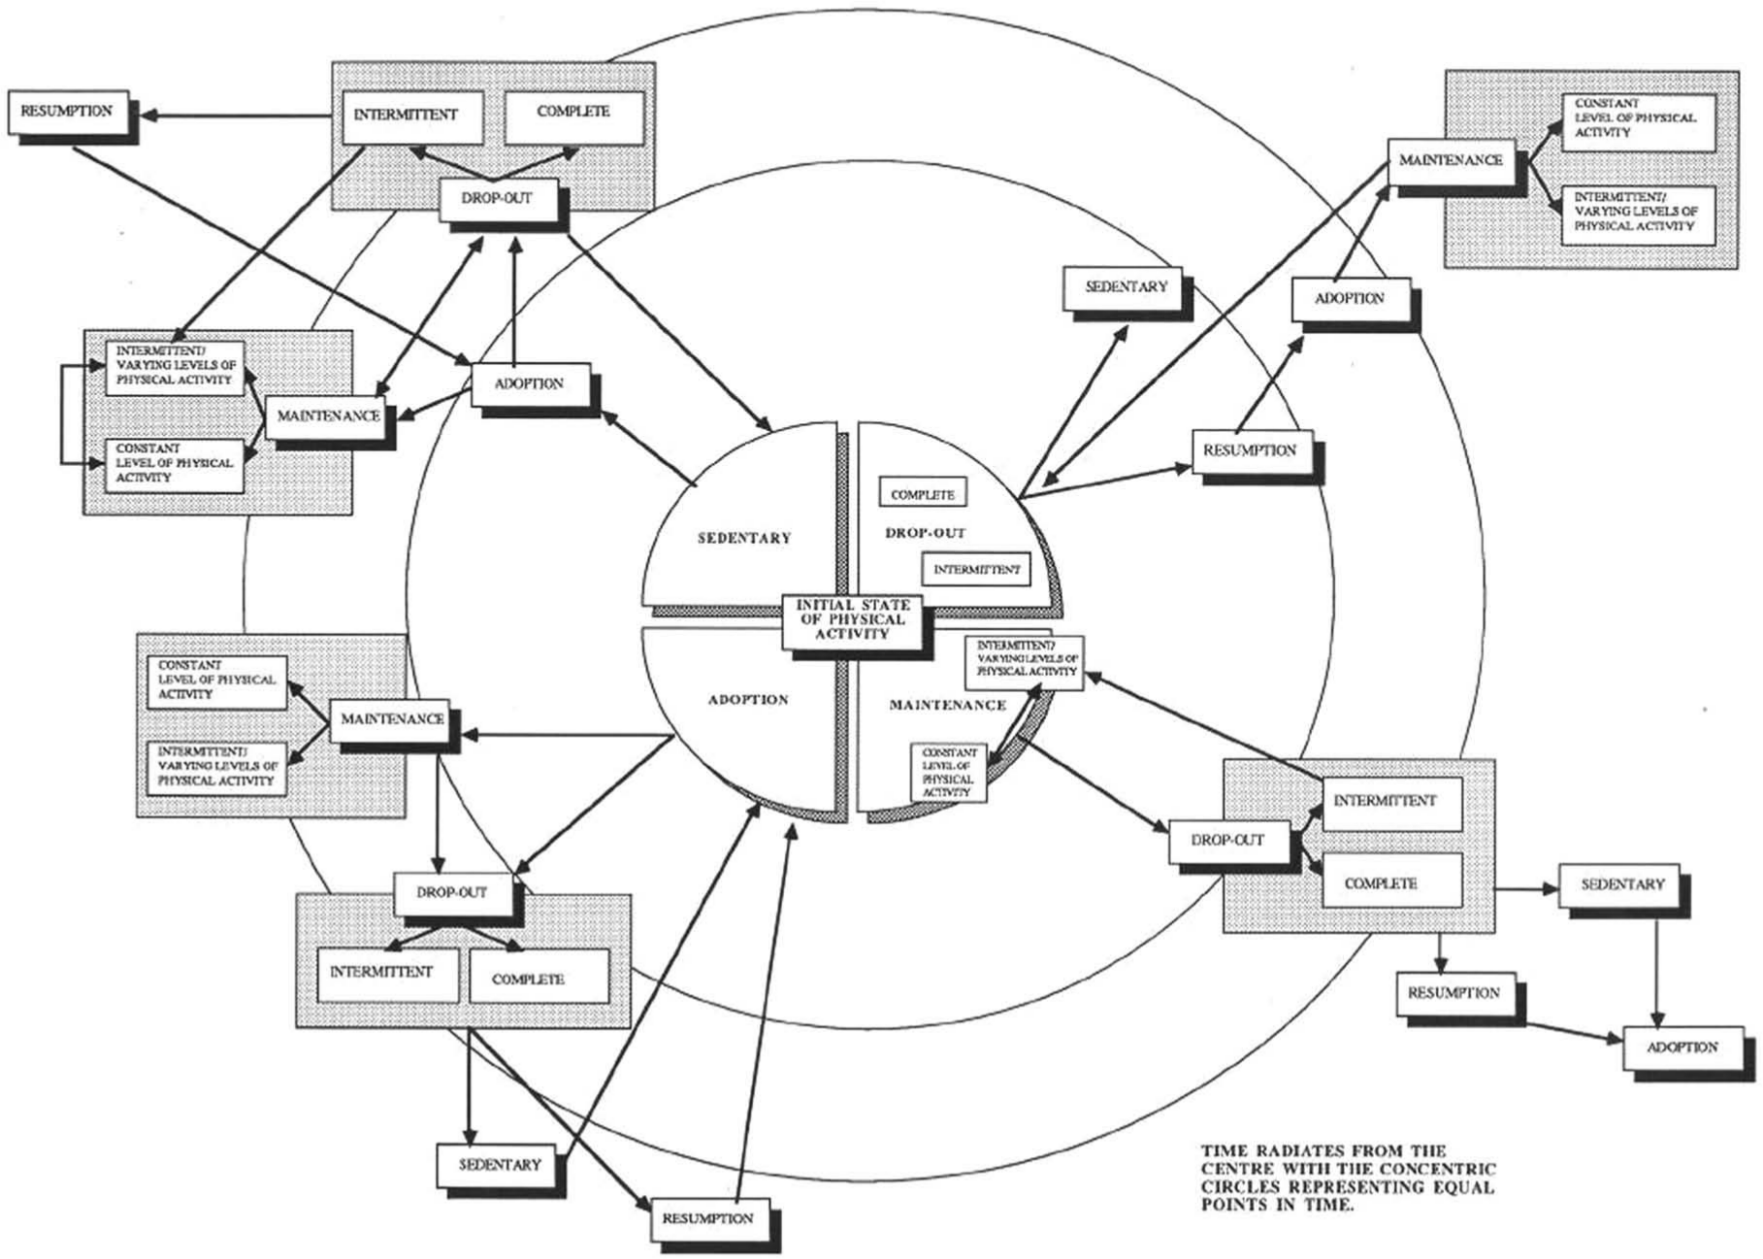
Flow diagram mapping existing conceptions and literature.
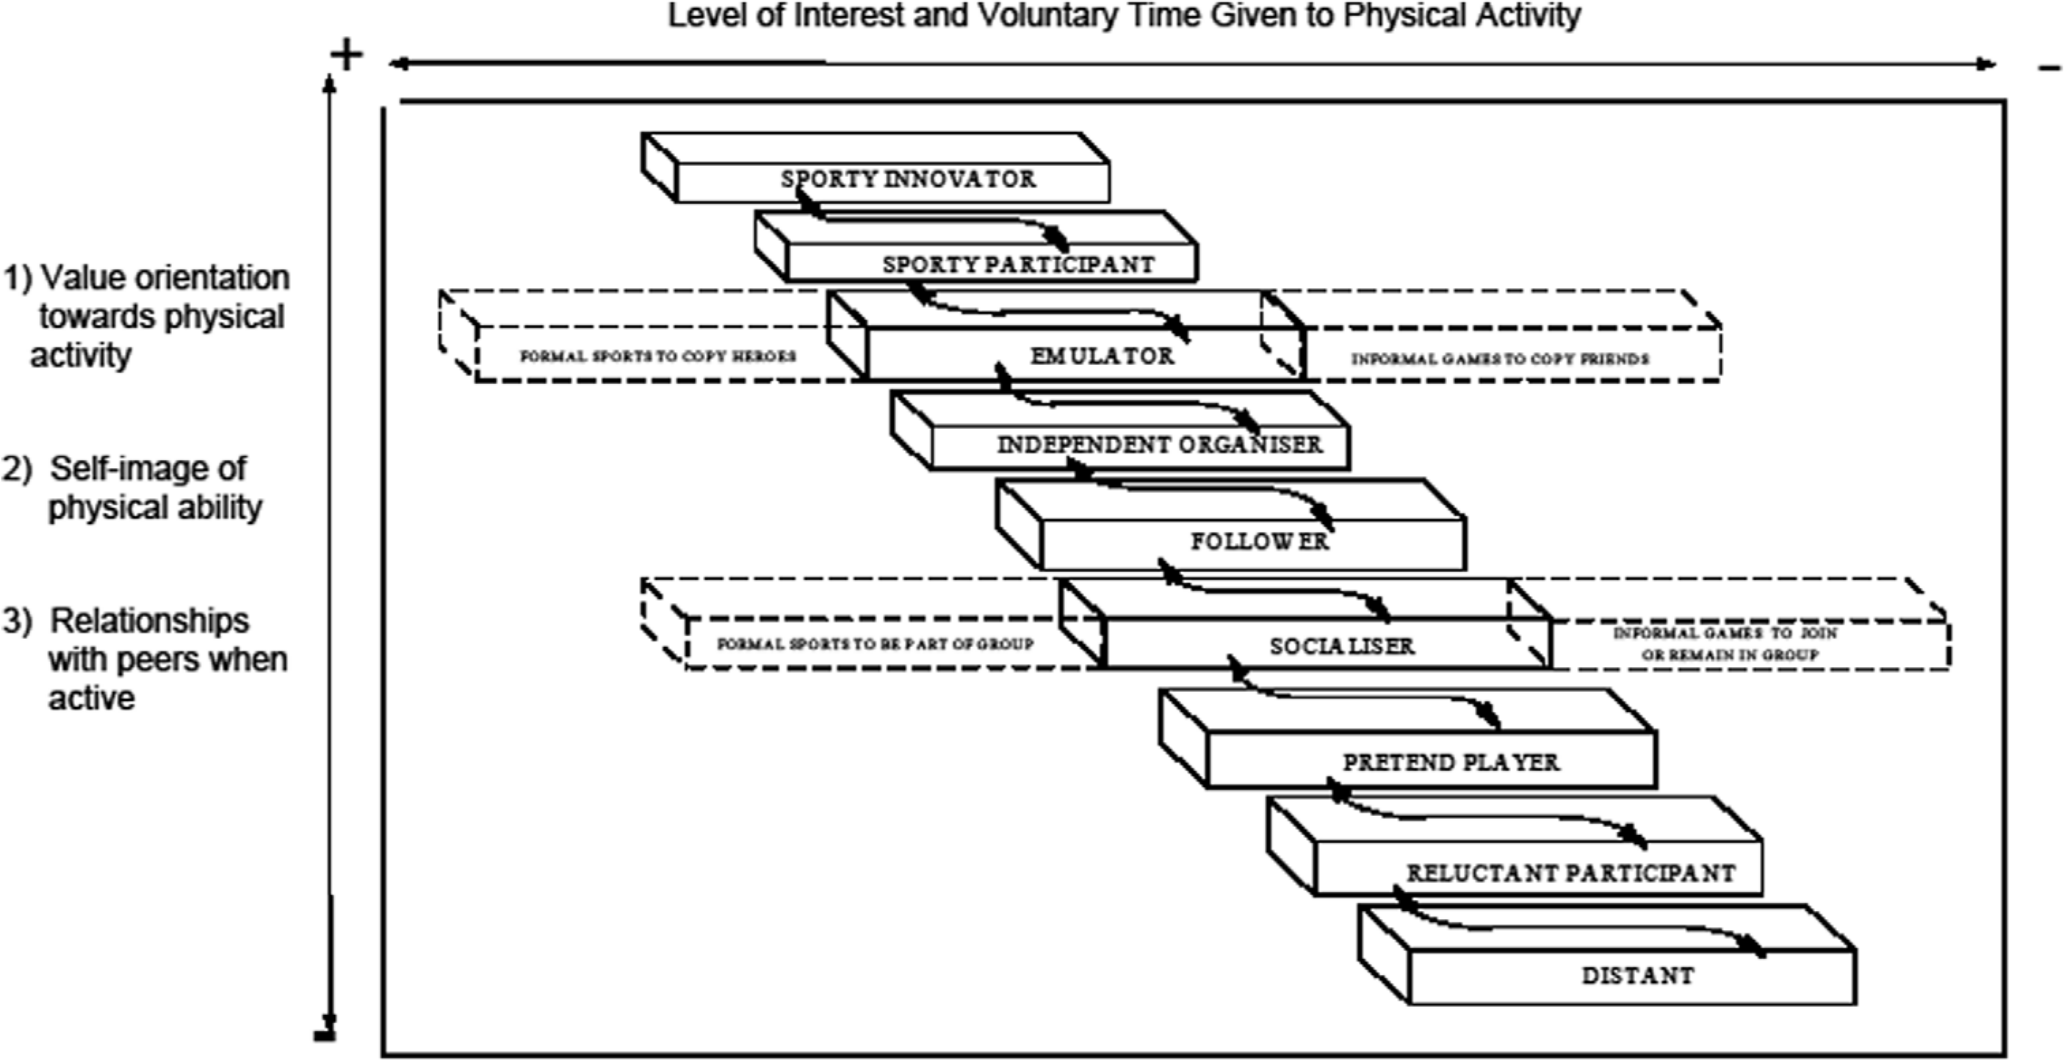
Diagrammatical representation of the core category – ‘Interpreting Myself – The Identity Profile Continuum’.
In Waring’s study, the core category was ‘gatekeeping’, and its contributory components are illustrated in an uncomplicated fashion using a more simple diagram (see Figure 11). The diagram conceptualises the fundamental place of the gatekeeping processes that create a complex causal web of opportunity for physical activity according to the context and nature of the physical activity. The complexity of the gatekeeping processes and the interrelationships, compromise and coercion between key agents (gatekeepers), especially the young person and their parents, is acknowledged. This diagram provides an indication of ways in which graphic representation can be used to create a visual map that enables readers to digest key aspects of a sophisticated analysis. Diagrams such as this can supplement the accompanying text and can be used as a cross-referencing tool to guide the reader. The ‘gatekeeping processes’ are consciously, as well as unconsciously, manipulated relative to the social and physical context in which the young person and other gatekeeping agents (parents, school and peers) exist and find themselves. The interrelationship between these processes, and the nature and extent to which participation in physical activity relates to them, is what determines the likelihood of the young person’s participation and attitude towards physical activity. The nature of each gatekeeper’s personal agenda is based on the definition associated with three roles which each adopts: guardian (to ensure the physical and emotional safety and well-being of the young person), facilitator (to provide opportunities to participate in activities) and enforcer (to ensure behaviour and activity within certain limits identifiable by the gatekeeper).
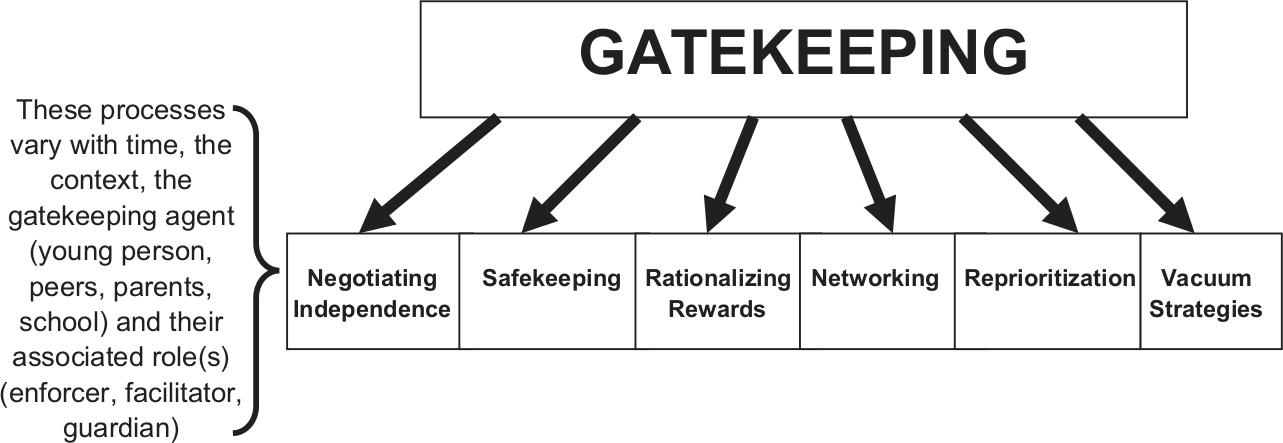
Creating a visual map for readers.
Diagrams were also generated to summarise the gatekeeping processes and their basic relationships (see Figure 12). This diagram also formed part of the process of reflection on process theory generation, which employed another, more sophisticated diagram to illustrate the process being incurred (see ‘Rationalisation and rewards’ diagram in Buckley and Waring, 2009). This strategy demonstrates the ways related diagrams can be layered to reflect various degrees of complexity, providing alternative routes to conceptual understanding to suit the reader. These diagrams, which represent emergent theories, are represented as types of layered diagrams and provide multiple windows illuminating various stages of the research.
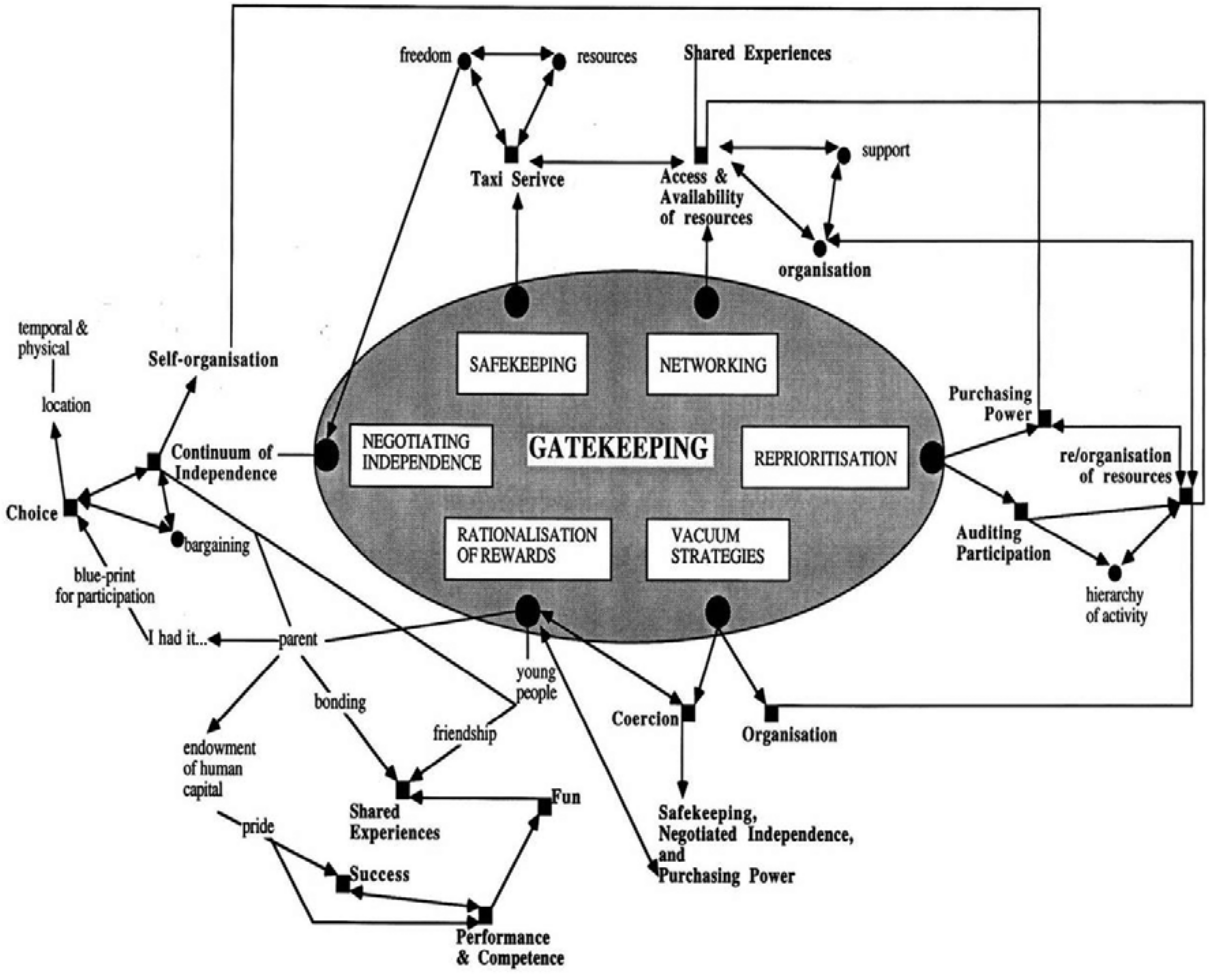
Diagram to show the complexity of the gatekeeping process.
In summary, diagrams used in the two case studies were found to be useful at a number of developmental stages:
Sensitising the researcher to preconceptions and existing theories (e.g. Figure 9);
Procedural clarification and articulation diagrams (e.g. Figures 1 and 2);
Diagrams to encapsulate emerging theories (e.g. Figure 3);
Emergent category diagrams (e.g. Figures 10 and 11).
The two case studies described above provide insights into some ways in which diagrams might support the process of a grounded theory study at various stages and act as a powerful tool for the researcher, participants in the study and ultimately the reader. The approach to grounded theory will affect the potentialities associated with the use of visual images and diagrams at key stages and should, to a large extent, reflect the epistemological orientations of the researcher, the nature and scale of the enquiry and the emergent theory. Along with providing an alternative form of conceptualising data and supporting emergent theories, they have the power to make clear many of the complex processes inherent in many grounded theory studies.
Conclusion
Diagrammatical representation can offer researchers invaluable resources for conceptualising and representing complex data sets. It is important to be aware that to some people, diagrams may not be perceived as neutral with regard to mechanisms of hierarchy and power. Through the use of diagrams and text, the research process can be made increasingly transparent and can reduce some of the potential biases. Even though recommended throughout the grounded theory literature, there remains a need for more clarification as to how diagramming can assist the researcher at all stages of the research process. The amalgamation of text and drawings can act as a powerful tool for dissemination to critical audiences; however, the use of diagrams still seems to be an area of unexplored potential for the development of theory. Traditionally, many journals have had limited capacity to handle various forms of visual image. The range of software that is available to everyone to construct a variety of forms of diagram provides a straightforward set of very effective tools. The researchers in these two case studies primarily used the drawing tools available in Microsoft Office, although alternative packages such as SmartDraw and NVivo allow researchers to experiment with ways of making sense of data and creating various forms of visual representation. With the rapid move toward an increasingly diverse array of dissemination possibilities, the Internet can help facilitate the publication of still and moving images, which can be hyperlinked to text. This paradigmatical shift in critical discourse will allow for the emancipation of researchers, and therefore provide the opportunity to promote increasingly credible reflections of the research process. In particular, visual representation can facilitate deeper understanding by providing an alternative form of communication that is accessible to a wider audience than text alone.
Footnotes
Funding
This research received no specific grant from any funding agency in the public, commercial or not-for-profit sectors.
Author biographies
Charles A Buckley is currently Senior Lecturer and works as Educational Developer and Director of the Postgraduate Certificate in Learning and Teaching in Higher Education (PGCertHE) at Bangor University. His current research interests are mostly associated with learning and teaching issues in university and include blended learning and students’ approaches to study in higher education, academic identities and continuing professional development within universities and the research–teaching nexus. He is also interested in the evolution and use of grounded theory. He is a National Teaching Fellow and also supports the work of the Staff and Educational Development Association.
Michael J Waring is the Director of the Postgraduate Certificate in Education (PGCE)/MSc (Qualified Teacher Status (QTS)) programmes and Senior Lecturer in the School of Sport, Exercise and Health Sciences at Loughborough University. His research interests focus on the development of personal learning styles pedagogy and the use of learning technologies as part of blended learning in higher education and initial teacher education contexts. Generally and as part of the exploration of this personalised learning agenda, he is interested in the use and innovative development of qualitative research methodology, particularly grounded theory.