



Abstract
Considering the case of the School of Economics of the University of Florence, the paper investigates whether the pre-enrolment assessment test is an effective tool to predict student performance. The analysis is tailored to evaluate the additional information yielded by the test beyond the background characteristics of the candidates already available from administrative records, such as the high school type and final grade. The student performance is measured by the number of gained credits after one year, which is a count variable with an irregular distribution and a peak in zero. These features pose a challenge in statistical modelling, which is solved by a two-part model with a logit specification for the zeros, while positive values are analyzed by quantile regression for counts. To disentangle direct and indirect effects of background variables, the result of the pre-enrolment assessment test is treated as an intermediate variable in a regression chain graph. The results show that the pre-enrolment test adds some information to predict student performance, which can be exploited for tutoring.
Introduction
Predicting student performance is a key step in order to improve the efficiency of university systems. Indeed, delays or failures are costly for both the students and the administration. Therefore, it is of primary importance to determine the factors associated with the performance in order to plan actions such as restrictions to the access and tutoring. To this end, universities can typically rely on information about students’ high school career, such as the type of school and various measures of proficiency. However, the results at high school are not fully appropriate to predict the academic performance due to several limitations, including the possible mismatch between the competencies evaluated at high school and those required for a given degree programme, and the heterogeneity in the criteria for awarding marks (usually, there is substantial variability across types of schools and across geographical regions). To overcome these limitations, several universities devise a pre-enrolment assessment test tailored on the needs of each degree programme. However, a quick look at pre-enrolment tests around the world reveals a lack of commonly accepted guidelines and a shortage of empirical evidence about their predictive ability.
The literature on the empirical research about predicting student performance at university is scattered in several journals, ranging from Psychology to Economics. Noteworthy papers include Murray-Harvey (1993), Wedman (1994), Hoefer (2000), Murphy et al. (2001), Maree et al. (2003), Dancer (2004), Win and Miller (2005), Smith and Naylor (2005), Birch and Miller (2006); Birch and Miller (2007), Mills et al. (2009), Mallik and Lodewijks (2010), Bianconcini and Cagnone (2012), Chowdhury (2012) and Adelfio et al. (2014).
The statistical modelling of student performance at university is challenging due to the complexity of the process. The pre-enrolment test is an instrument to measure student competencies in addition to already known characteristics, such as the high school final grade. Therefore, it is important to assess the value added by the test and to disentangle the effect of the available characteristics on student performance into a direct effect and an indirect effect mediated by the test. To this end, we use regression chain graphs (Wermuth and Sadeghi 2012).
Italian universities are characterized by a high dropout rate and a large proportion of slowly progressing students; thus, it is of primary interest to monitor the progression of students, which is conventionally measured by credits. The Italian credit system is consistent with the European Credit Transfer and Accumulation System (ECTS): one academic year corresponds to 60 credits, with one credit representing 25 hours of study. In this paper, we focus on gained credits at the end of the first year. Indeed, a good performance during the first year is crucial to graduate in time, moreover most dropouts happen during the first year.
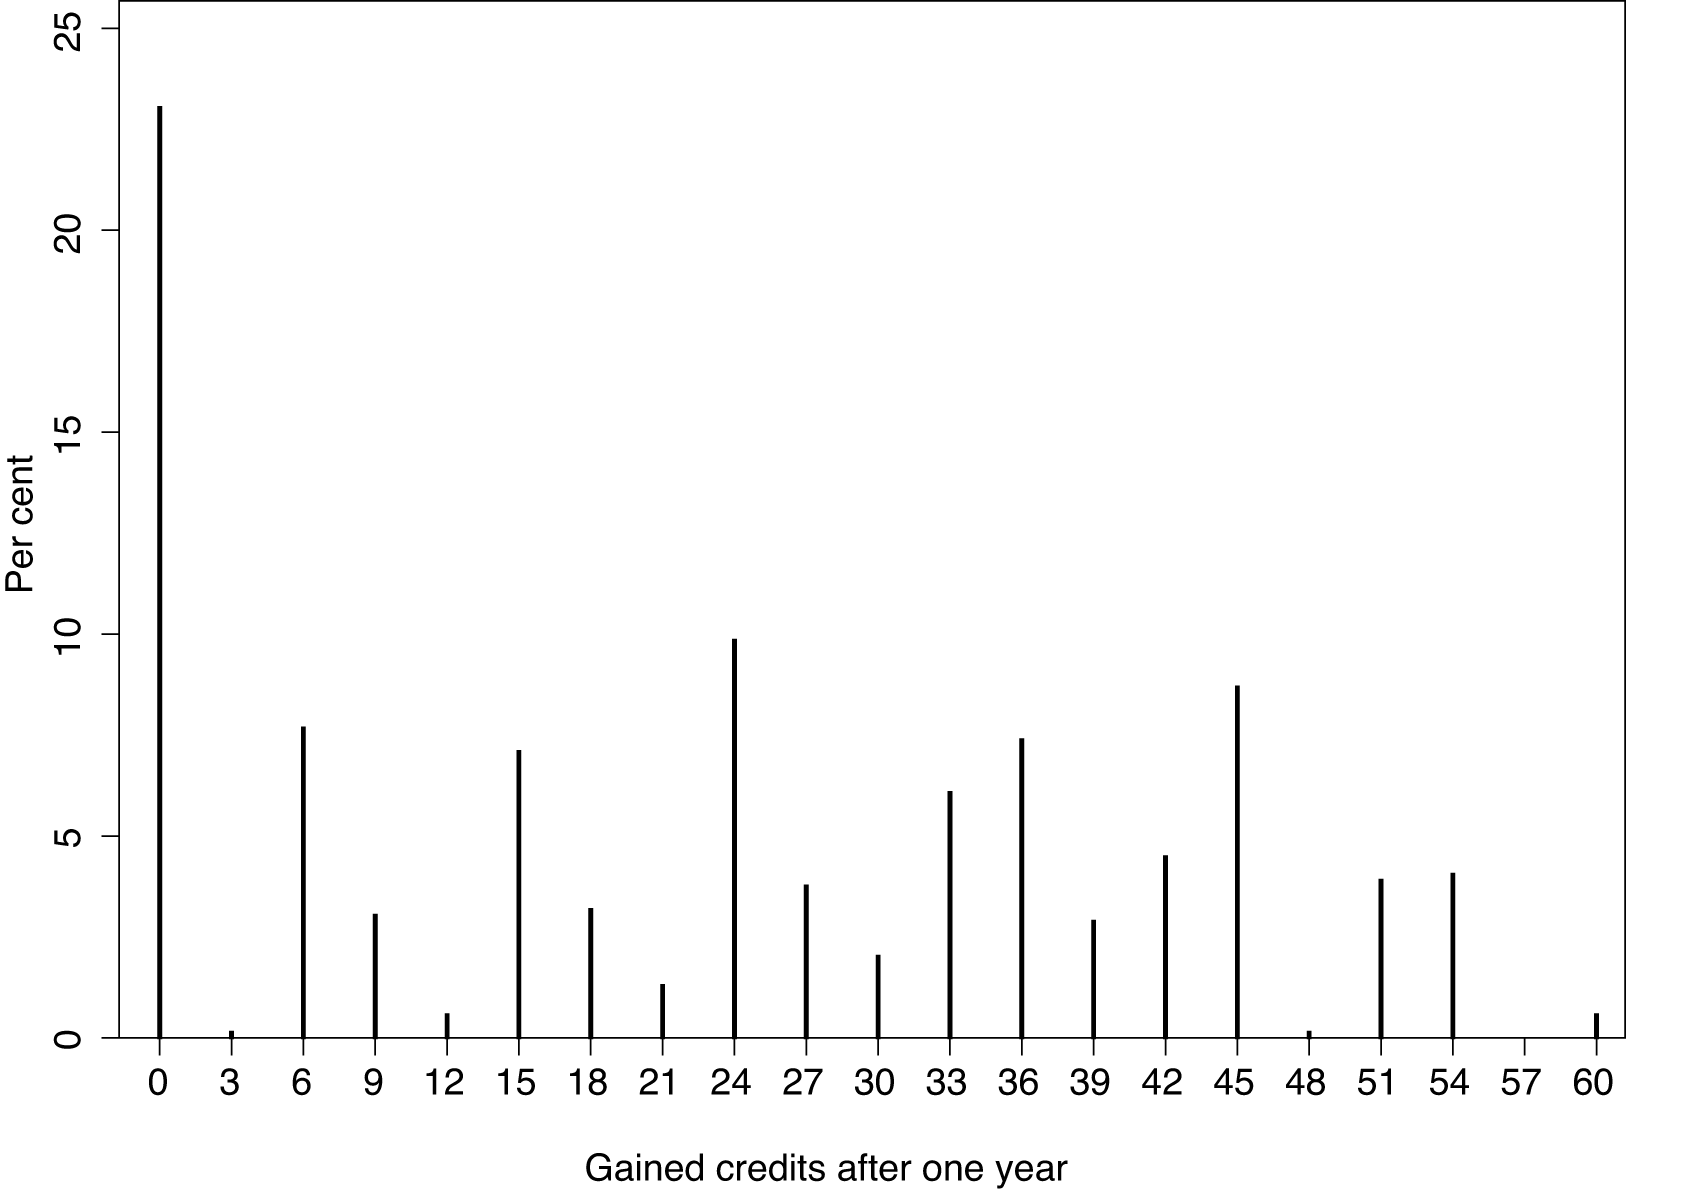
A complication for the statistical modelling of gained credits is that the observed distribution is typically quite irregular; in fact, exams yield different credits and the sequence of exams varies across students; moreover, the distribution usually has peaks at zero and at the maximum. In particular, in our data, there is no peak at the maximum, but there is a huge peak at the minimum (
The main approaches to deal with excess zeros are zero-inflated models and two-part (hurdle) models (Mullahy 1986). We rely on a two-part model since it lets the zeros and the positives to arise from different data-generating processes, entailing a separate model for the probability of gaining no credits. Indeed, students failing to gain any credit deserve special attention in order to plan interventions aimed at preventing dropout.
Two-part models usually rely on a parametric distribution for the positives, for example a Poisson distribution. However, in our application it is difficult to devise a suitable parametric specification due to the multi-modality of the distribution of gained credits. Thus, a more flexible approach is needed, such as a mixture model (Böhning and Kuhnert 2006). In this vein, Grilli et al. (2015) analyzed gained credits using a concomitant variable binomial mixture model (Dayton and Macready 1988). The mixture approach not only yields a satisfactory fit, but it also entails difficulties in implementation, for example the selection of the number of mixture components, and difficulties in interpreting the parameters, in particular the coefficients of the multinomial logit model for the probabilities of the mixture components. Such difficulties can be overcome by quantile regression for counts (Machado and Santos Silva 2005), which is even more flexible as it does not require to specify any parametric distribution for the outcome.
Quantile regression (Koenker 2005; Kneib 2013; Davino et al. 2014) is a methodology to analyze the relationships between the quantiles of the outcome and a set of explanatory variables. Most of the theoretical developments and empirical applications concern the linear specification, which is suitable for a continuous outcome. Noteworthy applications to the analysis of the performance of university students are Birch and Miller (2006) and Adelfio et al. (2014). The extension of quantile regression to count data raises several issues that can be solved by the approach of Machado and Santos Silva (2005), which has been recently applied to the analysis of fertility data (Miranda 2008; Booth and Kee 2009), frequency of individual doctor visits (Winkelmann 2006; Moreira and Barros 2010) and traffic accidents (Qin and Reyes 2011). A Bayesian implementation to analyze respiratory hospital admissions has been developed by Lee and Neocleous (2010). To the best of our knowledge, quantile regression for counts has not yet been applied in education, though it is well suited for the analysis of data such as gained credits.
In this paper, we analyze credits gained by students enrolled in the School of Economics of the University of Florence in the academic year 2008/2009. The novelty of our approach lies in embedding quantile regression for counts into a two-part model. This raises an issue about how to make predictions which is solved by a procedure to compute marginal quantiles. The proposed modelling approach is valuable beyond the specific application to gained credits, as it is a flexible and easy to interpret approach to the analysis of zero-inflated count data.
The rest of the paper is organized as follows. Section 2 presents the case study concerning the pre-enrolment test at the University of Florence, describing the test and reporting summary statistics. Section 3 outlines the statistical methods, namely, regression chain graphs and two-part modelling with a logit specification for the zeros and a quantile regression for positive counts. Section 4 illustrates the results. Finally, Section 5 discusses the main findings.
Data and preliminary analysis
In the academic year 2008/2009, the School of Economics of the University of Florence introduced a compulsory test to evaluate the background of the candidates wishing to enrol in one of the degree programmes. The test has three editions (September, November and December) and is based on 40 multiple-choice items covering three areas: Logic (12 items, 30%), Reading (10 items, 25%) and Mathematics (18 items, 45%). For each item, one out of five alternatives is correct, with the following scoring system: 1 if correct, 0 if blank,
We consider the participants to the main edition of the test (September), which covers almost all the enrolled students. The dataset is obtained by merging data collected at the test with the administrative data of the School of Economics. After deleting 68 foreign students (due to missing values), the dataset has 1057 observations. For these candidates, Figure 1 reports a path tree showing the frequencies of test results, enrolment decisions and credits gained during the first academic year.

Our aim is to evaluate if the pre-enrolment test is an effective predictor of gained credits in addition to background characteristics of the students already available from administrative records. It is worth to note that our analysis is restricted to students who actually enrolled; thus, it does not provide evidence on the ability of the pre-enrolment test to effectively select students.
The analysis exploits the following student variables available in the administrative records:
Pre-test variables: Female, Far-away resident (indicator for residence in the provinces of Massa-Carrara and Grosseto or in a province out of Tuscany), Type of high school (HS type: Scientific, Humanities, Technical, Other), High school irregular career (indicator for age at high school diploma Test variables: partial test scores on Logic, Reading and Mathematics; University performance variables: Credits gained during the first year (from 0 to 60).
Other pre-test variables are available, but they are not listed above as they are not statistically significant in the fitted models.
Table 1 reports the test results and the enrolment rates for students participating to the pre-enrolment assessment test in September 2008 (students with complete data). Females are slightly more numerous than males; 112 out of 1057 (11%) of the candidates are far-away residents. Most participants come from a scientific or technical high school and 136 (
Test results and enrolment decisions for students participating to the pre-enrolment assessment test in September 2008 (students with complete data). School of Economics, University of Florence.
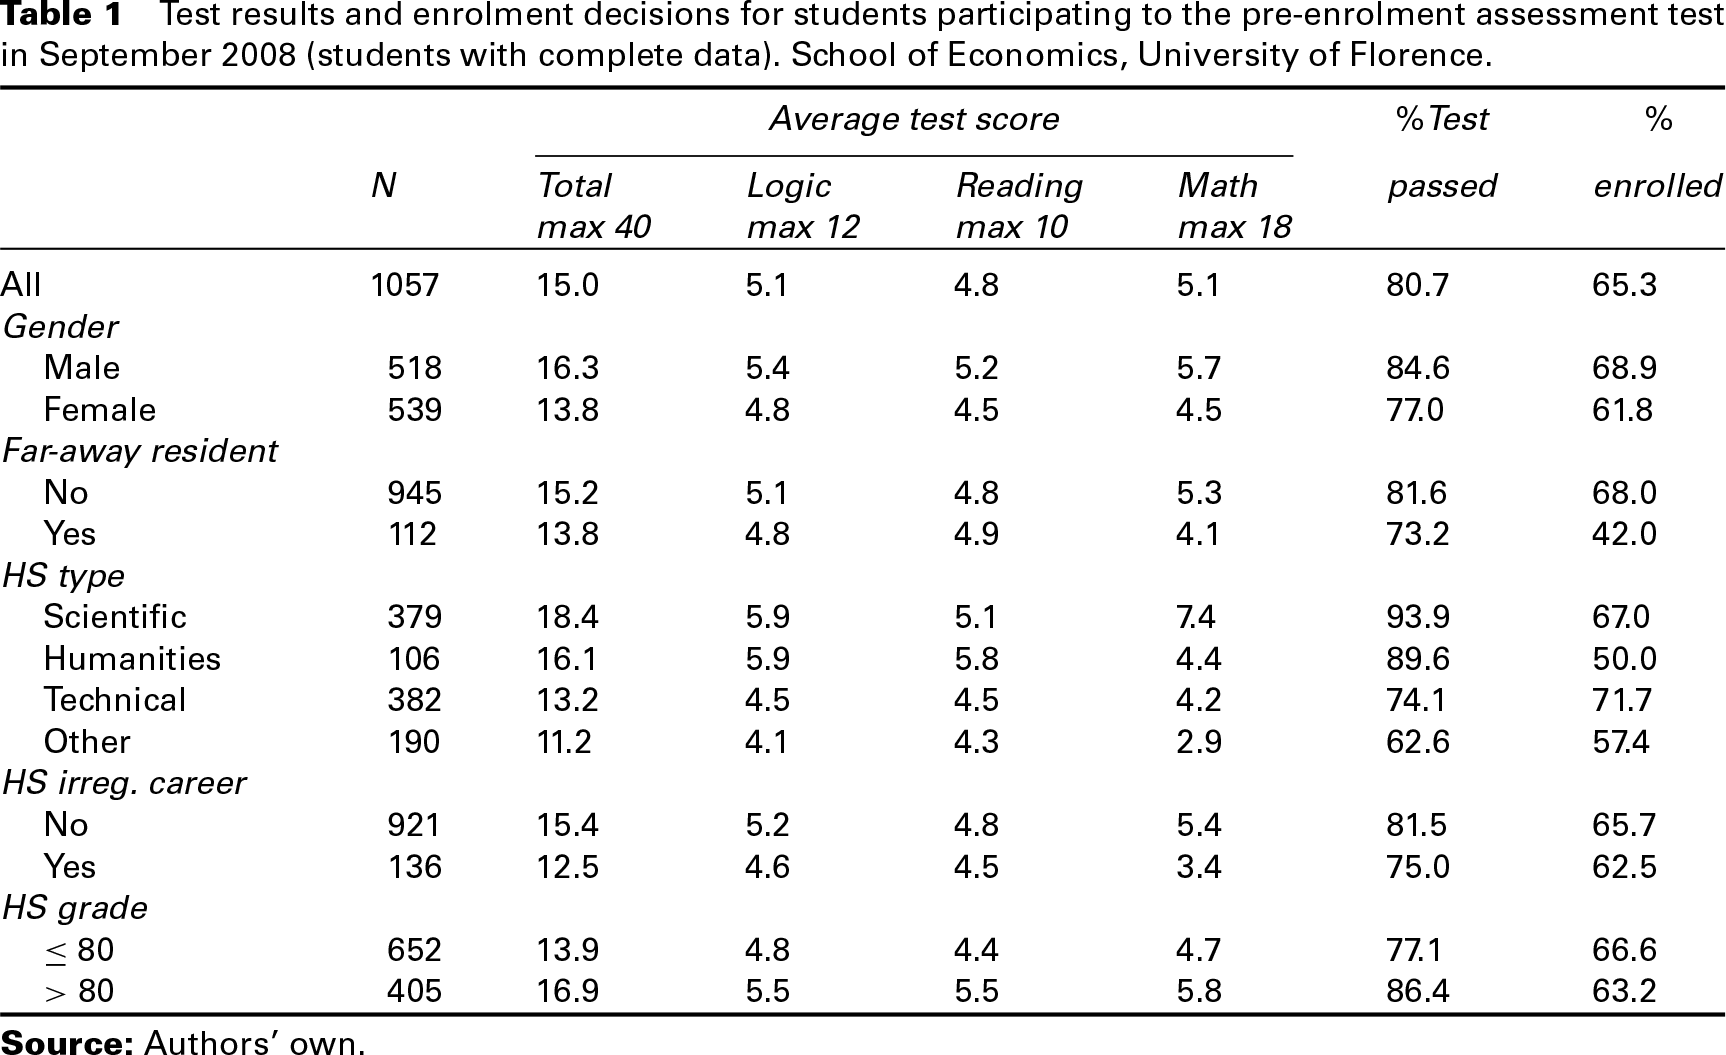
The test is passed by
The test is designed as a tool for student pre-enrolment assessment, thus passing the test is not mandatory for enrolment. However, the test result influences the probability of enrolment: the enrolment rate was
In the following, we restrict the analysis to
Gained credits after one year by pre-enrolment test result ’ academic year 2008/2009, School of Economics, University of Florence
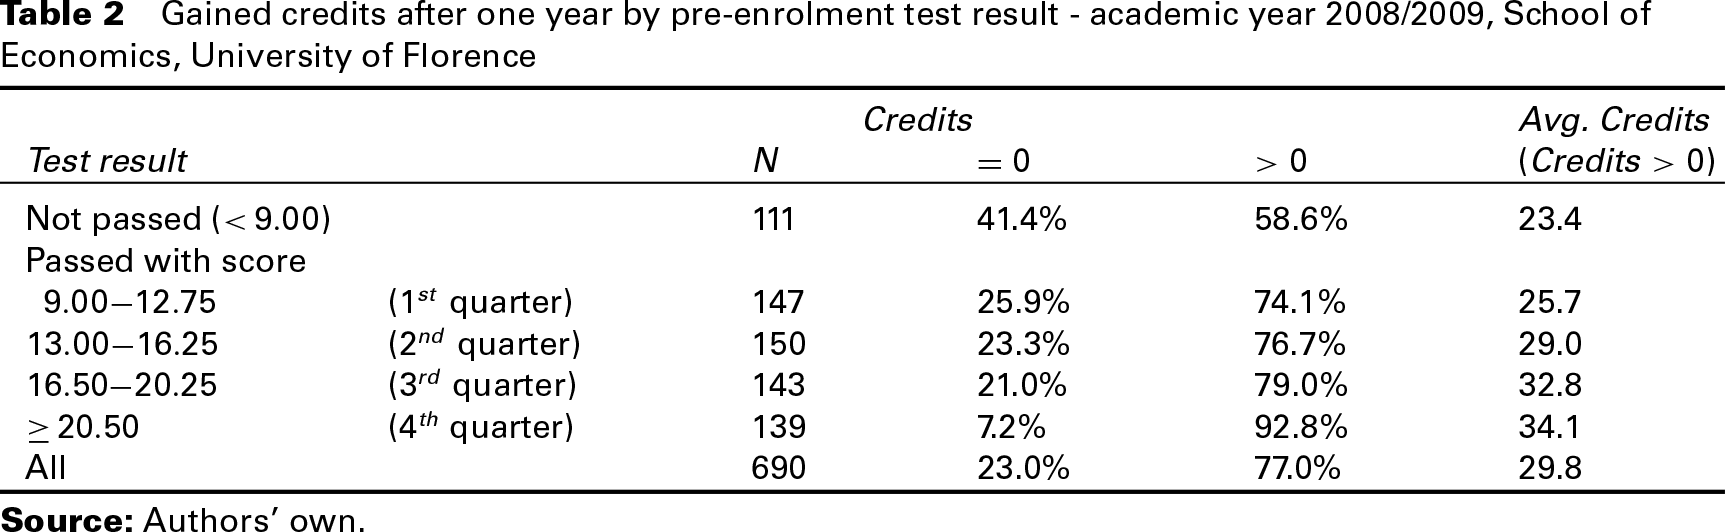
The analysis aims at evaluating whether the university pre-enrolment assessment test is a good predictor of a freshman performance in terms of gained credits. In particular, it is crucial to assess the value added by the test over background characteristics, which are easy to collect and include some ability measures such as the high school grade. To this end, we exploit a regression chain graph model where the background variables affect the test score and then both the background variables and the test score affect the freshmen performance in terms of gained credits. This approach allows us to evaluate the ability of the pre-enrolment test to predict the number of gained credits controlling for background variables. At the same time, the effects of background variables are decomposed into direct and indirect components, giving insight into the abilities measured by the pre-enrolment test.
Regression chain graph
Regression chain graphs are a class of graphical models for description of conditional independence structures. In this framework, graphical models are associated with a chain graph (Cox and Wermuth 1996; Wermuth and Sadeghi 2012), namely, a graph which may have both directed and undirected edges, but without directed cycles. These graphs are useful when the variables of interest admit a partial ordering on the basis of subject matter considerations, such as timing. Variables are partitioned into blocks and the variables belonging to the same block are considered to be of equal standing. By convention, blocks are ordered from right to left: the right-most block includes pure explanatory variables, the left-most block includes pure response variables, whereas the middle blocks hold intermediate variables, which are responses with respect to variables in blocks on the right and explanatory variables for the variables in blocks on the left. Variables belonging to different blocks are either disconnected or joined by an arrow representing a conditional dependence; an arrow between two variables is traced when the corresponding regression coefficient is statistically significant at a given level, such as
As later shown in Figure 3, in our application the variables are partitioned into three blocks according to time ordering: (i) pre-test characteristics (pure explanatory variables); (ii) standardized test scores (intermediate variables); and (iii) gained credits after one year (pure response variable). The pre-test variables in the right-most block are regarded as fixed for analysis; thus, their relationships with each other are not represented and the block is enclosed in double lines, as in Cox and Wermuth (1996).
The middle box in Figure 3 includes the three partial scores on Logic, Reading and Math. The scores have been standardized to make them comparable. The use of the standardized partial scores instead of the raw total score has the merit of giving insight into the role of the three subject areas and avoiding the implicit weighting due to the different number of items of the areas. The standardized test scores in the middle block are connected by dashed lines to denote that they are associated conditionally on pre-test variables (Wermuth and Sadeghi 2012). Accordingly, the standardized scores are jointly regressed on pre-test variables via a multivariate regression model.
The number of gained credits is regressed on test and pre-test variables using the two-part logit-quantile regression model defined in the following subsection.
Two-part model: Logit specification for the zeros and quantile regression for positive counts
The model for the pure response variable (left-most block in Figure 3) has to account for the peculiar pattern of gained credits after one year reported in Figure 2. In particular, the distribution of gained credits shows an excess of zeros (23% of freshmen did not gain any credit). Moreover, exams have different credits, usually 6, 9 or 12, thus the distribution of positive credits is quite irregular: the main peaks are at 6, 15, 24, 36 and 45 credits, depending on the path followed by the student. Considering the 531 students gaining at least one credit, the median is
In order to allow the zeros and the positives to come from two different data-generating processes, we specify a two-part or hurdle model (Mullahy 1986) with two components: a model for the probability of gaining at least one credit, 

As for the second sub-model,
The methodology of quantile regression is well established for continuous outcomes, whereas the extension to count data raises several issues. The main difficulty is that the conditional quantile function of a discrete random variable cannot be a continuous function of the regression parameters. Here, we rely on the proposal of Machado and Santos Silva (2005), which is based on smoothing the counts through jittering in order to obtain a continuous working variable. Jittered data can be generated by adding a uniform random variable 
It is worth to note that quantile regression for counts refers to a standard count variable with support
The conditional quantile function of the count variable 

In linear quantile regression, local model fit for each quantile 

The results of the quantile regression for counts can be summarized in many ways. Following Machado and Santos Silva (2005), we will report the partial effects of the covariates on the quantiles of the continuous jittered variable
In our two-part specification, the quantile regression model for counts (3.2) is fitted on the subset of students who gained at least one credit (
A relevant use of the proposed two-part model is in making predictions, for example predicting the outcome for a hypothetical new unit with covariate vector
Let us denote with 

The marginal quantiles (3.6) can be used to make predictions after plugging in parameter estimates. For example, a point-wise prediction could be based on the median (
The analysis is based on
The regression chain graph depicted in Figure 3 is obtained by fitting a multivariate linear regression model for the three test scores and the two-part model of Section 3.2 for gained credits. An arrow between two variables is traced when the corresponding regression coefficient is statistically significant at
Let us consider in detail the results of the regression models for pre-enrolment assessment test scores (Section 4.1) and for gained credits (Section 4.2).
Pre-enrolment assessment test scores
The results of the multivariate linear regression of pre-enrolment assessment test scores on background characteristics are reported in Table 3. The pre-test variables explain a small part of the variability of the standardized test scores, with
Multivariate linear regression of pre-enrolment assessment test scores (middle block of Figure 3) on background characteristics (right-most block). Parameter estimates (standard errors in parenthesis, coefficients with
-value
printed in italics).
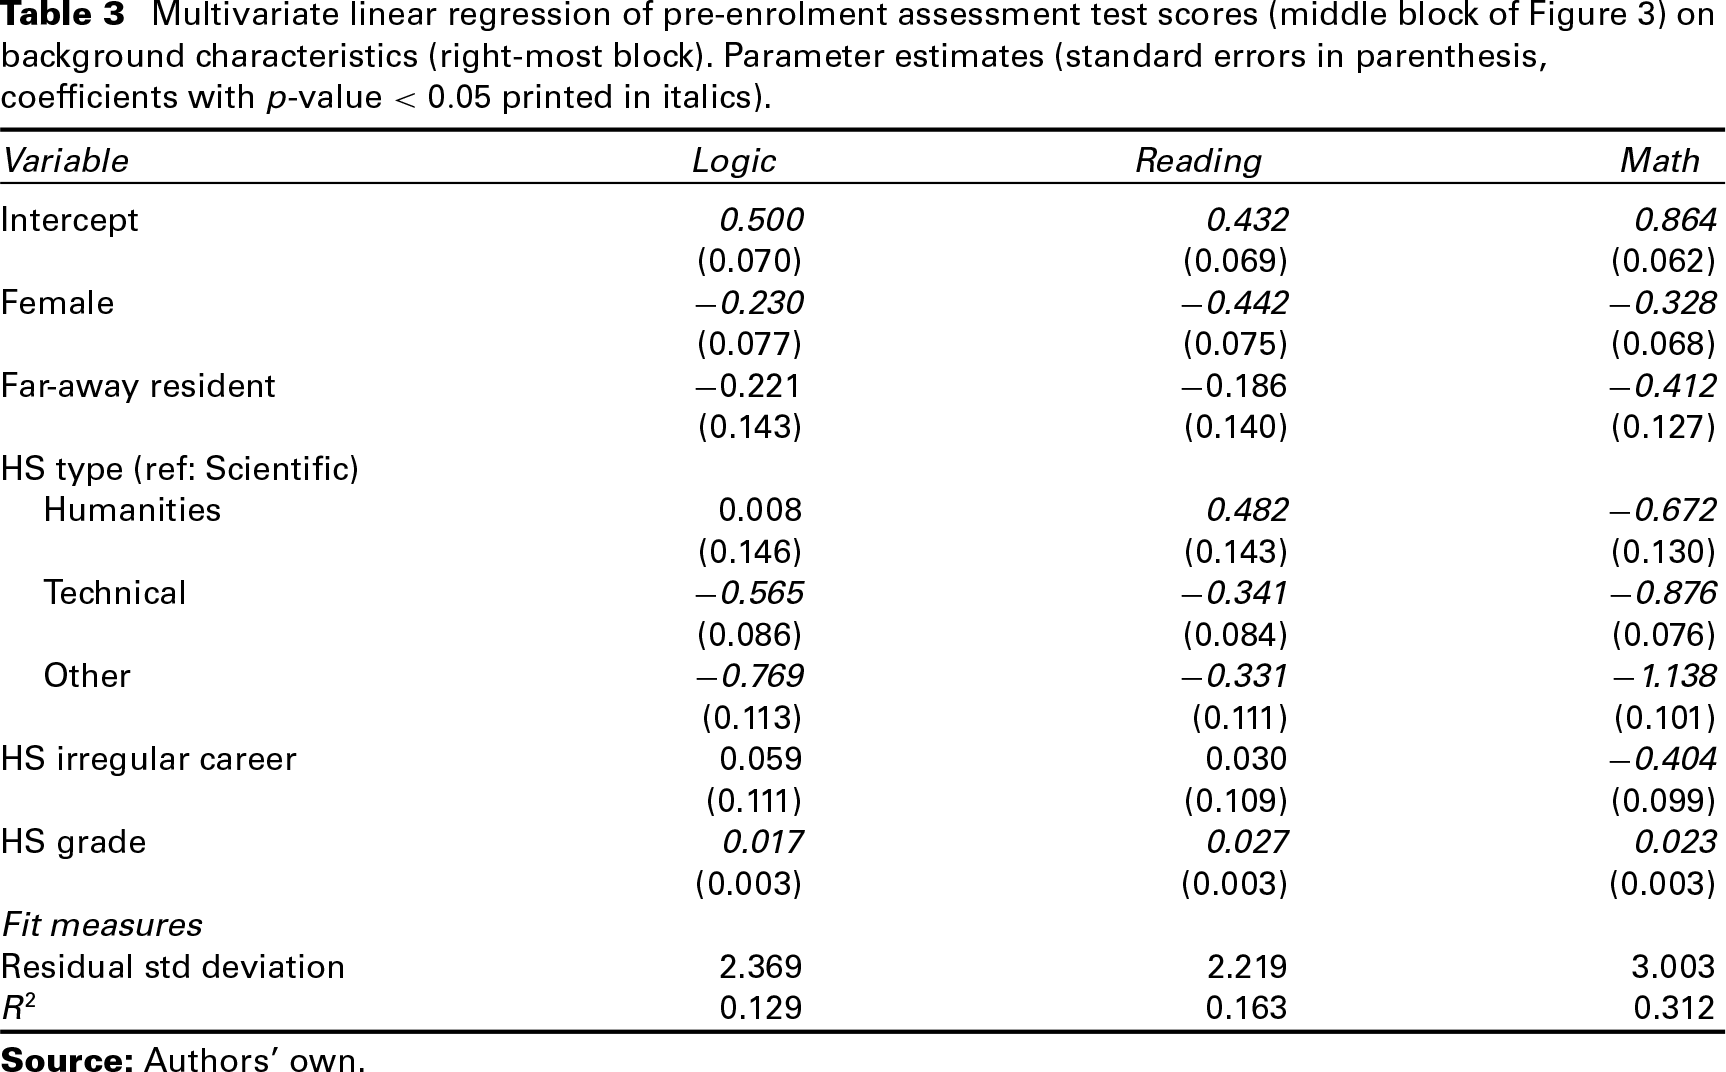
Multivariate linear regression of pre-enrolment assessment test scores (middle block of Figure 3) on background characteristics (right-most block). Parameter estimates (standard errors in parenthesis, coefficients with
-value
printed in italics).
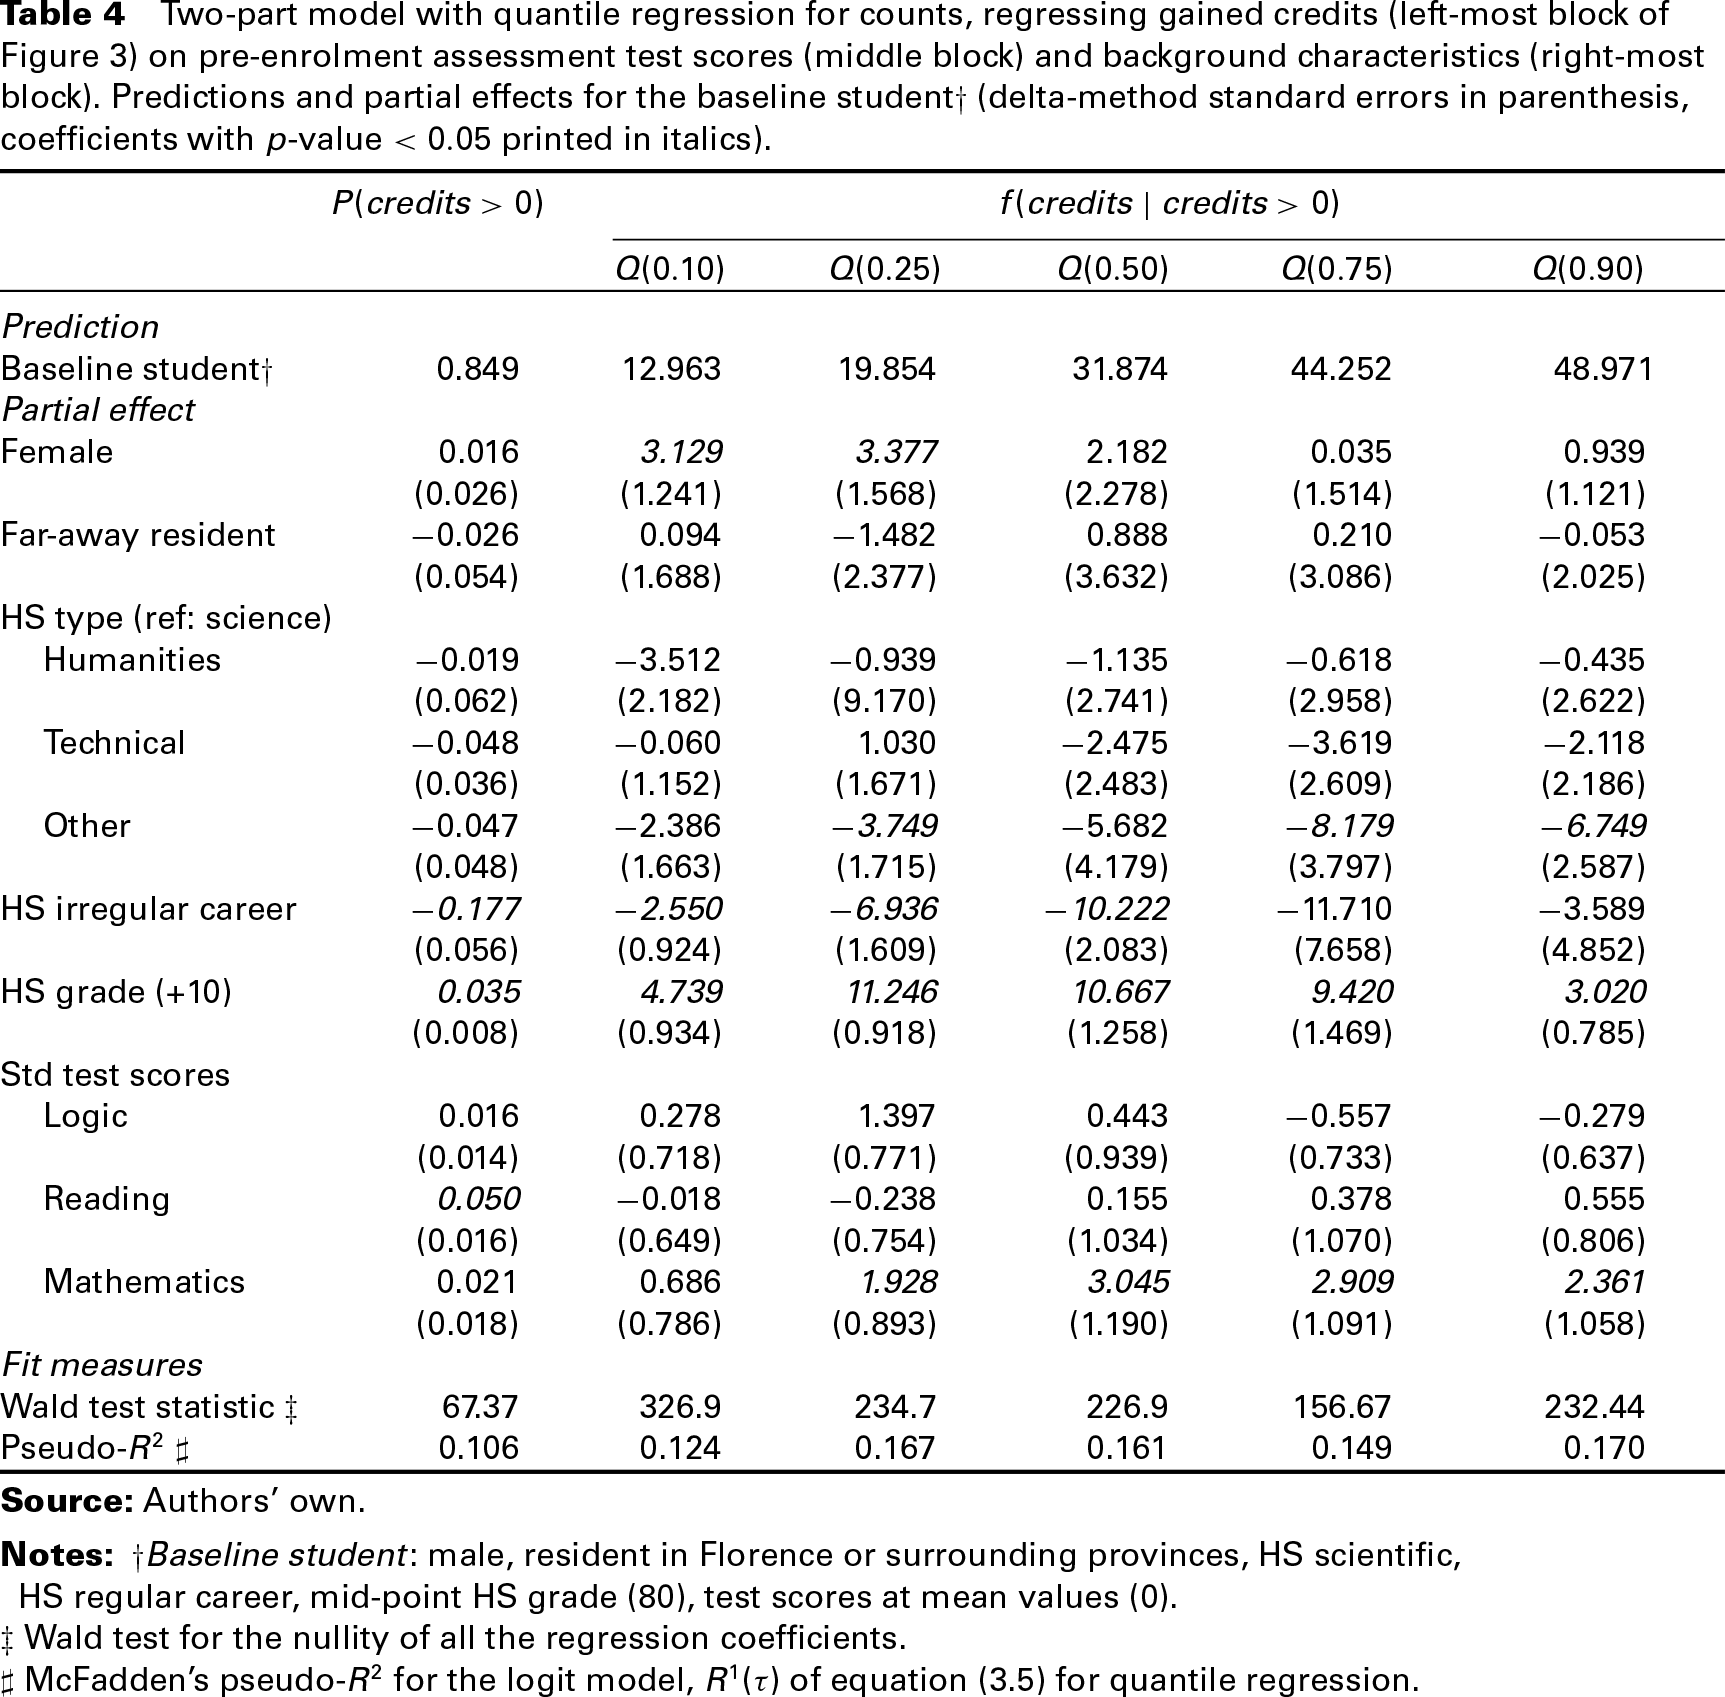
The results of the two-part model for gained credits defined by equations (3.1) and (3.2) are shown in Table 4. Since the model parameters are not directly interpretable, we report the partial effects defined in Section 3.2. The partial effects have been evaluated at
Two-part model with quantile regression for counts, regressing gained credits (left-most block of Figure 3) on pre-enrolment assessment test scores (middle block) and background characteristics (right-most block). Predictions and partial effects for the baseline student
(delta-method standard errors in parenthesis, coefficients with
-value
printed in italics).
Two-part model with quantile regression for counts, regressing gained credits (left-most block of Figure 3) on pre-enrolment assessment test scores (middle block) and background characteristics (right-most block). Predictions and partial effects for the baseline student
(delta-method standard errors in parenthesis, coefficients with
-value
printed in italics).
HS regular career, mid-point HS grade (80), test scores at mean values (0).
Wald test for the nullity of all the regression coefficients.
♯ McFadden's pseudo-R2 for the logit model, R1(τ) of equation (3.5) for quantile regression.
The Wald test statistics for the nullity of all the regression coefficients are high for both components of the two-part model. In particular, the covariates jointly have a significant effect at all the considered quantiles. Moreover, the pseudo-
The baseline student has a predicted probability of gaining at least one credit equal to

Let us now consider the positive part of the distribution of gained credits, namely, columns
The only pre-test characteristic having an effect on all the considered quantiles is the high school grade; the effect of a ten-point increase is about
The bottom part of Table 4 shows the partial effects of the three test scores. The standardized test score on Math has a significant effect, even controlling for pre-test covariates. Perhaps surprisingly, the scores on Reading and Logic do not contribute to predict gained credits when adjusting for Math and pre-test covariates. Estimated quantiles of the conditional distribution

In order to predict the number of gained credits for a hypothetical student with covariate vector
In summary, the two-part model shows that the pre-enrolment test adds some information to predict student performance. In particular, students with a higher score on Reading have a higher probability of gaining at least one credit, whereas students with a higher score on Math on average gain a higher number of credits during the first year. Thus, students with difficulties in Reading have lower chances to start up their university career, while students with difficulties in Math tend to proceed slowly in the first year, likely for problems encountered in quantitative disciplines such as Math, Microeconomics and Statistics.
The paper presented an analysis of university freshmen performance based on a regression chain graph with the main purpose of evaluating the ability of the pre-enrolment assessment test to predict gained credits at the end of the first year.
The regression chain graph approach allowed us to visualize the assumptions on the ordering of the variables and to easily communicate the results of the analysis. Variables have been collected in three blocks: pre-test student characteristics, test scores, and gained credits. The estimated chain graph showed the decomposition of the effects of pre-test variables into direct effects and indirect effects mediated by test scores.
The number of gained credits has been modelled by a two-part model with a logit specification for the zeros and a quantile regression for positive counts. This specification allowed us to separately model the probability of zero credits and the positive part of the distribution of credits, explicitly taking into account the discrete nature of gained credits and avoiding distributional assumptions. The modelling strategy proved to be simple and effective, thus it should be considered also for other types of applications involving zero-inflated count data.
Our analysis exploited the approach of Machado and Santos Silva (2005) to quantile regression for counts, which involves adding uniform random noise (jittering). This noise induces a perturbation, which is proportionally larger for small counts. However, in our application the effect on the estimated quantiles is likely to be negligible, since the estimator is averaged over
The analysis on gained university credits confirmed the predictive role of background characteristics such as the high school grade and the regularity of the school career. Moreover, the analysis showed that the pre-enrolment assessment test designed by the School of Economics of the University of Florence gives additional information. Thus, the test results can be effectively added to background characteristics to yield valuable indications for student tutoring: in particular, a low Reading score is related to a difficult start-up, while a low Math score is related to a slow progression.
Footnotes
Acknowledgments
The research has been supported by the Italian government's project Futuro in Ricerca 2012 entitled Mixture and latent variable models for causal inference and analysis of socio-economic data (RBFR12SHVV).