




Abstract
Graphical network inference is used in many fields such as genomics or ecology to infer the conditional independence structure between variables, from measurements of gene expression or species abundances for instance. In many practical cases, not all variables involved in the network have been observed, and the samples are actually drawn from a distribution where some variables have been marginalized out. This challenges the sparsity assumption commonly made in graphical model inference, since marginalization yields locally dense structures, even when the original network is sparse. We present a procedure for inferring Gaussian graphical models when some variables are unobserved, that accounts both for the influence of missing variables and the low density of the original network. Our model is based on the aggregation of spanning trees, and the estimation procedure on the expectation-maximization algorithm. We treat the graph structure and the unobserved nodes as missing variables and compute posterior probabilities of edge appearance. To provide a complete methodology, we also propose several model selection criteria to estimate the number of missing nodes. A simulation study and an illustration on flow cytometry data reveal that our method has favourable edge detection properties compared to existing graph inference techniques. The methods are implemented in an R package.
Introduction
Motivations
Graphical models have been extensively studied and used in a wide variety of contexts to represent complex dependency structures. In many practical cases however, it is more than likely that some variables involved in the network were in fact not observed. Such missing variables are interpreted as actors that were not measured but nonetheless influence the measurements, or experimental conditions that were not taken into account.
Structure inference aims at unrevealing independence between subsets of variables (e.g., pairs)–conditional on all other observed ones. When some variables are missing, the inference is carried out in a distribution from which they have been marginalized out. Thus, two variables correlated to a missing one will appear to be ‘conditionally’ dependent based on the observed sample, which misleads the interpretation of dependency structure.
The existence of unobserved variables can be naturally encompassed in the graphical model framework by assuming there exists a ‘full’ graph describing the conditional independence structure of the joint distribution of observed and hidden variables. Observations are then samples of the marginal distribution of the observed variables only. From a graph-theoretical point of view, marginalizing hidden variables means removing them from the node set and marrying their children together, thus forming complete subgraphs, that is, cliques. Hence, the conditional independence structure among the observed variables is described by a marginal graph containing locally dense structures. This violates the sparsity assumption on which the majority of graph inference methods are based. Moreover, an identifiability problem arises in the hidden variable setting, since infinitely many full graphs induce the same marginal structure.
In this article, we are interested in both checking if some variables are indeed missing in the graph and, if it is the case, inferring the complete graphical model. We address these problem in the context of Gaussian graphical models.
Incomplete Gaussian graphical models
Consider a multivariate Gaussian random vector parametrized by its precision matrix

where

where

where

The precision matrix

From (1.4) and the Schur complement formula (Boyd and Vandenberghe, 2004, Example 3.15) we deduce that the marginal distribution of the observed variables is

The conditional independence structure of

Methods to perform graphical model inference with unobserved variables have been proposed in the past. Some use the expectation-maximization (EM) algorithm (Dempster et al., 1977), its variational approximation described in Beal and Ghahramani (2003), or the Bayesian structural EM algorithm (Friedman, 1998). A lot of attention has also been brought to a regularized approach described in Chandrasekaran et al. (2012), based on the analysis of the sum of low-rank and sparse matrices. Alternatives based on this method were also proposed by Meng et al. (2014), Lauritzen and Meinshausen (2012) and Giraud and Tsybakov (2012)
A major concern in the latent variable framework is identifiability; in general, identifiability constraints are very complex, as those derived in Chandrasekaran et al. (2012) for their model, which rely on algebraic geometry properties of low-rank and sparse matrices. On the contrary, in the particular case of trees (acyclic graphs), the conditions for identifying the joint graph from the marginal graph only, described in Pearl (1988), are very simple. In this article, we propose to exploit this property to build an inference strategy based on the EM algorithm and spanning trees.
Latent tree models were studied in the context of phylogenetic tree learning; the neighbor-joining algorithm (Saitou and Nei, 1987) among others is a popular method in this field. More recently, a method called recursive grouping was proposed in Choi et al. (2011) to reconstruct tree structures from partially observable data. We emphasize the fact that all these methods learn a single tree from data. In the present, we take advantage of two key properties of tree-structured graphical models. First, we can specify under which conditions they remain identifiable in presence of missing variables. Second, treating trees as random, we can easily integrate over the whole set of spanning trees, thanks to an algebra result called the Matrix-Tree theorem (Chaiken, 1982). To our knowledge, no method for latent variable graphical model inference is based on mixtures of trees, which constitute the main novelty of our approach.
Our contribution can be casted in the framework of Meilăa and Jordan (2000), who considered a special mixture of Bayesian networks Geiger and Heckerman, 1996) where each network involved in the mixture is tree-shaped. Meilăa and Jordan (2000) show the interest of such a model both in terms of tractability and interpretation. Meilăa and Jaakkola (2006) also use the same framework to estimate the joint distribution of the observed variables and variables and Shiers et al. (2016) aim at characterizing such distributions, but none of them is interested in the inference of the structure of the graphical model itself. The first difference with these tree-based methods is that we do not limit ourselves to a fixed number of trees but consider a mixture over all possible trees. Second, and more importantly, we extend the framework to the hidden variable setting.
Our inference strategy is based on the EM algorithm. The computations at the E-step are tractable thanks to the Matrix-Tree theorem, which enables us to integrate over the whole set of spanning trees, as opposed to the M step of Meilăa and Jordan (2000) that relies on the Chow–Liu algorithm (Chow and Liu, 1968). This approach enables us to compute posterior probabilities of edge appearance, as proposed by Schwaller et al. (2015) in the fully observable setting. To our knowledge, no other existing approach provides such an edge-specific measure of reliability. The final inference of the graph relies on the ranking of these probabilities, therefore we estimate graphs with general structures, though our method is based on trees. Although we mostly focus on the inference of the graph structure, we also obtain an estimate of the precision matrix of the joint distribution of the observed and hidden variables, as a by-product of the EM algorithm.
Our first contribution is to define, in Section 2, a latent tree aggregation model for graphical model inference in the presence of hidden variables and to give identifiability conditions. In Section 3, we introduce our procedure based on the EM algorithm to infer the parameters of the joint distribution and probabilities of edge appearance, and to estimate the number of missing nodes. In Section 4 we show on synthetic data that our method compares favourably to competitors in terms of edge detection. Finally we illustrate the procedure with a flow cytometry data analysis in Section 5.
Latent tree aggregation model
Identifiability conditions
Assume the ‘full graph’

The following conditions on
For all
For all
Two nodes connected by an edge are neither perfectly independent nor perfectly dependent.
These conditions stem from the simple graphical properties of spanning trees. Indeed, the maximal cliques of a tree are of size two, therefore if (a) no edge connects two hidden nodes and (b) all hidden variables have at least three neighbours, there is exactly one hidden node for every clique of size more than or equal to
Effect of marginalizing one hidden variable (h). Full graph (all edges except blue), marginal graph (all edges except red) (see online for colour images)

Effect of marginalizing one hidden variable (h). Full graph (all edges except blue), marginal graph (all edges except red) (see online for colour images)
We now turn to the description of our latent tree aggregation model, and start with a simple procedure where we infer a single tree structure. Let

In the complete data setting where

From these two results, we can derive an EM algorithm to infer the tree-structured graph underlying the distribution of
E-step: Evaluation of the conditional expectation of the complete log-likelihood with respect to the current value

M-step: Maximization of (2.2) with respect to
The inference method described above is very simple, but the tree assumption is restrictive, and we expect poor results when it is violated. To overcome this, we choose to treat

Prior information about the existence of each edge is easily encoded in a distribution of this form, and a non-informative choice of prior is to set the

We develop this random unknown tree model further in Section 3 where we propose an inference procedure. For every possible edge

that we interpret as edge specific probabilities of appearance. First, we derive conditional distributions that will be necessary. In particular, we show that these distributions factorize over the edges.
Let us first compute the joint distribution of

On the one hand,

where


and finally

We obtain that the conditional distribution

We also need to compute the normalizing constant of

Those constants can be computed with the same complexity as a determinant, that is, in


In Section 3, we will need to compute similar quantities after removing a given edge. Furthermore, we will need to compute such a quantity for all possible edges. This can be achieved in an efficient manner for all edges at a time thanks to a corollary of Theorem given in Kirshner (2007), Theorem 3.
EM algorithm
Because the proposed model involves unobserved variables, the EM algorithm (Dempster et al., 1977) is a natural framework to carry the inference out. Importantly, two hidden layers appear in the model: the latent tree
E-step: Evaluation of all the conditional moments involved in the the conditional expectation of the complete log-likelihood with the current value

M-step: Maximization of (3.1) with respect to
We now give the details of how those two steps are performed.
E-step: The conditional expectation of the complete log-likelihood writes

Thanks to the tree structure of the graphical model, we have a simple form for the latter term:

where

As explained in Section 2, the diagonal term
E-step: Combined with

where the normalizing constant does depend on

where all
agraph Initialization: The behaviour of the EM-algorithm is known to strongly depend on its starting point. Our initialization strategy is described in Appendix 9.
In this section, we derive a series of quantities of interest for practical inference.
agraph Edge probability: In the perspective of network inference, we need to compute the probability for an edge to be part of the tree given the observed data, that is, for edge

This probability can be computed for all edges at a time in
agraph Conditional entropy of the tree: We are also interested in the variability of the distribution of the tree given the observed data, measured by its entropy. Denoting

which can be computed with complexity
Because our model involves two hidden variables (

For the second term, we observe that the conditional distribution of

agraph Model selection: We now turn to the estimation of the unknown number of hidden nodes

Note that the maximized log-likelihood can be computed as

In the context of classification, Biernacki et al. (2000) introduced an Integrated Complete Likelihood (ICL) criterion where the conditional entropy of the hidden variable is added to the penalty. The rationale behind ICL is a preference for models with lower uncertainty for the hidden variables. Because we are mostly interested in network inference, it seems desirable to penalize only for the conditional entropy of the tree. This leads to the following criterion

where

Experimental set-up
Data synthesis in our framework requires the simulation of a graph and of a sparse inverse covariance matrix with matching support. We simulated graphs of two different structures which are given in Figure 2, namely a random tree and an Erdös–Renyi graph with density 0.1 containing

We measure the difficulty of detecting the second term

As it increases, the amplitude of the signal coming from the marginalized nodes indeed increases compared to the signal coming from the observed nodes. We control this ratio by multiplying terms in the precision matrix by a constant

In the experiments we will consider two settings where
Two graph structures used for simulation: Tree (left) and Erdös with
(right) (see online for colour images)
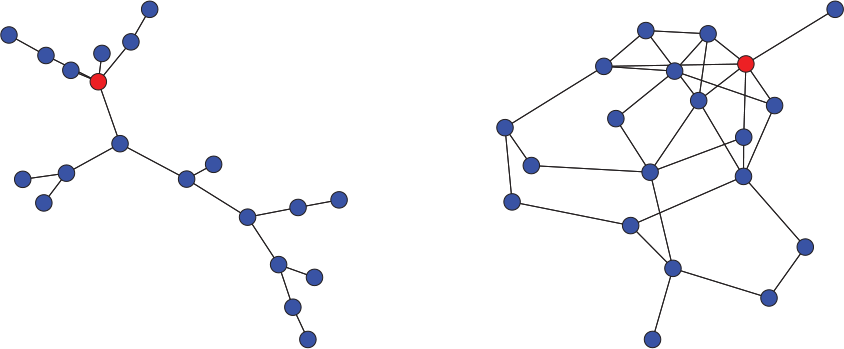
Two graph structures used for simulation: Tree (left) and Erdös with
(right) (see online for colour images)
We focus this experiment on the ability to recover existing edges of the network, that is, the nonzero entries of the concentration matrix. This is a binary decision problem where the compared algorithms are considered as classifiers. The decision made by a binary classifier can be summarized using four numbers: True Positives (
Simulation results for
. Top: Tree; Bottom: Erdös. Left: ROC for the full graph. Centre: ROC for the marginal graph; Right: spurious edges. Comparison of EM-Tree Aggregation (dots), EM-Glasso (stars), EM-Chow–Liu (squares), Glasso (crosses) and Chow–Liu (triangles)
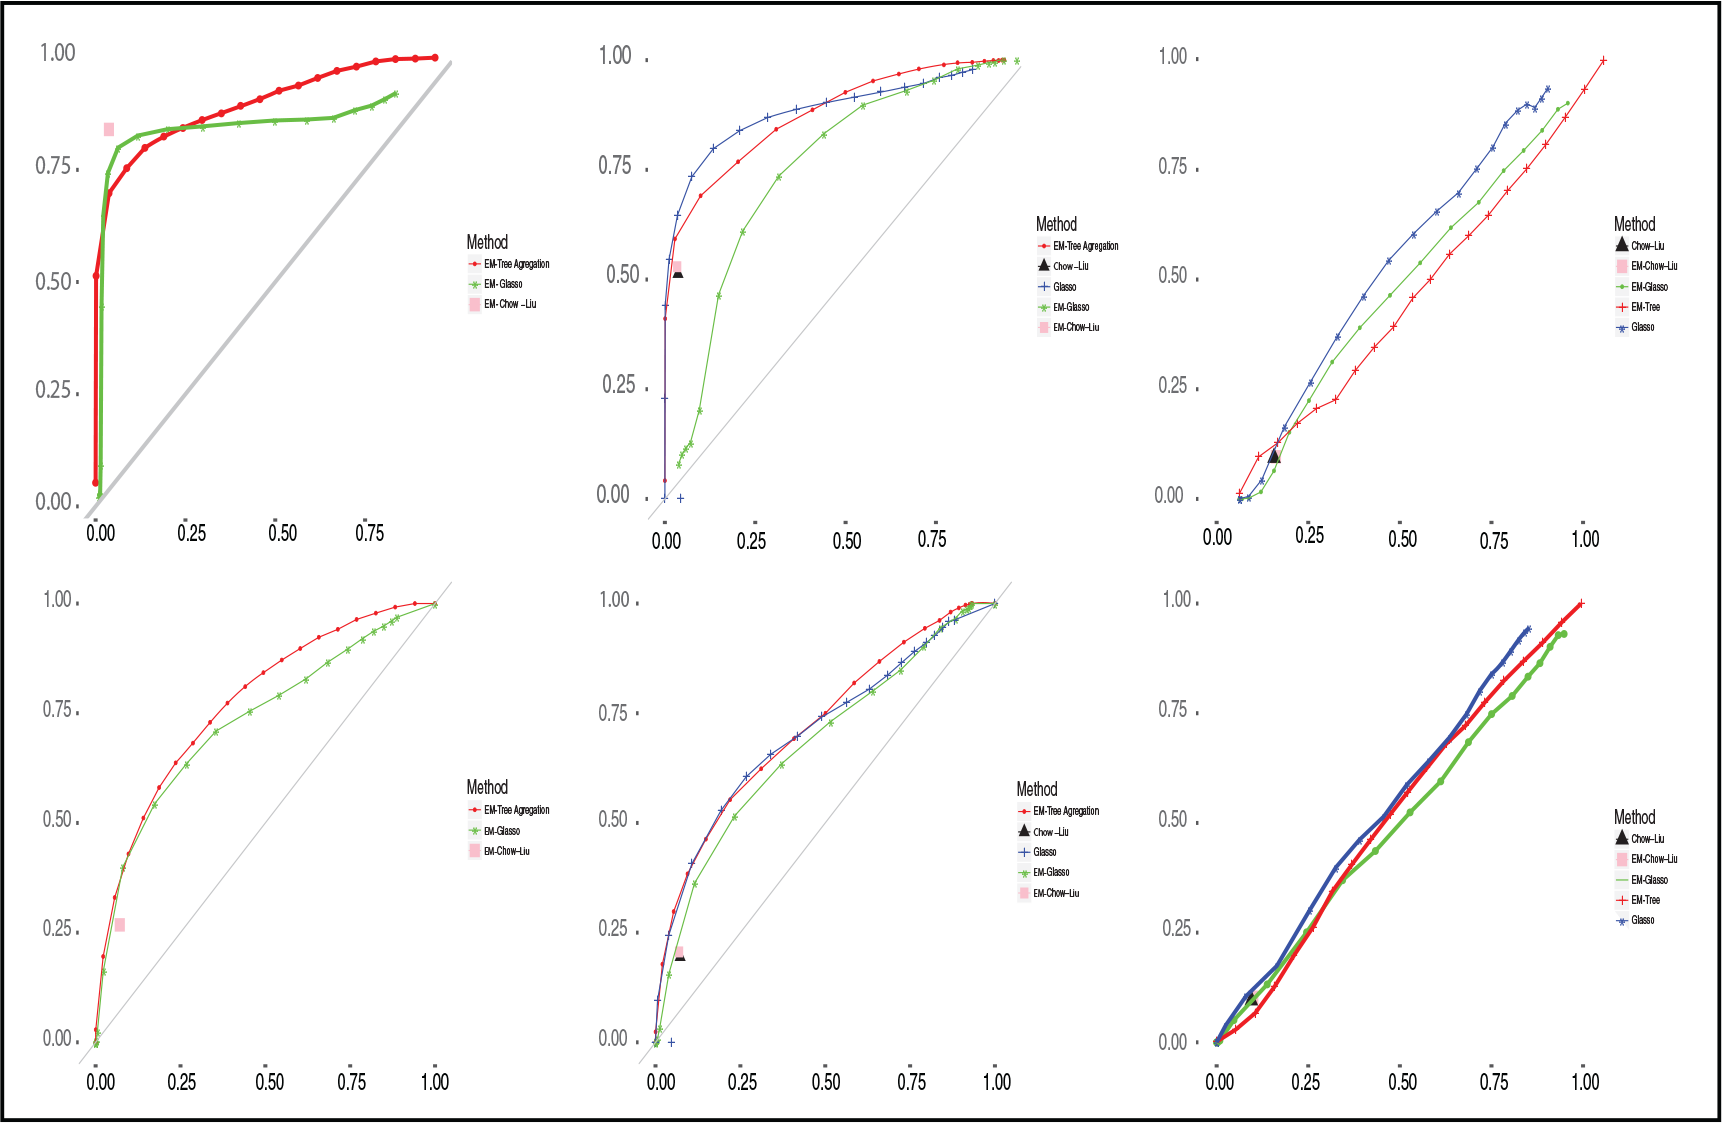
Simulation results for
. Top: Tree; Bottom: Erdös. Left: ROC for the full graph. Centre: ROC for the marginal graph; Right: spurious edges. Comparison of EM-Tree Aggregation (dots), EM-Glasso (stars), EM-Chow–Liu (squares), Glasso (crosses) and Chow–Liu (triangles)
Simulation results for
. Top: Tree; bottom: Erdös. left: ROC for the full graph. Centre: ROC for the marginal graph; right: spurious edges. Comparison of EM-Tree Aggregation (dots), EM-Glasso (stars), EM-Chow–Liu (squares), Glasso (crosses) and Chow–Liu (triangles)

The results are displayed in Figures 3 and 4. The Chow–Liu algorithm and its EM version are very fast to converge and provide very similar solutions of the inference problem. On the marginal graph, even when the true model is a tree, both algorithms do not seem to provide better results than Glasso. Glasso and Tree Aggregation perform equally well, and better than EM-Glasso, at inferring the marginal graph. On the full graph Tree Aggregation performs slightly better than EM-Glasso, which tends to overestimate the number of children of the missing node and therefore has a higher false positive rate. This is in accordance with its underlying model, which assumes that all observed nodes have a hidden parent. Each of these false positive edges in the complete graph induces several false positive edges in the marginal graph. Interestingly, though Tree Aggregation is tailored to infer the full graph, it performs as well as Glasso at predicting the marginal graph, which is the primary target of Glasso. In terms of computation time, the tree-based approaches range in the expected order, that is, Chow–Liu
Computational times averaged over
replications (tree, n = 200, p = 20, SNR = 10)

We also studied how influential is the initialization step. More specifically, we studied how far are the final results of Tree Aggregation from the initial point. The initialization provides cliques containing initial neighbours for the unobserved nodes. To assess how far the algorithm gets from its starting point, we sort the estimated weights of the edges coming from the unobserved node. Then, we compute the average rank (rescaled between 0 and 1) of the edges corresponding to the initial clique among these weights. An average rank close to zero indicates that the initial edges still have the highest weights, whereas as a value close to one means that they have the lowest weights. The results given in Table 2 show that, in all cases, the initial edges have a mean rank close to
Average rank of the initial clique (50 replications)

We now assess the performance of the proposed model selection criteria on the same simulated datasets, in which
Model selection. Left block: Tree; right block: Erdös. Top: BIC; bottom: ICL. Within block left:
, right:
. Dotted line: true number of missing nodes

Model selection. Left block: Tree; right block: Erdös. Top: BIC; bottom: ICL. Within block left:
, right:
. Dotted line: true number of missing nodes
We repeat the experiment, this time without marginalizing any node. The results shown in Figure 6 show that the BIC criterion does not detect any hidden node, contrary to the ICL criterion. Nonetheless the values of ICL for 0, 1, 2 and 3 hidden nodes are much tighter than in the previous example.
Model selection. Left block: Tree; right block: Erdös. Within block left: BIC, right: ICL. Dotted line: true number of missing nodes

We illustrate our method with an application to cellular network inference, where the missing variables can be understood as proteins or experimental conditions that were not measured but nonetheless influence the results of the experiments. We applied our procedure to the inference of the Raf cellular signalling network based on flow cytometry data. The Raf network is implied in the regulation of cellular proliferation. The data were collected by (Sachs et al., 2005) and later used by (Werhli et al., 2006) and (Schwaller et al., 2015) in network inference experiments. Flow cytometry measurements consist in sending unique cells suspended in a fluid through a laser beam, and measuring parameters of interest by collecting the light re-emitted by the cell by diffusion or fluorescence. In this study, the parameters of interest are the activation level of
Gold standard for Raf pathway. (a) Full graph (hidden node in red); (b) marginal graph (see online for colour images)

Gold standard for Raf pathway. (a) Full graph (hidden node in red); (b) marginal graph (see online for colour images)
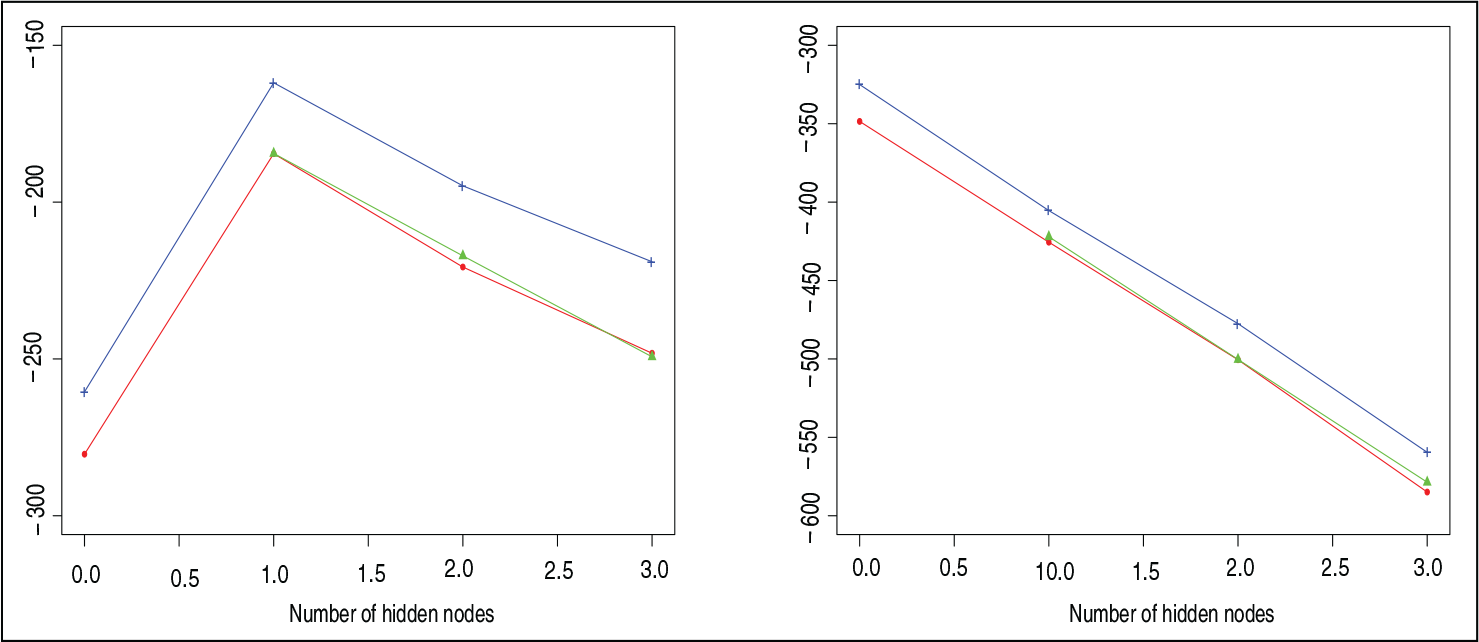
Using hierarchical clustering initialization, we inferred models with
Selection of the number of hidden nodes (BIC: crosses,
: points,
: triangles). Left: when removing one protein. Right: complete dataset
The performances of the methods described in Section 4 are compared on this example in Figure 9. The results are similar to those obtained in the simulation study. The proposed latent tree-based approach performs better than the EM-Glasso when trying to infer the full graph. The methods also perform well for the marginal graph. In terms of spurious edges, Tree Aggregation displays a plateau, along which the inclusion of spurious edges is delayed compared to Glasso and EM-Glasso.
ROC curves for the full (left), marginal (centre) graphs and spurious edges (right). EM-Tree-Aggregation (points), EM-Glasso (stars), EM-Chow-Liu (square), Chow-Liu (triangle), Glasso (crosses), Recursive Grouping (diamond)

Finally, we analysed the complete dataset from Sachs et al. (2005), without removing any node. Model selection criteria are given in Figure 8 (right): they all agree on the absence of a missing node, which is consistent with the biological consensus on the Raf pathway.
We proposed a method for graphical model inference with missing variables. Uncovering such a latent structure provides additional hints in the interpretation of the underlying graphical model. For example, the inference of a missing variable allows to pinpoint a group of observed variables, which are related to this unobserved variable.
Our procedure relies on spanning trees and the computations are performed efficiently using the Matrix-Tree theorem. We have defined a model with a two-layer hidden structure where the graph as well as the missing nodes are treated as latent variables. We derived conditional distributions of the latent variables given the observations and developed an inference procedure based on the EM algorithm. We also proposed three model selection criteria to determine the presence of a hidden structure, as well as the choice of the number of missing variables. We observed on a simulation study that the tree constraint, that we overcome by computing posterior edge probabilities, is not too costly in practice. An implementation of the method is publicly available through the R package
Computation of the conditional distributions
We show that the conditional distribution of the tree given the observations factorizes over the edges of the tree.

We first focus on the 
which finally gives with 
which gives

The approximation mentioned in Section 3 arises precisely here, where 
where 
We need to set the derivative of the objective function

Initialization
As the EM-algorithm is highly dependent on its starting point, initialization should be carefully undertaken. As a consequence, although this step is overlooked in most publications, we choose to describe it precisely in this appendix. In our case, it requires an initial graph structure as well as initial values for the missing nodes. Our initialization scheme relies on three stages. First, we perform a clustering step and treat the clusters as groups of nodes which share a hidden parent. Then, we initialize the missing variables as the first principal component of the matrix containing their children. Finally, from this completed data, we infer an initial tree using the Chow–Liu algorithm.
Let us now describe the details of the clustering procedure. We span all the possible triplets of nodes and merge together the triplet for which the assumption that they had a common hidden parent resulted in the biggest gain in terms of likelihood of the observed realizations. Once the ‘best’ triplet is selected, we can repeat the same procedure iteratively in order to form clusters in a hierarchical manner. At every level of the hierarchy, we have a set of cliques in which the nodes share the same parent and a set of nodes that have not yet been assigned to a clique. For computational reasons, we restricted the search to the triplets in which at least one pair of nodes was connected by an edge in the current estimate of the structure. The likelihood gain induced by merging two cliques was penalized for the complexity of the model with the BIC criterion (Schwarz, 1978). We show in Figure A.1 the dendrogram obtained with this hierarchical clustering procedure and the cliques (coloured nodes) obtained by cutting the hierarchy at the level chosen with BIC. This was done on synthetic data, where we generated 2 000 samples of a Gaussian network with 50 nodes.
Dendrogram of the hierarchical clustering procedure used for initialization. The coloured nodes correspond to the clusters at the height chosen with the BIC criterion (see online for colour images)

Declaration of conflicting interests
The authors declared no potential conflicts of interest with respect to the research, authorship and/or publication of this article.
Funding
The authors received no financial support for the research, authorship and/or publication of this article.
Acknowledgments
The authors received no financial support for the research, authorship and/or publication of this article.