



Abstract
With the increase of data volume in edge device, the importance of edge computing is also gradually highlighted. The demand for edge device to complete data calculation is also gradually developing. Data generated in edge computing needs real-time interaction with users, and graphical display is the most intuitive way of data interaction, but the resources of edge devices are limited. In order to realize the graphic display in the limited resources and save the limited resources, a small embedded graphics display system solution for edge computing is innovatively developed. This solution includes the overall architecture design of the graphics display system, the implementation of functional logic, animation technology, and virtual machines. The study used Bezier curves to design oscilloscope controls involved in edge display systems. The study also adopted various interpolation algorithms and introduced a spring animation that simulates physics into the interpolation algorithm. In addition, the study also designed the execution mechanism of the program virtual machine and the processing flow of the encoder. Finally, the effectiveness of the system designed by the research is verified by comparing indicators such as power consumption and performance to power ratio. According to the findings, the performance of the system designed by the research institute is 127 million pixels per second. The power consumption is 65 megawatts. The performance to power ratio is 1.95. The memory is 1.52 KB. The startup speed is 1.64 milliseconds. The frequency is 167 MHz, and the process is 110 nanometers. The average smoothness and realism of the picture after introducing spring animation are 8.8 and 10 higher than those of the picture only introducing frame insertion algorithm, respectively. It can be seen that the embedded graphics display software system for edge computing designed by the research institute has good performance and effect. The research results can be applied in edge display systems to achieve data exchange within their limited resources and have good practical application significance.
Introduction
In the new generation of information technology, the Internet of Things (IoT) is an important component. It is also a part of China’s strategic development key industries. With the development of the IoT technology, the demand of edge device for a stable human-computer interface display system is gradually emerging. Edge devices are particularly sensitive to power consumption. 1 With the continuous progress of computer technology, embedded systems for specific environments are also constantly advancing. 2 Embedded systems have the advantages of real-time response, strong anti-interference ability, and stability, and are generally run in hardware environments with limited resources. The Graphical User Interface (GUI) system in embedded scenarios has broad application areas with the development of embedded technology. There are currently many design achievements regarding GUI products. Mainstream GUI products include Qt/Embedded, MicroWindows, OpenGUI, MiniGUI, emWin, and TouchGFX. 3 However, Qt/Embedded products face certain difficulties in low-level expansion, customization, and porting. Hardware acceleration is not possible on MicroWindows products, and some algorithms have low efficiency. OpenGUI products have poor portability, and MiniGUI products also have relatively poor portability, requiring third-party image engines, and also have the problem of not being able to be applied in larger embedded systems. The GUI interface of emWin products is relatively simple and has low operational efficiency. In addition, the processing of emWin products in image display is relatively complex and heavily relies on C language development. The development of TouchGFX products is difficult, and the hardware platforms that can support the product are also relatively limited. Some foreign researchers have also proposed using the curve number method to calculate GUI. Some scholars have also designed an open-source GUI for crystal screening. 4 However, these GUI products also have certain issues, such as inability to obtain source code, slightly complex systems, and lack of flexibility in configuration. 5 In addition, in the edge display scenario that focuses on hardware resources, the waste of resources caused by redundant functions in the development of lightweight and highly specialized GUI systems is fatal, and this is also the main problem that needs to be addressed at present. Based on these problems, a small embedded graphics display system solution for edge computing is innovatively developed. Unlike existing research, the research and development system places great emphasis on resource conservation. The research first designed and implemented the overall architecture and functional logic of the graphic display system, and then used Bessel curves to design the oscilloscope controls involved in the edge display system. The study also adopted various interpolation algorithms and introduced a spring animation that simulates physics into the interpolation algorithm. In addition, the study also designed the execution mechanism of the program virtual machine and the processing flow of the encoder. The purpose of the research is to develop a small embedded graphics display system solution for edge computing, save resources in edge devices, realize graphics display in limited resources, and meet the current needs of edge display embedded graphics development. There are two innovative points in the research. The first point is the introduction of a spring animation that simulates physics in the interpolation algorithm, and the second point is the use of Bessel curves to display the display function of oscilloscope controls. The first part is a review of related research on embedded graphic display software systems. The second part is the construction process of an embedded graphics display software system. The third part is the result analysis of the embedded graphics display software system. The fourth part is the conclusion.
Related works
With the development of the IoT and embedded technology, the design of embedded graphic display software systems is also gradually evolving. The research related to it is also gradually enriching. Dong and other researchers proposed an alternative solution to meet the encryption requirements on embedded graphics processing unit devices. 6 This scheme has been customized to optimize the performance of various platforms, including a new parallel method for register constraints. According to the findings, the power consumption of the proposed alternative solution is approximately 14 W. Li et al. proposed a visual classifier based on deep learning (DL) from a holistic perspective to better detect rainwater in real-time. 7 This method has been tested on different embedded computing systems. The research results show that its performance is superior to the most advanced methods in the past. Experts such as Arias-Garcia et al. proposed a large interval classifier based on Gabriel diagrams to apply delay sensitivity in embedded systems. 8 The nearest neighbor method is used as the decision rule. According to the findings, it has better performance for machine learning delay sensitive applications. To improve the energy efficiency of distributed learning, Hong and Yue proposed an Efficient Grad for training deep convolutional neural network. 9 The core of this algorithm is to use two observations. The results show that the Efficient Grad has significant advantages in energy efficiency, which is three times better than existing methods. Ponzina and other scholars proposed an embedded integrated neural network to reduce the error caused by operating embedded systems under conditions below the nominal value. 10 The integration of convolutional neural network is conceived through architecture design. According to the findings, the maximum energy-saving effect of the proposed method can reach 89%. It can minimize the impact of errors on accuracy to the greatest extent possible. Nataraj and other experts proposed an embedded digital display and alarm system based on a microcontroller to measure the wheel slip and other aspects of active farming machinery. 11 The system includes magnetic sensors, load cells, amplifiers, and proximity sensors. The research results show that the maximum deviation of the system in sliding measurement is 12.7%.
Liu et al. proposed a DL architecture based on tight junction networks to solve the computational pressure of current mobile edge algorithms. 12 By introducing it into the mobile edge algorithm, the network model was established. This algorithm takes less time than traditional algorithms, which has obvious efficiency advantages. In order to clarify the evolution mechanism of network public opinion in public emergencies, Chen M and other experts designed a method combining edge computing and deep learning, and applied this method to the emotion recognition model. In addition, this study constructs the emotional rule system in the classification model through selected cases. The experimental results show that the recognition performance of this method is significantly superior to existing methods and has good recognition performance. 13 Liu and other scholars proposed a depth Q network and a depth deterministic strategy gradient algorithm to minimize the communication and computing delay in the mobile edge computing network of the maritime UAV group. 14 The experimental results show that this algorithm can minimize system latency. In order to protect data and information in the Internet of Things, experts such as Zhang P introduced edge computing to protect network privacy through edge computing. The research results show that the introduction of edge computing in the Internet of Things can not only protect privacy but also reduce communication costs such as delay and bandwidth of the Internet of Things. 15 Yang and Thapliyal explained the benefits of combining approximate calculations with adiabatic logic. 16 Two approximate adders based on adiabatic logic have been proposed, namely, true and approximate adders and true carry approximate adders. According to the findings, the two proposed approximate adders can effectively save energy and power. Liu and other scholars proposed a differential privacy quadtree partition algorithm to protect the user privacy in the location data publishing. 17 This method can effectively protect user privacy and improve query accuracy.
In summary, there is currently a wealth of research on embedded graphic display software systems both domestically and internationally. However, these studies also have certain problems, such as the inability to obtain source code for the designed embedded graphics display system, the slightly complex system, and the lack of flexibility in configuration. Based on these issues, an innovative solution for a small embedded graphics display system dedicated to edge computing has been developed. It includes the overall architecture of edge-oriented computing graphics display systems, functional logic, animation technology, and virtual machines.
Solution design of embedded graphics display software system for edge computing
Based on the requirements of edge device in human-computer interaction, an embedded graphic display software system for edge computing is designed. The structure of the display system is described. In addition, the core of the display system is designed with emphasis, mainly including functional logic, animation technology, and virtual machines. For different kernels, different design methods are adopted in the study.
Overall architecture and functional logic design of edge display system
For the design of edge display software system, it is mainly described from the structure of the entire software system. The edge display system, as a simple closed-loop system, can provide corresponding feedback for different types of input data.
18
The main structure of the edge display system includes three parts: input, kernel, and display. There are different ways of connecting different parts. In addition, different parts of the interior also have different functions. Figure 1 depicts the specific structure of the edge display system. Specific structure of the edge display system.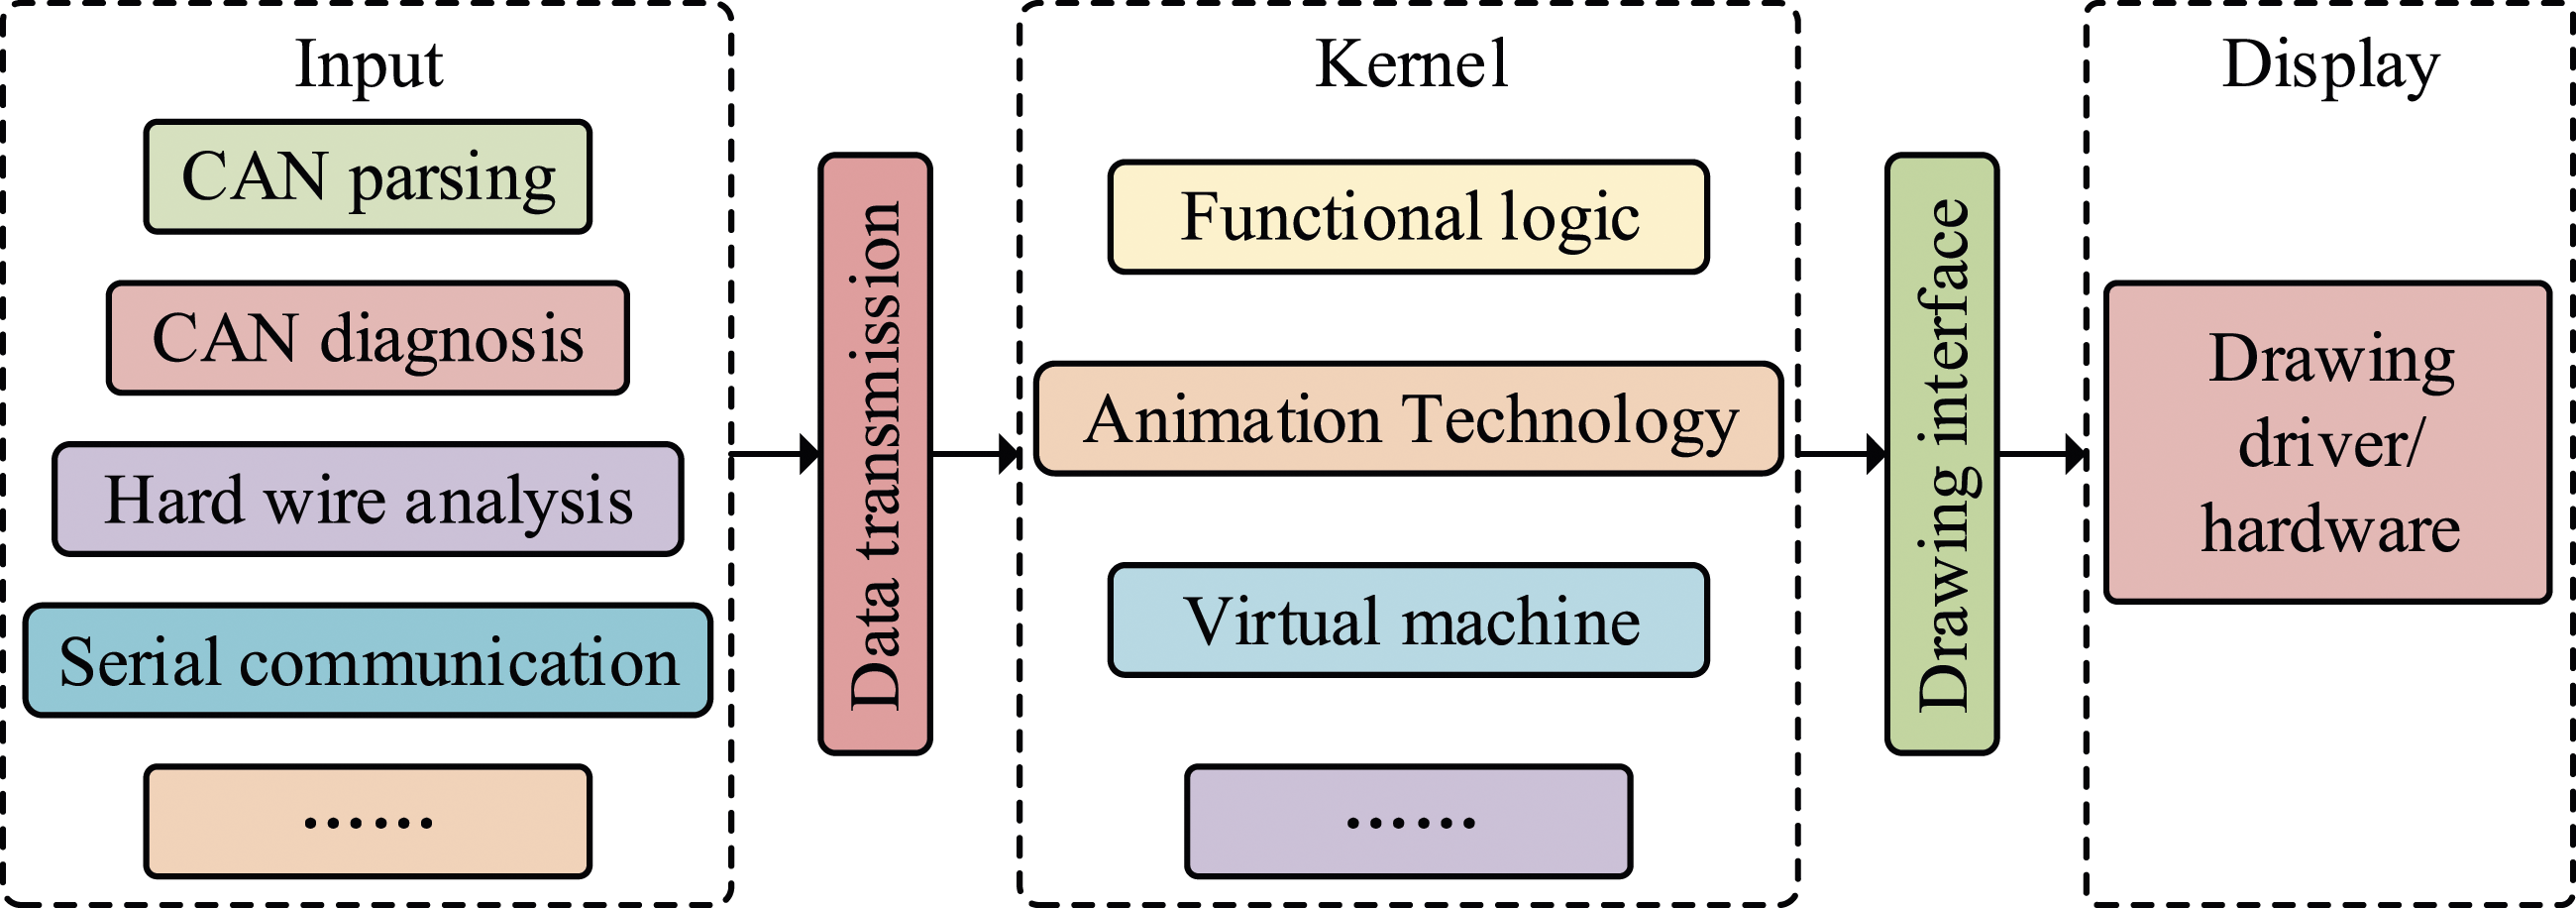
In Figure 1, the input part of the edge display system mainly includes four aspects, namely, controller local network analysis, controller local network diagnosis, hard wire analysis, and serial communication. The main function of the input section is to receive communication data, analyze parameters, and transmit information. The kernel mainly includes three aspects, namely, functional logic, animation technology, and virtual machines. The main function of this section is to generate corresponding control information. The display section mainly includes graphics drivers and hardware, presenting the final interface. The input and kernel parts are mainly connected through data transfer. The kernel and display parts are mainly connected through a drawing interface. Kernel design is the core of edge display systems. Therefore, it is thoroughly designed. The architecture of the functional logic is shown in Figure 2. Architecture of functional logic.
In Figure 2, the architecture of functional logic mainly includes pages, canvases, sub-canvases, and controls. In order to manage the four parts of functional logic, each part has a separate number. The implementation of functional logic mainly includes three modules, namely, data management, page control, and control. The variable Tag is used to represent internal data in the data management module. Variables are updated and passed on at a specific time. The variable Tag needs to contain the type and numerical value of the data itself.
19
Figure 3 depicts the specific workflow of the data management module. Specific workflow of the data management module.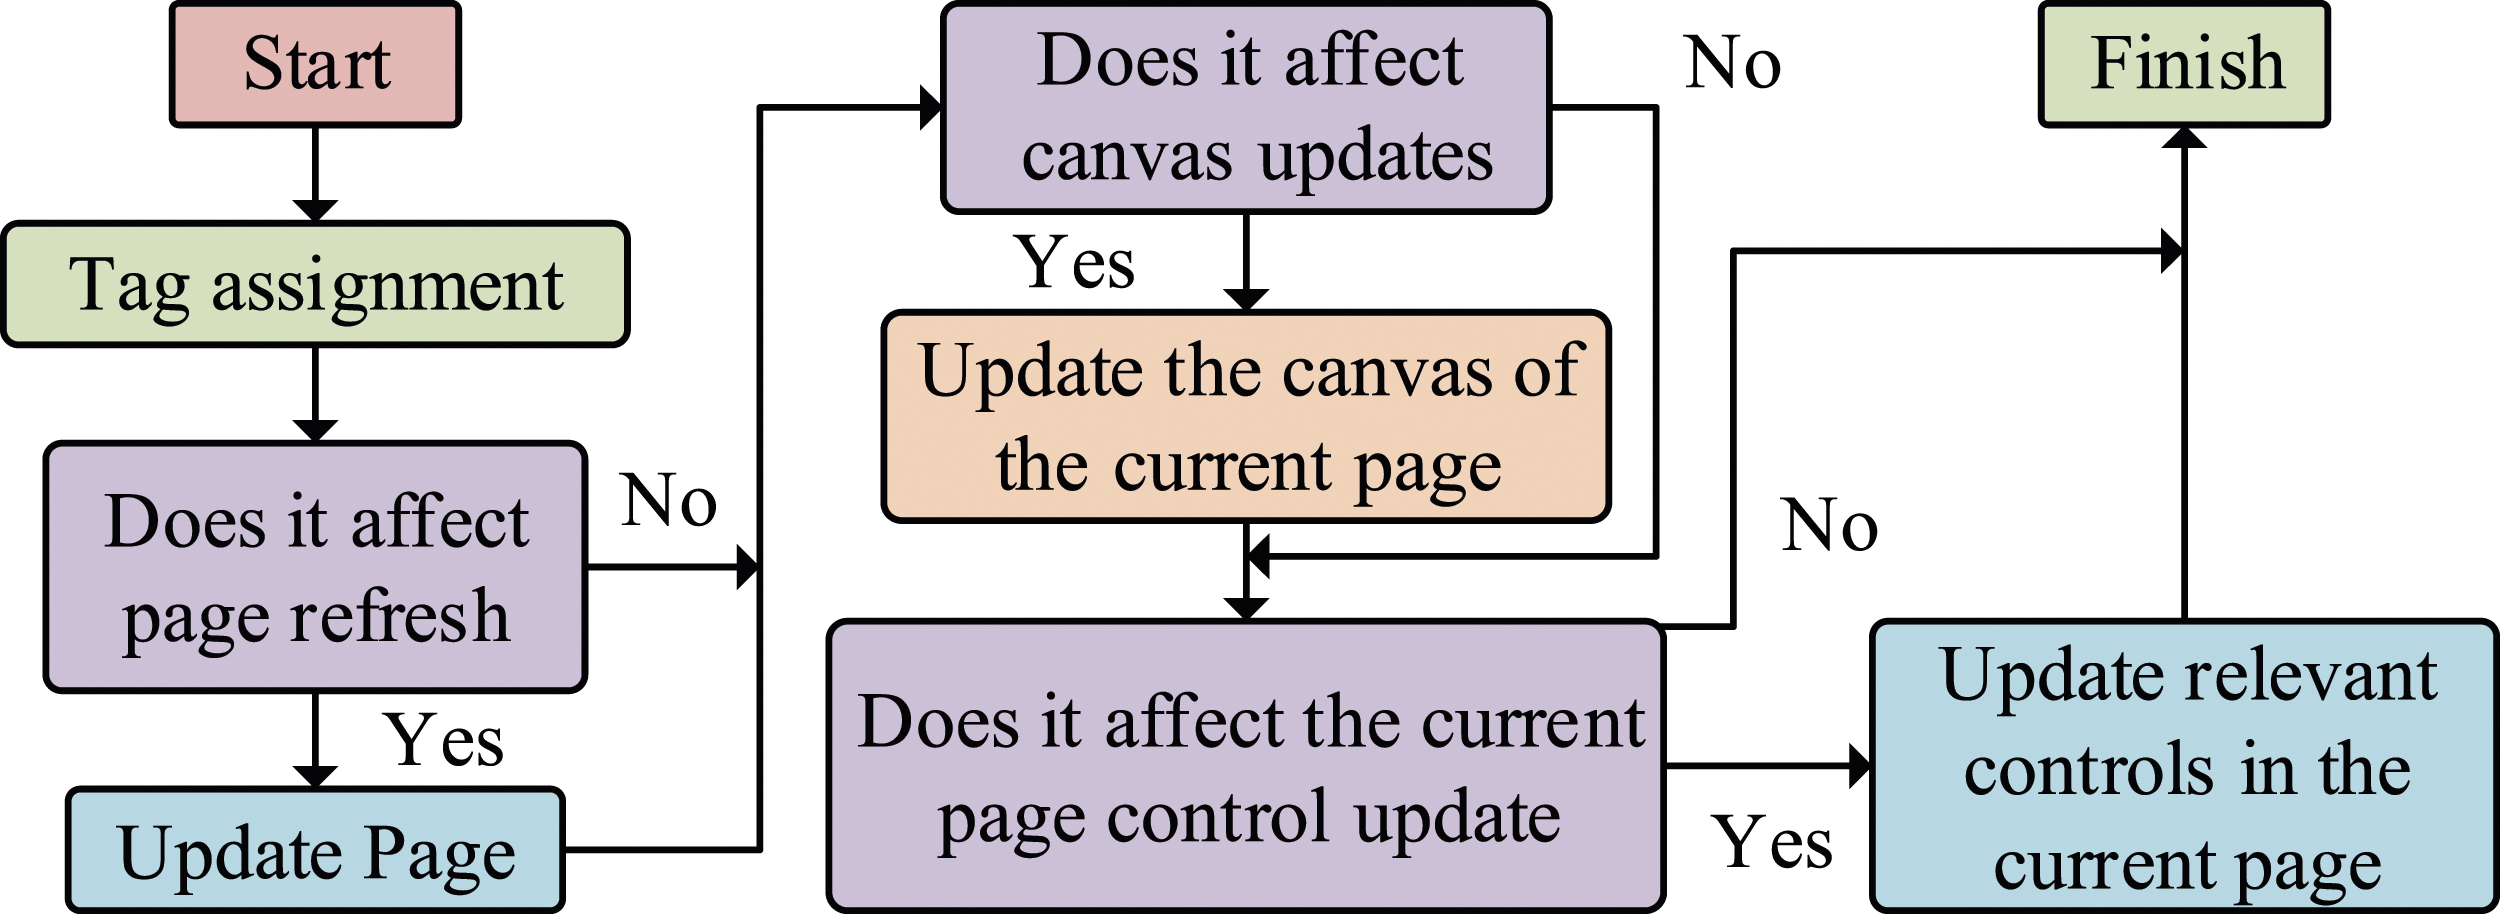
In Figure 3, the first step of the data management module is to assign a value to the Tag variable and determine whether it affects page refresh. If the Tag affects page refresh, it needs to be updated. The second step is to determine whether Tags affect canvas updates. If it affects the canvas update, the canvas of the current page is updated. The third step is to determine whether the Tag affects the update of the current page control. If it affects the update of the current page control, the relevant controls in the current page are updated. The page control module updates the organization logic, parameters, and control display of the page, canvas, and control through the refreshed tags. The first step in the workflow of the page control module is to determine whether to switch to the current page. If it is determined that switching is required, the page needs to be updated. The second step is to determine whether to switch to the current canvas on the current page. If it is determined that switching is required, the canvas in the current page is updated. The third step is to update the controls in the current canvas. Controls can generally be divided into display output type controls and human-machine interaction type controls. The first step in the workflow of the control module is to traverse all the controls. Whether there are any controls that need to be updated has been determined. The second step is to determine whether the updated control needs to be displayed and whether specific gesture actions are captured. The final step is for the program virtual machine to be informed to execute the corresponding instruction action. The edge display system designed involves many controls. Therefore, as one of the core controls, the oscilloscope control is chosen for design. The design of oscilloscope controls includes the own texture combination method and texture storage mapping. It also includes the own two display modes and display modes. The display mode of an oscilloscope involves linear display and curve display. To better demonstrate the display function of oscilloscope controls, a Bezier curve is used in the study. The first-order Bessel curve is shown in equation (1).

In equation (1),

Edge display system animation technology and virtual machine design
Animation implementation is based on the own duration and start end state, and some interpolation methods are used in this process.
20
Animation execution mainly includes five aspects, namely, animation creation, animation queue, timer refresh, animation frame real-time computing, and animation display.
21
Among them, the animation elements in the animation queue will involve state transitions. The specific animation element state transition diagram is shown in Figure 4. Specific animation element state transition diagram.
As shown in Figure 4, there are three main states of animation elements, namely, idle state, running state, and paused state. The idle state is only converted to the running state through the start command. The running state can be entered into a paused state through the pause command or into an idle state through the stop command. The paused state can be entered into the running state through the resume command, or the idle state can be entered through the stop command. The animation frame insertion algorithm plays a crucial role in the speed of animation motion. Therefore, to meet the different animation effects, multiple interpolation algorithms are chosen. The easeOut interpolation algorithm is shown in equation (3).

In equation (3),

The characteristic of the EaseInQuad interpolation algorithm is slow first and then fast. The easeInOutQuad interpolation algorithm is shown in equation (5).

The characteristic of the easeInOutQuad interpolation algorithm is slow first, then fast, and then slow. In addition to these three interpolation algorithms, there are other interpolation algorithms such as easeInCubic and easeInQuart. The interpolation algorithm selected for the study is the easeInOutQuad interpolation algorithm. To make the interaction between the display interface smoother and more natural, spring animation is added to the interpolation algorithm of the animation system. The animation changes of spring animation exhibit a cyclic feature. The rate of change is gradually decreasing. The easeOutElastic algorithm for simulating spring effects is shown in equation (6).

The animation effect of general spring animation is fixed. Real spring animation needs to consider the elasticity coefficient of the spring and the speed and mass of the object. In order to achieve the most realistic animation effect, a spring animation that simulates physics is used. Spring systems generally have two states, namely, stable state and initial state. Spring systems generally include springs, moving objects, and rigid walls. The spring force

In equation (7),

In equation (8),

Based on Newton’s second law

In equation (10),

In equation (11),

After transforming equation (12), equation (13) can be obtained.

The characteristic equation of equation (13) is

In equation (14),


The results of Execution mechanism of the program virtual machine.

In Figure 5, the first step in the execution mechanism of the program virtual machine is to initialize the virtual machine. The second is to process the bytecode in the virtual machine action processor and output the corresponding virtual machine instructions. Virtual machines can generally be divided into two categories, namely, register-based virtual machines and stack-based virtual machines. Register-based virtual machines are used for research. This virtual machine contains three universal registers. The virtual machine instruction system is divided into two parts: basic instructions and extended instructions. The basic instructions are consistent with those in real computers. Extension instructions are relatively few. The requirement for human-machine interaction is designed as an extension instruction for virtual machines. The main task of the edge display system virtual machine compiler is to convert completed behavioral logic using virtual machine bytecode. Figure 6 illustrates the processing flow of the encoder. Encoder processing flow.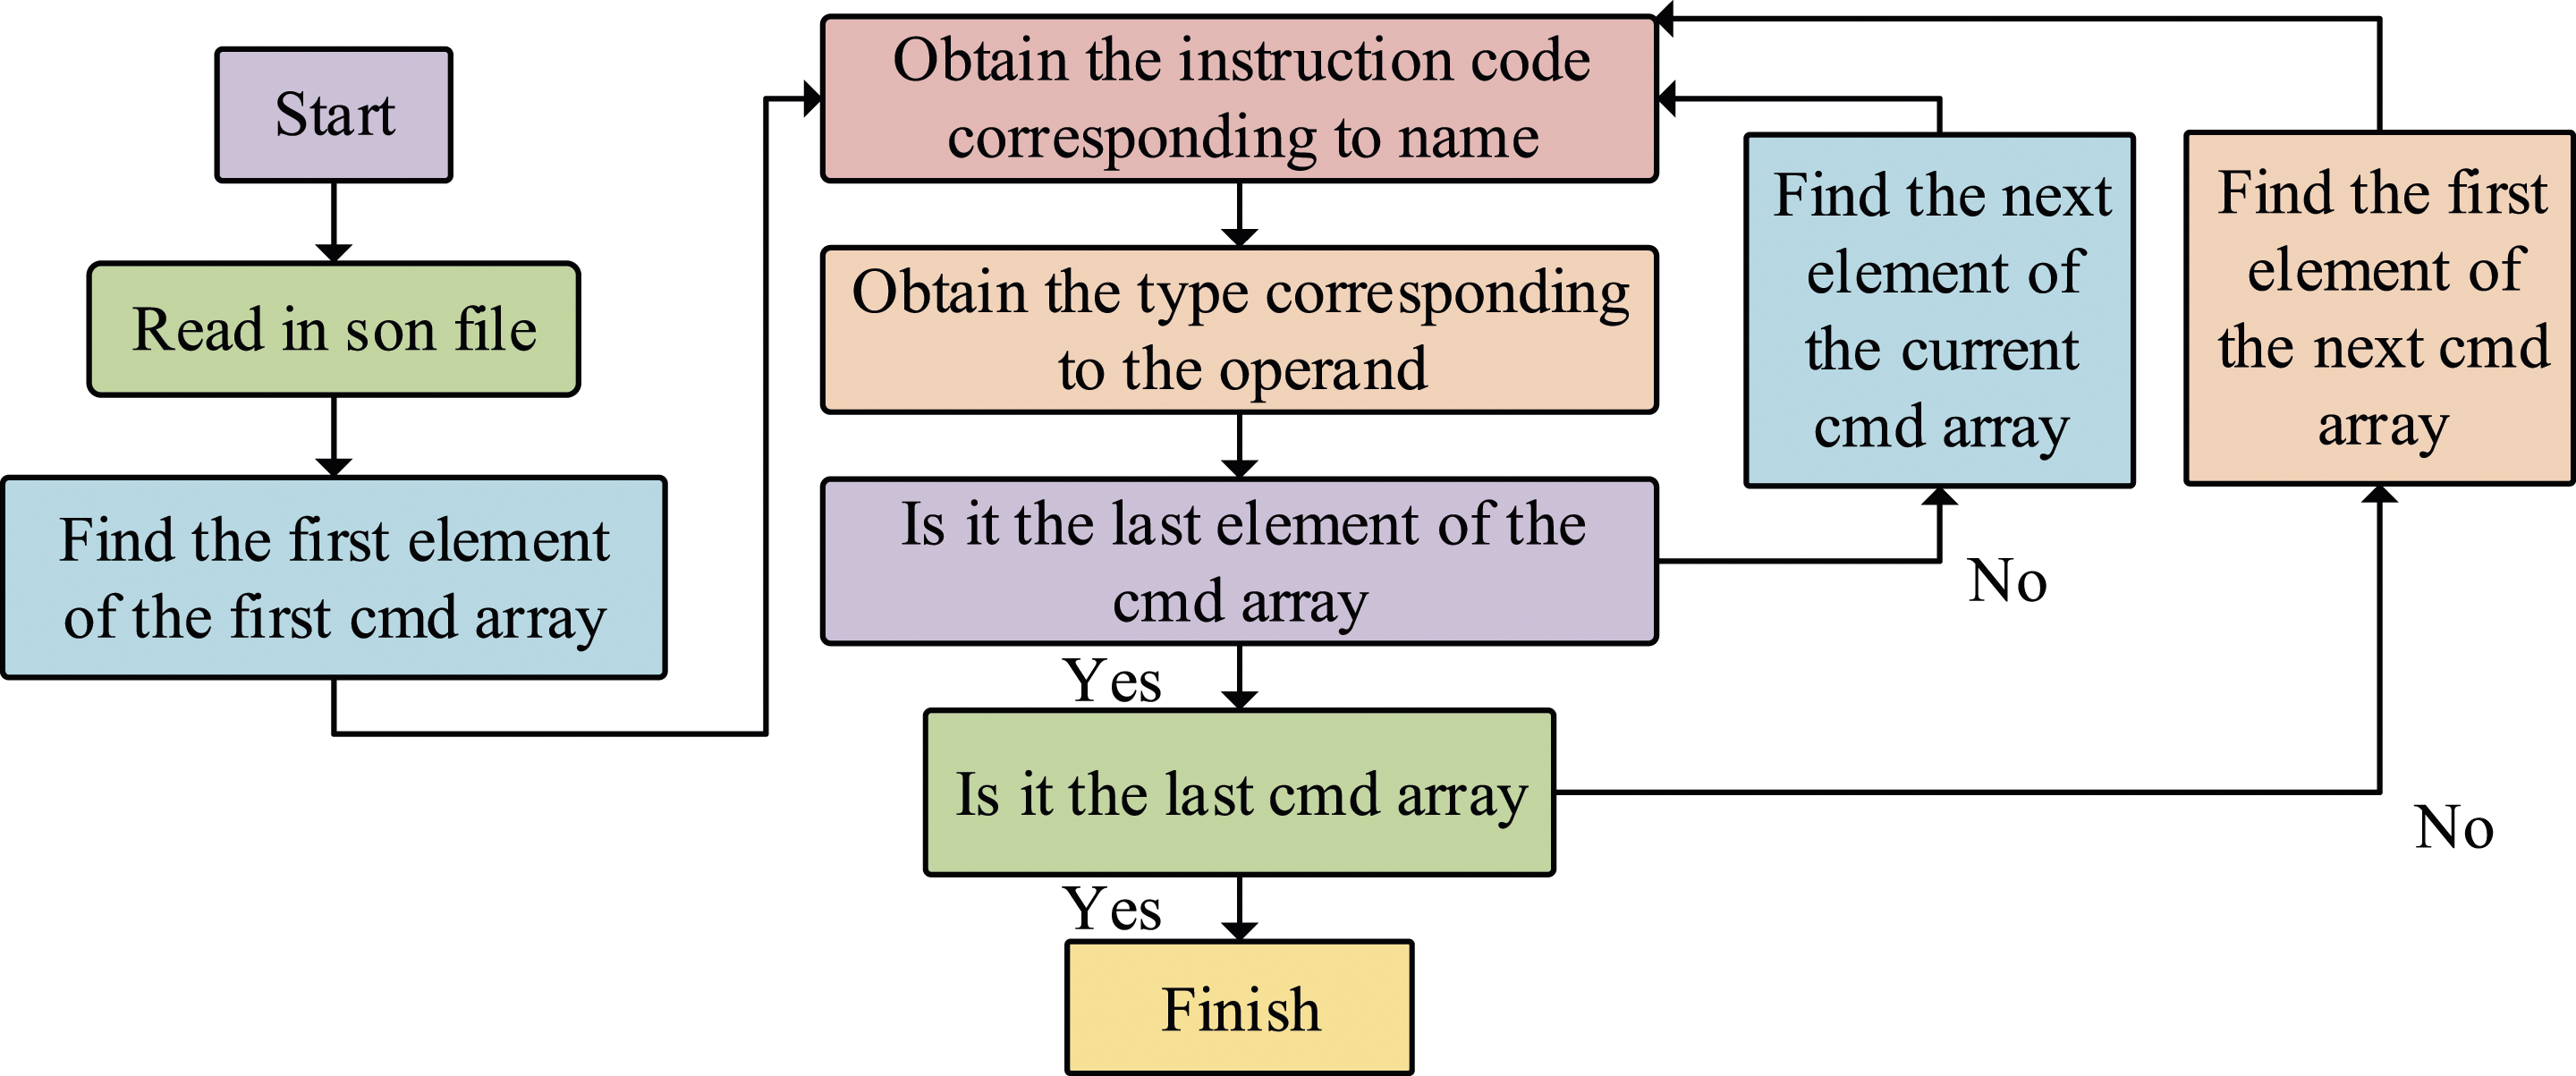
In Figure 6, the first step in the compiler’s processing process is to read in the JavaScript object symbols. The first element of the cmd array with the first label was found. The second step is to obtain the type of instruction code and operand corresponding to the string name. The third step is to determine whether the instruction information is the last element of the cmd array. If it is the last element, whether the cmd array is the last array will continue to be determined. If it is not the last element, the next element of the current cmd array is found. The process of obtaining the instruction code corresponding to the string name is continued. The fourth step is to determine whether the current cmd array is the last one. If it is the last array, the process is ended. If it is not the last array, the first element of the next cmd array is found. The process of obtaining the instruction code corresponding to the string name is continued.
Result analysis of embedded graphics display software system for edge computing
To display graphics in the limited resources of edge device, a small embedded graphics display system solution for edge computing is developed. To analyze the availability and effectiveness of the edge display system, the performance data of the system is analyzed. The performance analysis and effectiveness verification of the edge display system are mainly achieved through comparison. System comparison includes performance, power consumption, performance to power ratio, and smoothness and realism of generated images.
Result analysis of edge display system performance
The main control chip for designing the edge display system is the GC9003 microcontroller unit (MCU). GC9003 includes dual core Advanced RISC Machine (ARM) and Cortex-M0. The experimental environment used a Windows 7 system (64 bit) with an Intel Core i57500 processor, four threads, a graphics card basic frequency of 350 MHz, a Central Processing Unit (CPU) main frequency of 3.4 GHz, and a maximum memory of 64 GB. The development tool was Microsoft Visual Studio 2012. To analyze the performance of the edge display system, emWin and TouchGFX are selected as controls. The comparison of three embedded GUIs is shown in Figure 7. Comparison of three embedded GUIs. (a) Comparison of three embedded GUI frequencies and processes. (b) Comparison of performance and power consumption of three embedded GUIs.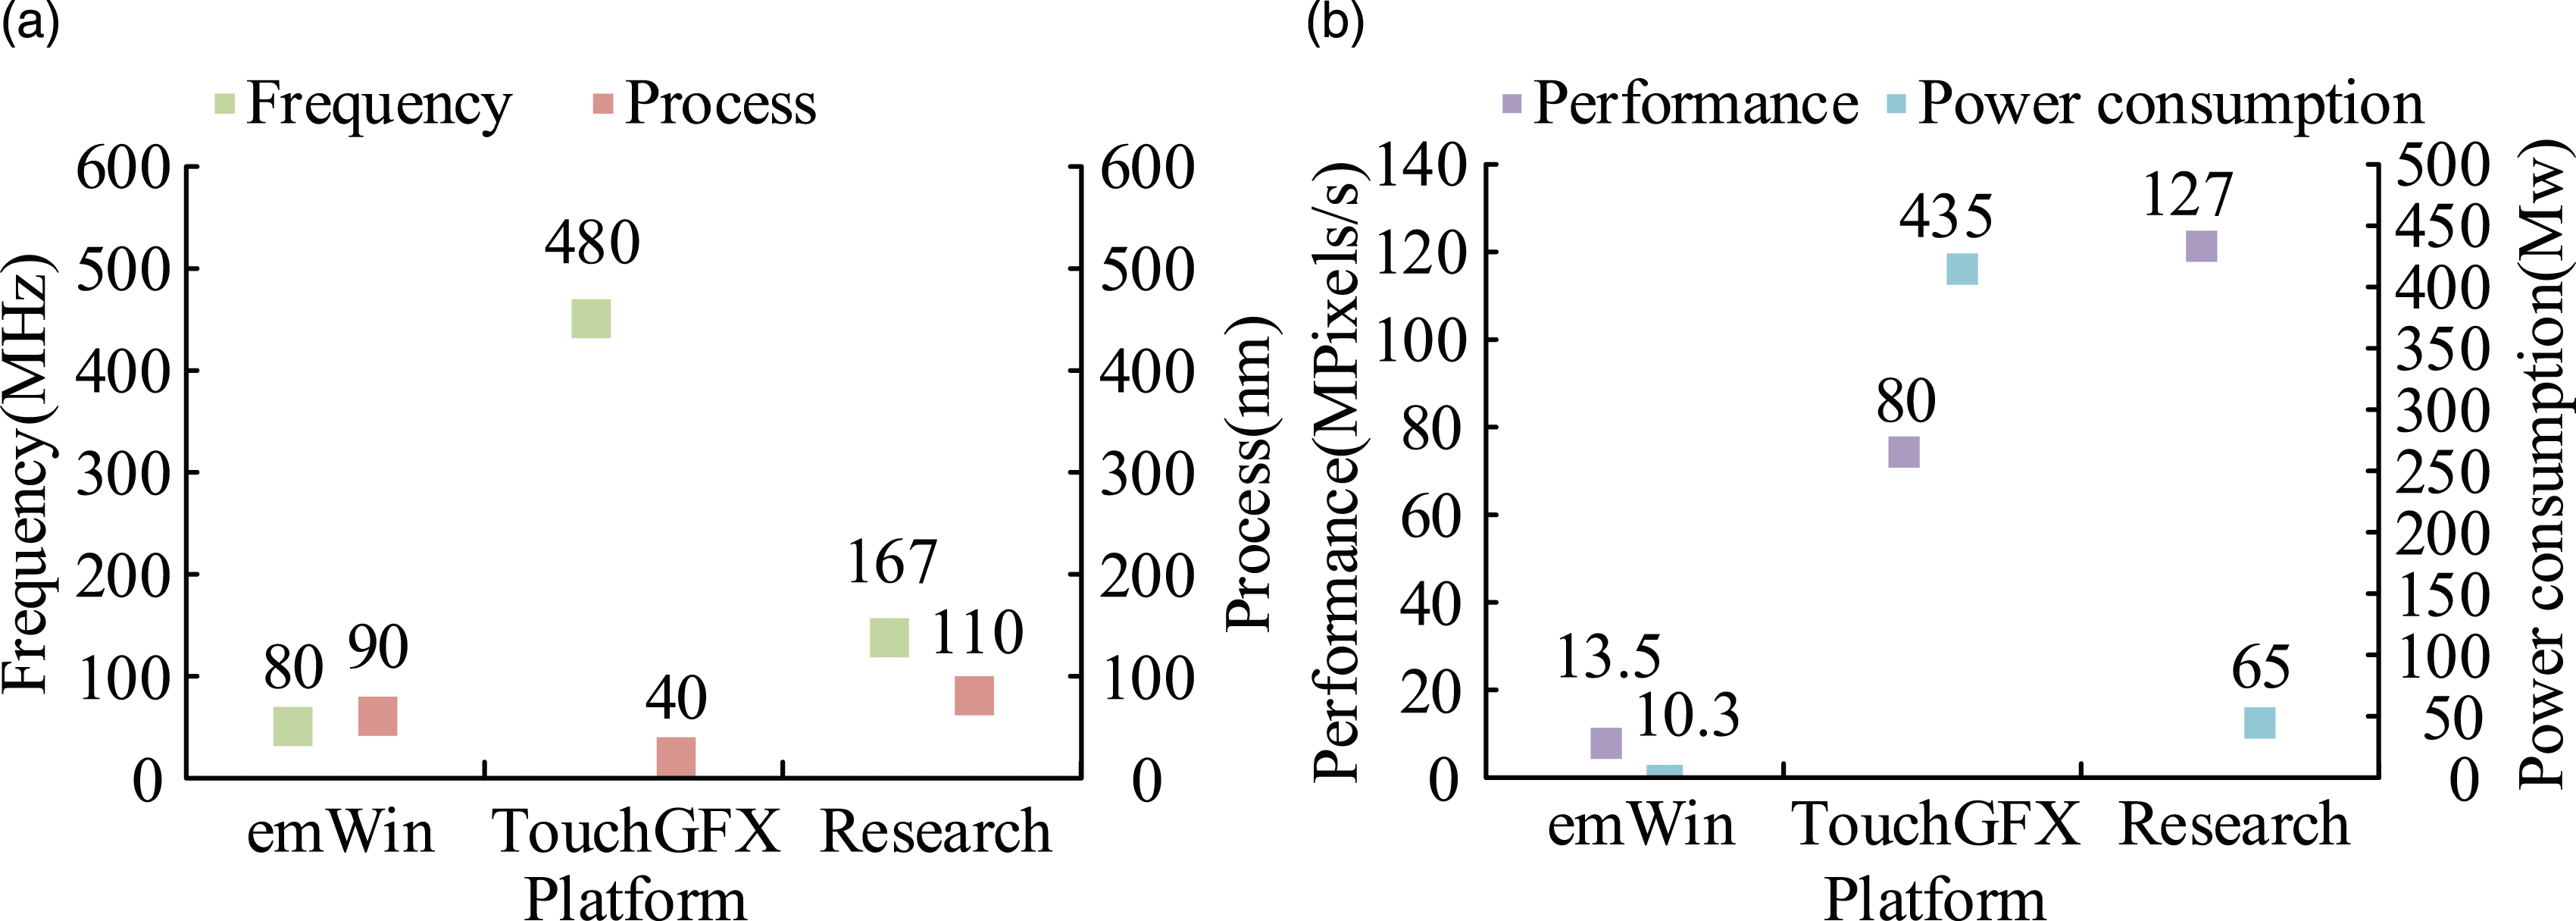
From Figure 7(a), the frequency of emWin is 80 MHz. The frequency of TouchGFX is 480 MHz. The frequency of the edge display system proposed in the study is 167 MHz. The process of emWin is 90 nanometers. The process of TouchGFX is 40 nanometers. The process proposed for the edge display system in the study is 110 nanometers. From Figure 7(b), the performance of emWin is 13.5 million pixels per second. The performance of TouchGFX is 80 million pixels per second. The performance of the edge display system proposed in the study is 127 million pixels per second. The power consumption of emWin is 10.3 megawatts. The power consumption of TouchGFX is 435 megawatts. The power consumption of the edge counting display system proposed in the study is 65 megawatts. The performance to power ratio of emWin is 1.31. The performance to power ratio of TouchGFX is 0.18. The performance to power ratio of the edge display system proposed in the study is 1.95. The edge display system designed by the research institute has good performance. To analyze the animation effect achieved by timer control, the smoothness and realism of the 5-frame continuous animation under page switching animation, canvas switching animation, and various control animations are rated by the user. The comparison results of the three animation ratings are shown in Figure 8. Comparison results of three types of animation ratings. (a) Page switching animation effects. (b) Canvas switching animation effects. (c) Multiple control animation effects.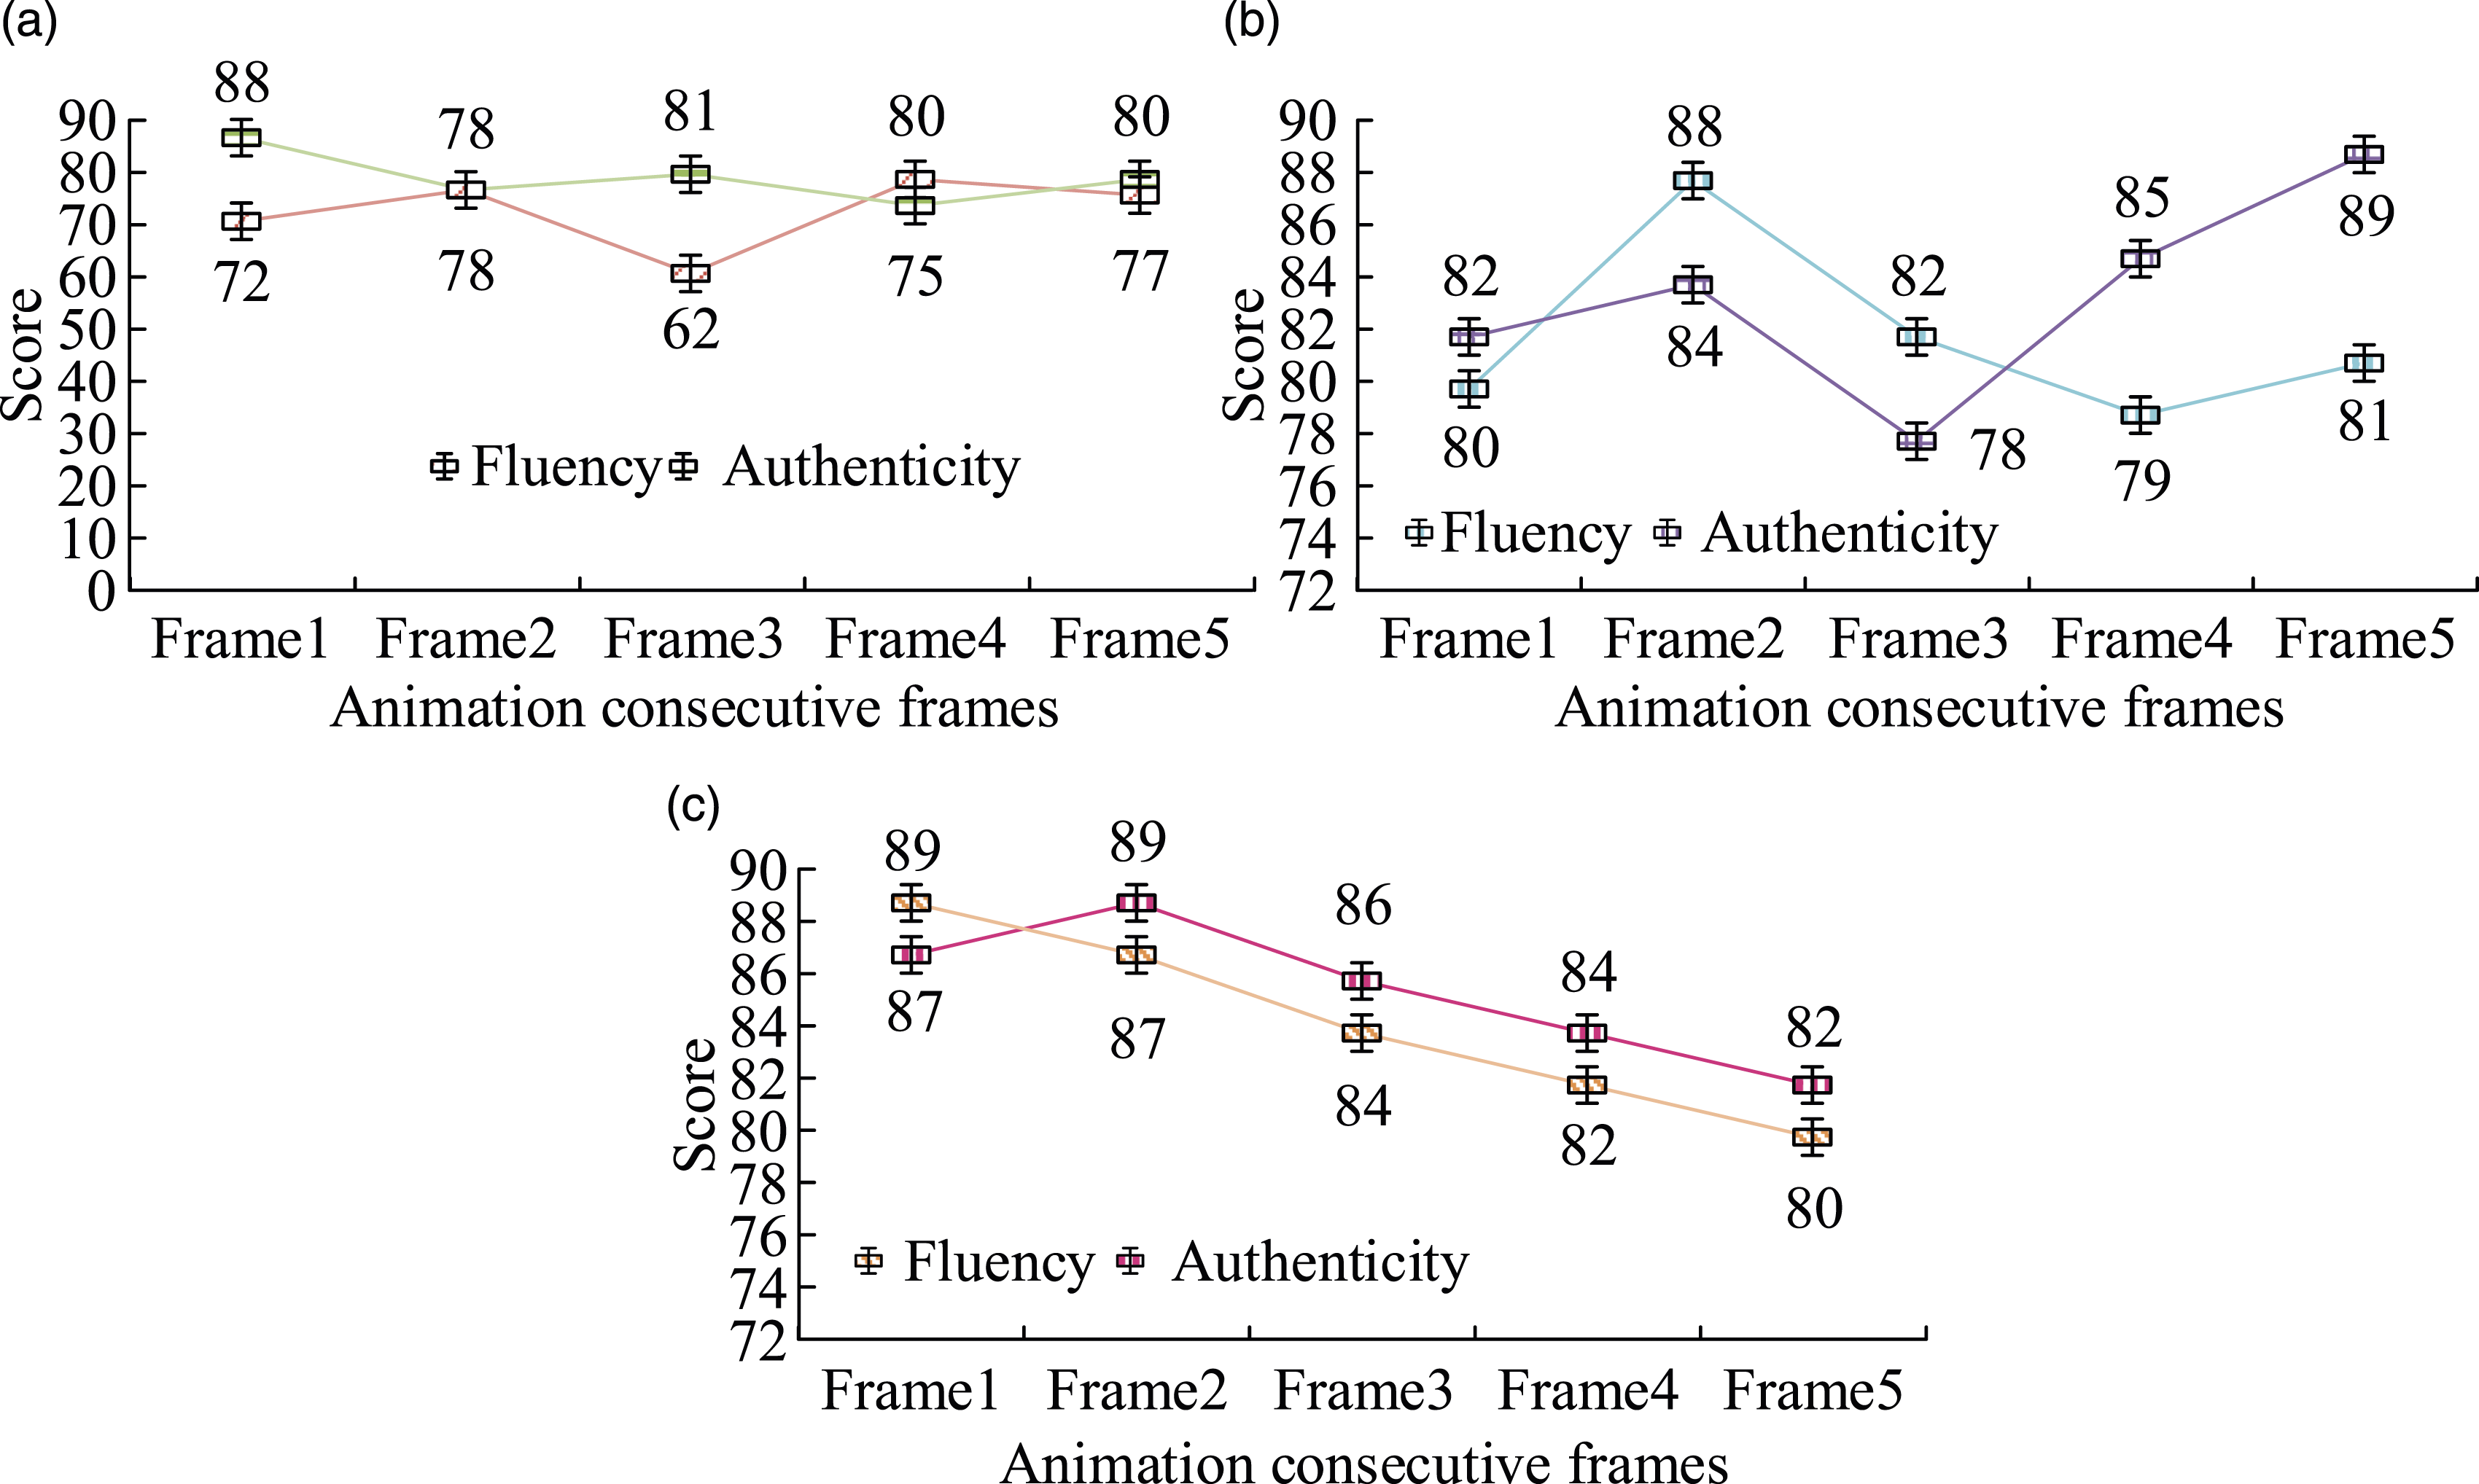
Comparison of inference time and memory usage of different frame insertion algorithms.
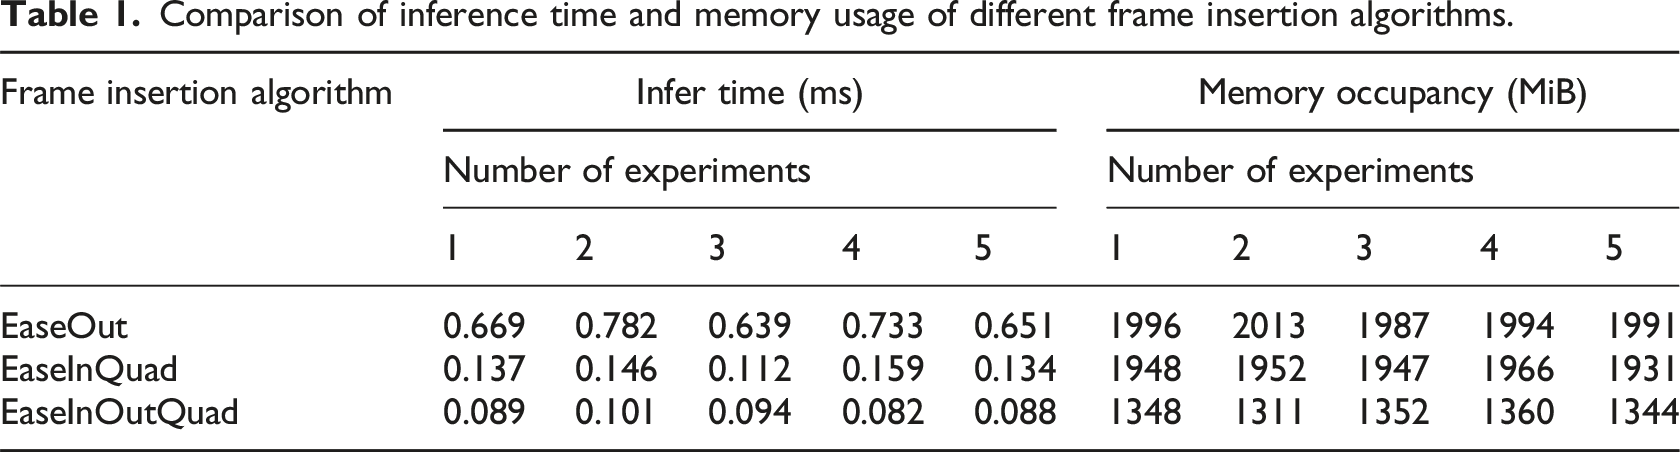
From Table 1, it can be seen that in terms of inference time, the maximum value of easeOut interpolation algorithm is 0.782 ms and the minimum value is 0.639 ms. The maximum value of easeInQuad interpolation algorithm is 0.159 ms, and the minimum value is 0.112 ms. The maximum value of easeInOutQuad interpolation algorithm is 0.101 ms, and the minimum value is 0.082 ms. In terms of memory usage, the maximum value of easeOut frame insertion algorithm is 2013 MiB and the minimum value is 1987 MiB. The maximum value of easeInQuad interpolation algorithm is 1966 MiB and the minimum value is 1931 MiB. The maximum value of easeInOutQuad interpolation algorithm is 1360 MiB and the minimum value is 1311 MiB. It can be seen that the easeInOutQuad algorithm has significant advantages in inference time and memory usage. To evaluate the effectiveness of spring animation in the interpolation algorithm of the animation system, five consecutive animation frames are selected for analysis. The analysis results were compared with animation systems that only included frame insertion algorithms. The comparison results are shown in Figure 9. Comparison of frame interpolation algorithm in animation system with spring animation and only frame interpolation algorithm in animation system. (a) Effect after adding spring animation. (b) Only the effect of interpolation algorithm.
From Figure 9(a), in the selected five consecutive frames of animation, the maximum smoothness value of the screen after introducing spring animation is 99; the minimum is 91; and the average is 95.2. After introducing spring animation into the frame insertion algorithm of the animation system, the maximum realism value of the screen is 98; the minimum is 93; and the average value is 95.4. From Figure 9(b), in the animation system, the maximum smoothness value of the image with only the interpolation algorithm is 89; the minimum is 82; and the average is 86.4. In the animation system, the maximum realism value of the image that only introduces the frame interpolation algorithm is 88; the minimum is 83; and the average is 85.4. Adding spring animation to the interpolation algorithm of the animation system can improve the smoothness and realism of the display screen.
Effectiveness analysis of edge display system
The validation of the effectiveness of the edge display system is mainly analyzed from the drawing frame rate and frame cache compression of the system. The experimental environment also used a Windows 7 system (64 bit) with an Intel Core i57500 processor, four threads, a graphics card basic frequency of 350 MHz, a CPU main frequency of 3.4 GHz, and a maximum memory of 64 GB. The development tool was Microsoft Visual Studio 2012. In the drawing frame rate, the X Windows graphics system was selected as a comparison. At the same time, the drawing frame rate of the system used in the study after hardware acceleration with Graphics Processing Unit (GPU) is analyzed. The comparison of frame rates before and after acceleration of the edge display system is shown in Figure 10. Comparison of frame rates before and after acceleration of the edge display system and its comparison with the X Windows graphics system. (a) Frame rate comparison chart. (b) System hard acceleration frame rate.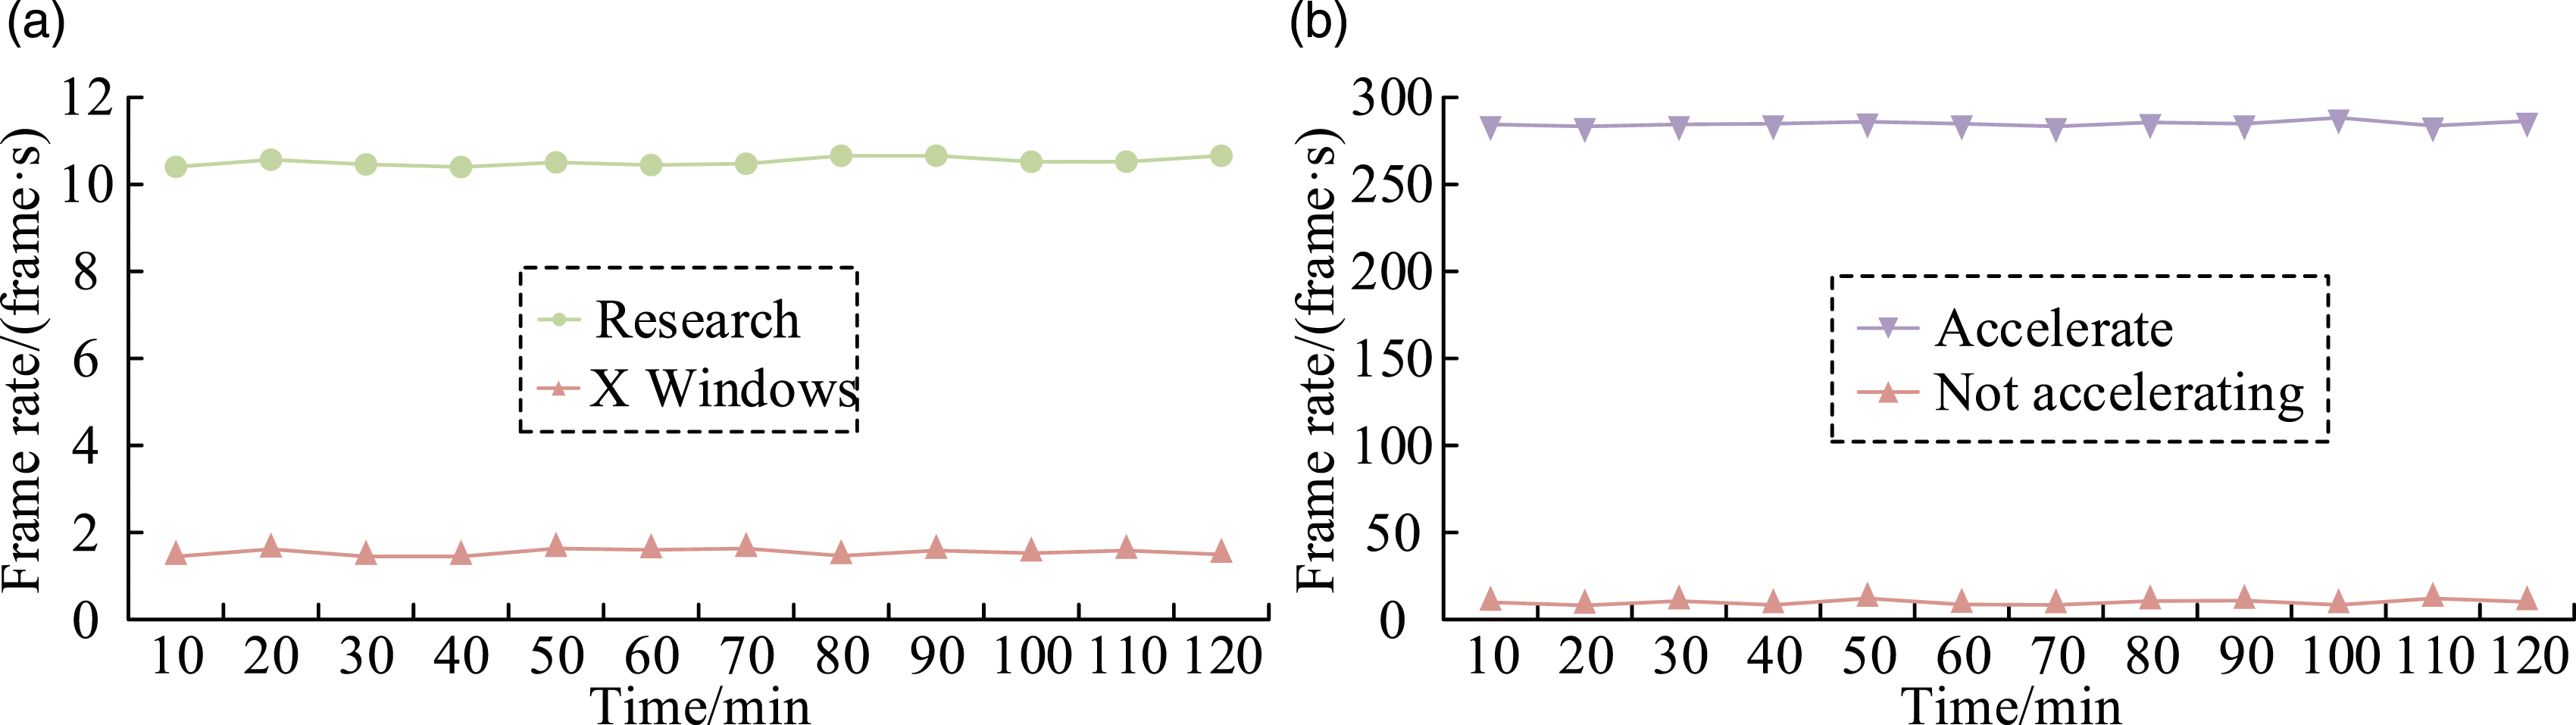
In Figure 10(a), the maximum frame rate of the X Windows graphics system is 1.99 frames/s; the minimum is 1.5 frames/s; and the average is 1.85 frames/s. The maximum frame rate of the system used in the research is 11 frames/s; the minimum value is 10.4 frames/s; and the average is 10.6 frames/s. The frame rate of the system used in the research is generally eight frames/s higher than that of the X Windows graphics system. From Figure 10(b), the maximum frame rate of the system used in the study after using GPU Hardware acceleration is 285 frames/s; the minimum is 280 frames/s; and the average is 284 frames/s. When GPU Hardware acceleration is not used in the system, the maximum frame rate is 11 frames/s; the minimum is 10.4 frames/s; and the average is 10.6 frames/s. To evaluate the impact of frame cache compression on power consumption, the average power consumption of the proposed edge display system operating interface and frame cache compression are analyzed. The specific analysis is shown in Figure 11. Average power consumption of the operating interface of the edge display system and the performance analysis of frame cache compression. (a) Average power consumption of running interface. (b) Frame cache compression performance comparison.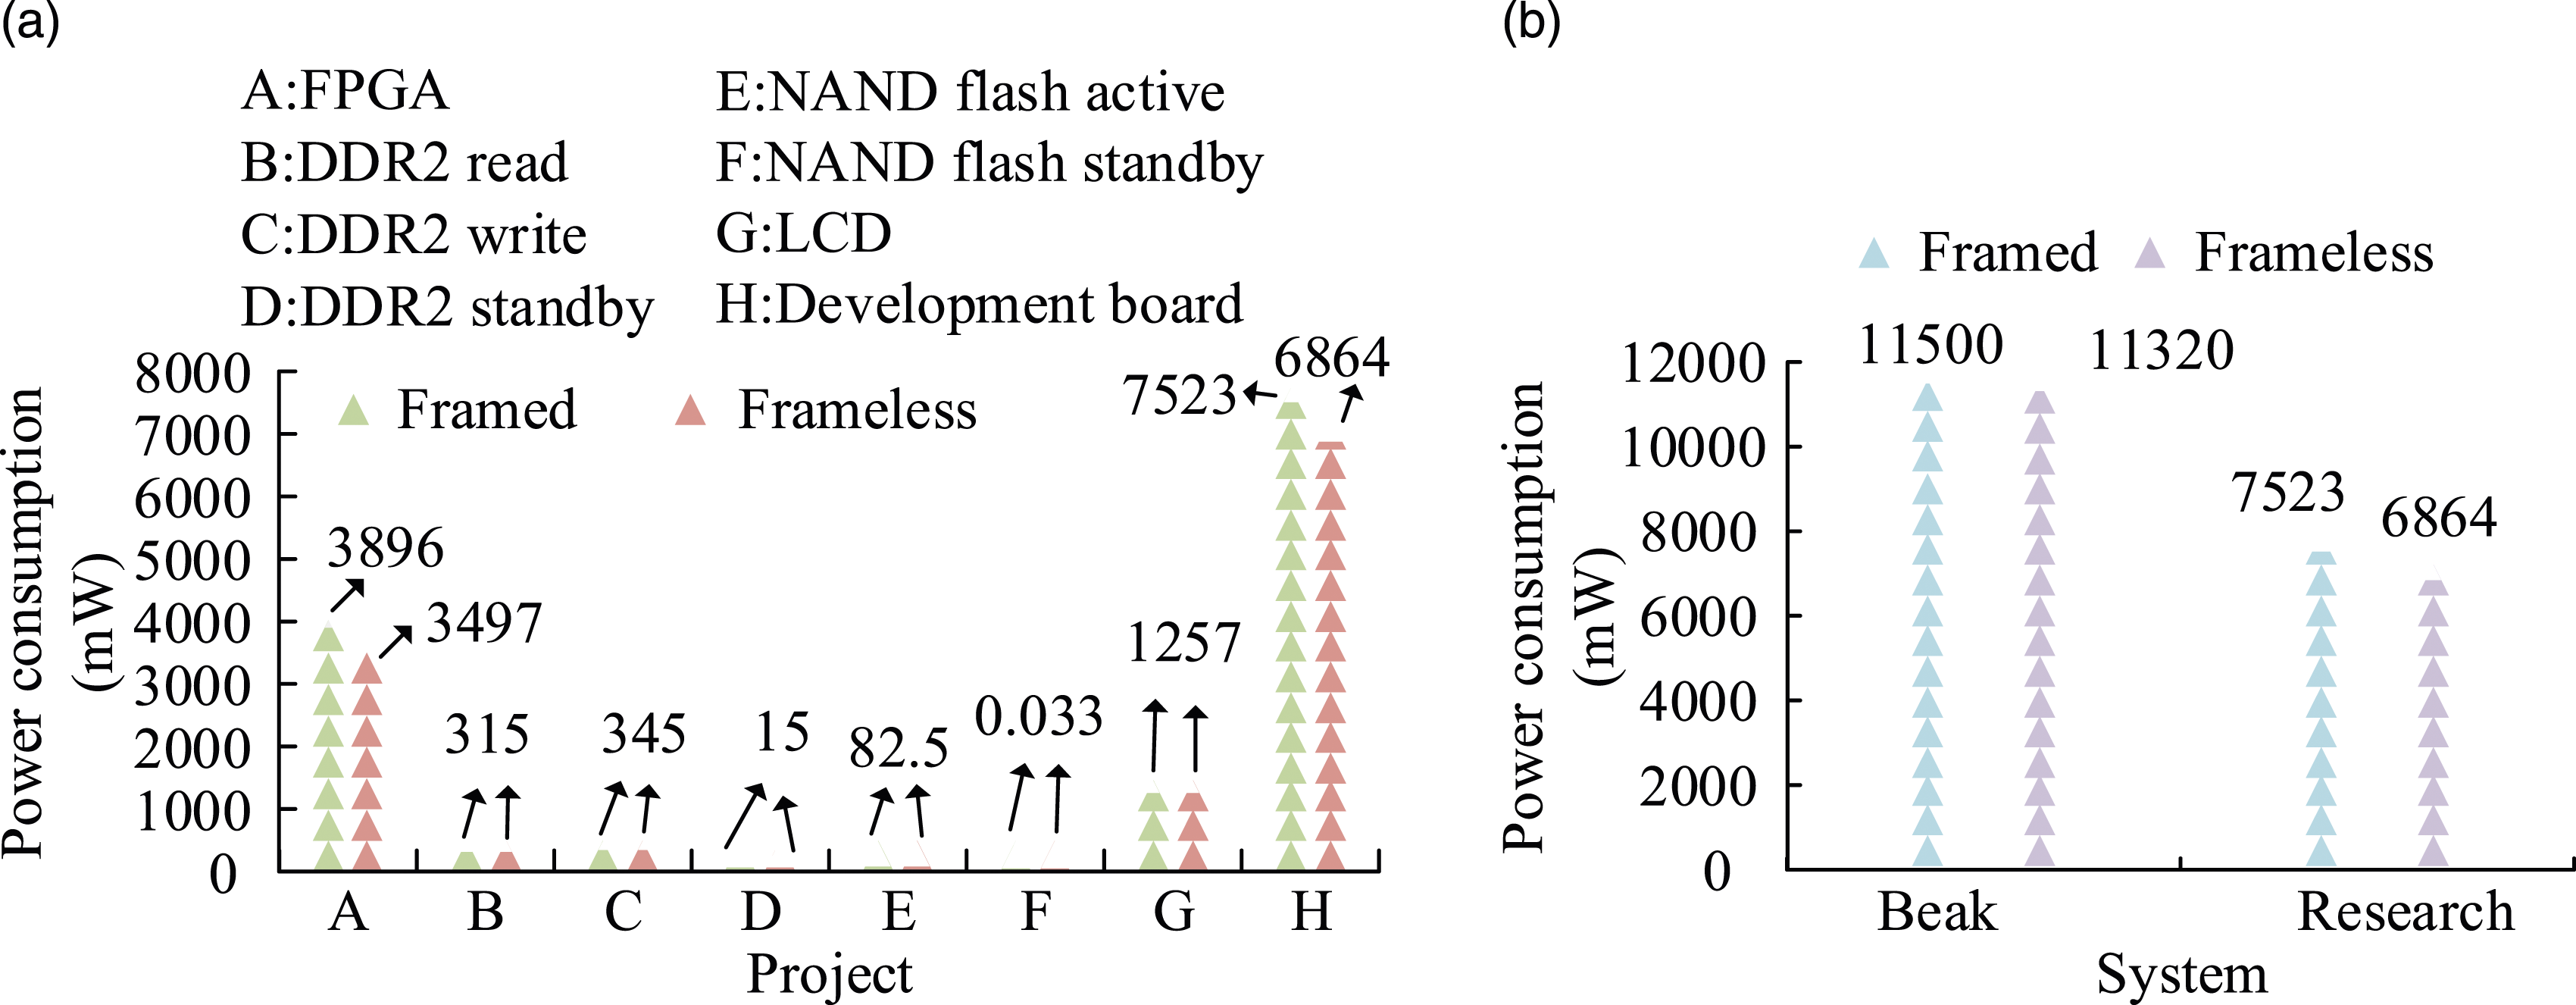
Comparison of CPU utilization and response time between different edge display systems.

From Table 2, it can be seen that in terms of CPU utilization, the maximum value of emWin embedded system is 46%, and the minimum value is 35%. The maximum value of TouchGFX embedded system is 29%, and the minimum value is 22%. The maximum value of the embedded system designed by the research institute is 17%, and the minimum value is 11%. In terms of response time, the maximum value of emWin embedded system is 5678 ms and the minimum value is 5127 ms. The maximum value of TouchGFX embedded system is 3965 ms, and the minimum value is 3584 ms. The maximum value of the embedded system designed by the research institute is 2785 ms, and the minimum value is 1836 ms. It can be seen that the embedded edge display system designed by the research institute has obvious advantages in CPU utilization and response time, which also indicates that the system has better performance.
Conclusion
In order to achieve graphical display in limited resources and save on limited resources, a small embedded graphics display system solution for edge computing is innovatively developed. The performance of this scheme has been analyzed. According to the findings, the frequency of the edge display system designed by the research institute is 167 MHz, while the frequencies of the emWin system and TouchGFX system are 80 MHz and 480 MHz, respectively. The power consumption of the edge display system designed by the research institute is 65 megawatts, with a performance to power ratio of 1.95. The power consumption of the emWin system and TouchGFX system is 10.3 MW and 435 MW, respectively, with a performance to power ratio of 1.31 and 0.18. The maximum CPU utilization and response time of the edge display system designed by the research institute are 17% and 2785 ms, respectively. The maximum CPU utilization of the emWin system and TouchGFX system are 46% and 29%, respectively, and the maximum response time is 5678 ms and 3965 ms, respectively. It can be seen that the edge display system designed by the research institute has good performance. The average score for the smoothness of page switching animation in the edge display system designed by the research institute is 73.8, and the average score for realism is 80.4. The average for the smoothness of canvas switching animation is 82, and the average for realism is 83.6. The average for the smoothness of various control animations is 84.4, and the average score for realism is 85.6. After introducing spring animation into the frame interpolation algorithm of the animation system, the average smoothness of the screen is 95.2, and the average realism of the screen is 95.4. The average smoothness and realism of the animation system that only introduces the frame insertion algorithm are 86.4 and 85.4, respectively. The average smoothness and realism of the image after introducing spring animation are 8.8 and 10 higher than those of only introducing interpolation algorithm, respectively. It can be seen that adding spring animation to the frame insertion algorithm of the animation system can improve the smoothness and realism of the display screen. The average frame rate of the system used in the research is 10.6 frames/s. Overall, the frame rate is eight frames/s higher than the X Windows graphics system. It can be seen that the system designed by the research institute also has significant advantages in frame rate. Although an embedded graphics display system for edge computing is developed, there are still some shortcomings. One is that there is not enough research on different types of controls in different scenarios, and future research can consider more controls to meet the needs of different scenarios. The second is that the time consumption and display frame rate of embedded software systems can be further improved. Future research can optimize the system from the perspective of matrix calculation, reduce system time consumption, and improve the display frame rate of the system. Thirdly, it is possible to improve the testing content of edge display software systems, and future research can further judge whether the system can maintain stability during long-term operation from the perspectives of stability and stress testing. Fourthly, there is still room for improvement in the texture combination of image system controls. Future research can improve the combination logic of control textures, improve rendering speed on images, and enhance the display performance of the system.
Statements and declarations
Footnotes
Conflicting interests
The author declared no potential conflicts of interest with respect to the research, authorship, and/or publication of this article.
Funding
The author received no financial support for the research, authorship, and/or publication of this article.