
Abstract
The rapid development of the Internet economy has made the e-commerce sales model more mature, but e-commerce returns are more and more frequent, resulting in a large number of returns data. However, traditional data mining methods have not taken into account the impact of time series on data, making it difficult to accurately and effectively analyze e-commerce return data. In order to effectively handle the time series characteristics in e-commerce return data, research is conducted on time series symbolization of raw data, converting continuous numerical time series data into discrete symbol series. In order to optimize the linear segmentation effect of time series, an incremental error segmentation method is introduced to replace the traditional sliding window segmentation method. The segmentation points are dynamically adjusted by gradually calculating the fitting error of each time period. At the same time, K-means clustering algorithm is used to cluster symbol sequences, and a frequent pattern growth algorithm is introduced for clustering symbol sequence frequent itemset mining. The results showed that the incremental error segmentation method used in the study reduced the fitting error by an average of 1.382 when the compression rate exceeded 90%. Under the same support rate, the proposed algorithm only consumed about 200 MB of memory and ran for only 60 seconds, proving the effectiveness and accuracy of the research method. Meanwhile, the analysis results of the example showed that an increase in merchant sales, a decrease in logistics anomalies, and a decline in store reputation all had a significant impact on product returns. This indicates that the results of this study can help businesses understand return trends, optimize sales and logistics, and thereby reduce return rates.
Introduction
As the speed advancement of internet technology, more data have been recorded on the network, with time series data accounting for the largest proportion. According to statistics, the average annual growth rate of global e-commerce has exceeded 20%. Driven by the mobile Internet, online shopping shows explosive growth. E-commerce not only provides consumers with a convenient shopping experience, but also brings huge economic benefits to businesses. But with the increase of transaction volume, the issue of e-commerce returns has become increasingly prominent and has become an important problem that urgently needs to be solved in the field of e-commerce. E-commerce return refers to the behavior of consumers choosing to return goods to merchants after purchasing them for various reasons. According to some studies and reports, the return rate of e-commerce is much higher than that of traditional retail. Taking the US market as an example, the e-commerce return rate reached about 20% in 2022, and in some product categories, this proportion is even close to 30% or higher. The return situation in the Chinese market cannot be ignored, especially during large-scale promotional events such as “Double 11” or “Double 12”, where the issue of returns is more prominent. E-commerce return data is one of the important information in the e-commerce field, which has important reference value for businesses and consumers.1,2 By studying and mining these data, businesses can better understand the reasons and patterns of returns, and take corresponding measures to reduce the return rate. In addition, for consumers, it can provide better return services and experiences. Therefore, studying e-commerce return data is of great necessity and practical significance. Traditional data mining methods have some limitations when processing time series data. Due to the high-dimensional nature of time series data, directly using raw data for mining may result in high computational complexity and inaccurate results.3,4 At the same time, current clustering methods, including frequency domain-based and pattern-based time series symbolization (TSS) clustering, suffer from difficulties in feature extraction, poor stability, poor interpretability of clustering results, and difficulty in processing large-scale data. Therefore, in order to perform dimensionality reduction, compression and other processing on time series data, improve the efficiency of large-scale data processing, and better mine e-commerce return data, a frequent itemset mining (FIM) algorithm based on TSS clustering was studied and designed to study e-commerce return data. Incremental error segmentation (IES) method was used to optimize linear segmentation performance, and k-means clustering algorithm was used to cluster symbol sequences. To improve the efficiency of the algorithm, the frequent pattern growth (FP-growth) algorithm for clustering symbol sequence FIMs was introduced. In addition, efficient data mining on large-scale datasets was achieved through the FP-growth algorithm. This algorithm has high efficiency and accuracy in mining e-commerce return data, effectively capturing changes in return patterns and providing substantive conclusions about return behavior. The contribution of the research mainly includes two aspects. One is to provide a more accurate and effective clustering method for large-scale data. The second is to improve the accuracy and speed of e-commerce return data processing, which can help e-commerce enterprises better understand and analyze return data, and thus develop more effective return strategies and management measures.
This study mainly focuses on the following four aspects. The first part introduces the current research status of internet data mining methods. The second part is the specific design of FIM algorithms based on TSS. The third part is to analyze the data mining results through experiments, and introduce other algorithms to verify the performance of this algorithm. The fourth part is a summary and analysis of the entire text. This study promotes the study of e-commerce return data. By optimizing the linear segmentation method and introducing the clustering and FIM algorithm, the study provides an effective analysis method, which can help e-commerce enterprises to deeply understand the patterns and rules in the return data, so as to optimize the return strategy, improve user experience, and increase enterprise profits. In addition, the study also promotes the further development and application in the field of time series analysis and data mining.
Related works
As the speed growth of the Internet, big data, and artificial intelligence, all kinds of network data can be recorded and saved. Many scholars have studied the mining and analysis of Internet data. Among them, significant research results have been achieved in improving data mining algorithms, which can provide improvement ideas for this study. Kim et al. proposed a symbol centered data structure for the analysis of periodic data in time series databases, and verified the feasibility of this method through experiments on real data. The experiments showed that this method improved memory usage and runtime, and was more efficient. 5 Li proposed a dynamic data mining algorithm based on time weight to address the issue of time weight affecting the effectiveness of data mining. This method formed an important row matrix by matching corresponding data with dynamic time features, and verified the feasibility of this method through experiments. The results showed that compared with existing methods, the information mined by this method was more comprehensive. 6 Qu et al. found that efficient use of project sets can reveal combinations of projects with high profits, costs, or importance. Therefore, they proposed a high-performance algorithm Hamm for mining efficient use of project sets. This algorithm adopts a novel prefix tree and utility vector structure to mine efficient itemsets in one stage without generating candidate options. The results show that the proposed optimization method significantly reduces the search space and improves the speed of the Hamming algorithm. 7 Li et al. proposed a malicious mining code detection method based on feature fusion and machine learning to detect malicious mining code. Extract feature vectors through n-gram model and TF-IDF, and select the best feature vector through classifier. The results showed that the recognition accuracy of this method reached 98.0%, the F1 value reached 0.969, and the area under the ROC curve reached 0.973. 8 Alyasiri and Ali analyzed the quantity, speed, diversity, accuracy, and value of big data and proposed a powerful framework for handling data complexity, which helps to explore more deeply how big data principles optimize e-commerce return data analysis. 9
The application achievements of data mining algorithms in other fields such as medicine can also provide certain research ideas for research. The Guo team applied data mining technology to the field of traditional Chinese medicine treatment, using the Apriori algorithm and hclust function to perform association clustering analysis on the traditional Chinese medicine database. 26 association rules were obtained, and four types of traditional Chinese medicine were identified through clustering analysis. The conclusion of clustering analysis was consistent with the actual situation, and the mining effect was good. 10 Peng team proposed a time series data mining method with the facilities cost model to effectively predict the pollution of haze, linking the formation of haze with the multidimensional nature of time series. Other algorithms were introduced for comparative experiments to evidence the effect of this data mining method. 11 The Li team considered the low efficiency of traditional data mining algorithms and applied association rules to the data mining algorithm. They proposed a MapReduce-based association rule mining algorithm, which improved the efficiency of the algorithm and reduced memory requirements. In up to 40 million dataset mining experiments, the method still performed well. 12 Diamond and Happawana applied the FIM method to the field of clinical medicine, using the FP-growth algorithm to establish a database related to Alzheimer’s disease, and evaluated the feasibility of the algorithm through experiments. The experiments showed that the algorithm had good performance and could be used for medical related data analysis. 13 Considering the impact of customer satisfaction on manufacturers, Kang team proposed an FIM algorithm based on fuzzy association. This algorithm used the fuzzy Delphi method to calculate the data weight and determined 14 association rules to analyze customer satisfaction. Experiments showed that this method was feasible and reduced the risk of product failure to a certain extent. 14 Ahmed and Nath applied data mining to disease detection technology. To raise the algorithmic efficiency and reduce economic costs, an improved FP-growth algorithm was proposed, which used top-down and bottom-up methods to generate item sets and improve the algorithmic efficiency. Experiments verified that the algorithm improved the operation efficiency and had certain feasibility compared with traditional methods. 15 Samal and other researchers proposed an enhanced differential protection scheme for microgrid fault detection and classification based on data mining models. The results show that the proposed intelligent differential protection scheme based on deep neural networks can provide reliable protection measures for microgrids. 16
In summary, compared with traditional data mining algorithms, the TSS based FIM algorithm performs better in processing data with time series features. Traditional algorithms often overlook the temporal relationships in time series data, resulting in insufficient effectiveness in processing e-commerce sales data. TSS can effectively convert continuous time series into discrete symbol sequences, capturing time patterns and periodic behavior, making subsequent FIMs more accurate. The FP-growth algorithm has high performance in frequent itemset mining, significantly improving mining efficiency by reducing the generation of candidate itemsets. Based on this advantage, a new data mining framework has been designed. Firstly, TSS processing is applied to e-commerce sales data, and then FP-growth algorithm is applied for efficient frequent itemset mining, thereby revealing key patterns and consumer behavior patterns in sales data and promoting in-depth research on e-commerce data analysis.
Methods
In order to achieve effective analysis of e-commerce return data, this chapter first introduces the symbolization of time series, converting continuous time series curves into discrete symbol sequences. Then, the frequent pattern mining algorithm for time series was introduced, and the FP-growth algorithm was introduced to set the frequently occurring data in the time series as the threshold itemset in advance, improving the efficiency of data analysis.
Design of time series symbolization clustering
Due to the large volume, high dimensionality, and large amount of noise in the original time data, using traditional data mining algorithms to cluster and classify data may not achieve accurate results. So this study will symbolize time series data, express complex time series data in simple symbols, and conduct data mining analysis on the symbolized data to raise the efficiency of the algorithm.17,18 The main content of TSS includes three processes: selecting important points, linearizing segmentation, and segment clustering. The purpose of screening important points is to select the support points of the time series contour, that is, the important points that need to be screened are the extreme points of the time series data. The points where the slope difference between the endpoints and line segments is greater than the threshold, that is, based on the time series. The mathematical expression for the slope difference of line segments is shown in equation (1).

As shown in equation (1), Linearized segment flow chart.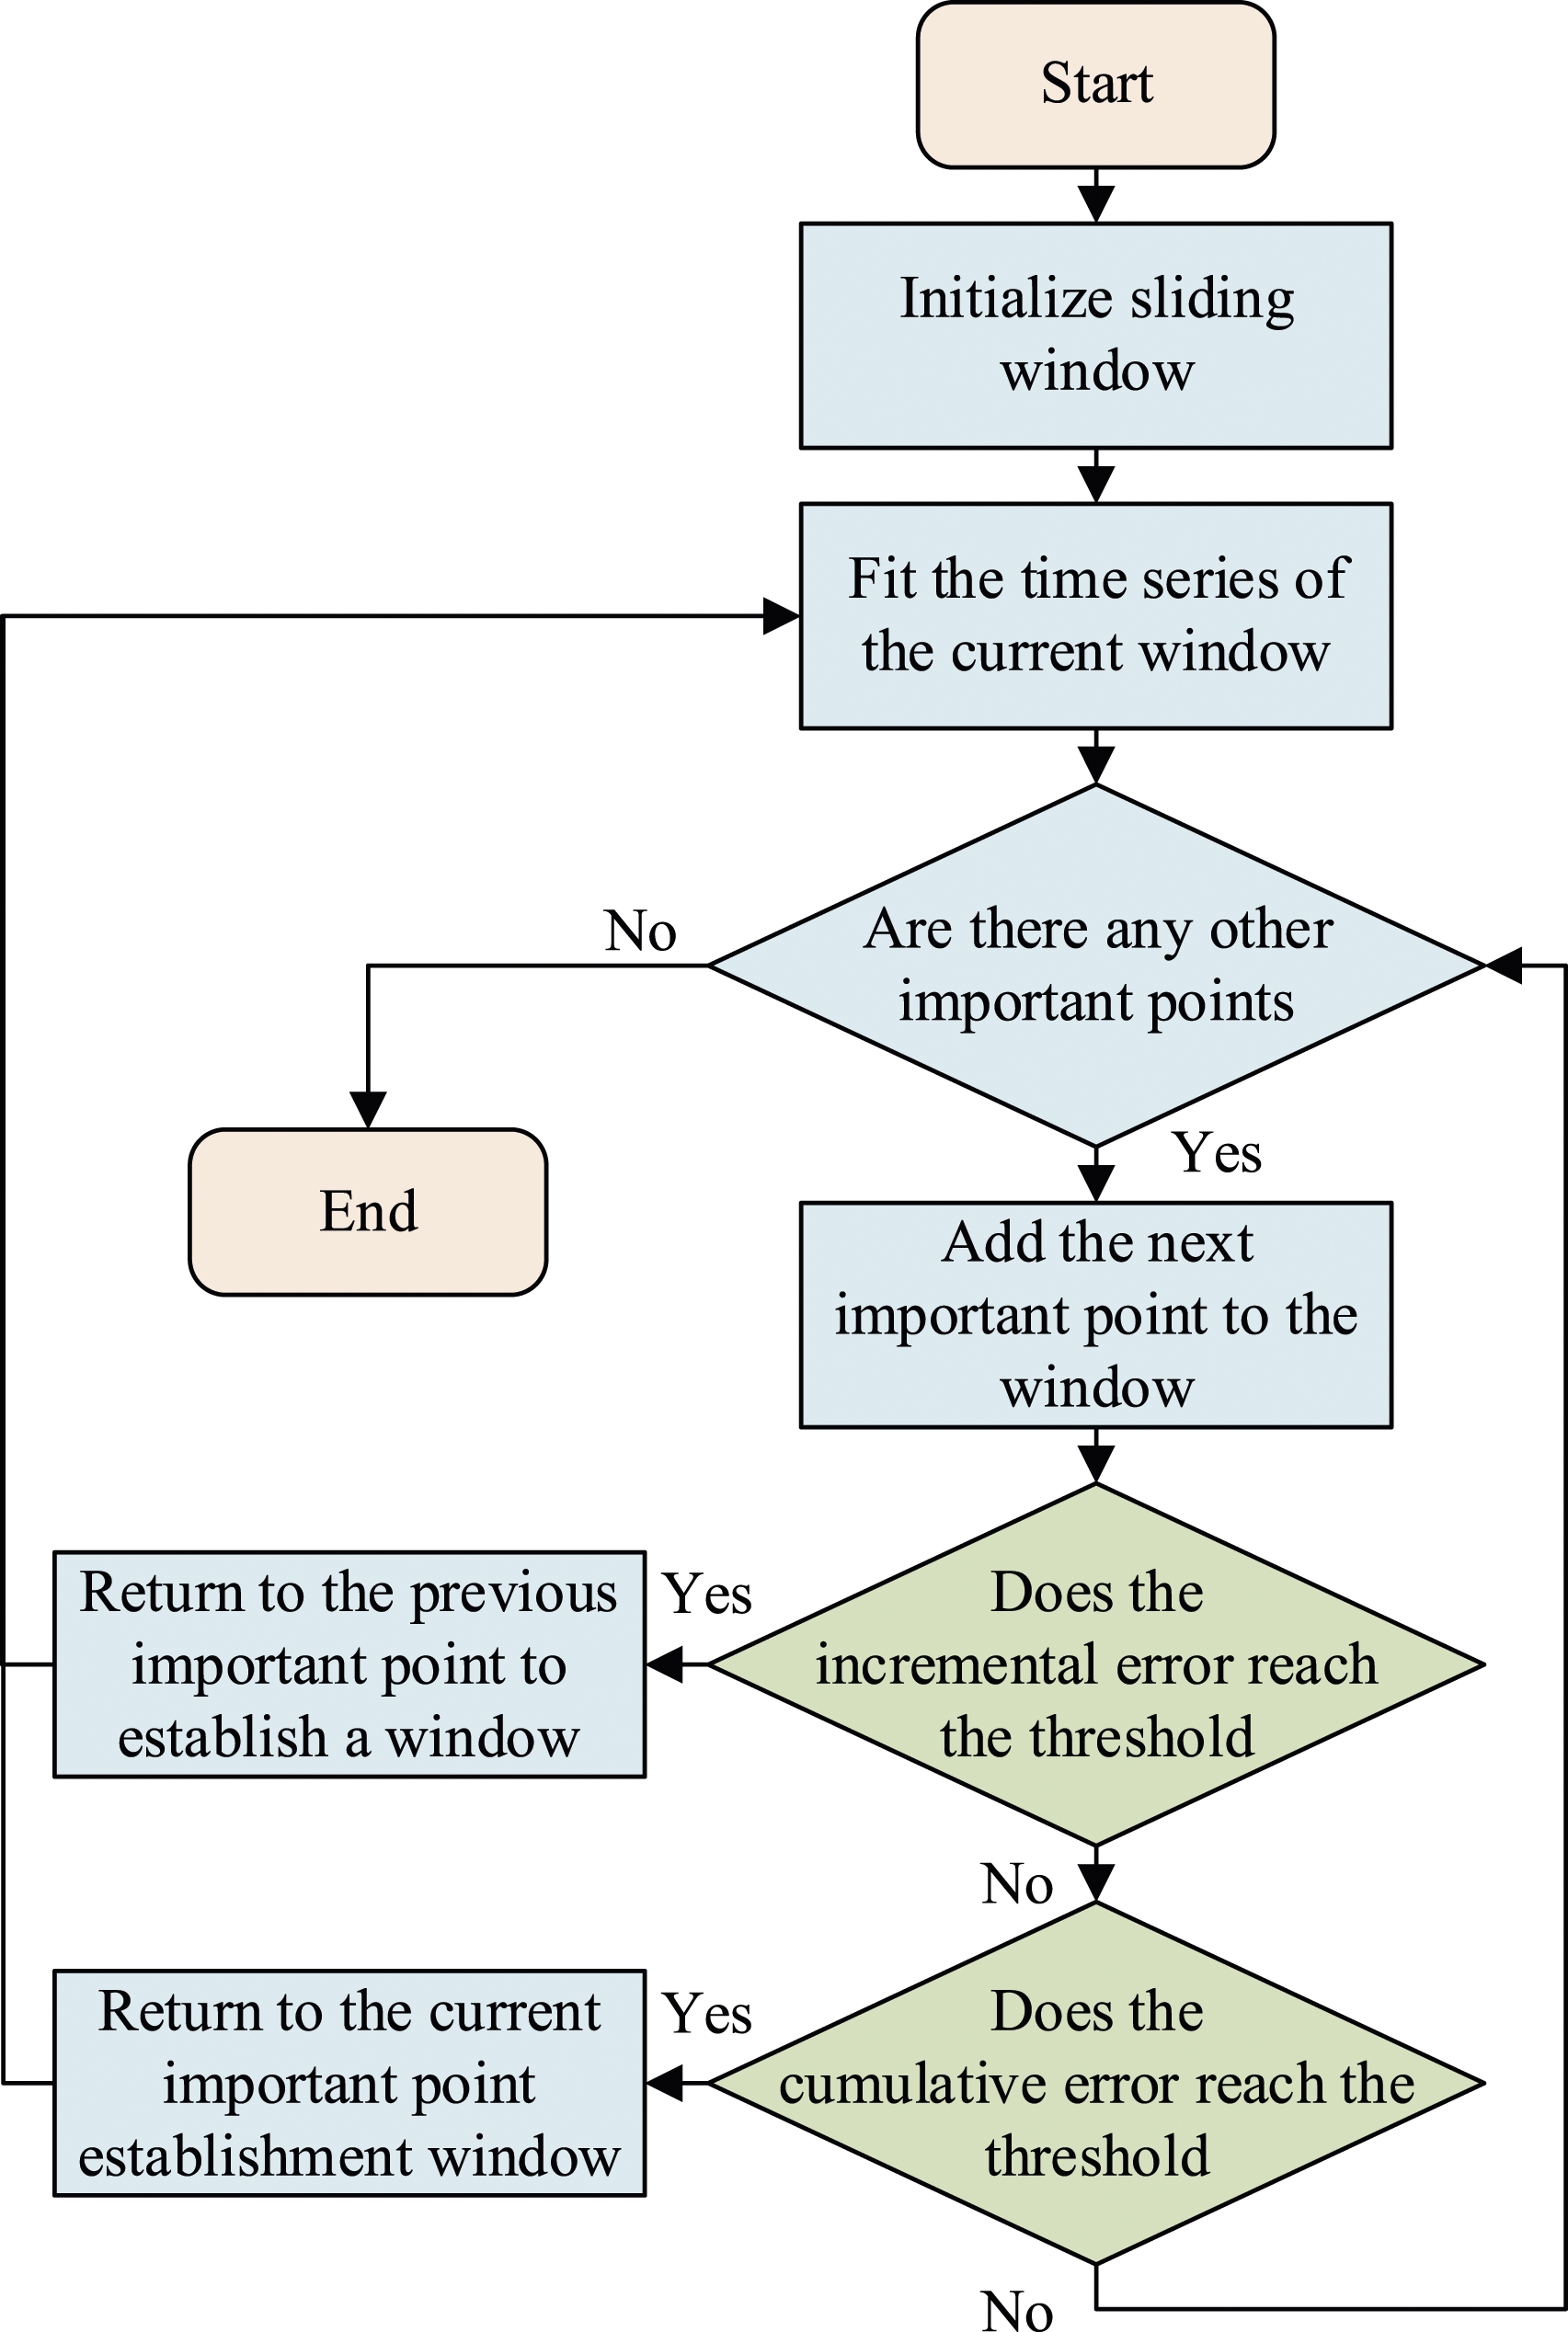
As shown in Figure 1, the linearization segmentation is to first initialize the sliding window. Then it uses line segment fitting to filter out the important point time series, and determines the incremental error and cumulative fitting error of the important point data until all important points are traversed, ending the linearization step.
2
It assumes that the time series

In equation (2),

In equation (3),

As shown in equation (4),
The last and most crucial step in TSS is to perform clustering symbolization on linearization segmentations. The specific steps are as follows: first, extract the geometric features such as slope and length of the fitted line segments of each subsequence obtained in the previous step, and use them as the attributes of the sample points in the clustering process for clustering. Then, set the number of patterns in the original time series to the number of clusters and the size of the corresponding symbol table. Replace each line segment in the original time series with the symbol corresponding to its cluster center to obtain the symbol sequence. Due to the fact that in real life, more attention is paid to the trend changes in time series, the slope of a line segment is used as its feature, and three common trend patterns of rising, falling, and basically unchanged are often set. The clustering symbolization process is shown in Figure 2. Cluster symbolization process diagram.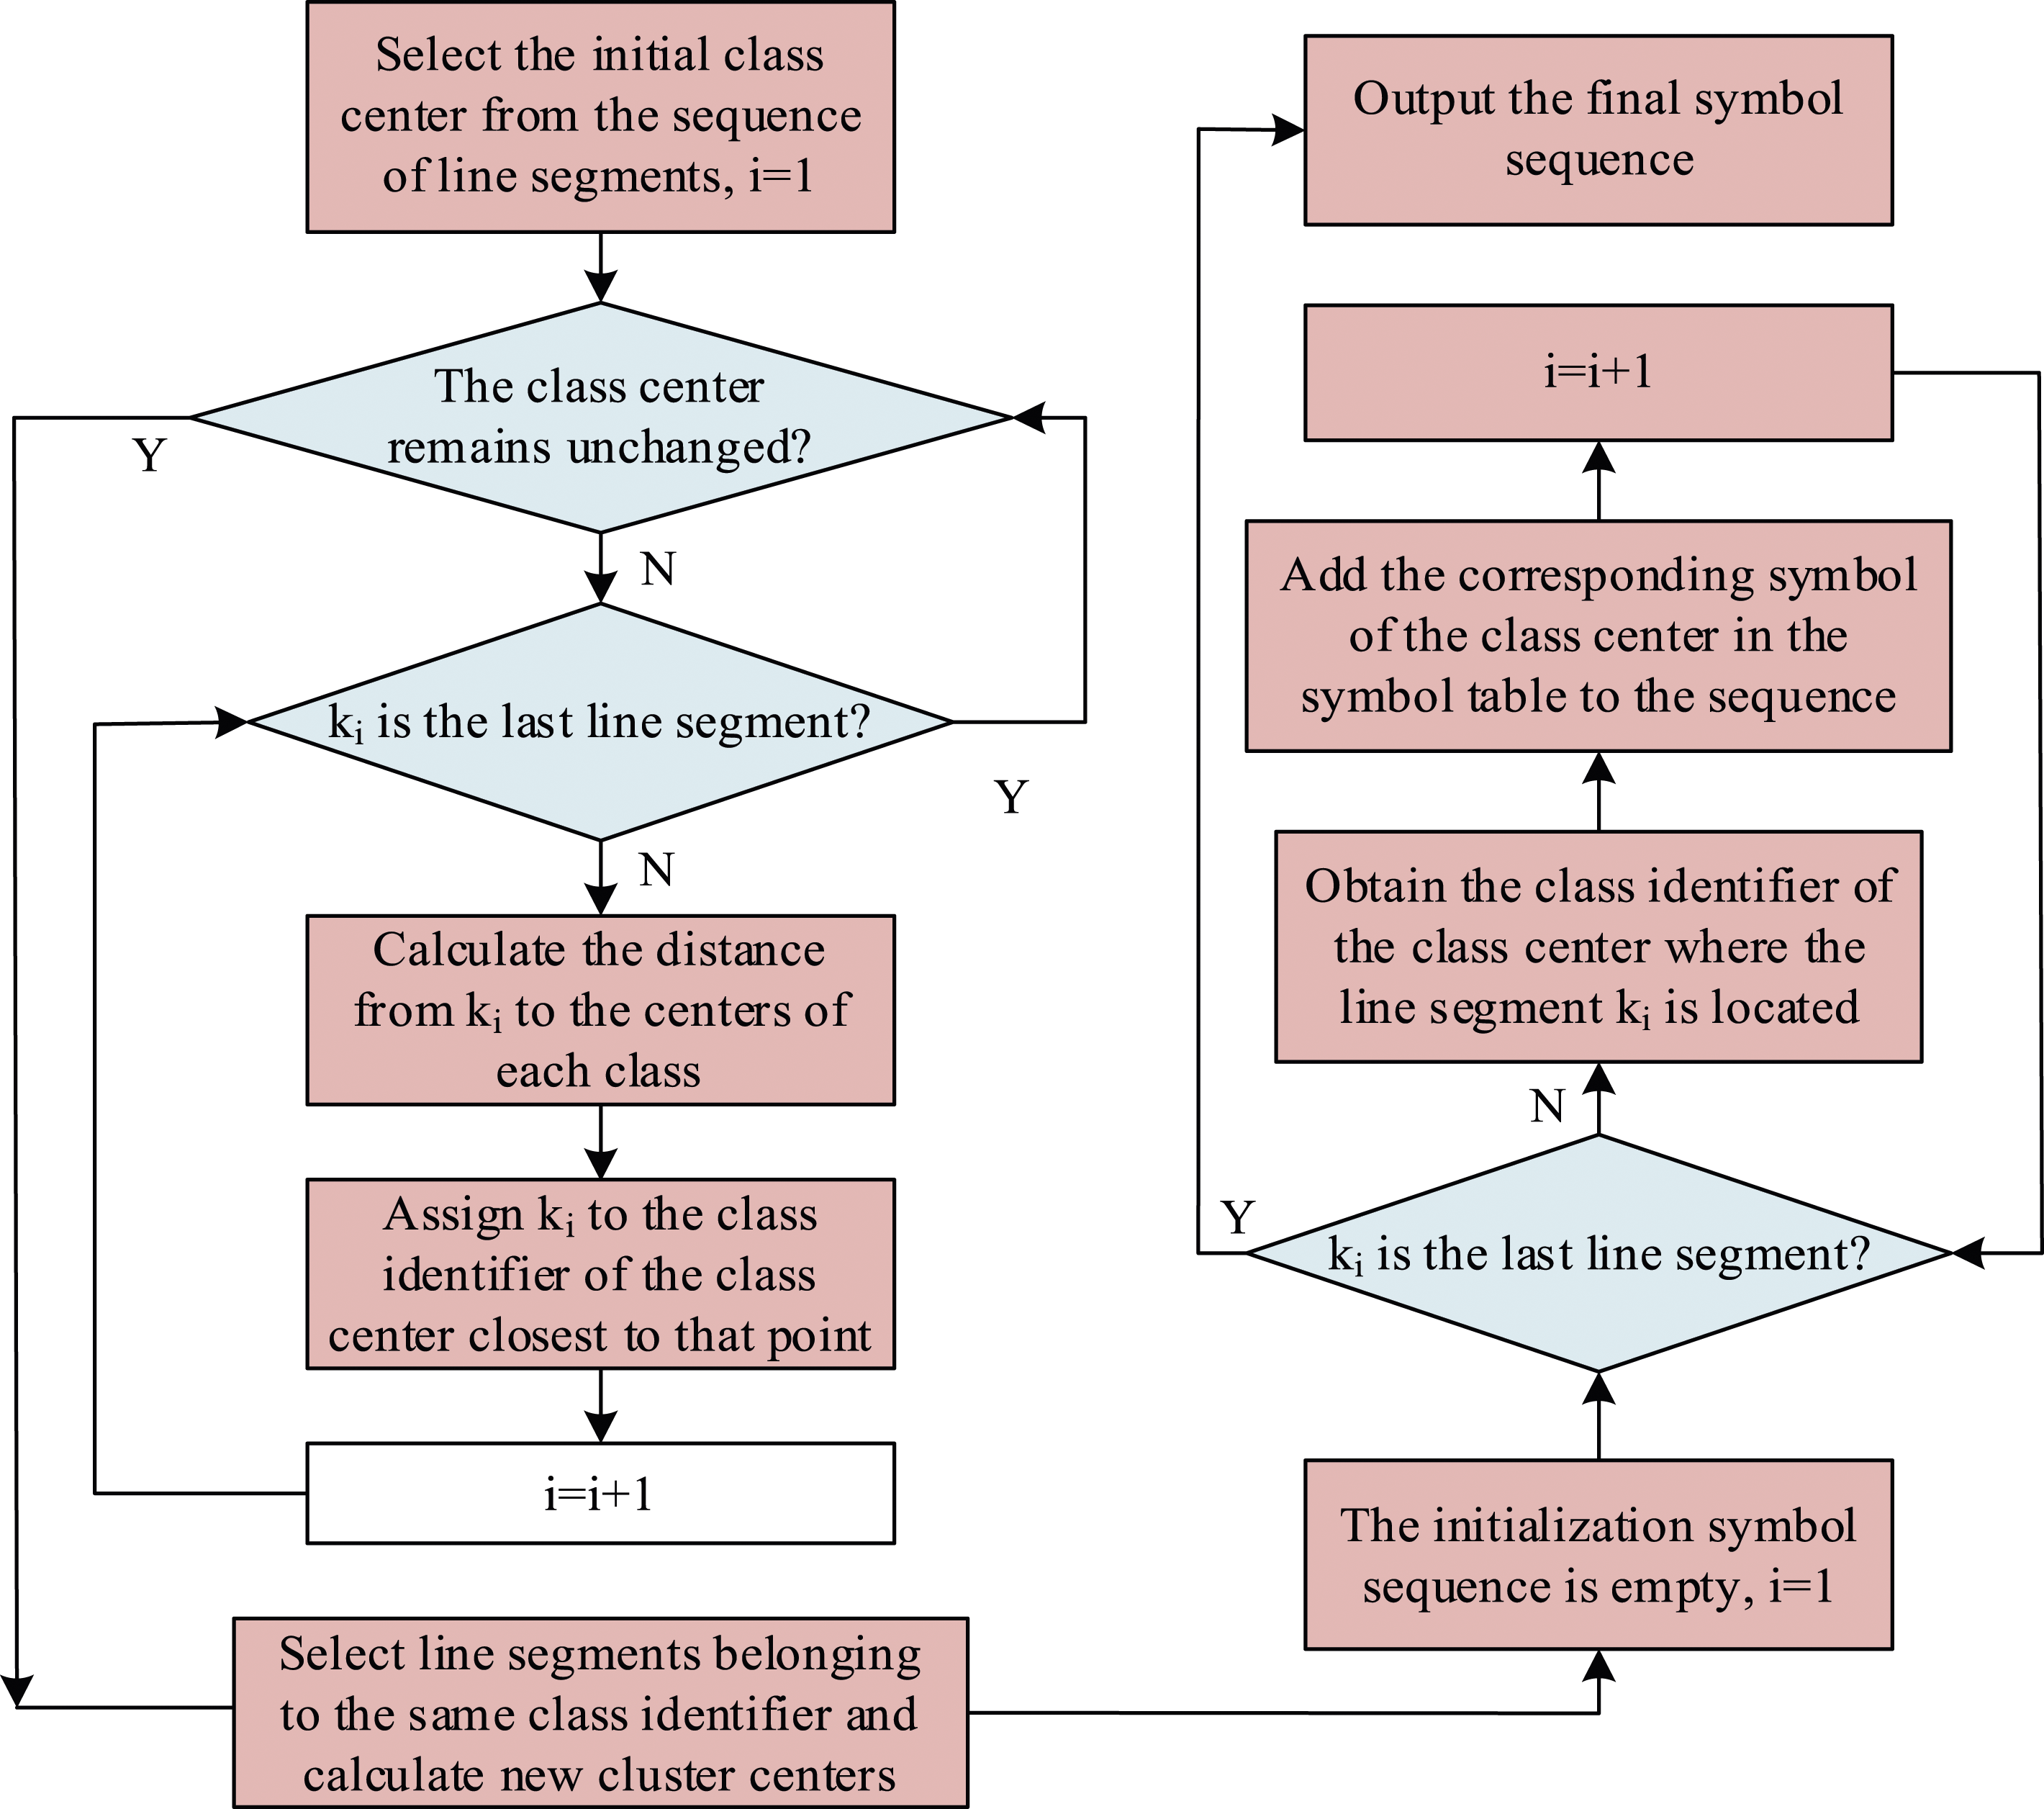
Considering that the K-Means algorithm can quickly and effectively cluster symbolized time series data, and find clusters with similar patterns through a simple iterative process, it has good interpretability. Therefore, the clustering algorithm selected for the study is the K-means algorithm. This method calculates the distance between a line segment and the center of each class using the Euclidean distance method, and the mathematical expression formula for Euclidean distance is shown in equation (5).

As shown in equation (5),

In equation (6), Time series symbolization flow chart.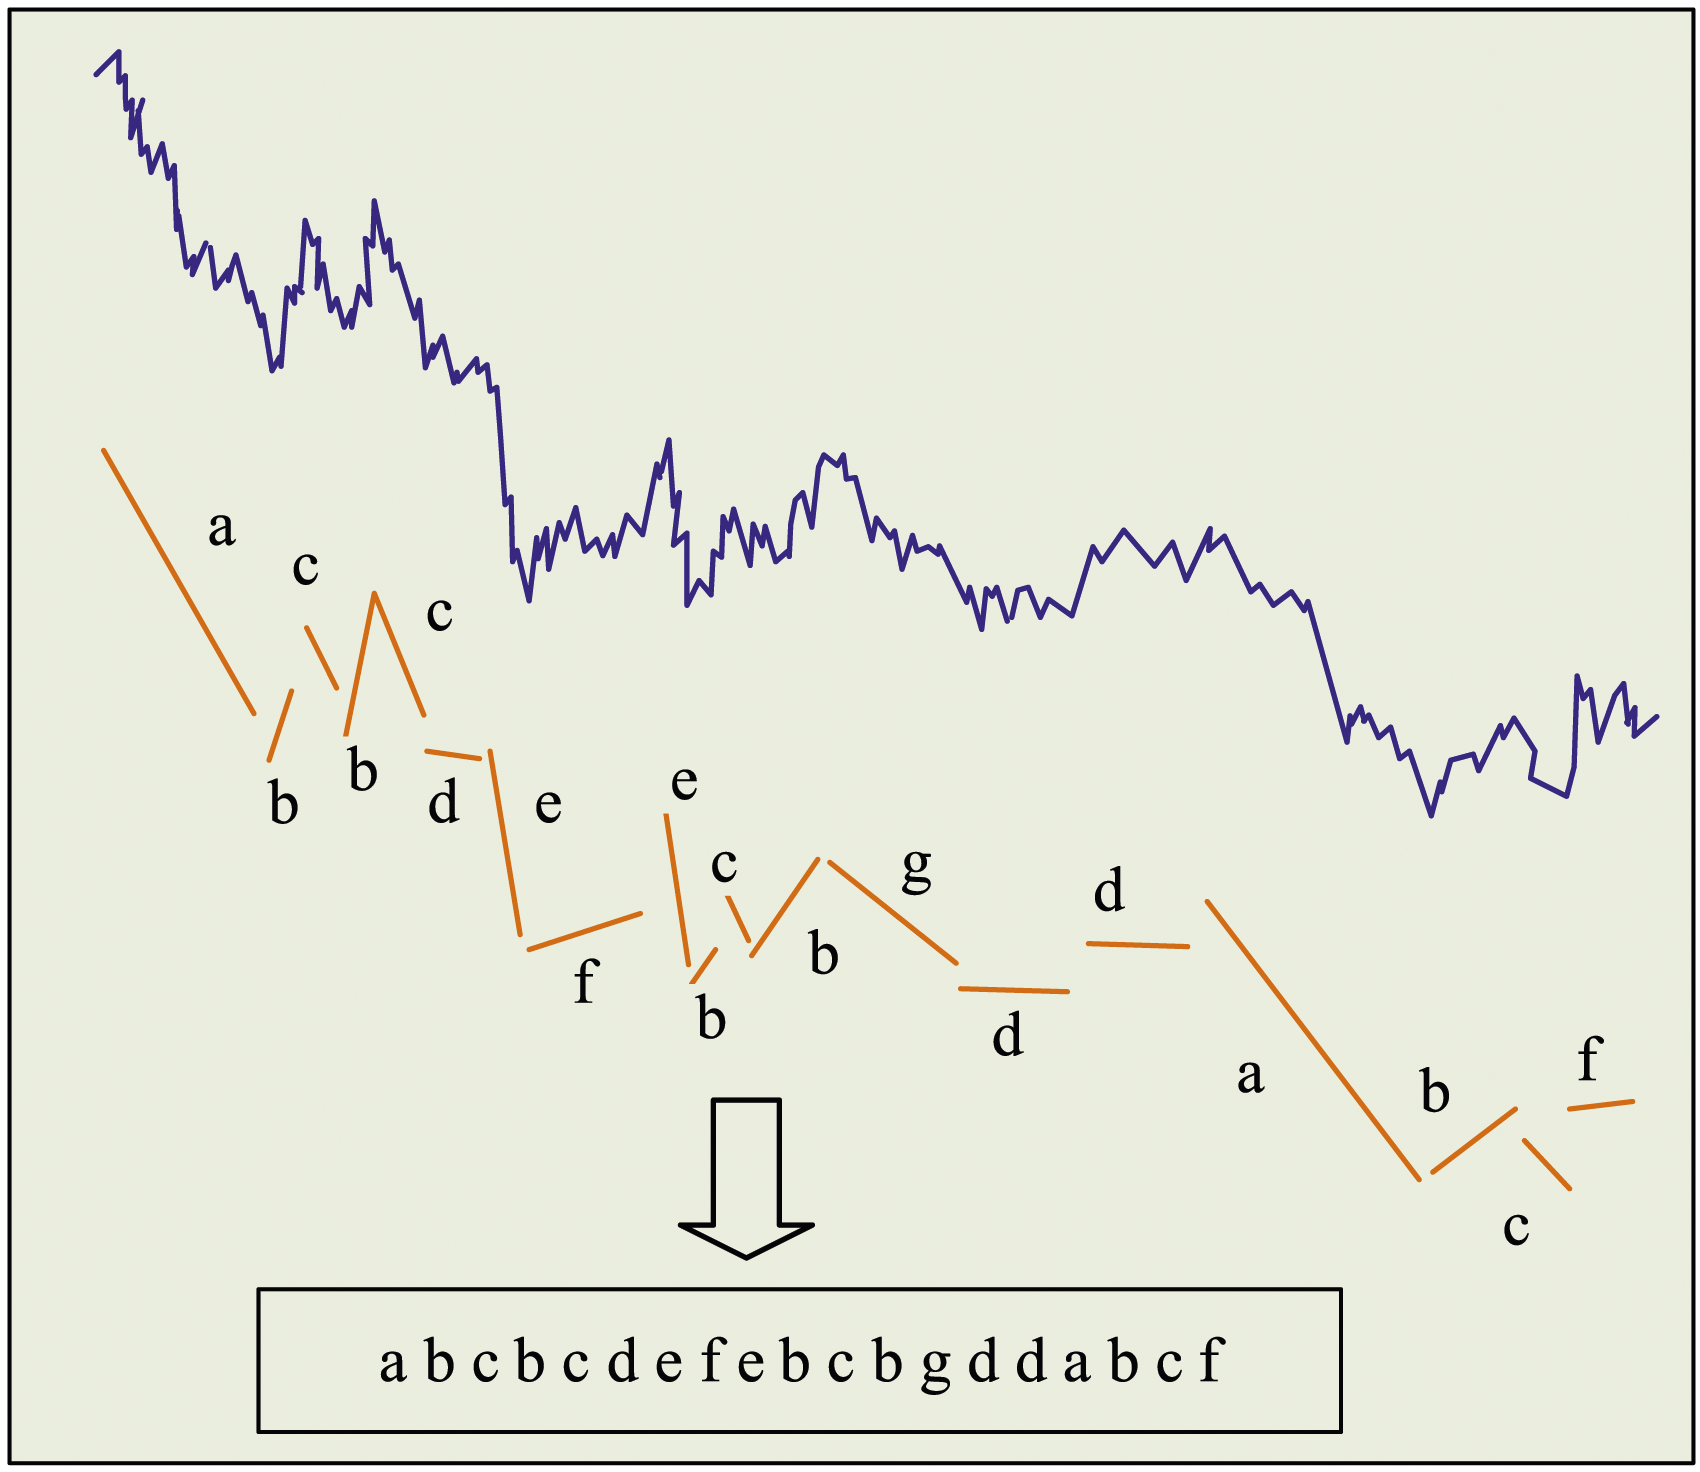
In Figure 3, the blue part denotes the original time series curve, and the selection result of important points indicates the approximate contour represented by the orange line segment. From the figure, the contour is roughly the same as the original curve. The result of linearization segmentation is displayed in the orange line segment in the figure, dividing the important point data curve into several straight line segments. The clustering symbolization results are shown in the letters a-f in the figure, assigning symbol representations to line segments with the same features, with each symbol representing an independent trend. The curve data shown in the figure can be represented by discrete symbols (abcbcdefebcbgddabdf) after symbolic processing.
Analysis of return data based on time series frequent itemset mining
After TSS, continuous time series curves are transformed into discrete symbol sequences. Next, it will conduct FIM of the time series, which sets the frequent data in the time series as the threshold itemset first to raise the efficiency of data analysis. Due to the large number of discrete time series symbols, research will first align the time series before further data mining. It assumes that the symbol sequence of

As shown in equation (7),

As shown in equation (8), Alignment operation diagram.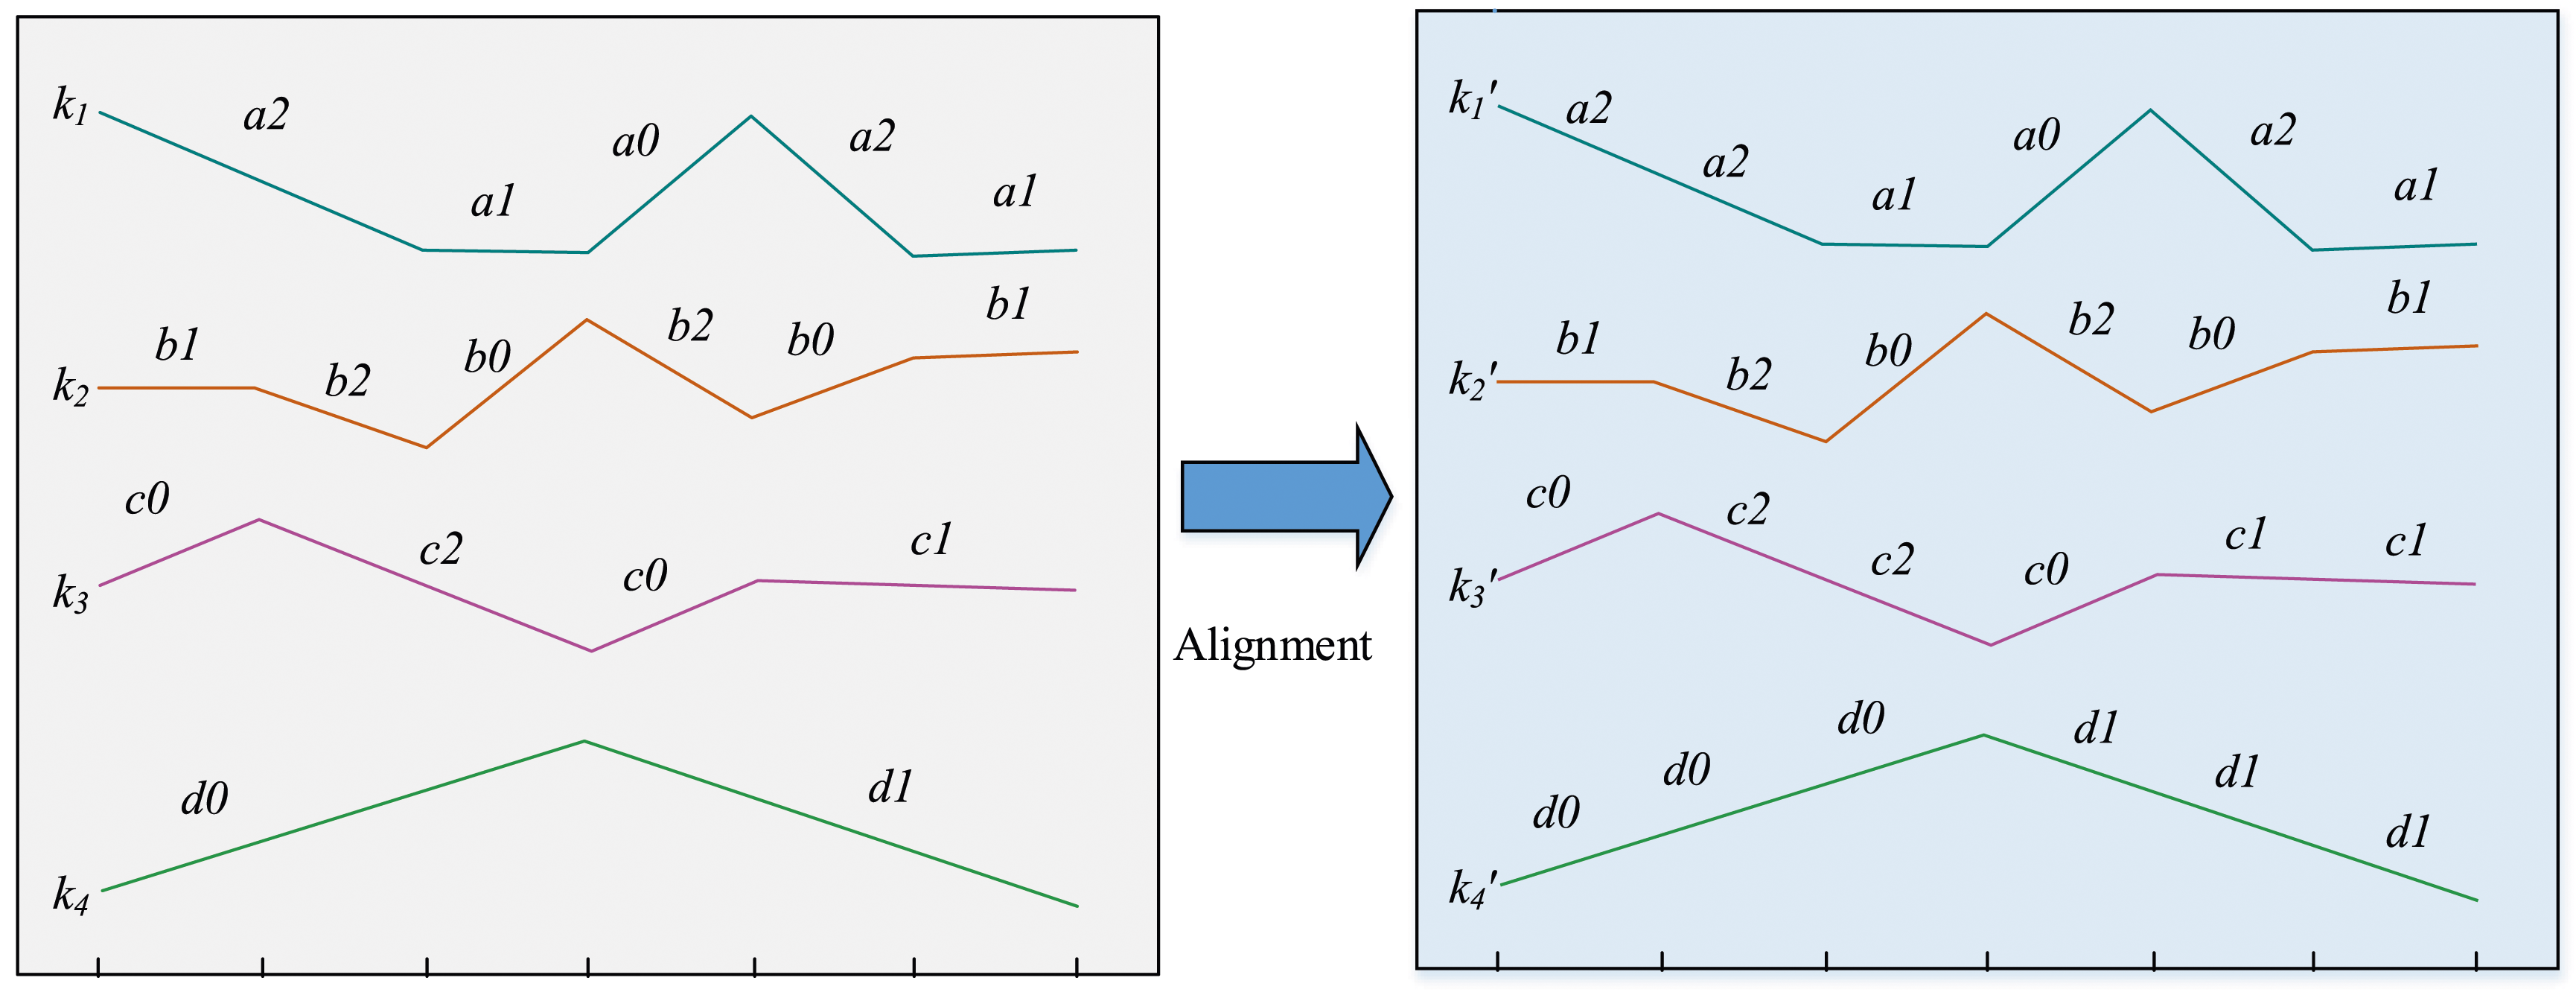
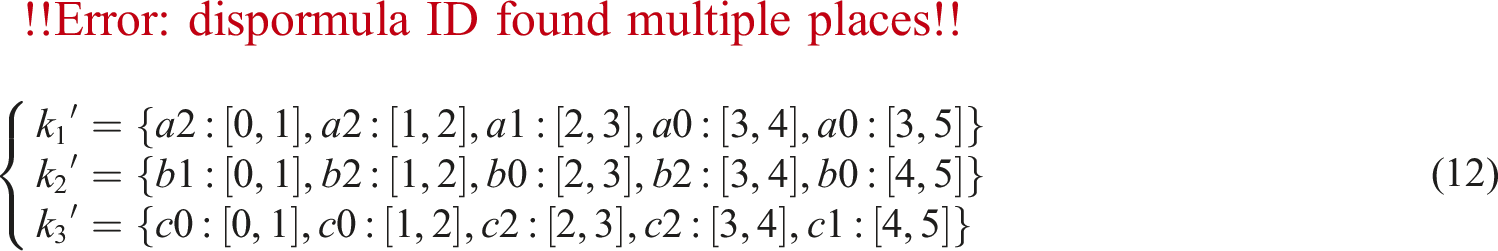
In Figure 4, due to the fact that the selection of segmentation points for the three symbol sequences formed by three different time series may not be the same in the linearization segmentation step, it is necessary to align the segmentation points of the three symbol sequences before conducting FIM, so that the segmentation points of each symbol sequence are consistent. It can be seen that after the alignment operation, the segmentation points of each symbol sequence become consistent. As this study focuses more on the frequent patterns of trend changes in various time series, only the slope of the line segment is considered as the feature. However, segmenting the same line segment does not change the slope value of the line segment before and after segmentation. Therefore, in the alignment operation, the symbol of the separated new line segment remains consistent with the symbol of the line segment before segmentation. When aligning the symbol sequence, it first combines the breakpoints of all the character sequence

As shown in equation (9), after the symbolization and alignment operations of the resulting time series, the original time series data is transformed into a dataset
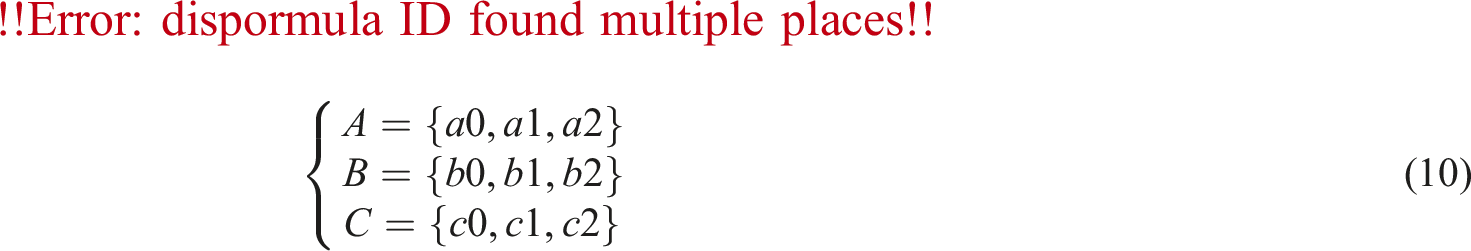
As shown in equation (10), the symbol table of the three
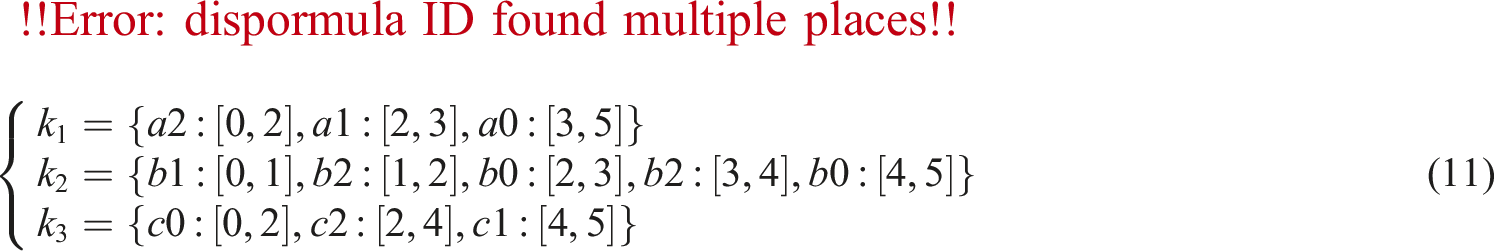
As shown in equation (11) and Figure 4, the numbers in the square brackets represent the start point and end breakpoint of the subsequence. The three symbolized sequences are aligned as shown in equation (12).
As shown in equation (12), after the alignment operation, the same subsequence can be combined into an item set. For example, Number of frequent itemsets.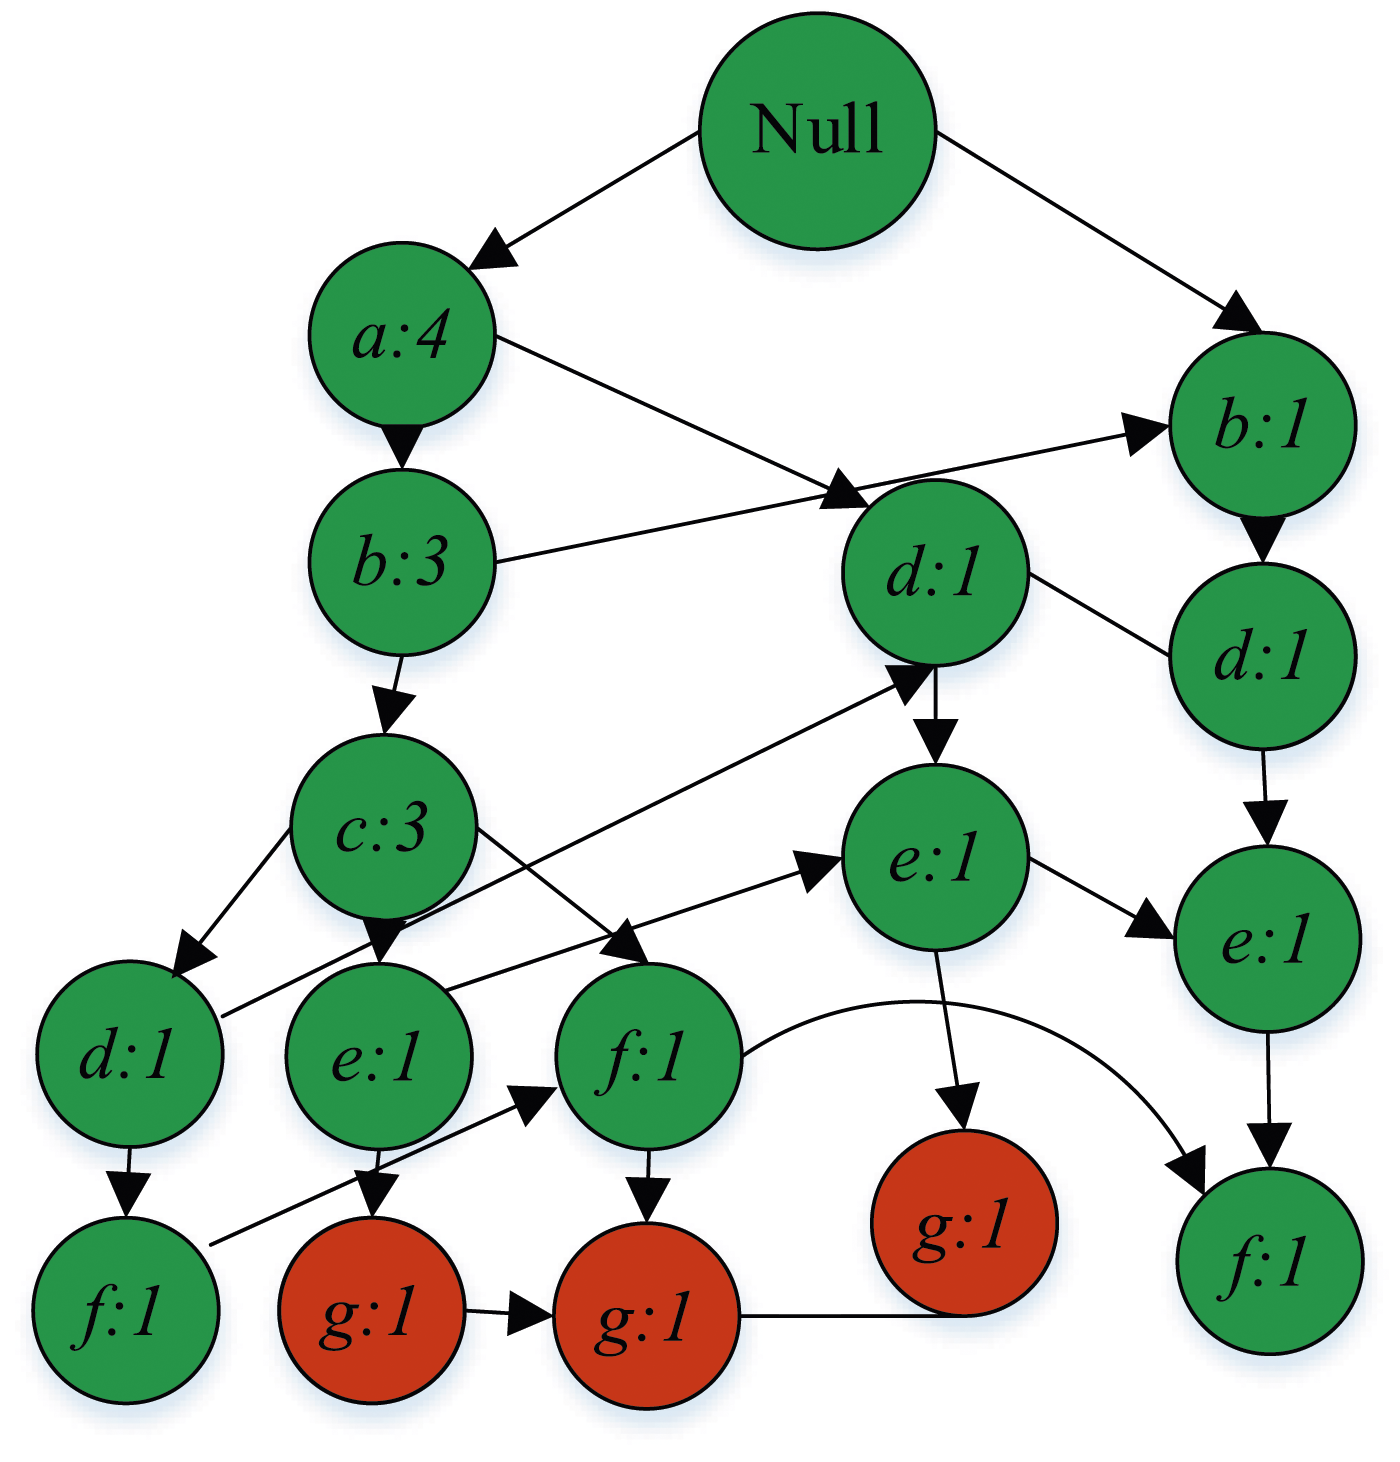
As shown in Figure 5, the closer the node symbol sequence is to the root of the tree, the higher the frequency. Null means the original sequence, and data mining searches from a to the last item g. For example, the FP-tree of the last term g includes three branches, namely, <a: 4, b: 3, a: 3, e: 1, g: 1>, <a: 4, b: 3, a: 3, f: 1, g: 1>, and<a: 4, d: 1, e: 1, g: 1>. Although a appears a total of four times, it only appears once in one path that appears with g, that is, the itemset of statistical g, that is, the prefix path of statistical g, is <abceg: 1>, <abcfg: 1>, and <adeg: 1>, respectively. The relevant indicator of the FP-growth algorithm is support, and the mathematical expression for support is shown in equation (13).

As shown in equation (13),

As shown in equation (14),
When using the proposed FIM algorithm to analyze e-commerce return data, considering the privacy and security issues of user data, the research will anonymize user data before data mining, including de-identification, generalization and perturbation technology, so as to avoid the disclosure of personal identity information to the greatest extent. In the transmission and storage of data related to e-commerce returns, secure transmission protocols and encryption algorithms are mainly used to ensure that the data is not accessed and stolen by malicious parties. In addition, for particularly sensitive e-commerce return data, differential privacy technology is mainly used to protect user privacy. Differential privacy is a relatively advanced privacy protection technology, which can enhance the protection of original data and has great advantages in data security. This method can solve the privacy and security problems well.
Results and discussion
This study used e-commerce return related data as experimental data for experiments. The TSS, symbol pairing, and FIM results were divided to understand which indicators have the highest support rate in e-commerce return data. Other relevant data mining algorithms were introduced to compare with the algorithms in this study, and the superiority of this research algorithm was analyzed. 23
Algorithm performance testing
Experimental software and hardware environment.
To verify the robustness of the proposed method on different datasets, two datasets were selected for testing. One of the datasets was the T20.I6.450K dataset, which contains 450000 transactions with an average of 20 items per transaction. The study selected one of them. The other dataset was the Mushroom dataset, which belongs to the University of California Irvine machine learning library. The total sample size of this dataset was 8124, and the project set contained 119. 23 was the maximum length of the transaction. At the same time, to demonstrate the differences in the comparison results of the five algorithms, a t-test was conducted to verify the significant differences in the results, with p < 0.05 indicating significant differences. The comparison results of the five algorithms in the two selected datasets are shown in Figure 6. Comparison results of five algorithms on two selected datasets. (a) Comparison of runtime in T20.16.450K dataset. (b) Comparison of memory usage in Mushroom dataset. (c) Comparison of runtime in T20.16.450K dataset. (d) Comparison of memory usage in Mushroom dataset.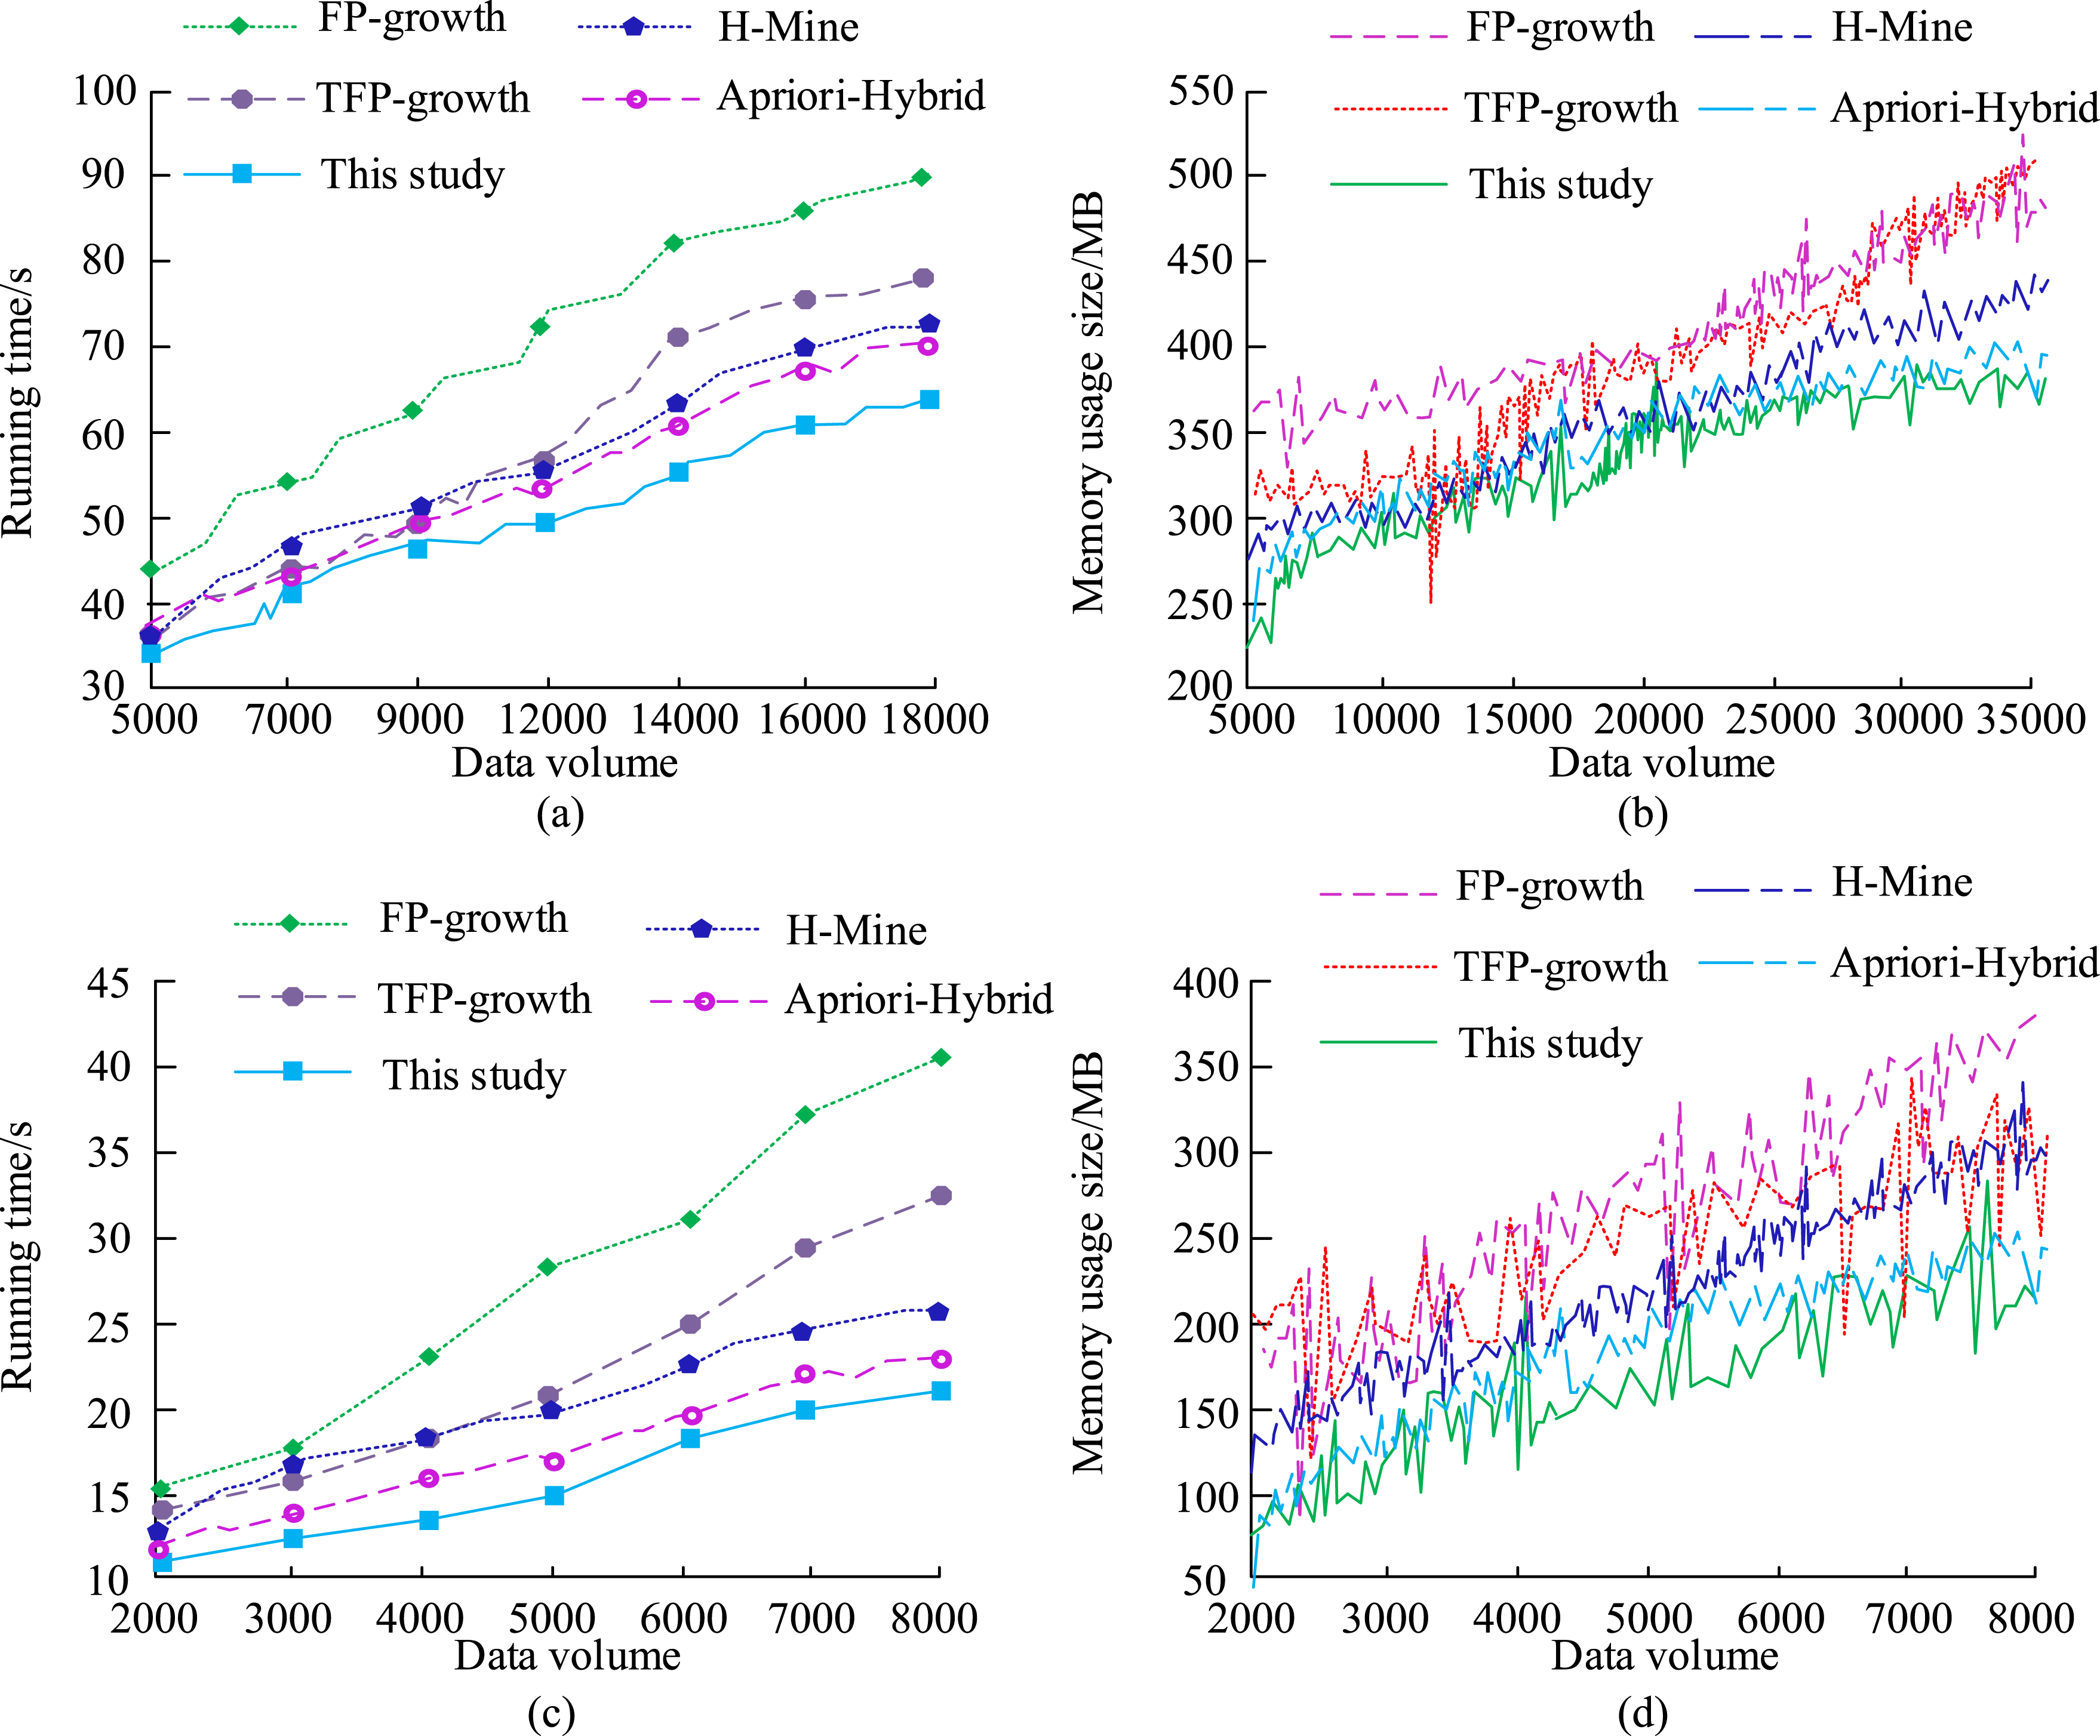
In Figure 6(a) and (b) represent the comparison results of the running time and memory usage of the five methods in the T20.I6.450K dataset, respectively. Figure 6(a) and (b) represent the comparison results of the running time and memory usage of the five methods in the Mushroom dataset, respectively. From Figure 6(a) and (b), in the T20.I6.450K dataset, the method proposed in this study had a slower change in running time, with a maximum of only 65 s and a maximum memory usage of 350 MB, which was significantly better than the other four methods (p < 0.05). From Figure 6(a) and (b), in the Mushroom dataset, the running time of the proposed method fluctuated between 10 s and 20 s, with an increase in magnitude, and the highest memory usage was only 260 MB, showing a significant advantage with statistical significance (p < 0.05). Overall, the proposed method exhibited better performance and robustness in different datasets.
E-commerce return data mining testing
Original element symbol table.
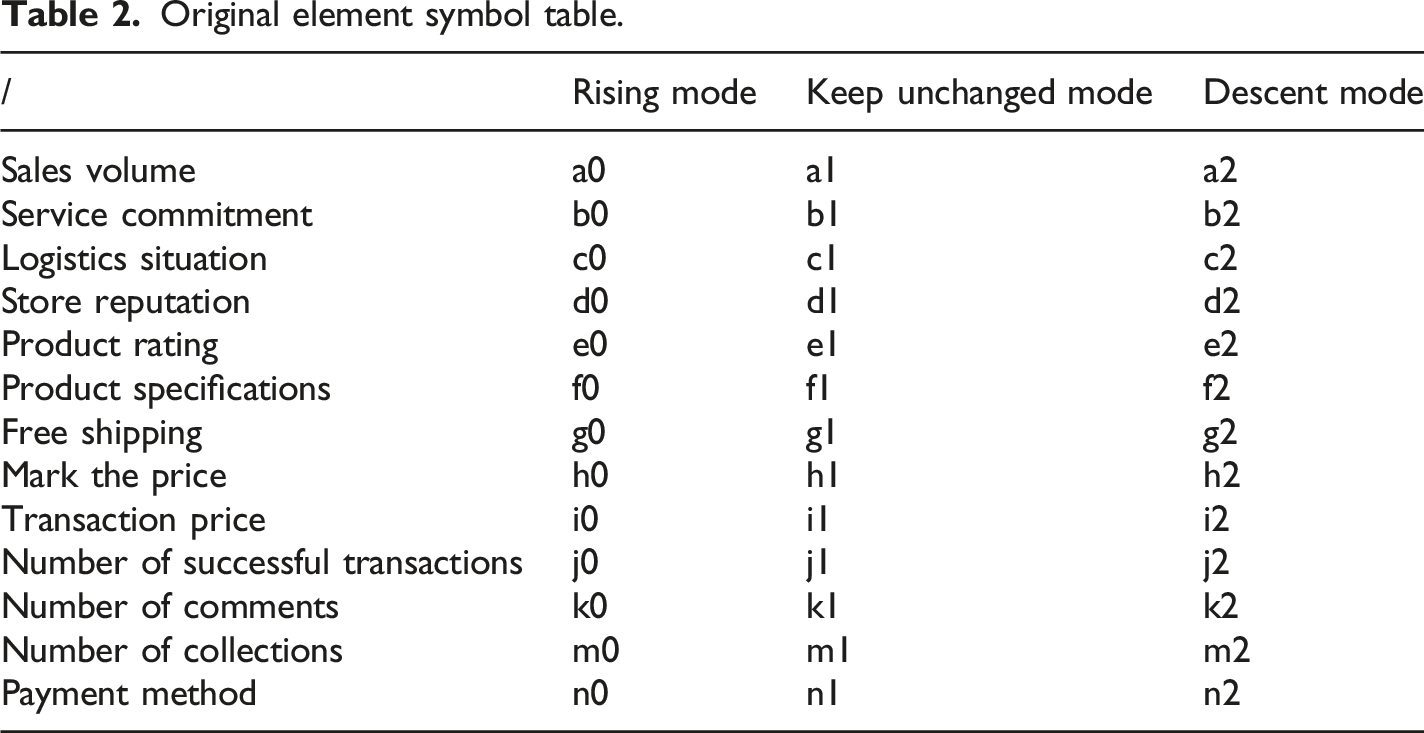
As shown in Table 2, 13 original related indicators were represented by letter symbols, such as a for sales, b for service commitment, and c for logistics. The time series curve data was all represented by an increase, a decrease, and a basic constant, as shown in the sales element in the table. a0 represents an increase in product sales; a1 indicates a basic constant sales; a2 denotes a decrease in sales; b0 refers to additional service commitments, such as freight insurance; b1 expresses basic service commitments, such as 7-day no reason return or exchange; b2 denotes no service commitments. Using the first three data in Table 2 as experimental data, the linear segmentation method designed in this study was experimented with an IES algorithm and a classic sliding window segmentation algorithm. The results were compared and analyzed from two aspects: compression rate and fitting error. The results are shown in Figure 7. Comparison chart of linear segmentation results. (a) Compression ratio comparison chart. (b) Comparison of fitting errors.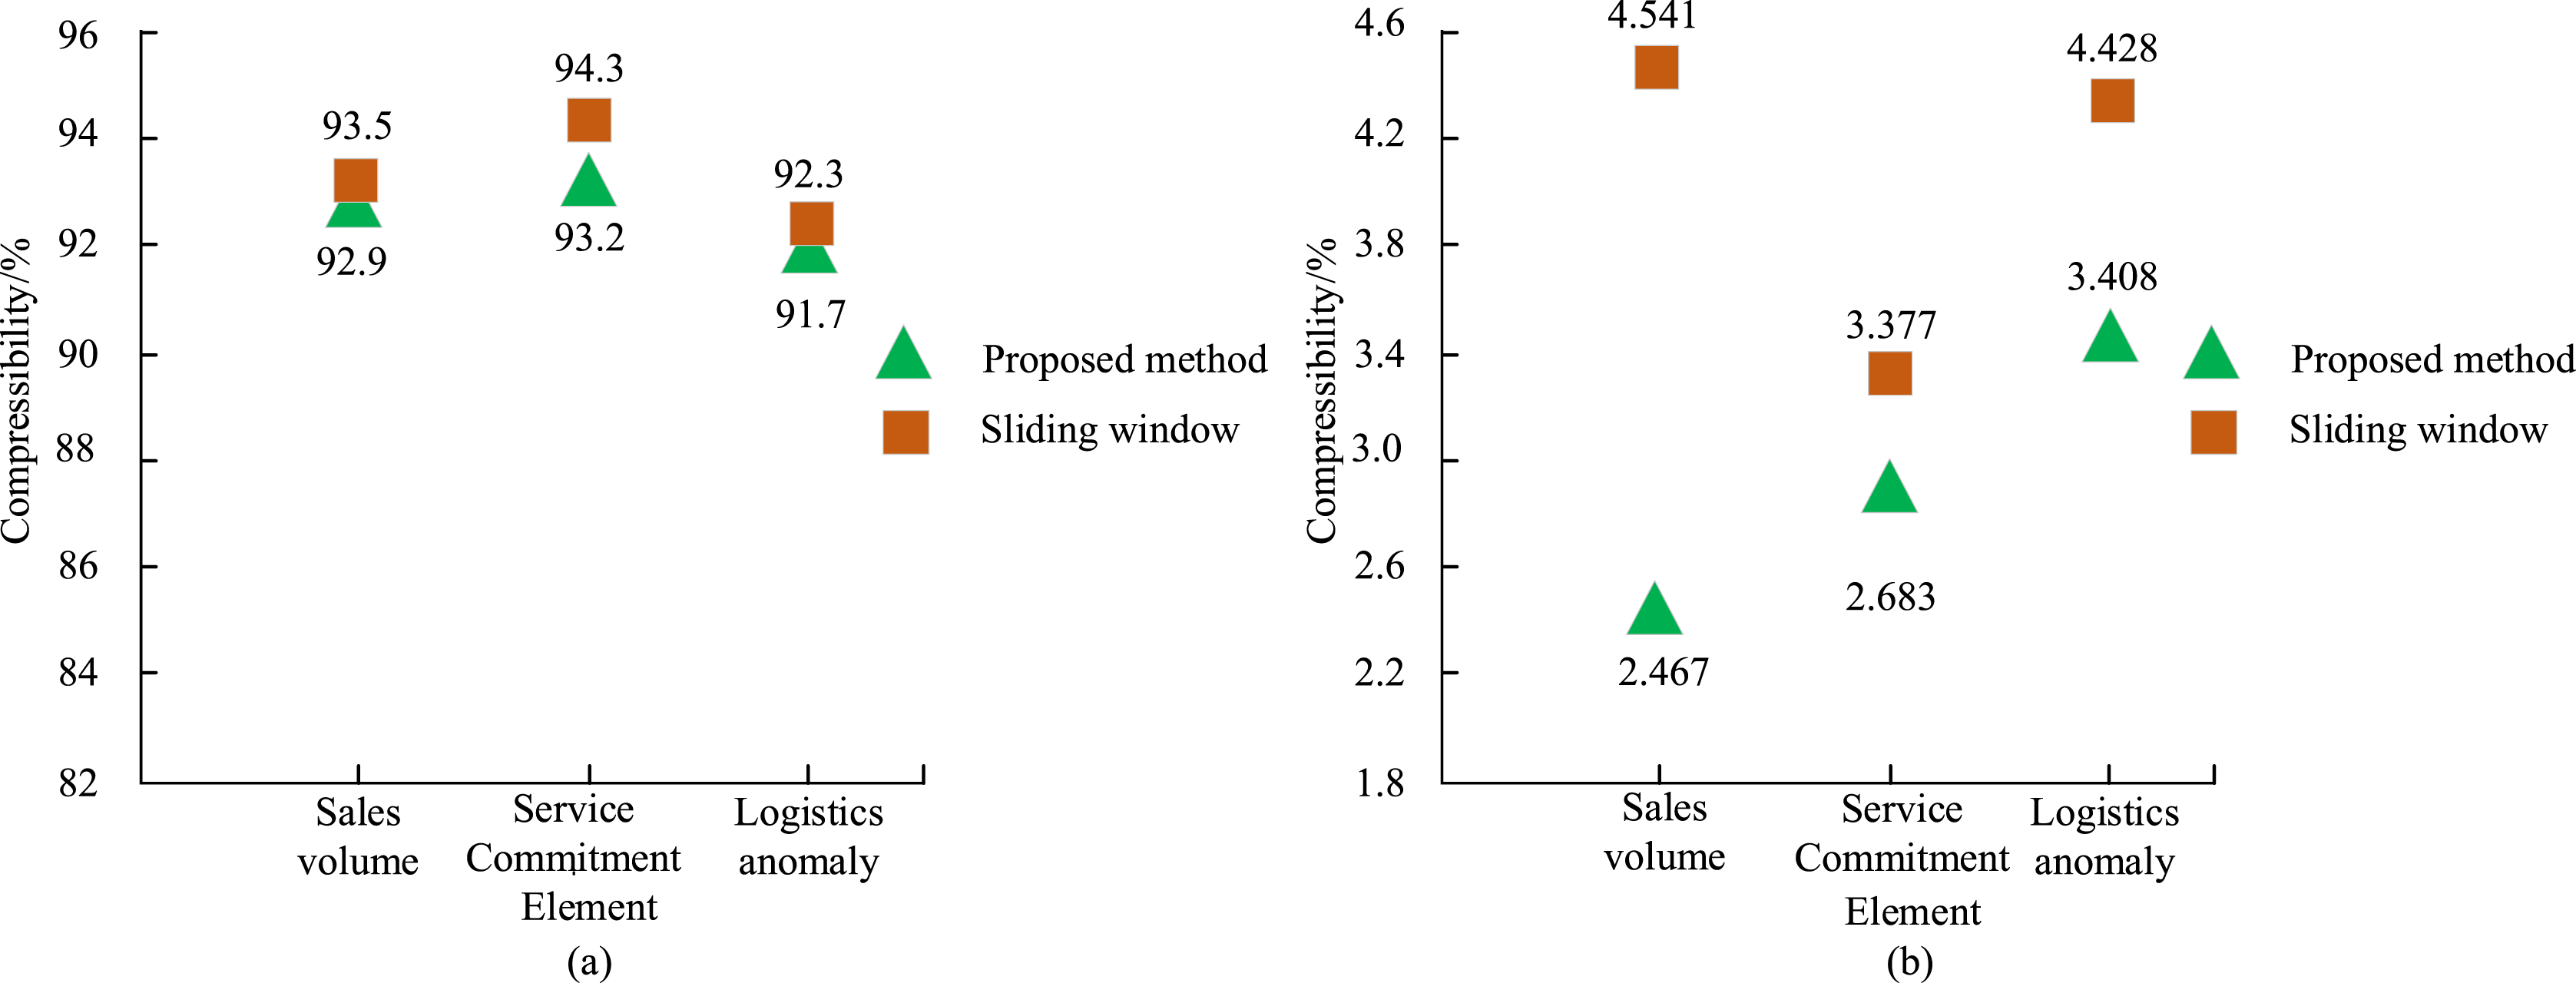
As shown in Figure 7(a), the compression rate of the incremental segmentation method in this study was basically the same as that of the sliding window segmentation algorithm, with compression rates above 90%. Among them, the compression rate of the service commitment element was the highest at 93.2%, and the overall compression segmentation effect was excellent. In Figure 7(b), the fitting error based on the incremental segmentation method was significantly smaller than that of the sliding window segmentation method. Among them, the fitting error of the sales element was the smallest at 2.467, a decrease of 2.074 compared to the sliding window method, and an average decrease of 1.382. Overall, the method used in this study significantly reduced fitting errors, resulting in smaller linear segmentation errors and higher performance, with little change in compression ratio compared to traditional methods. To further assess the effectiveness of the method designed in this study, the traditional frequent itemset algorithm Apriori and the unimproved FP-growth algorithms were compared in the same dataset. The study introduced the size of experimental memory data and experimental runtime to reflect the algorithm’s performance. The comparison of the outcomes is shown in Figure 8. Comparison chart of linear segmentation results. (a) Memory usage comparison chart. (b) Excavation time comparison chart.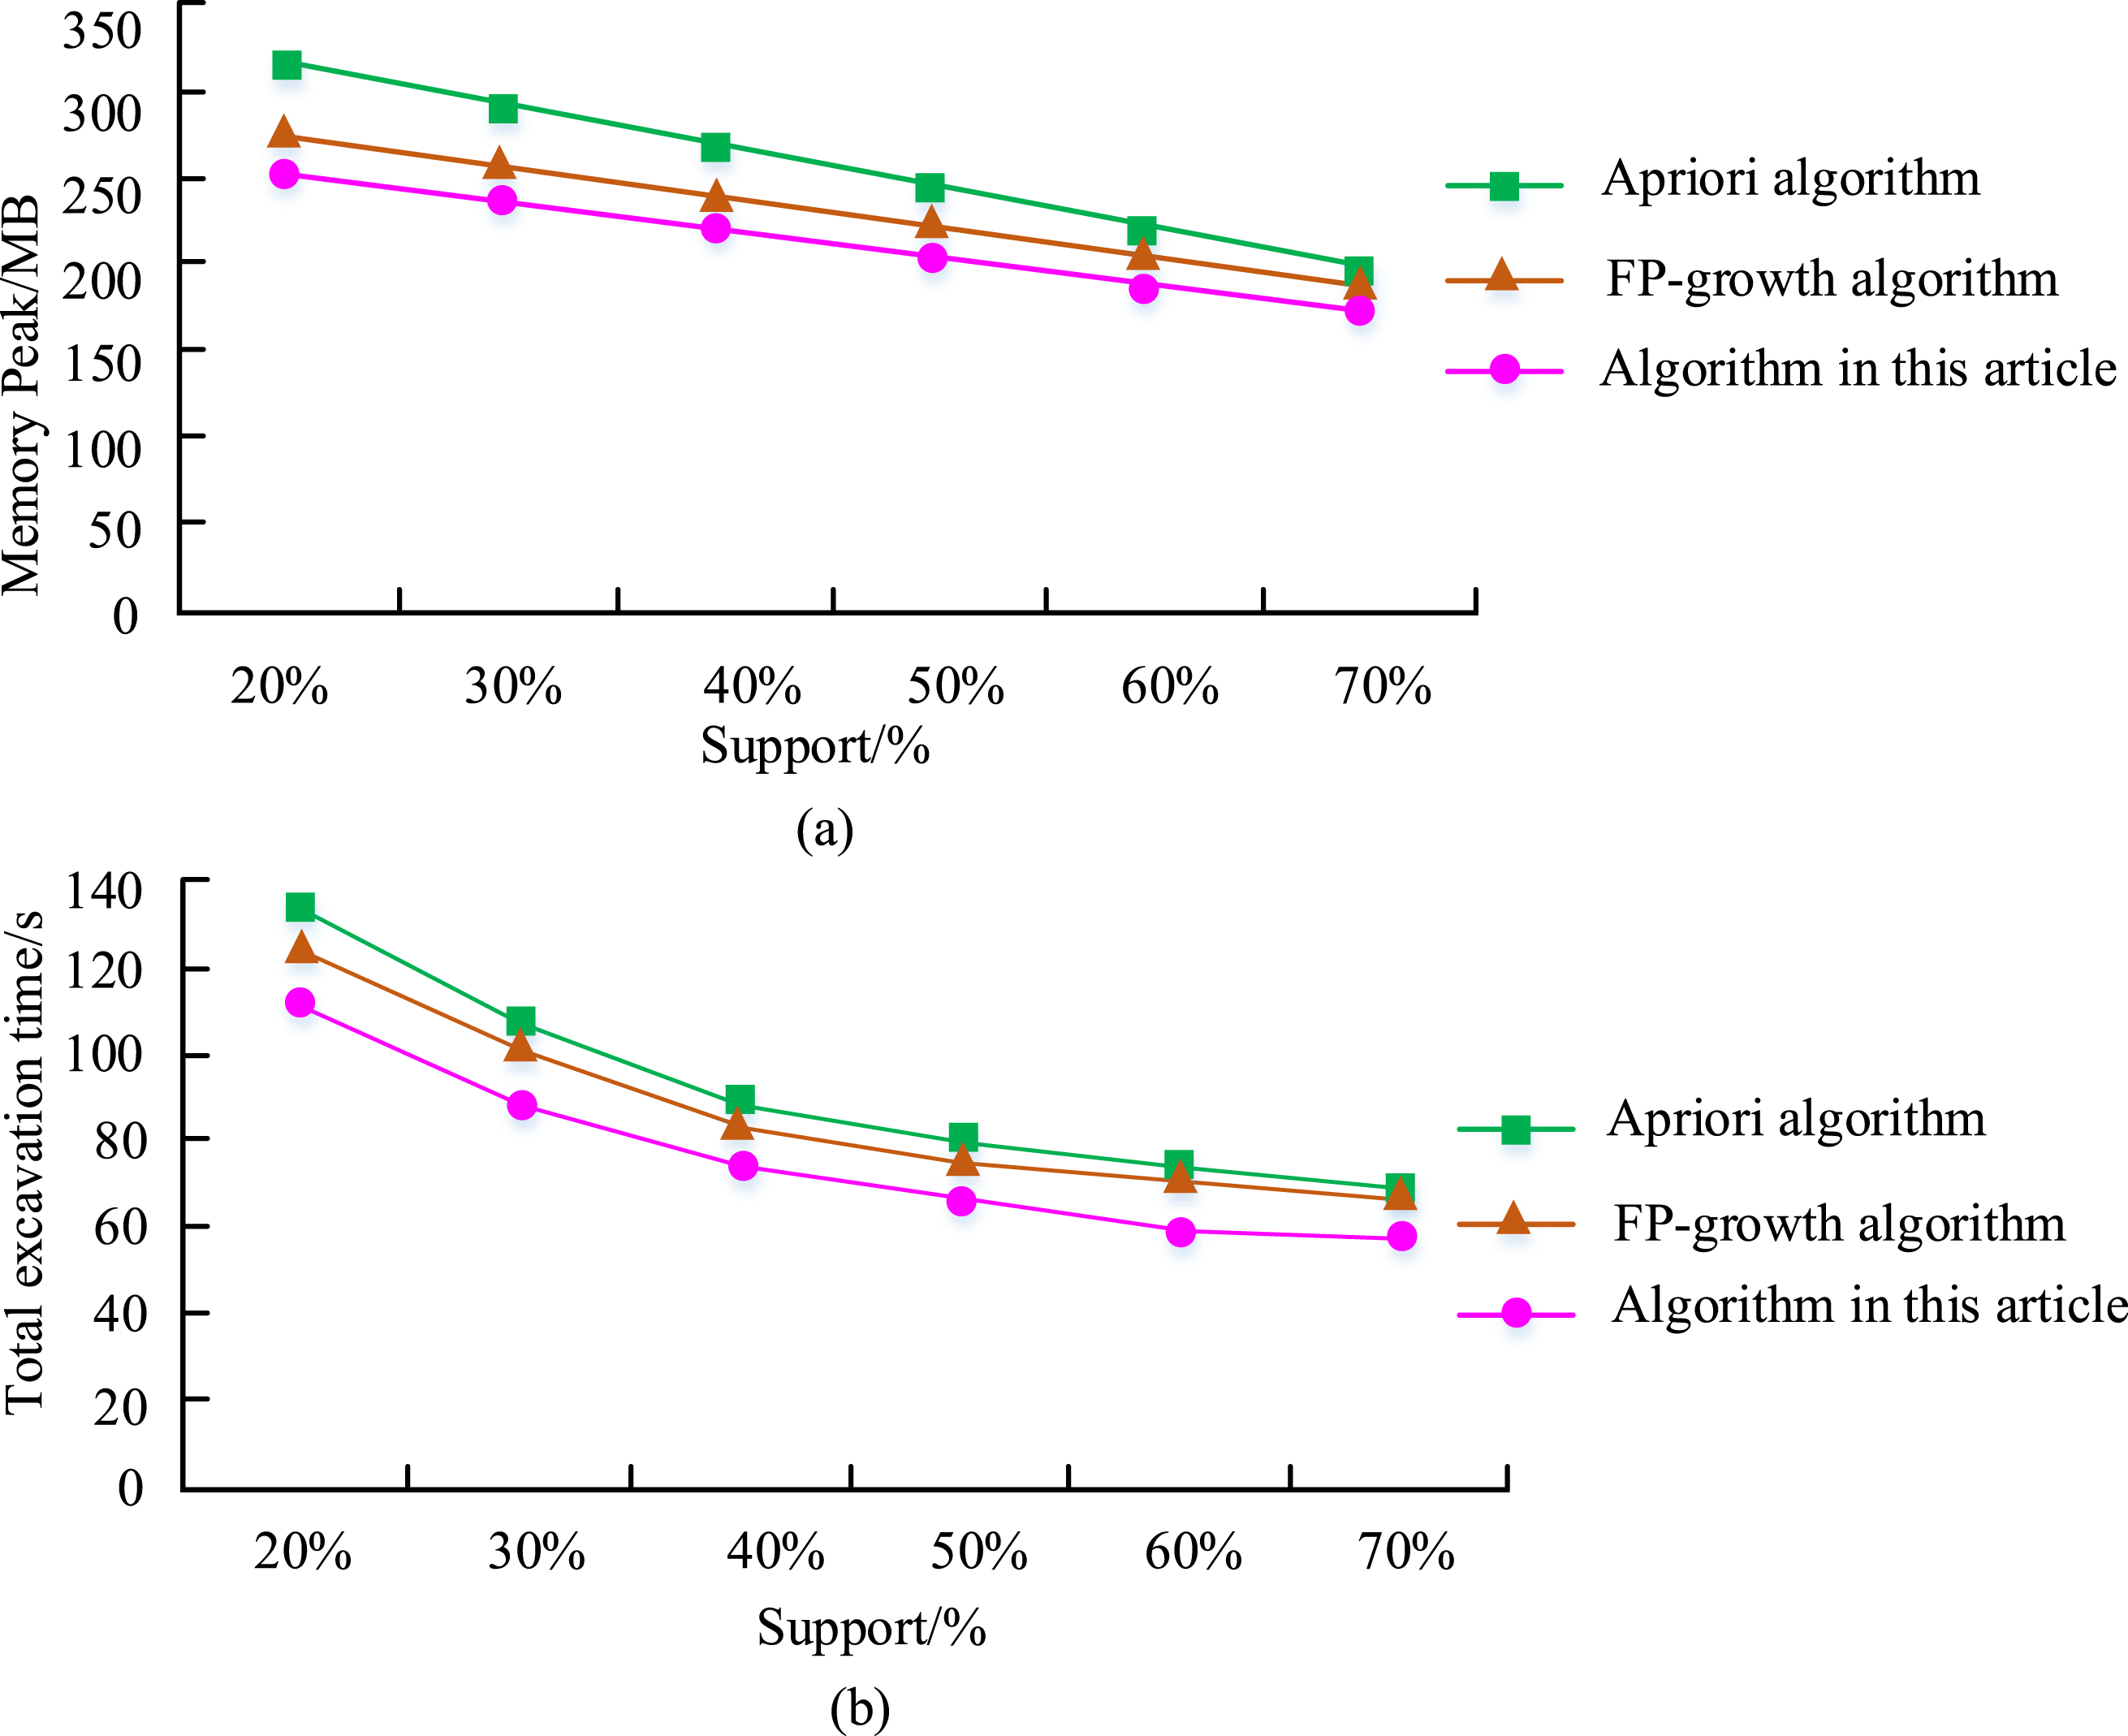
As shown in Figure 8(a), the memory peak value of the three algorithms decreased with the rising of support. With the increase of support, the amount of data segmentation points decreased, the amount of itemsets that met segmentation decreased, and the memory peak value decreased accordingly. Among them, when the support level is 20%, the memory peaks of Apriori algorithm, unimproved FP-growth algorithm, and improved FP-growth algorithm are 284 MB, 263 MB, and 241 MB, respectively. And when the support level increased to 60%, the peak memory of each algorithm decreased to 238 MB, 228 MB, and 204 MB, respectively. Meanwhile, the memory peak of the algorithm proposed by the research institute has always been the lowest, reaching only 187 MB at a support rate of 70%, which is significantly lower than other algorithms. As shown in Figure 8(b), the overall running time of each algorithm also decreases with the increase of support, reaching a stable state after reaching about 70% support. Among them, the running time of the proposed algorithm is the lowest overall, only 63.54 s, which is 18.54 s less than the unimproved FP-growth algorithm. The improved FP-growth algorithm proposed by the research institute has significant advantages in memory consumption, runtime, and algorithm stability.
Test results of five methods in the e-commerce return data (%).
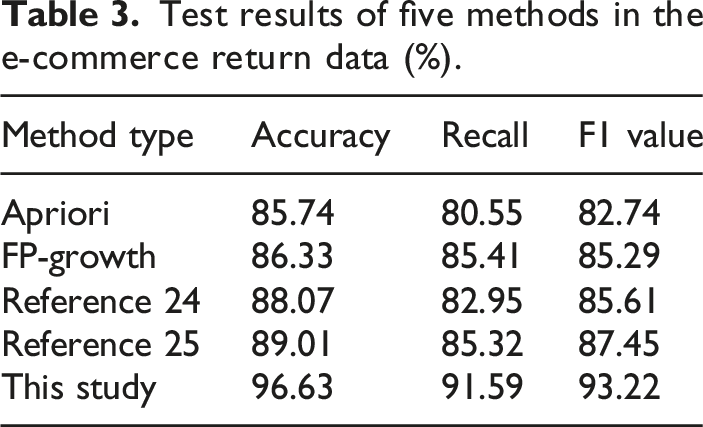
From Tables 3, it can be seen that in the processing of e-commerce return data, the method proposed in this study has an accuracy rate, recall rate and F1 value of 96.63%, 91.59%, and 93.22%, respectively. All three indicators exceed 90%, which is significantly better than the four methods compared. This proves that the proposed method can accurately mine return data and has significant comprehensive advantages.
Empirical analysis of e-commerce return data
Original element symbol table.
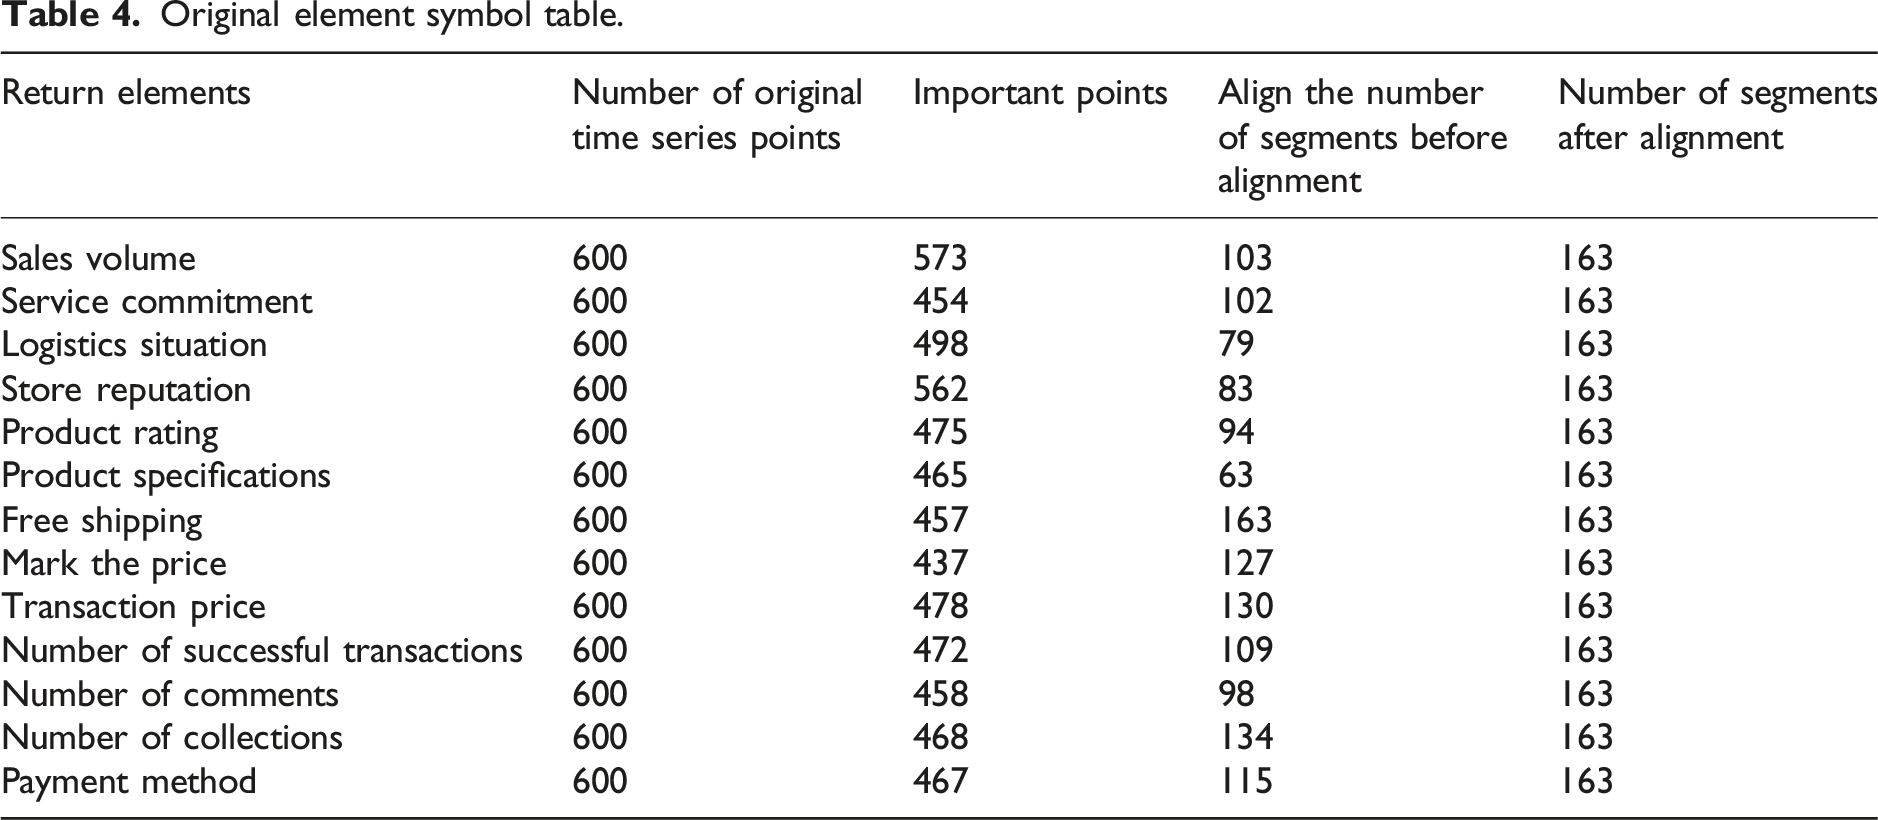
As shown in Table 4, the original time series points for each indicator were selected as 600 points, with most of the selected important points ranging from 400 to 500. Sales and store reputation indicators had more important points, around 550, indicating that the time series was relatively complex and might have a high support rate. The final segmentation point after sequence alignment operation was 159. Next, the aligned subsequence was symbolized. The symbols of each indicator are shown in Table 1. It selected some symbolic data results of the first three indicators in Table 2 for symbolic analysis. The symbolic results are shown in Figure 9. Symbolized schematic diagram. (a) Symbolization diagram of sales elements. (b) Symbolic diagram of service commitment elements. (c) Symbolization diagram of logistics abnormal elements.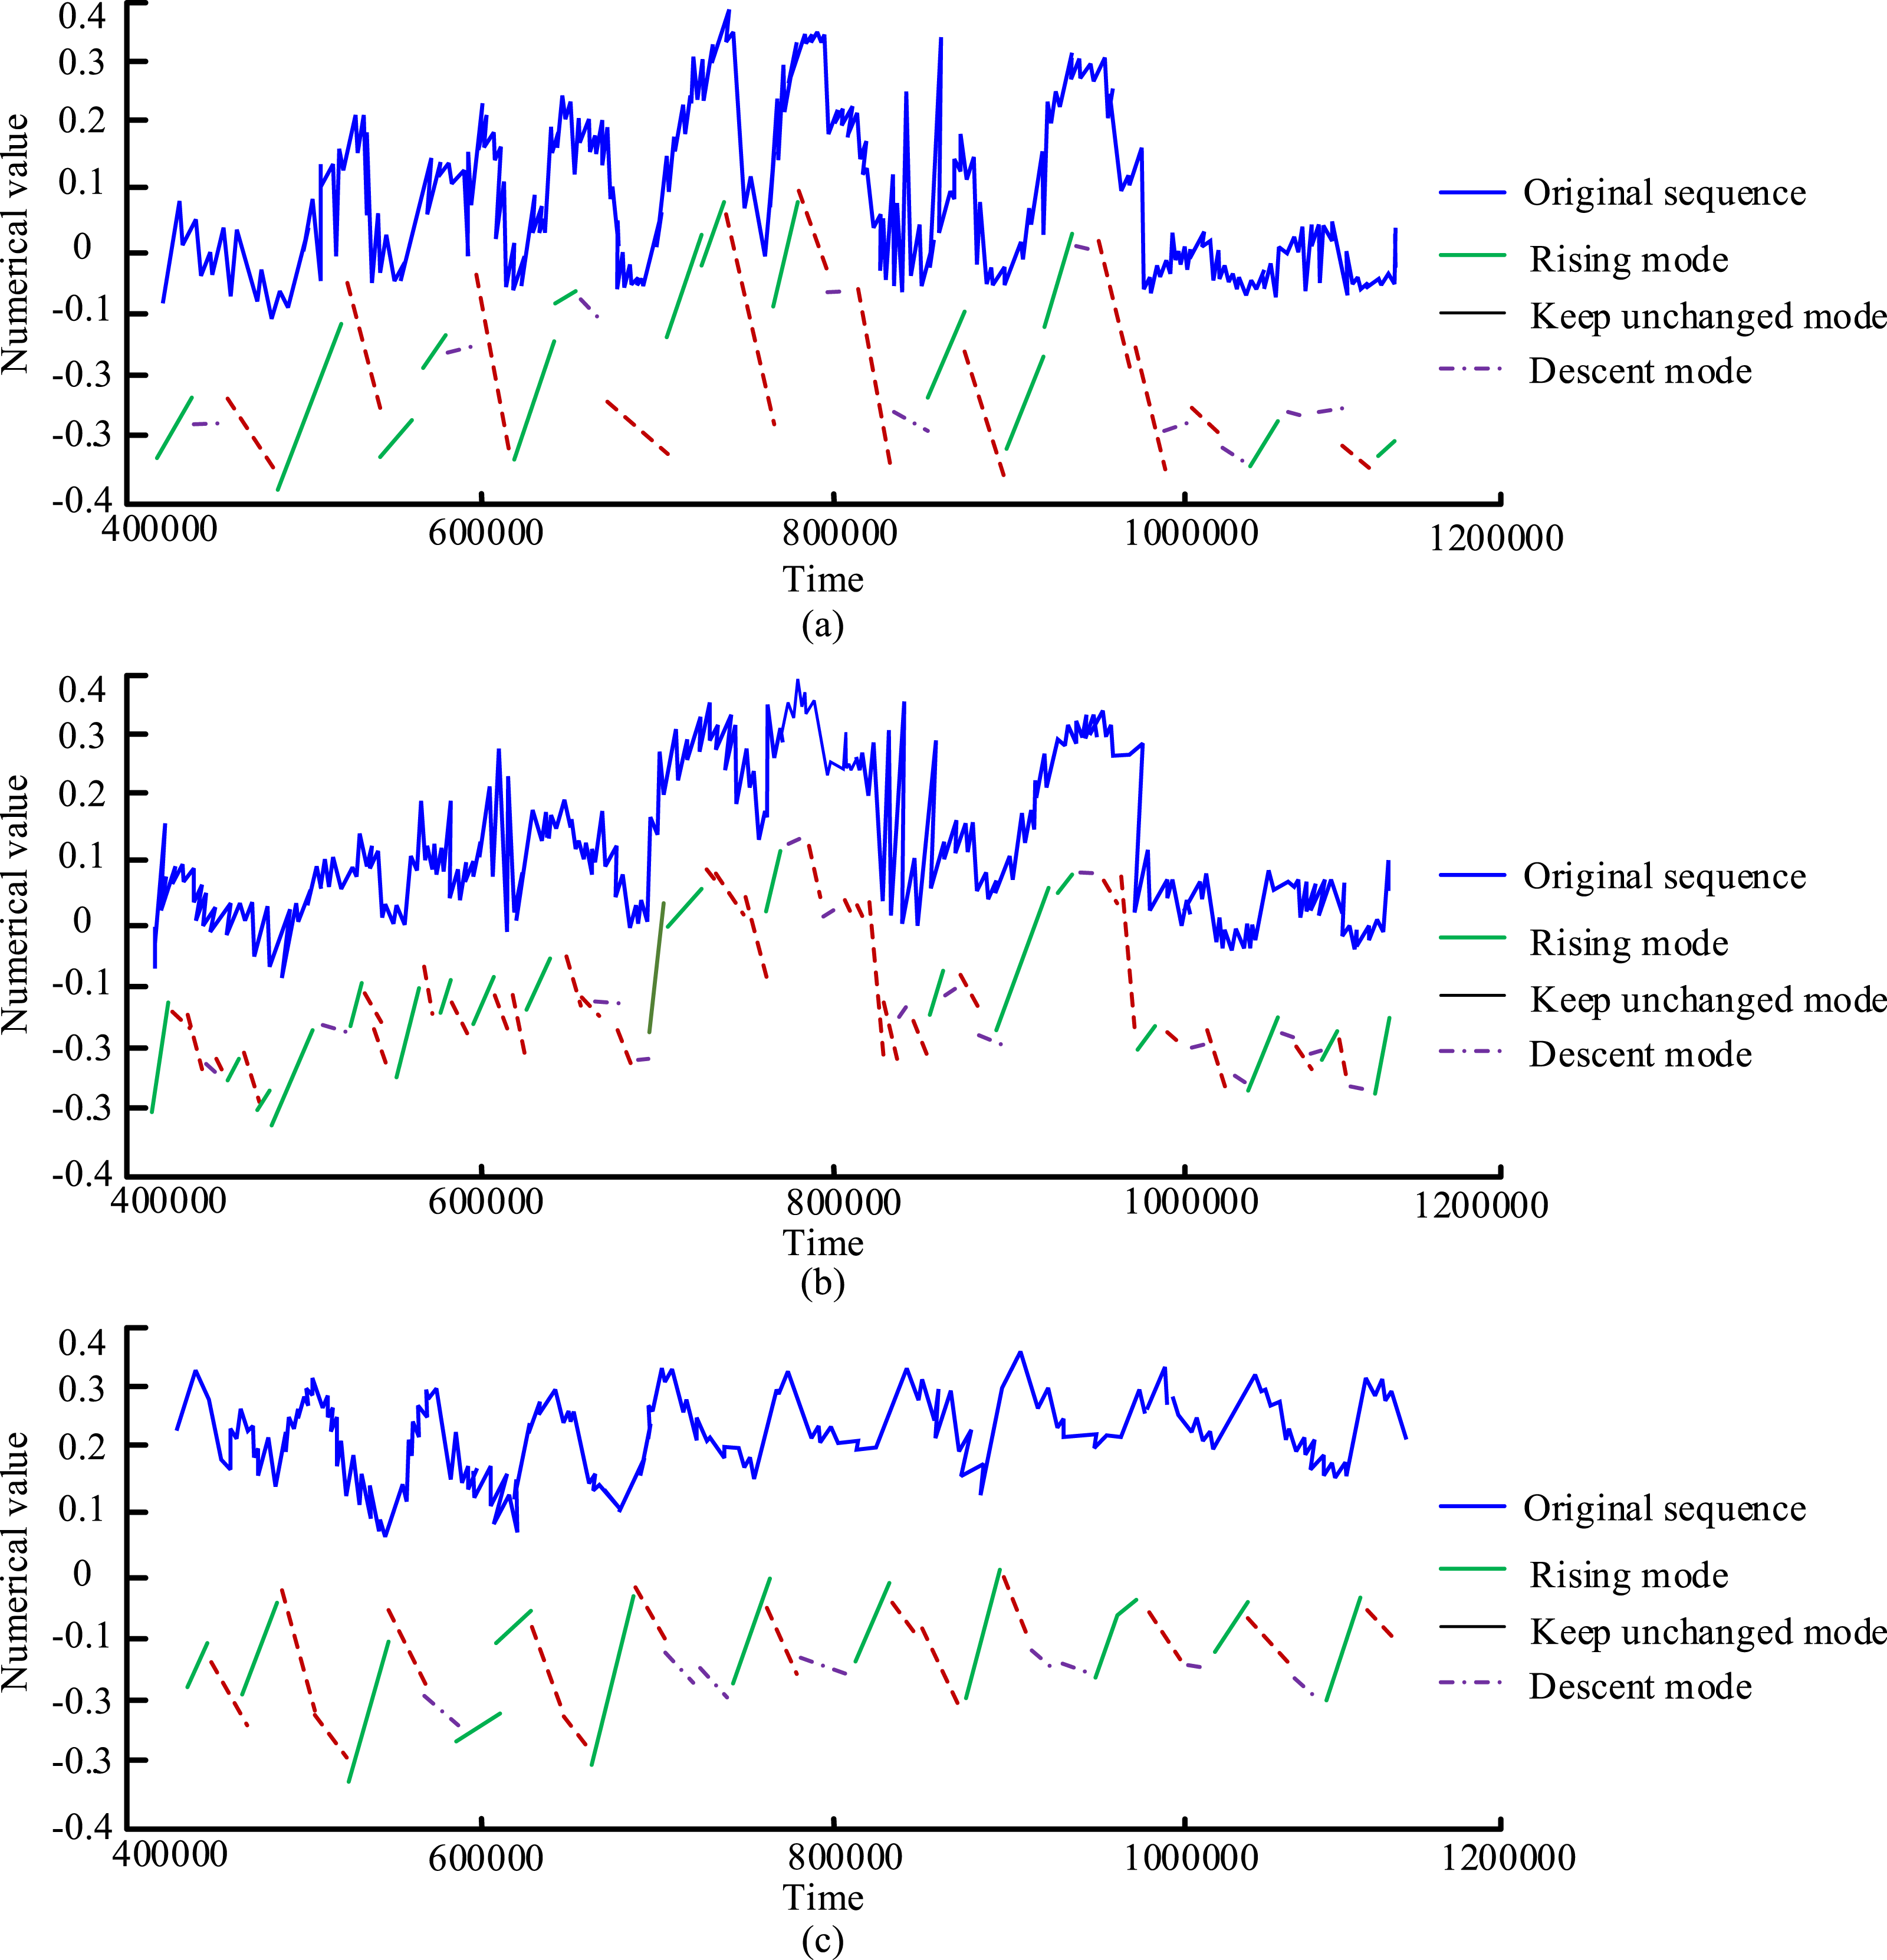
As shown in Figure 9, the blue curve represents the raw data, green represents the rising mode, red represents the falling mode, and purple represents the basic unchanged. Relatively speaking, the data trend of sales indicators was relatively flat, with a similar number of upward and downward line segments, indicating that there are multiple small fluctuations in sales indicators and no significant increase or decrease. At the same time, it can be seen that the basic invariant sequence of sales indicators was the least, with more symbolic subsequences for sales and service commitment sequences. In addition, the trend of the symbolized line segments was basically consistent with the original data, indicating that the symbolization algorithm based on incremental error in this study can meet the experimental expression needs of the original data. It performed FIM on the symbol itemset after symbolization processing, and output the results of the eight itemsets with the highest support, as shown in Figure 10. FIM Results. (a) All element data mining results. (b) Sales element data mining results.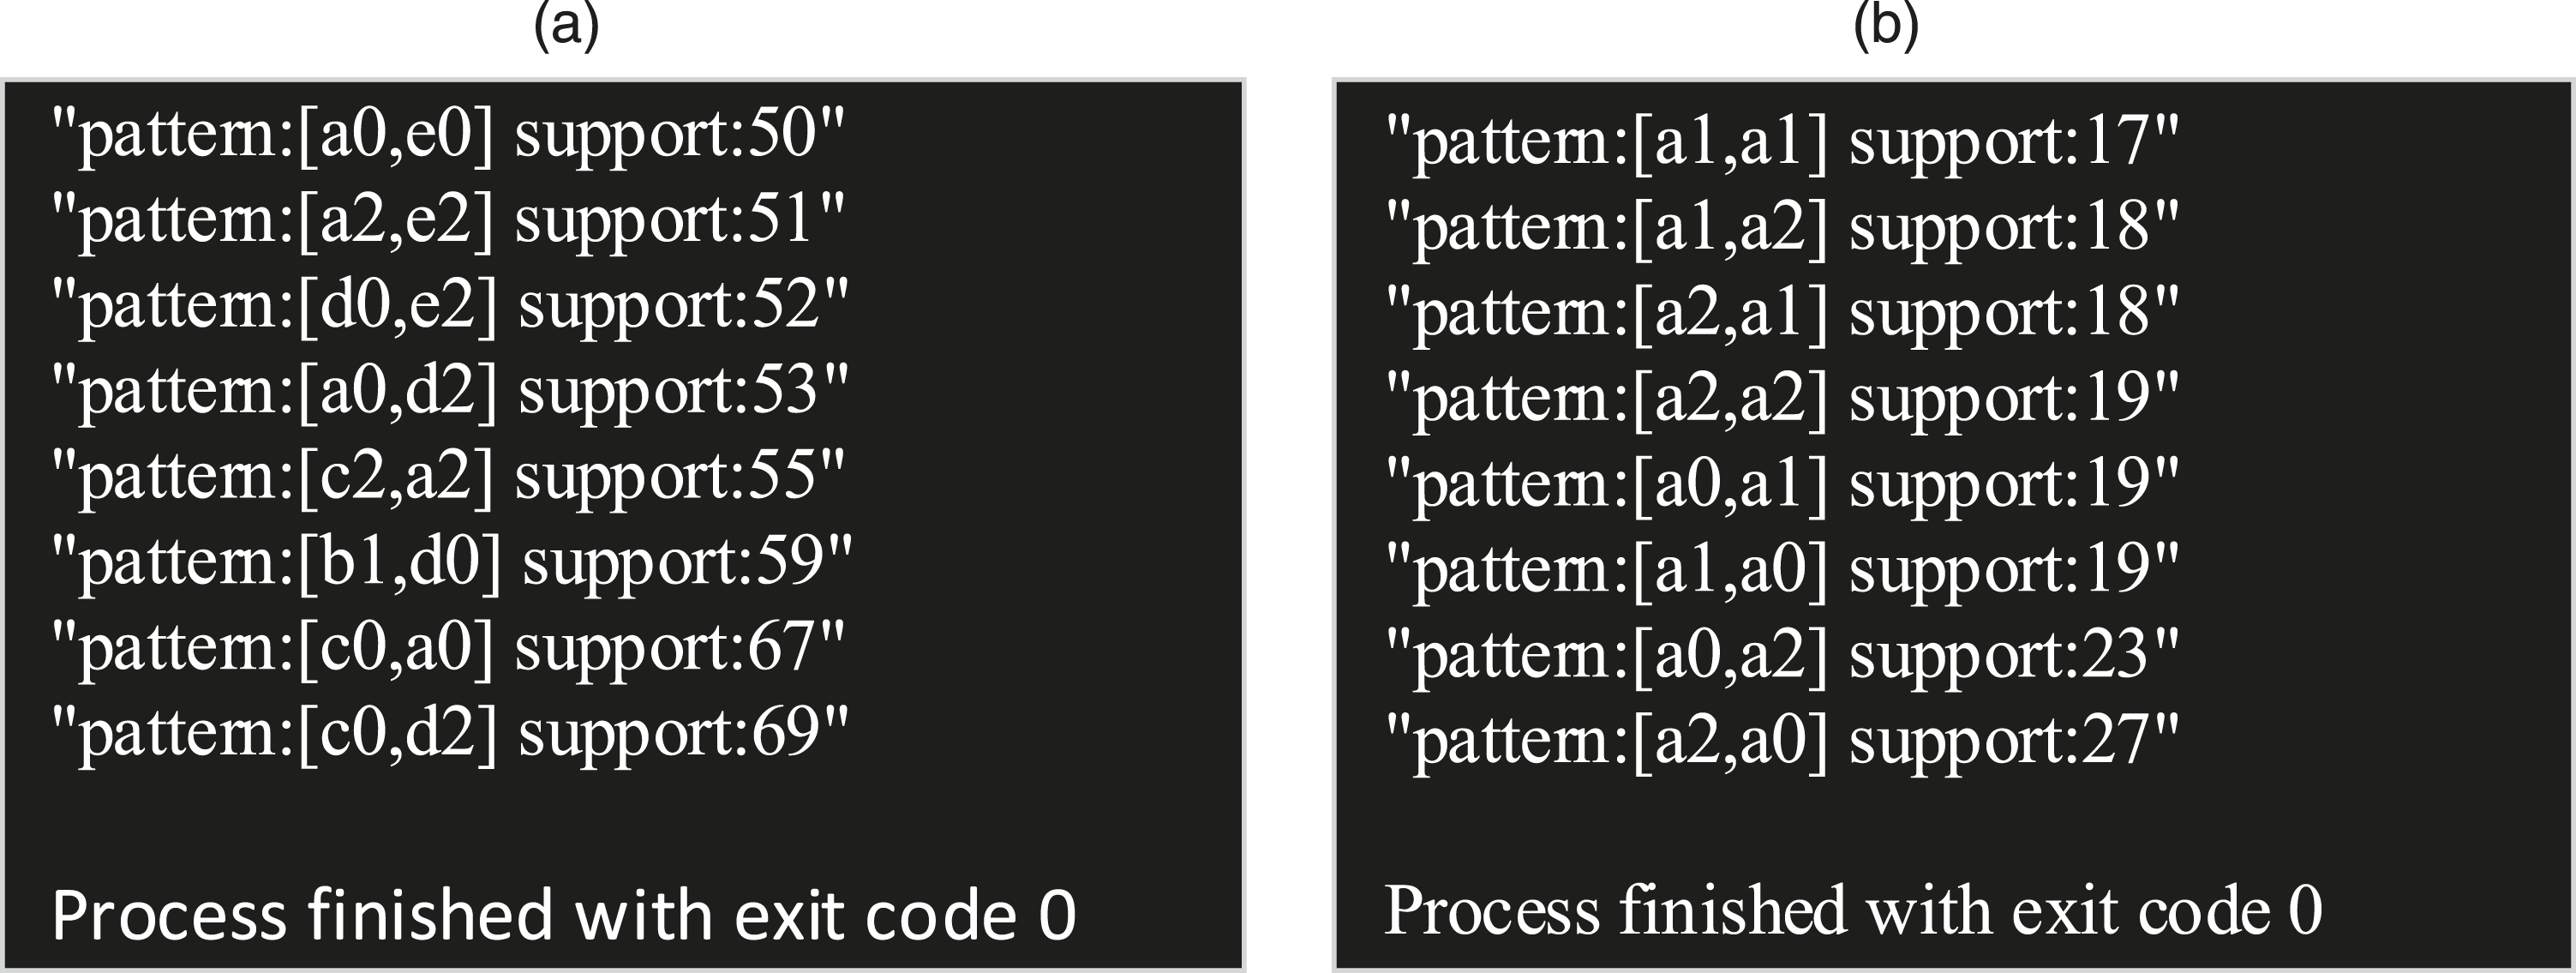
Figure 10(a) shows the data mining results for all 13 time series, with [a2, d0] and [c2, d0] having the highest support rates, indicating a high support rate for sales, c logistics anomalies, and d store reputation. Logistics anomalies had the greatest impact on return data, with a strong correlation between the rise and fall of logistics anomalies and the decline of store reputation. As shown in Figure 10(b), with the data mining results of the sales series, the support rates of each sales series were not significantly different. Among them, the support rates of the rising and falling modes were consistent, and the high correlation was in line with the actual situation. This indirectly verified the accuracy of the FIM results of all time series, indicating that the algorithm had good performance.
Conclusion
Traditional FIM is static data mining, without considering the impact of time series on data research. This study used FIM algorithms based on TSS as data clustering methods. The study used IES instead of traditional sliding window segmentation to optimize the linear segmentation effect, selected the improved FP-growth algorithm for data mining experiments, and introduced other related algorithms for comparative experiments. The experimental findings showed that, firstly, in different element sequence experiments, the compression rate of the IES method was basically the same as that of the traditional sliding window method, both of which were above 90%. The fitting error of the incremental method was significantly reduced, with the lowest sales element being 2.467, which was 2.074 lower than the traditional method. Secondly, when the memory peak and running time of the algorithm in this study reached the same support rate, compared with the traditional frequent itemset algorithm Apriori and the unimproved FP-growth algorithm, the memory peak was about 200 MB, and the running time was about 60 s, indicating that the algorithmic efficiency in this study has the highest efficiency. Finally, an analysis was conducted on the merchants who provided experimental data sources. The mining results of the original time series data of 13 elements showed that the increase in sales, the decrease in logistics anomalies, and the decline in store reputation had a high support rate, which had the greatest impact on product returns. Merchants should focus on these three aspects to reduce product return rates. Future research can further improve time series symbolization and error segmentation strategies, design more flexible and refined processing methods for elements with small changes over time, and avoid missing key data. At the same time, cross platform data fusion analysis can be further introduced, combined with multi-source data such as social media and user feedback, to comprehensively improve the accuracy of return prediction and the effectiveness of merchant optimization decisions.
Statements and declarations
Footnotes
Conflicting interest
The author(s) declared no potential conflicts of interest with respect to the research, authorship, and/or publication of this article.
Funding
The authors received no financial support for the research, authorship, and/or publication of this article.