
Abstract
With the booming development of sports events, the demand for athlete performance evaluation has begun to increase. The visualization analysis of basketball player data is significant for the analysis of individual value and potential of athletes. However, existing data analysis methods have problems such as insufficient efficiency, low accuracy, and insufficient attention to the inherent attributes of sports events. Therefore, to better analyze the composition data of basketball team members, the study combines Synthetic Minority Over-Sampling Technique (SMOTE) and Random under-sampling techniques to handle the imbalance in the athlete dataset, and then uses Random Forest (RF) to extract data features. Based on this data processing, a ensemble learning method based on SMOTE, Random under-sampling, and RF (SRR)-Voting is proposed to predict athlete performance. The results demonstrated that in the player dataset analysis, the Precision, Recall, and F1 of the research method were 0.9486, 0.9588, and 0.9752, which were superior to comparative methods. The proposed method had a ROC value of 0.94 and a fitting value of 0.17, indicating better fitting performance. This indicates that the designed player composition data visualization analysis method based on ensemble learning can effectively analyze the various attribute data of competitive players and ordinary players, providing effective data support for the comprehensive quality analysis of competitive players.
Introduction
Basketball, as a team sport, is widely popular both domestically and internationally. Recently, data mining approaches related to basketball have been continuously proposed to analyze and predict the trajectories of various movements in basketball, thereby achieving effective action judgment, tactical guidance, etc.1,2 Based on this background, the analysis of the competitive ability of basketball players is particularly important. Athlete ability is a prerequisite for achieving various movements and tactics. Meanwhile, with the integration of various commercial factors in basketball games, game gambling has gained widespread support.3,4 However, fans usually set odds based on their subjective wishes, lacking corresponding scientific basis. This also requires predicting the overall quality and ability of basketball players. In addition, the artificial intelligence technology has provided effective support for the analysis of various data in basketball games.5,6 Affected by science and technology, especially the application of data mining techniques in sports prediction, accurate and effective prediction of comprehensive qualities for basketball players is gradually becoming possible. However, existing data processing methods such as text, video, and statistics cannot deeply explore the potential association features among players.7,8 The data visualization method based on artificial intelligence technology can extract effective data features from various large and complex data sets, and demonstrate data change patterns more concisely and intuitively. Among them, ensemble learning models overcome the shortcomings of a single model in data feature extraction and result classification by combining multiple classifiers, thereby improving the classification and regression performance of the model. Therefore, the study integrates Synthetic Minority Over-Sampling Technique (SMOTE) and Random Under-sampling to handle the imbalance in the athlete dataset, and then uses RF to extract data features. A visualization model of basketball team player composition data based on SMOTE, Random Under-sampling, and RF (SRR)-Voting is constructed.
The explainability of machine learning algorithms directly affects the actual effectiveness of visualization. By optimizing data features and combining them with appropriate interpretation methods, the application value of machine learning algorithms can be significantly improved. Moreover, with the development of explainable artificial intelligence technology, machine learning can be better integrated with practical scenarios such as basketball tactical analysis, promoting the intelligent development of related fields. In machine learning algorithms, ensemble learning models have good data processing and adaptability, which have been applied and developed to a certain extent in various fields such as geography and healthcare. Reference 9 analyzed the corresponding features of different lithofacies using ensemble learning prediction method. This ensemble learning combined continuous constrained Boltzmann machines, Bayesian optimization, and optical gradient boosting. The results showed that the newly proposed predictor was an efficient and robust lithology prediction solver, which was worthy of widespread application in geological, geophysical, and rock physics research. Reference 10 designed an ensemble learning method on the basis of Random Forest (RF), Extreme Gradient Boost (XGBoost), Cat Boost, and Adaboost to classify cancer patients. Then, the grey wolf optimization algorithm was applied to optimize the parameters of ensemble learning. The designed method improved the F1 value by 15% compared with existing methods. Reference 11 developed a stacked ensemble learning method for epidemic prediction and health decision-making assistance processes. This method used Decision Tree (DT), RF, selection operator, and XGBoost classifier in the first level. At the second level, a Linear Regression (LR) classifier was applied to generate the final prediction. The proposed strategy effectively predicted epidemic outbreaks, which was applied to predict epidemic trends in other countries. Reference 12 designed an ensemble learning method for feature selection of network data based on the combination of optical gradient enhancement machine and RF, random gradient descent, Gaussian Naive Bayes (GNB), and Support Vector Machine (SVM). The experiment showed that this method achieved the best prediction performance in different datasets. Reference 13 designed an ensemble learning method on the basis of convolutional neural networks and visual converters for tactical decision prediction of game players. Analysis demonstrated that this method could learn players’ macro intentions in real-time strategy games.
The relevant data of basketball can provide effective support for tactical guidance and player quality analysis, thus enabling effective motion prediction and analysis. Reference 14 proposed a hybrid system for basketball player detection and motion recognition to help basketball players improve their shooting skills and accuracy. The enhanced Yolo algorithm was used to detect players in frames, and the LSTM and fuzzy logic was integrated to operate the basketball action classification. The accuracy of this model for eight basketball actions was 99.3%, with a high player detection rate. Reference 15 calculated the success probability of each pass based on the surrounding environment, including the player and the position of the ball, to determine the difficulty of the pass. Physics and machine learning models were combined to calculate the completion probability of hypothetical passes. The accuracy of successful passing calculated based on this method was 93.0%, which was much higher than existing work. Reference 16 used a Bayesian hybrid model to analyze basketball sports data. In the sports data, key stages of offensive movements, like creating space for passing, follow-up, and preparation/shooting were identified, which were related to invasive movements. This method transformed complex patterns into more coherent statistical data, bringing significant strategic advantages to sports competitions. Reference 17 proposed an basketball goal analysis system on the basis of the 6G Internet of Things. Data mining techniques were applied to excavate the factors that affect goal scoring rates and preprocess basketball images. Then, the background difference and three frame difference methods were integrated to detect targets. The results showed that the frame rate was 58fps, which met the real-time processing performance of 25fps. The error detection rate was very low, which could be used for basketball games or exams.
In summary, significant achievements have been made in integrated learning, which has been widely studied in medical, entertainment, and other information data analysis. Extensive research has also been conducted on basketball and player related aspects. However, from the above research, it can be seen that research on basketball and players mainly focuses on tracking and identifying movement trajectories, as well as predicting and analyzing various postures during sports. There is relatively little data analysis on the abilities of athletes themselves. In addition, this study also focuses on player composition evaluation, which comprehensively analyzes player composition data to more fully evaluate the overall performance of players. Therefore, combined with the advantages of ensemble learning methods in data prediction, it is adopted in basketball player related data analysis. A visualization model based on SRR-Voting is constructed. It is expected to more easily analyze the potential of players, and understand the game process and results.
Methods and materials
To better analyze the differences in characteristics between competitive basketball players and regular basketball players, this study uses Synthetic Minority Over-sampling Technique (SMOTE) to handle the imbalance of samples from different categories in the dataset. Then, the under-sampling method is applied to dislodge noise and other interfering factors from the data, and then combined with RF to select data features. Subsequently, an integrated learning method based on Voting is constructed to visualize data, in order to better discover the potential of athletes from historical data.
Player feature data classification based on SRR
With the support of various deep learning and machine learning technologies, basketball player data visualization has become an important support for player ability prediction and win rate analysis. To better achieve basketball player data analysis, a basketball player data mining algorithm is constructed based on ensemble learning technology. In basketball player data, there is a quantitative difference between regular players and competitive players. When the amount of data in one category is greater than that in another category, there will be data imbalance.
18
Therefore, first of all, the SMOTE is applied to process the imbalance problem in the sample size. Its idea is to use the similarity of existing data samples in the feature space to generate more new data samples.
19
In a few categories of samples, one sample Schematic diagram of the basic principle of SMOTE.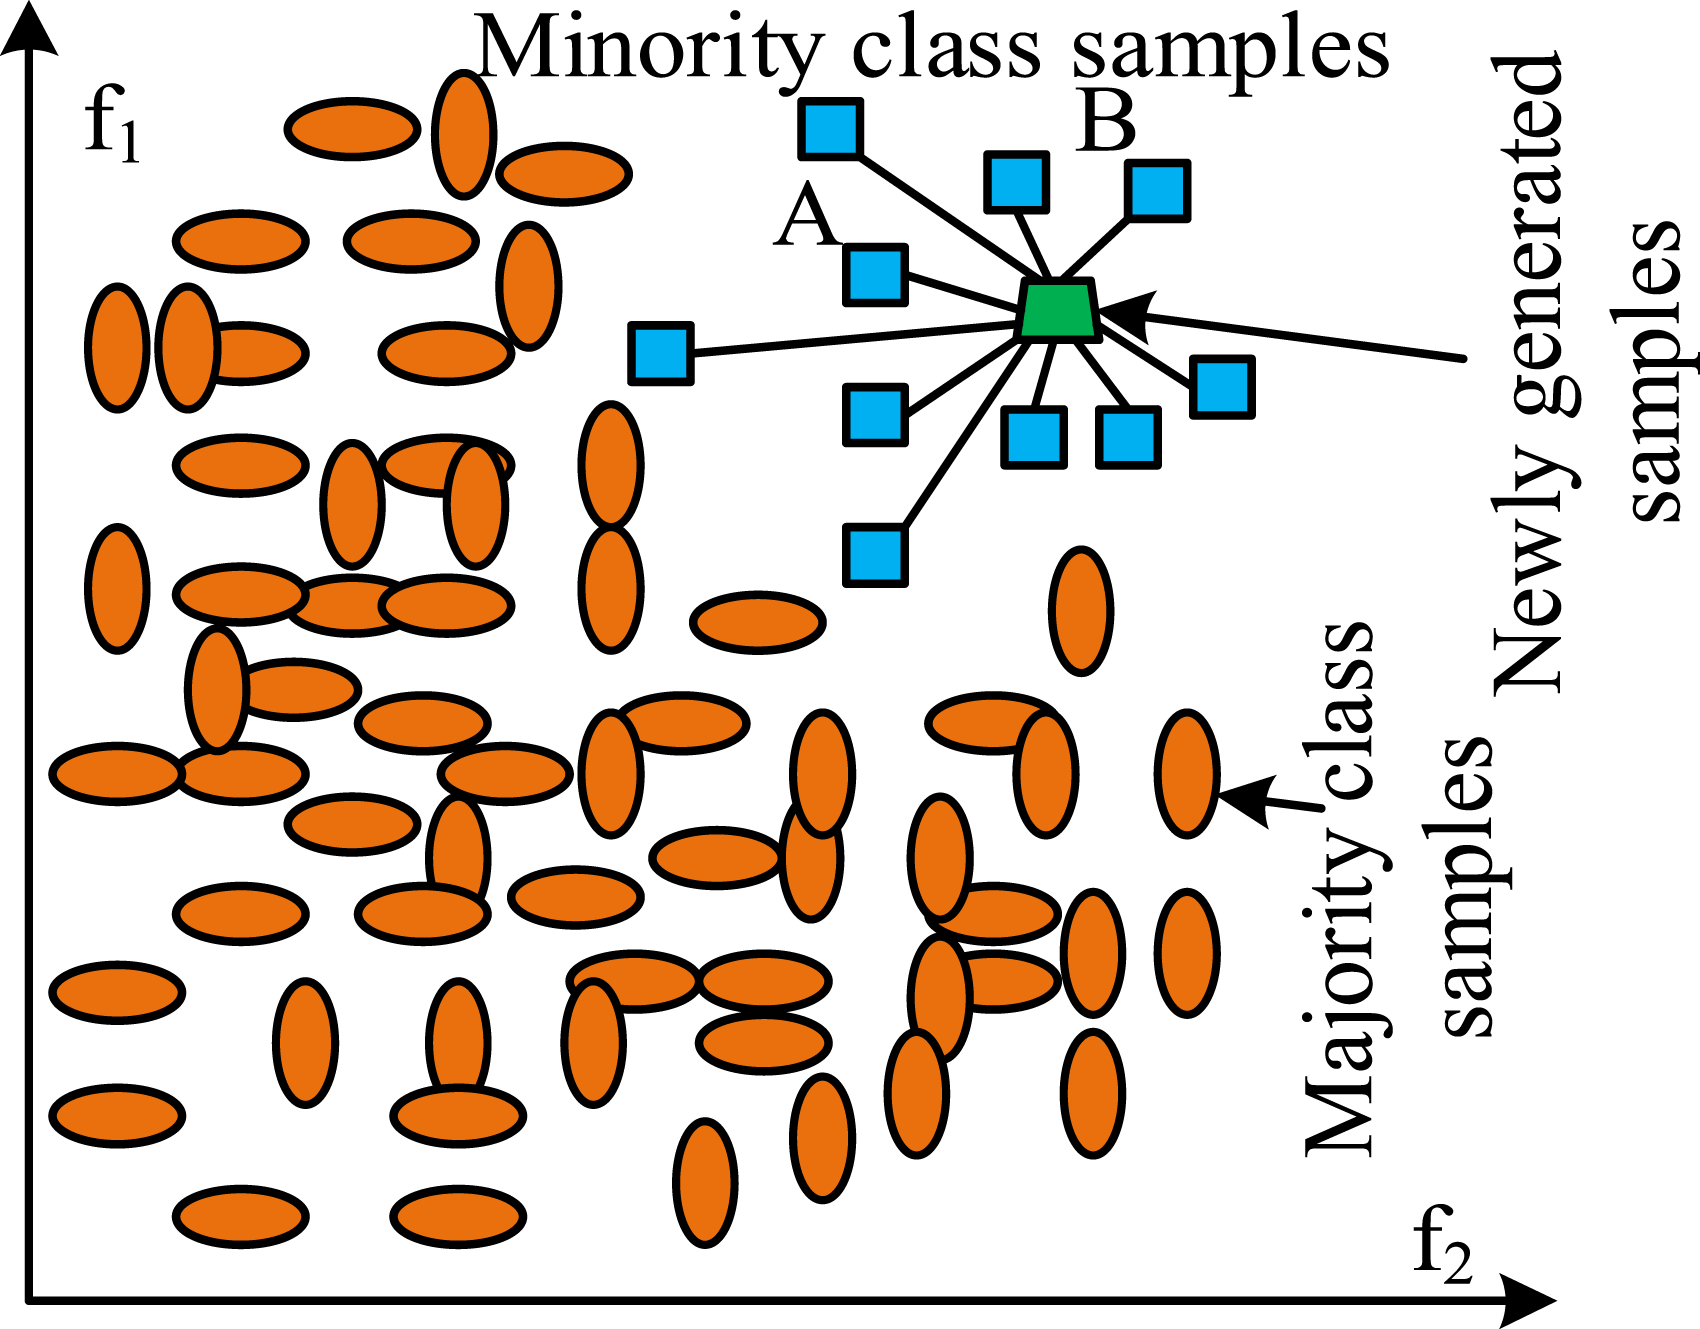

Figure 1 is a dataset with imbalanced samples, where squares represent minority class samples and ellipses represent majority class samples. The AB line in Figure 1 is used to generate new sample data and balance the sample data. In generating new sample data, there are noisy samples and a large amount of duplicate information, which directly affect the subsequent sample classification performance. Therefore, the study adopts the random under-sampling method to remove redundant information from the sample data and retain valid information. It is to randomly remove a certain proportion of samples from the majority without processing minority class samples, achieving sample balance.
20
Firstly, parameter
After balancing the sample data, the study uses RF to achieve regression and classification of basketball player sample data. Compared with methods such as DT, RE can effectively run on large-scale datasets and relatively complex sample data. RF integrates multiple DTs for data classification. After obtaining the classification results of multiple DTs, voting is carried out based on the principle of minority obeying majority. The category with the most voting results is the final output category of the model.23,24 The fundamental implementation process is displayed in Figure 2. RF ensemble classification structure for player data.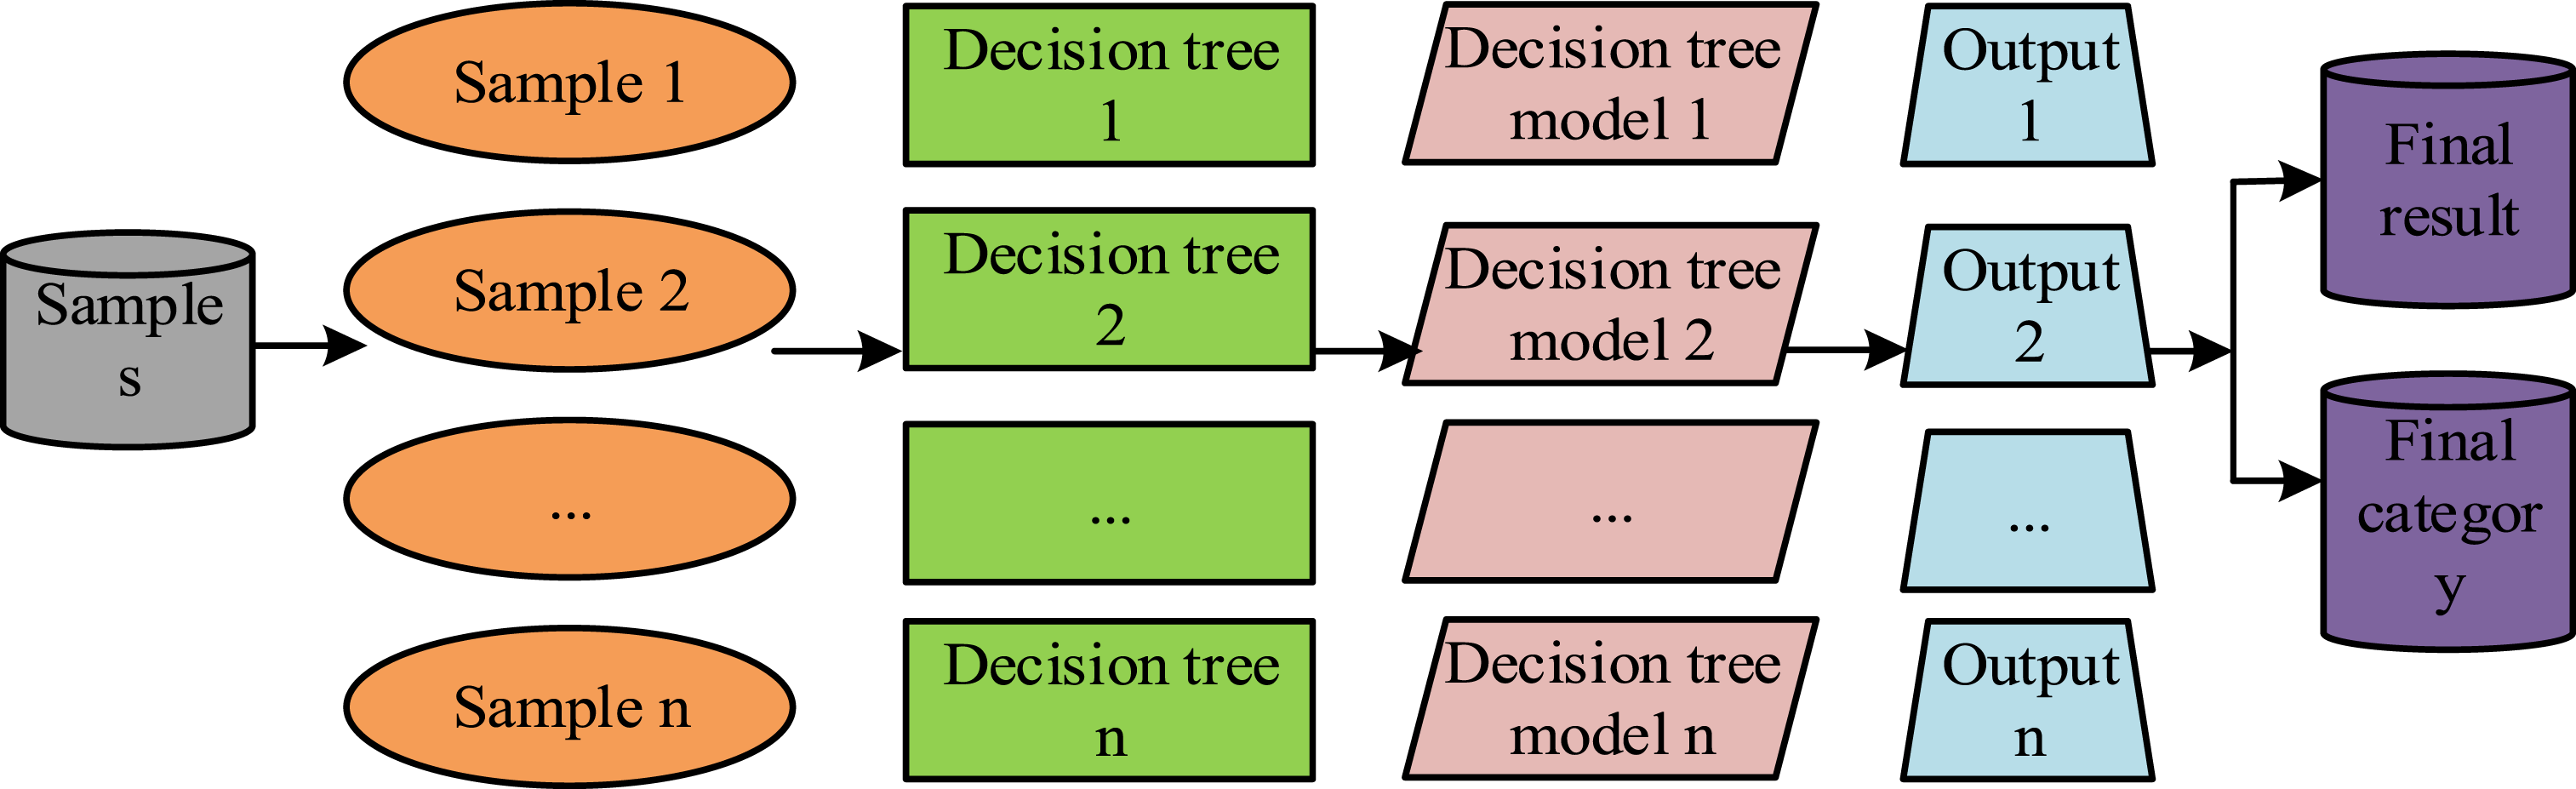
Due to the large amount of data for basketball players, the feature values they cover are usually relatively rich. Therefore, before model training, it is necessary to first select the data features. When performing regression classification on data, RF first ranks the importance of each feature value and then uses the Gini index for feature selection. Specifically, the importance of each feature is analyzed. In a dataset


The importance of feature

Construction of player data visualization model based on SRR-voting algorithm
Data visualization is the process of transforming abstract information data into images, graphics, and interactive interfaces, in order to analyze data more effectively. When constructing visual data models, the research adopts a layered framework approach for design, which can make the entire visual model more systematic and logically clear through layering. The hierarchical framework used in the study mainly includes the basic platform layer, data layer, core algorithm layer, visual display layer, and user interaction layer. Figure 3 displays the overall structure. Data visualization model framework.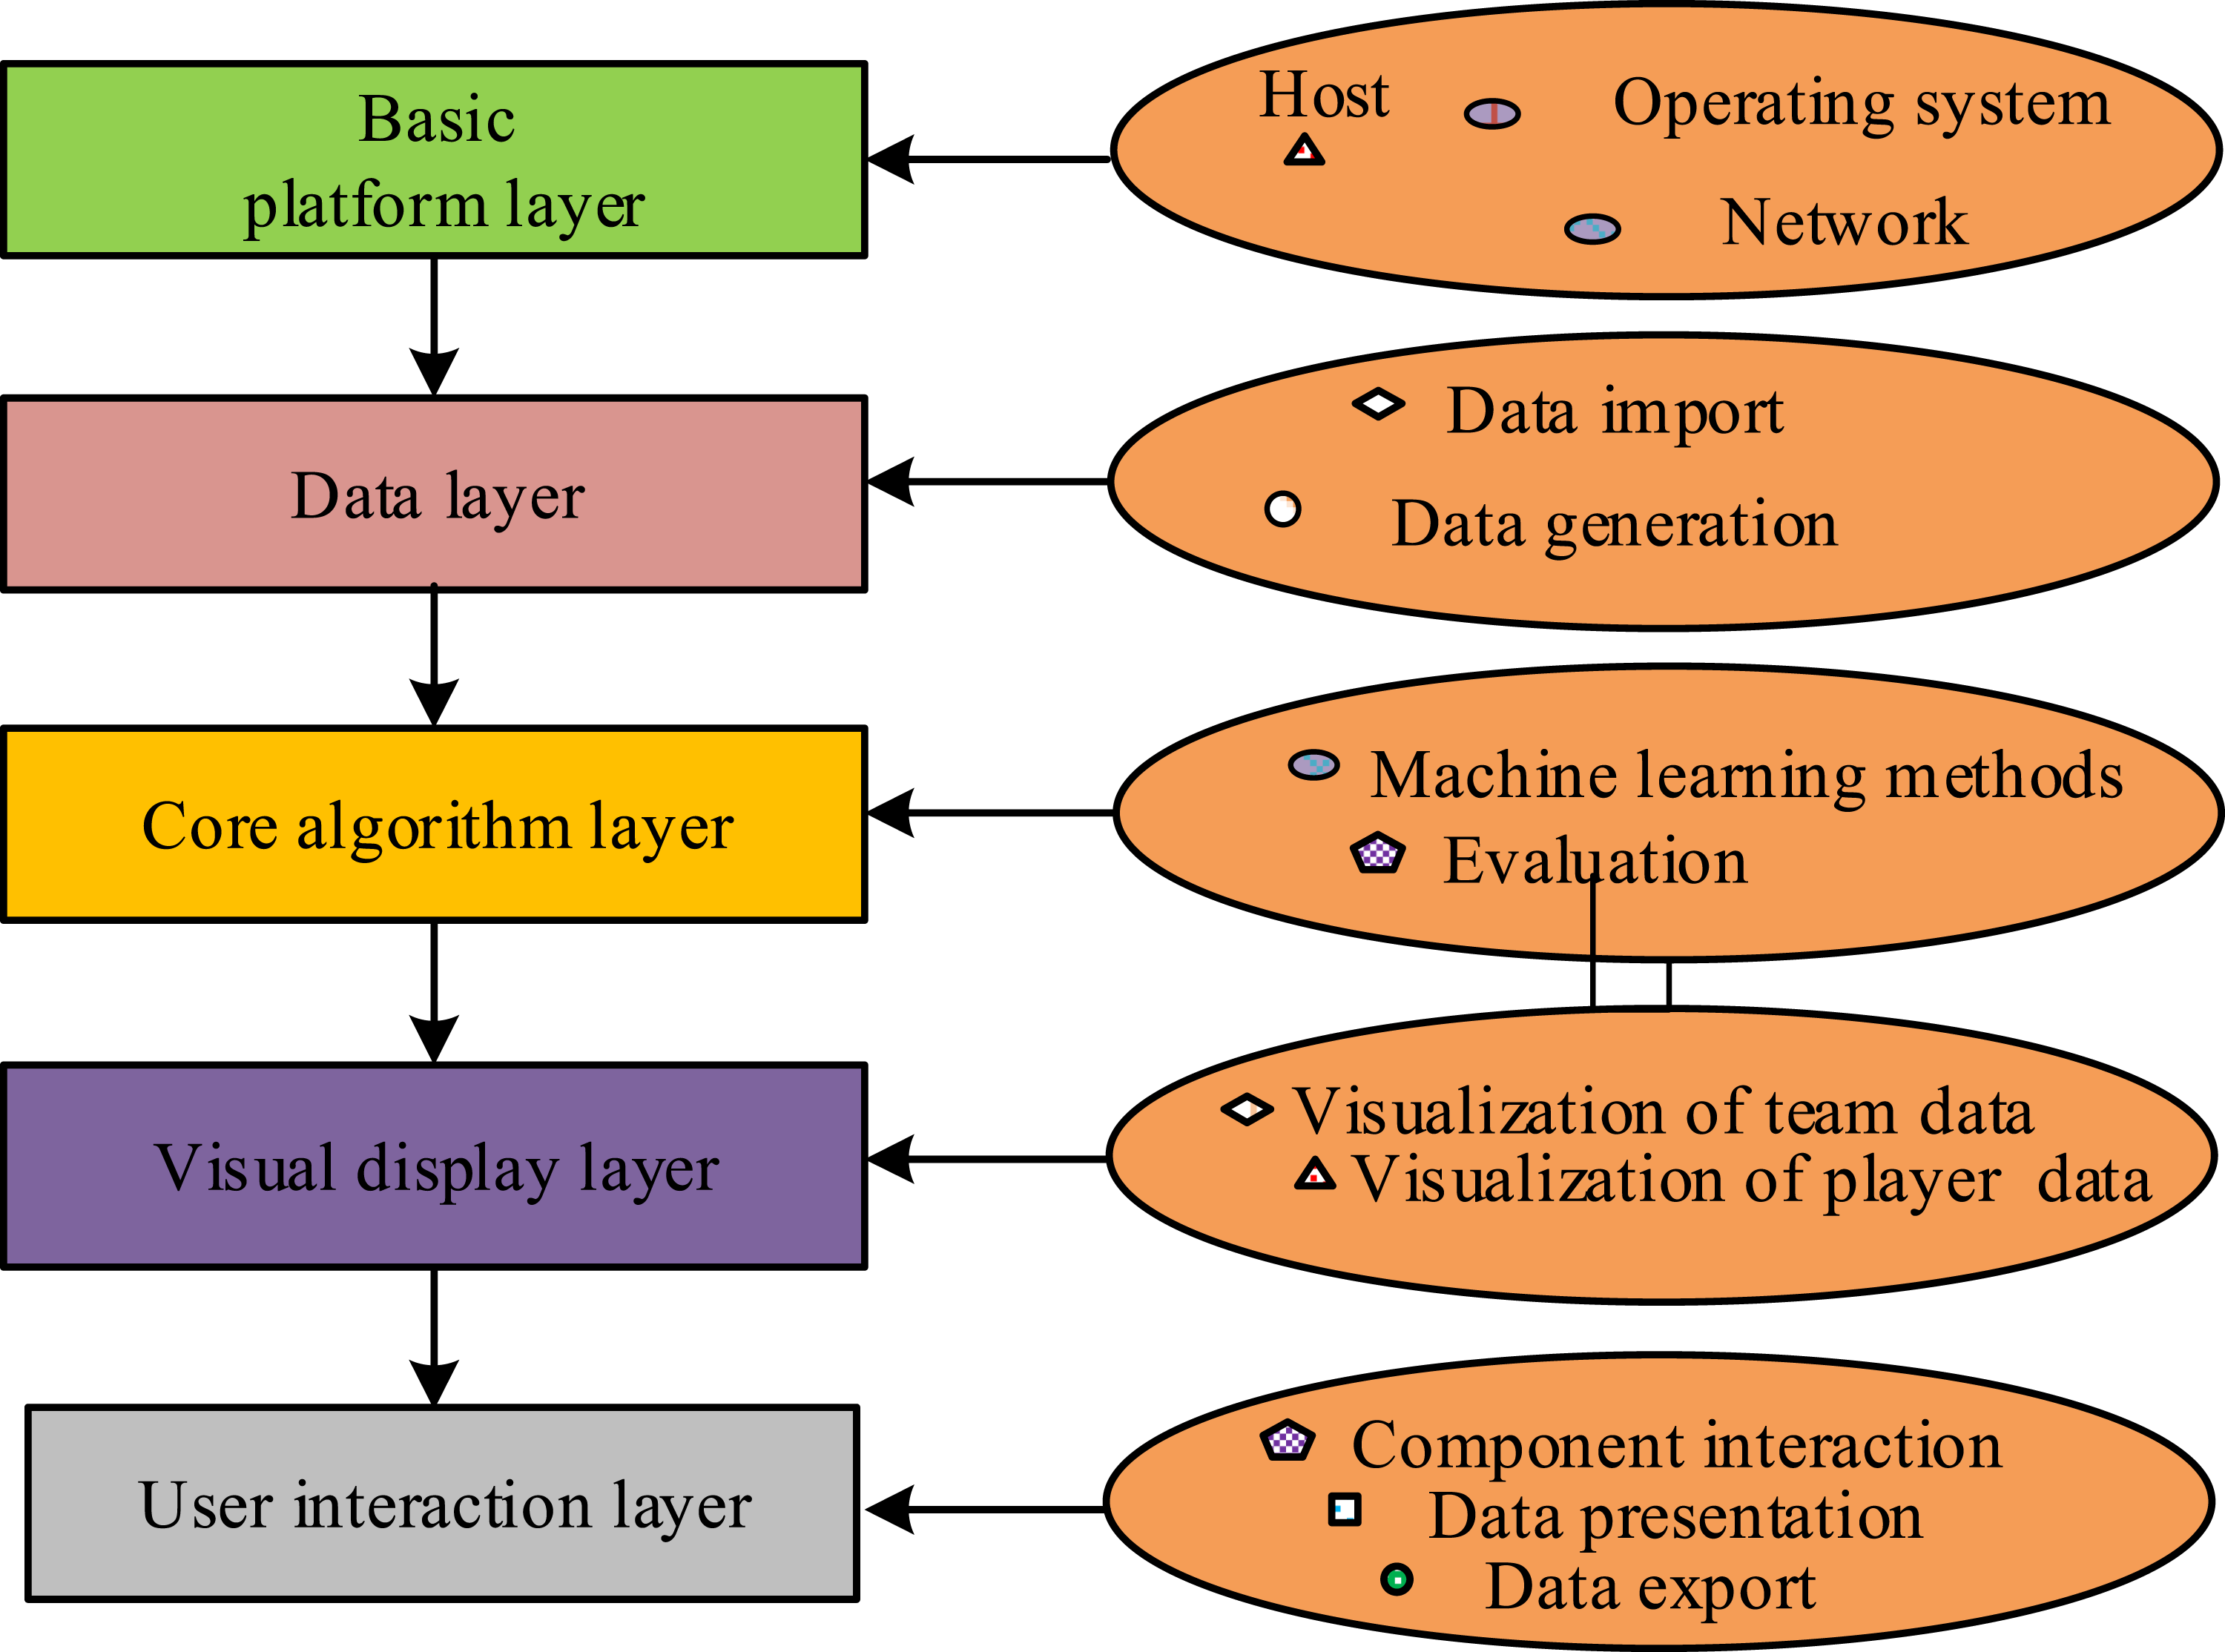
In Figure 3, the basic platform layer is used to control the overall operation of the entire framework, including data processing, algorithm operations, and data presentation. The data layer is used to input player data and preprocess the data. The core algorithm layer analyzes and processes player data using machine learning algorithms such as SMOTE and RF used in this study, and evaluates the processed data. The visual display layer visualizes the processed team data and player data separately. The user interaction layer completes the connection between data visualization and users, realizing data representation and data export. On the basis of the above framework, the data visualization algorithm of its core algorithm layer is analyzed. To achieve visualization of basketball player data, the research is conducted on predicting basketball player data based on ensemble learning ideas. The ensemble learning is to combine multiple weak classifiers to construct a strong one, thereby avoiding the shortcomings of weak classifiers and better solving regression classification problems. XGBoost is a frequently used strategy for solving classification and regression problems, widely used in data mining and machine learning. Compared with methods such as SVM, this method can effectively handle non normally distributed datasets and has better adaptability. Taking into account the accuracy and adaptability of various classifiers in the data, this study selects K-nearest neighbor (KNN) algorithm, Bagging, and XGBoost to construct ensemble learning classifiers, and then complete Voting learning. An ensemble classifiers based on voting is constructed.26,27 KNN refers to a sample in the feature space where most of the k nearest samples is a certain category, and the sample also belongs to that category, with same characteristics. It only determines the sample class to be classified on the basis of the nearest one or a few samples in determining the classification decision. Bagging uses random sampling with dropout to obtain training data for different groups of the same size. When Bagging is running, it first trains a base classifier, then adjusts the weight of misclassified samples to gain more attention in later training. Then, it uses the adjusted samples to continue training the next base classifier, and finally achieves better classification results through cumulative adjustment.
28
XGBoost reduces the model complexity and enhances its generalization ability by adding regularization terms to the objective function. The reasons for choosing the above three strategies are as follows. Firstly, KNN does not require pre-set data distribution and has significantly stronger fitting ability for nonlinear decision boundaries (such as spiral distribution and multimodal distribution) than LightGBM/CatBoost based on tree splitting. Bagging can effectively reduce its variance reduction through self-sampling (Bootstrap) and parallel training of feature subspaces. XGBoost has stronger applicability for high-precision prediction scenarios. When the number of features is relatively small, it has higher accuracy than LightGBM. Therefore, when the data simultaneously has high noise, complex boundaries, and strong interpretation requirements, this integration strategy is superior to other integration strategies.29,30 If

The regularization term for complexity is shown in equation (7). Voting-based ensemble learning process.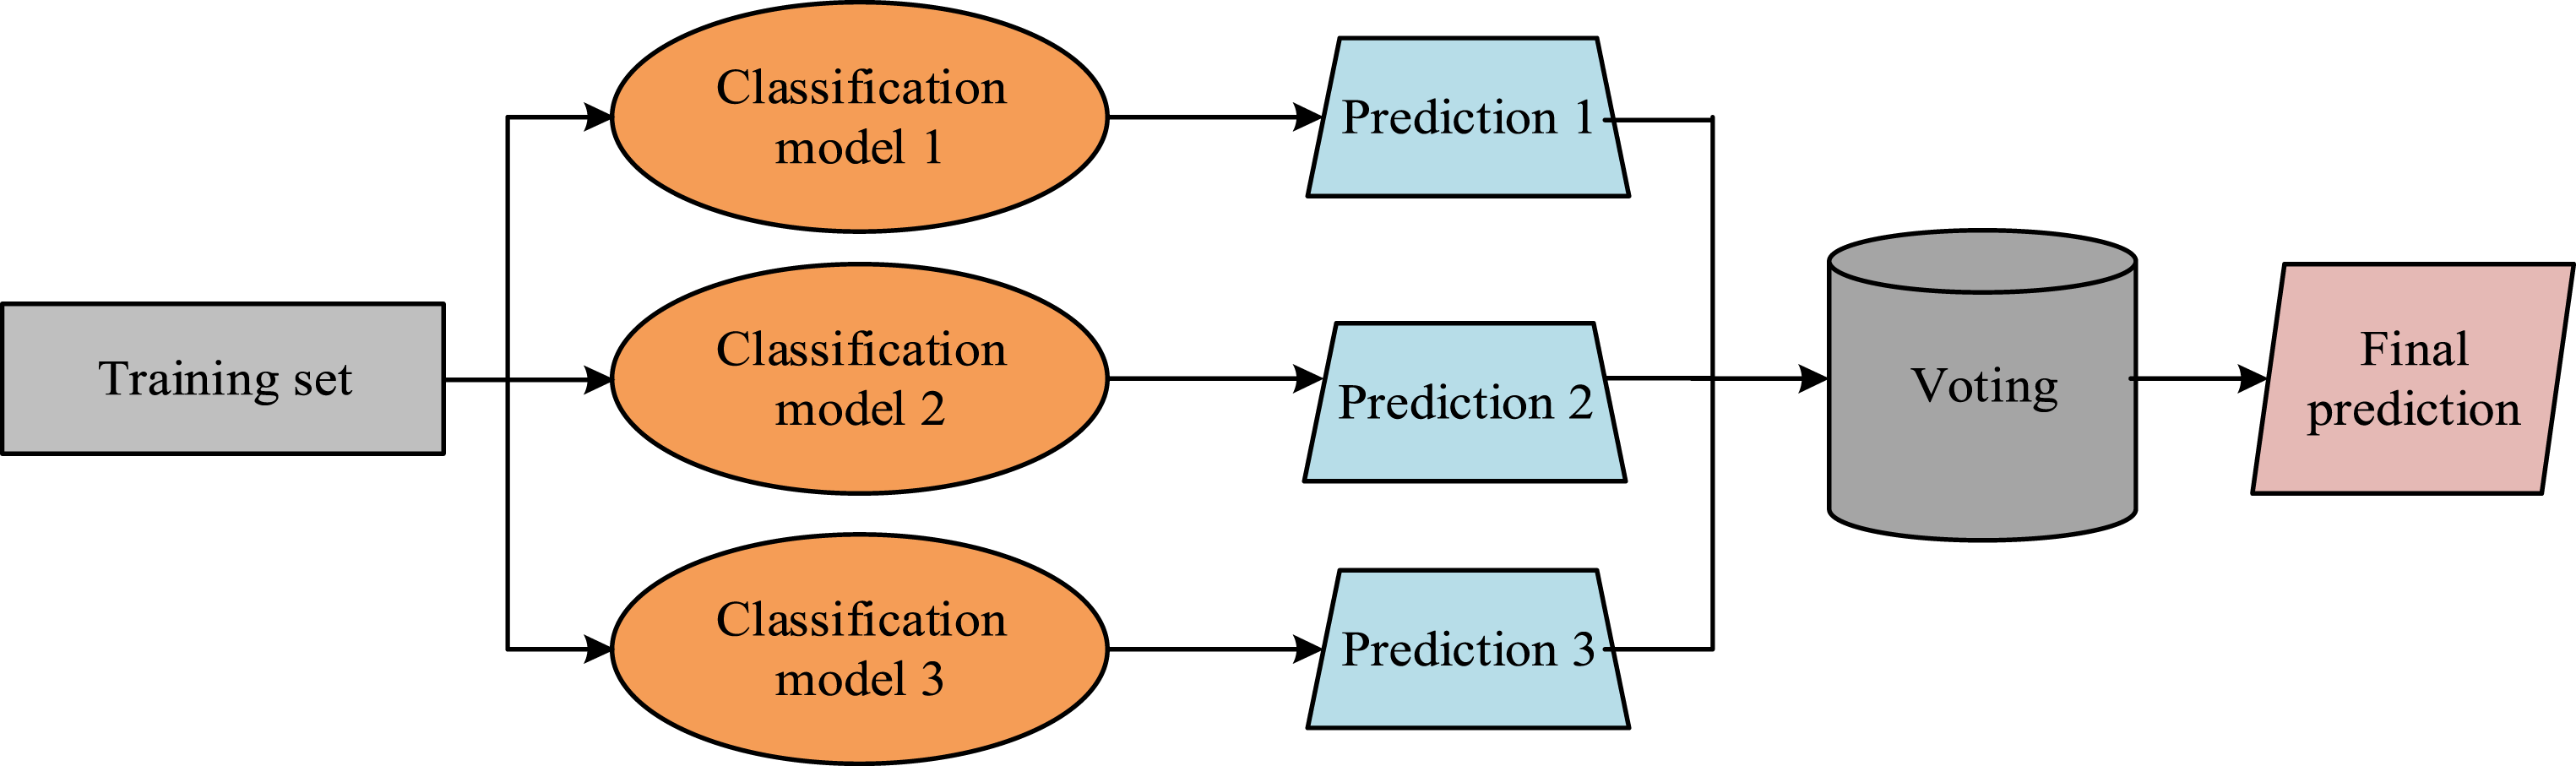

In Figure 4, after training multiple weak classifiers separately, the output results of each weak classifier are predicted and voted. The prediction result with the highest number of votes is the classification result obtained for that sample. Among them, the data features with relatively high importance ranking are used as input data for the ensemble learning model. In this algorithm, first, the data is standardized and transformed, and the model is trained and tested separately before outputting the target result. Based on the above processing, the functional modules of the data visualization system are shown in Figure 5. Visualization system function module.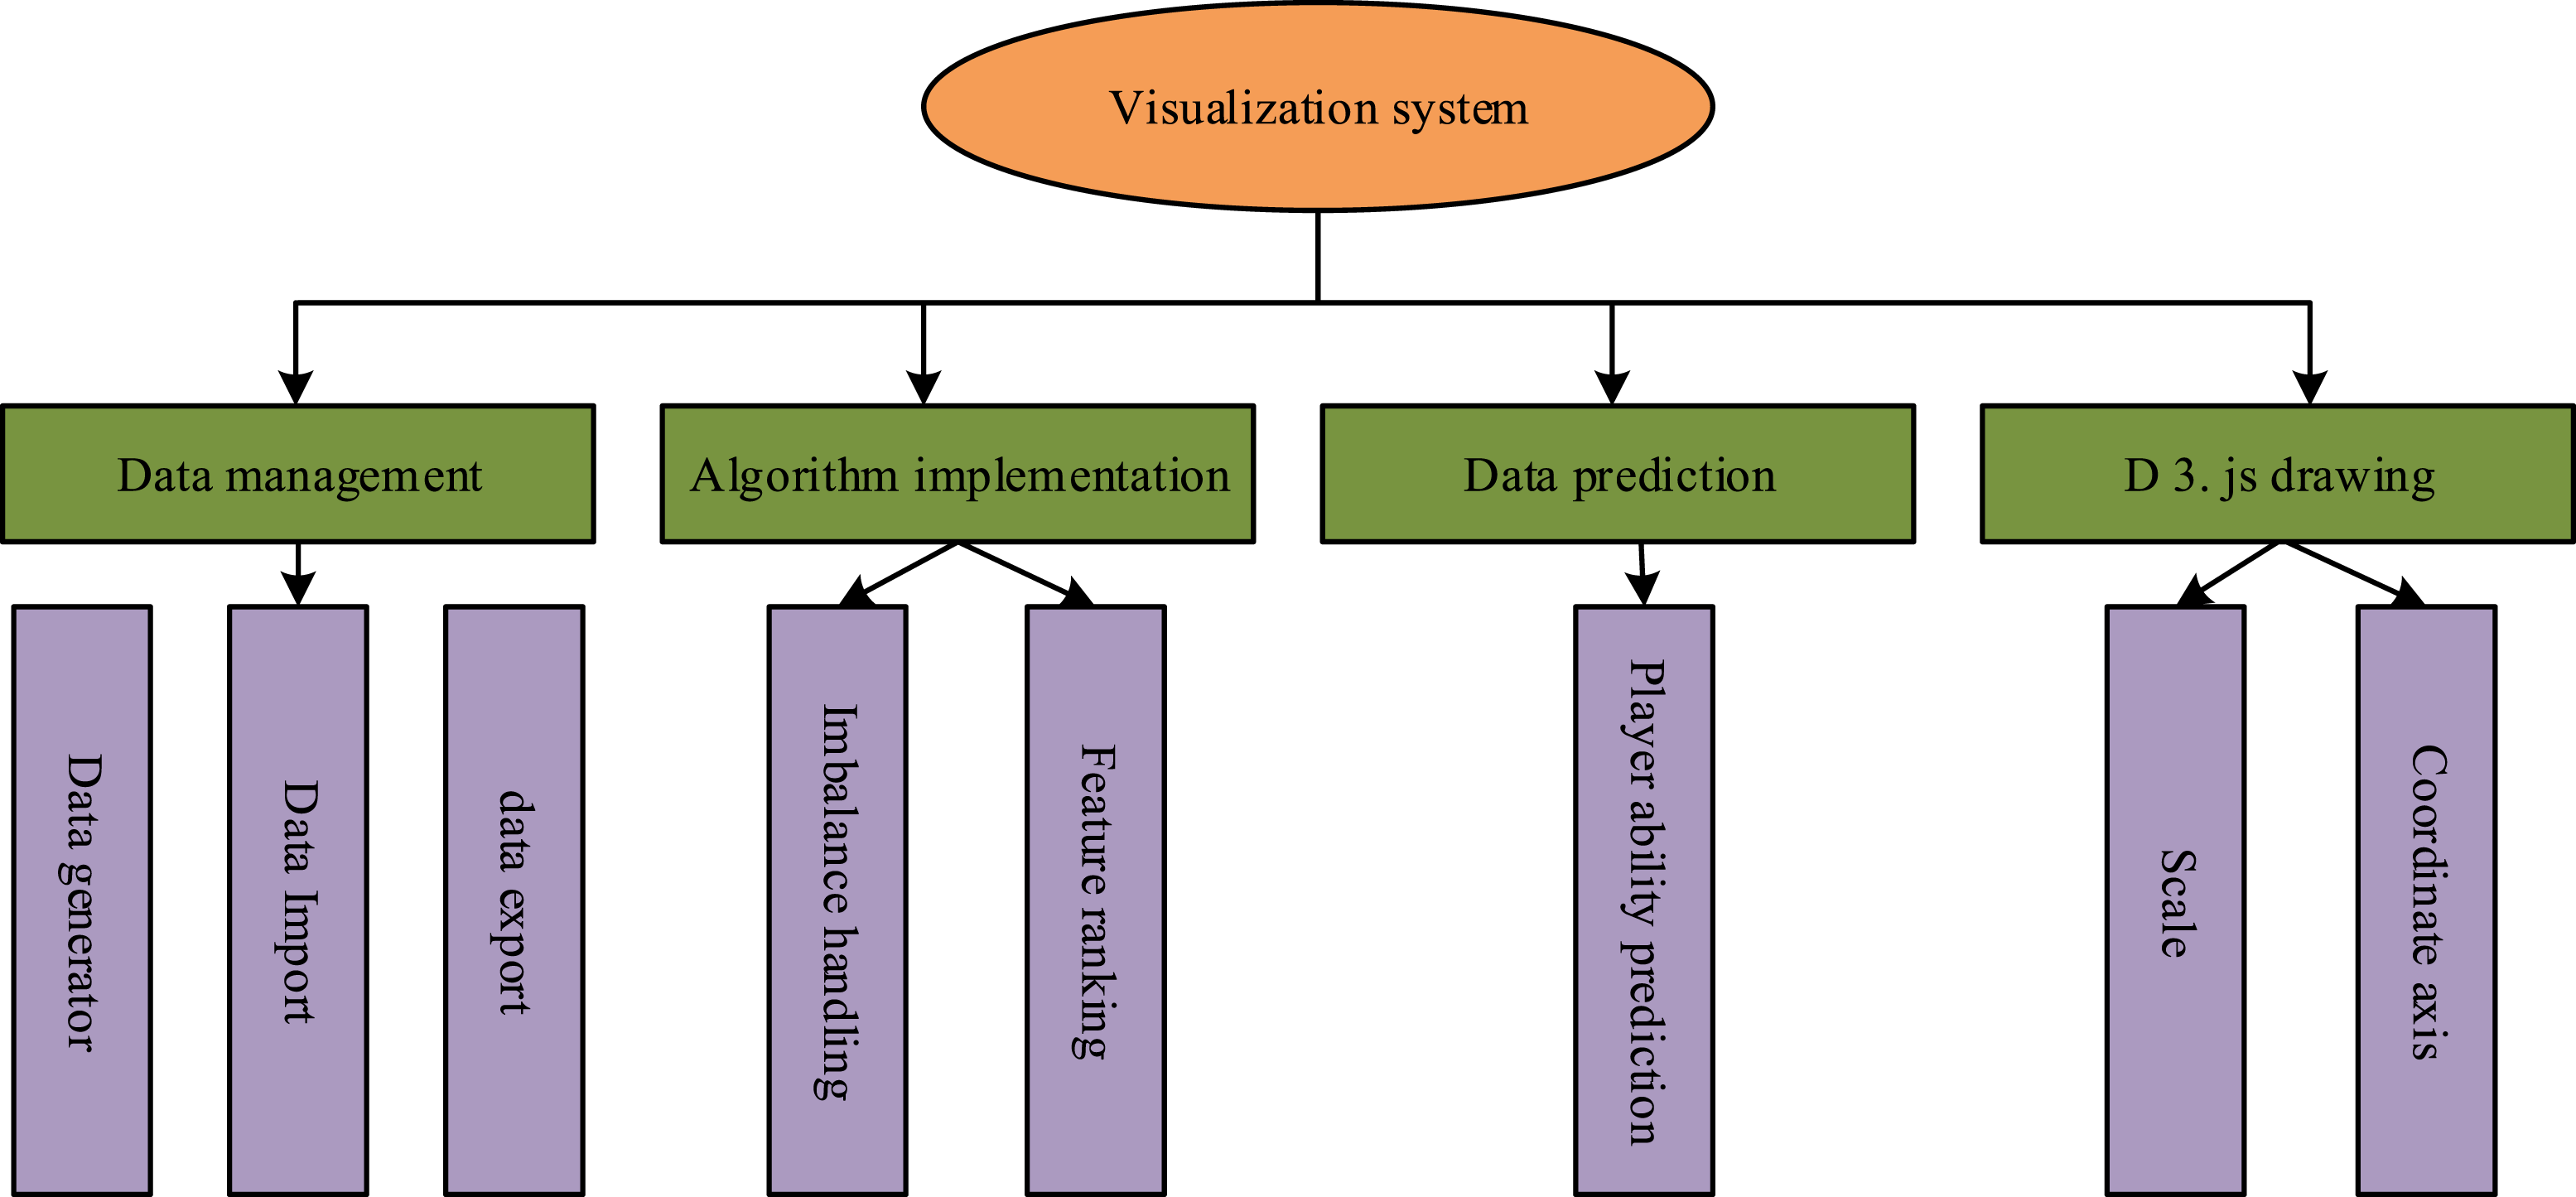
Results
To analyze basketball player data, an ensemble learning method based on SRR-Voting is constructed for visualization processing. To demonstrate the effectiveness, the model performance is first validated on an imbalanced dataset. Then, the actual application effect of this method is verified based on specific datasets of basketball players.
Performance analysis of model in imbalanced datasets
To present the effectiveness of the ensemble learning method, two imbalanced datasets are first applied to compare, namely, the Credit Card dataset, which has an imbalanced rate of 4.52 and includes various data such as credit card customer arrears, credit data, and payment history. The other dataset is the Credit Fraud dataset, which includes 2 days of transaction data of a certain bank’s credit card in Europe, belonging to a highly imbalanced dataset, with an imbalanced rate of 577.88. The two datasets are separated into training and testing sets at a 7:3. The experimental environment used for the study is as follows, with the operating system of Windows 7. The CPU is 3.6 GHz, the memory is 32 GB, and the programming language is Python 3.6. The hyperparameter tuning for KNN, Bagging, and XGBoost is as follows. In KNN, the value of k determines the number of nearest neighbor samples. The study selects the optimal k value through 5-fold cross validation. The optimal k value obtained is 5. The core parameter of Bagging is the number of base learners (n_estimators), and the study evaluates its generalization performance through Out-of-Bag. Based on the Out-of-Bag error value, the optimal n_estimators obtained are 100. The XGBoost uses gbtree for model calculation, with a weight value of 1 for child nodes and a penalty coefficient of 1 for L2 regularization. This study verifies the optimal learning rate and tree depth through parameter interaction learning, and obtained a learning rate of 0.3 and a maximum depth of 6 for the decision tree.
The research method is compared with other commonly used ensemble learning combination methods, namely, logistic regression, KNN, DT, AdaBoost, Gradient Boosting Decision Tree (GBDT), Bagging (Ba), and XGBoost. Firstly, the designed method is compared with a single method. The G-mean and AUC values of the two datasets in the training set are shown in Figure 6. G-mean signifies the geometric mean of the prediction accuracy for both majority and minority class samples. When the prediction accuracy of both types of samples is good, the G-mean is the highest, which can be used to balance the classification accuracy of majority and minority classes. In Figure 6, on the Credit Card dataset, the G-means of KNN, Bagging, and XGBoost were 0.63, 0.58, and 0.62, and the AUC was 0.59, 0.67, and 0.46. On the Credit Fraud dataset, the G-means of KNN, Bagging, and XGBoost were 0.53, 0.57, and 0.058, respectively, with AUC values of 0.60, 0.61, and 0.72. In different datasets, the performance of single KNN, Bagging, and XGBoost is superior to other classification methods. Therefore, the ensemble learning method based on the above three classifiers have potential advantages in better performance. Performance testing of individual weak classifiers.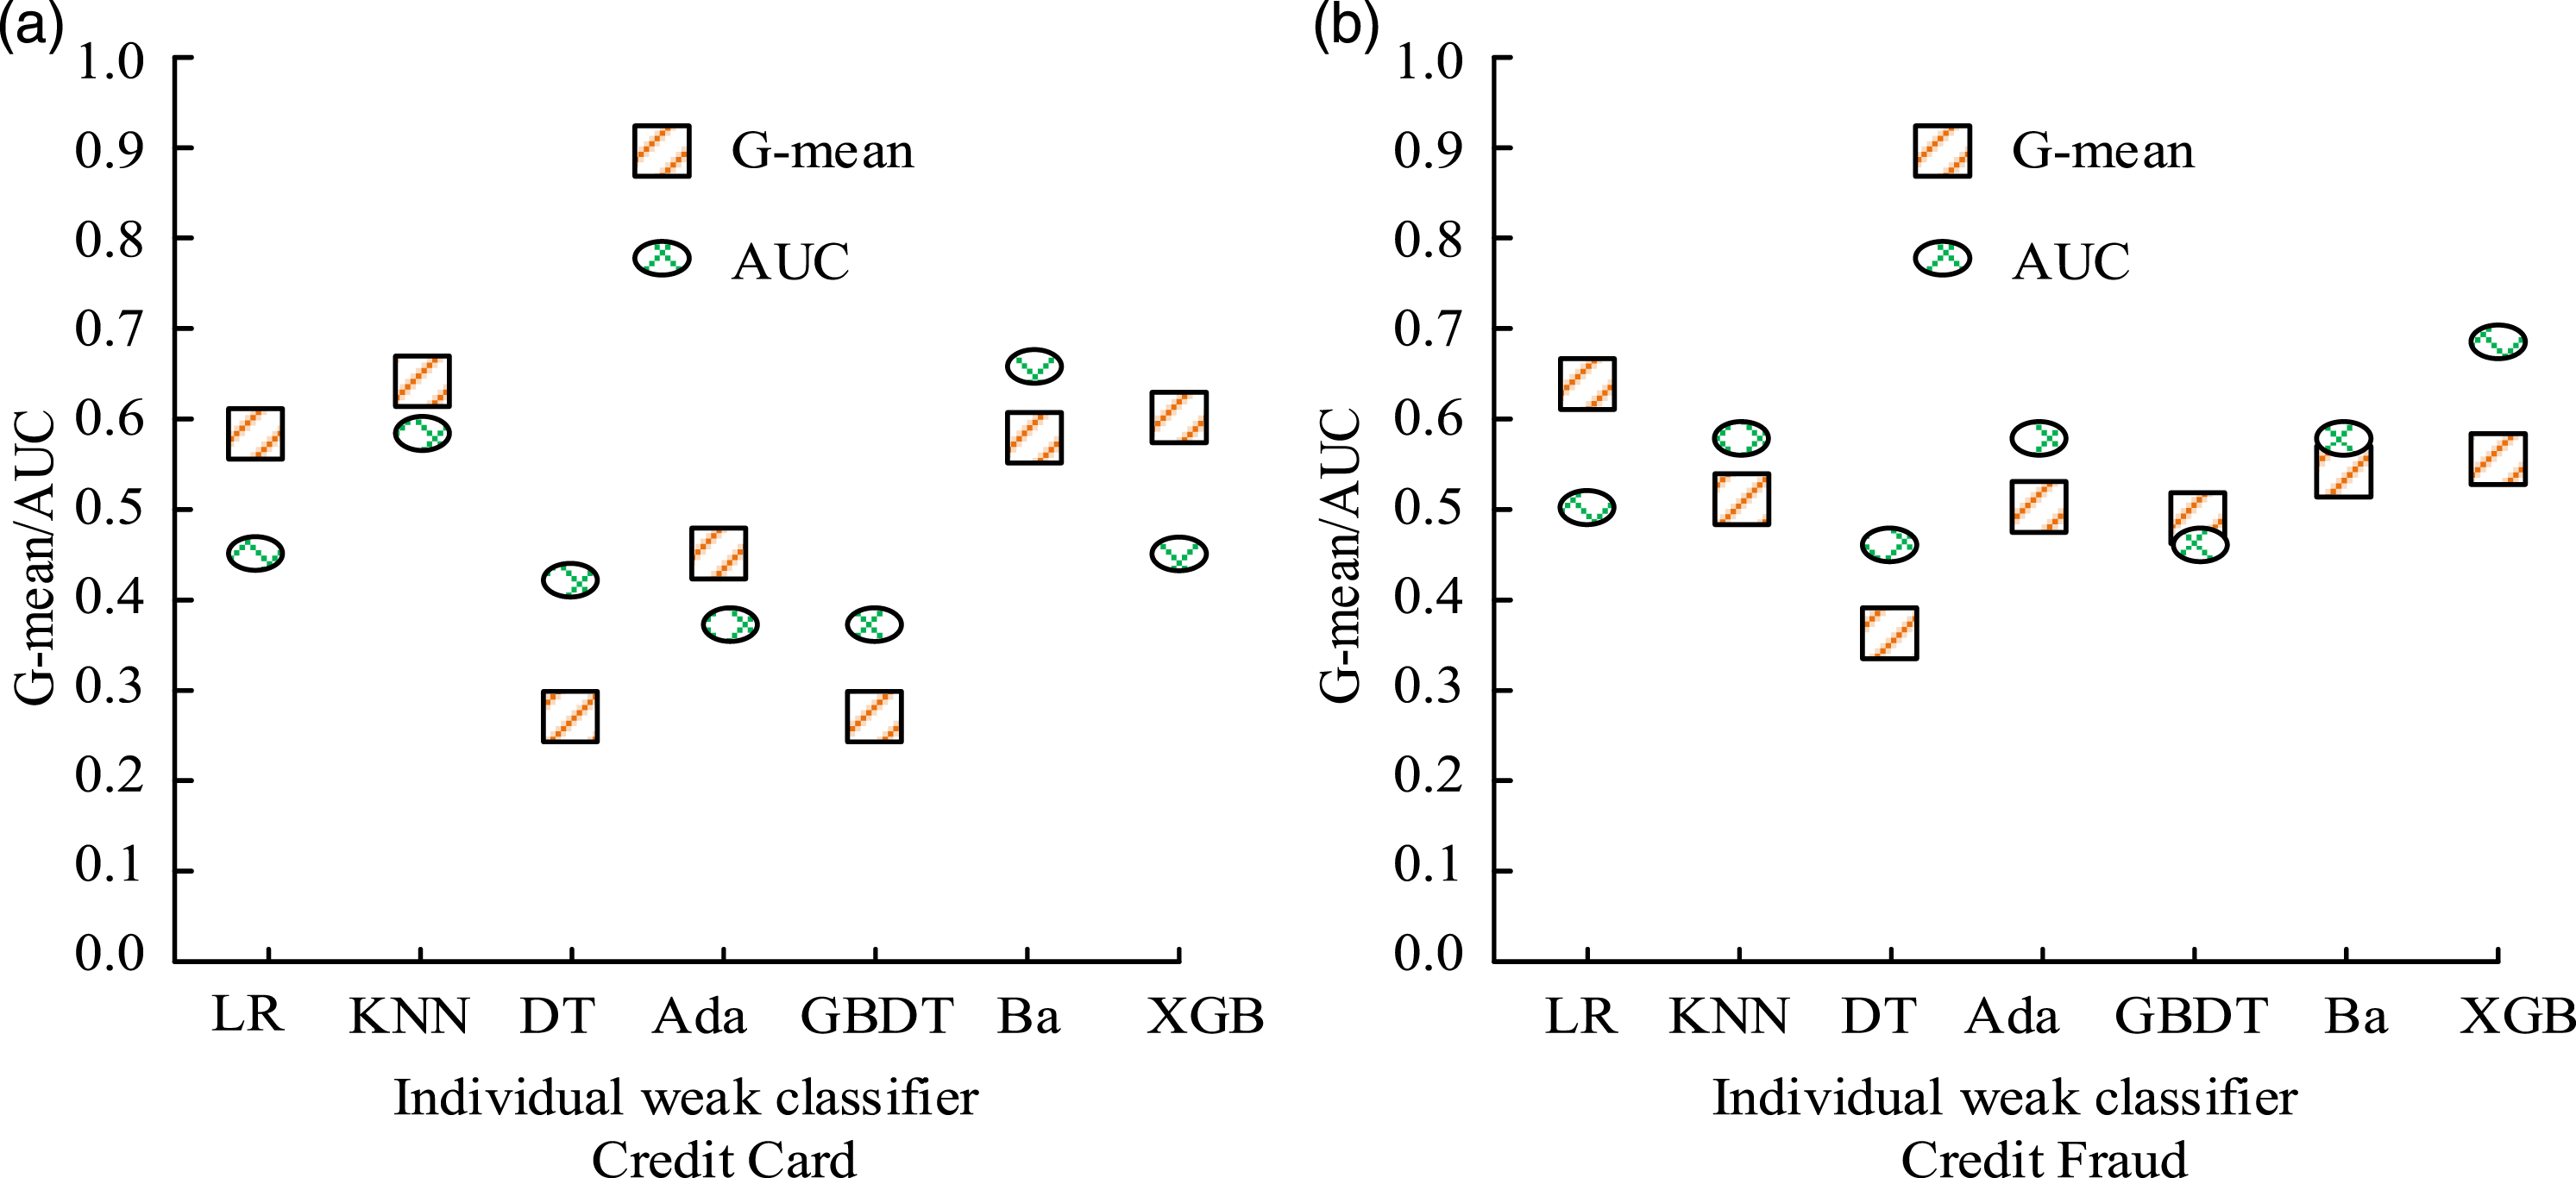
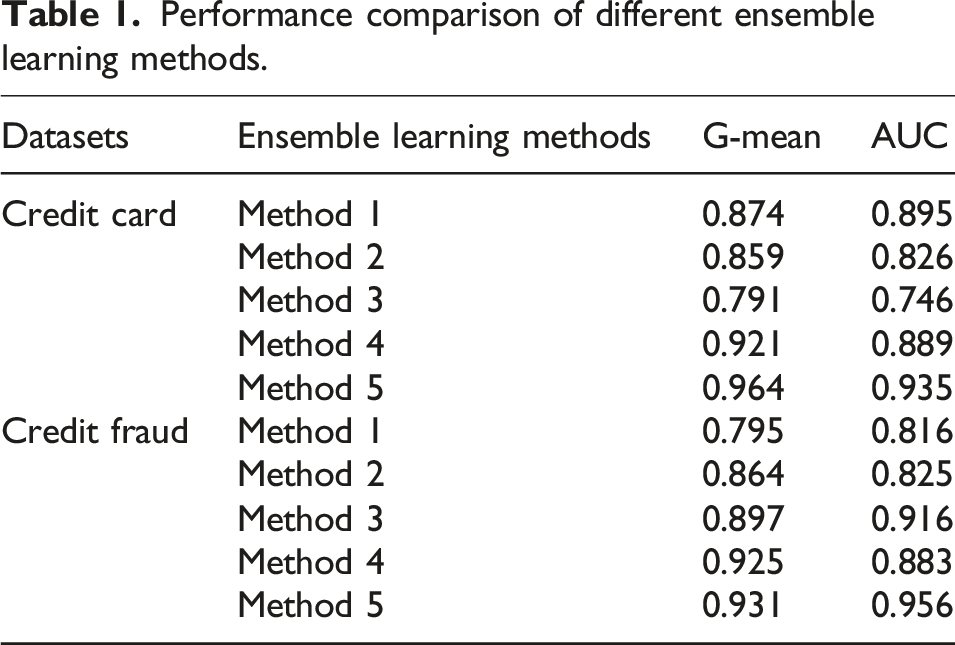
Performance comparison of different ensemble learning methods.
Analysis of player data prediction effect
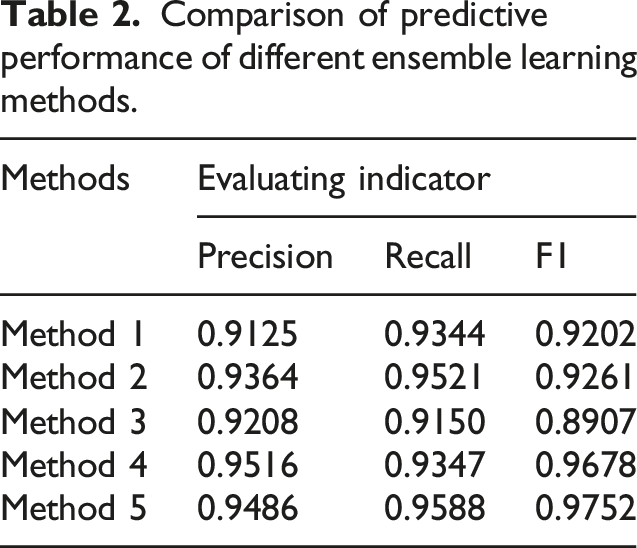
Comparison of predictive performance of different ensemble learning methods.
The ROC curve of each ensemble learning method in the basketball player dataset is displayed in Figure 7. According to Figure 7(a), the ROC values of the four comparison methods were 0.83, 0.85, 0.88, and 0.89, respectively. The ROC value of the designed method was 0.94. In Figure 7(b), the fitting values of the four comparison methods were 0.28, 0.22, 0.37, and 0.23, and the fitting value of the designed method was 0.17. This result indicates that the designed ensemble learning method has the optimal ROC value and fitting effect. ROC curves and fitting effect changes of various algorithms. (a) ROC and (b) fitness value.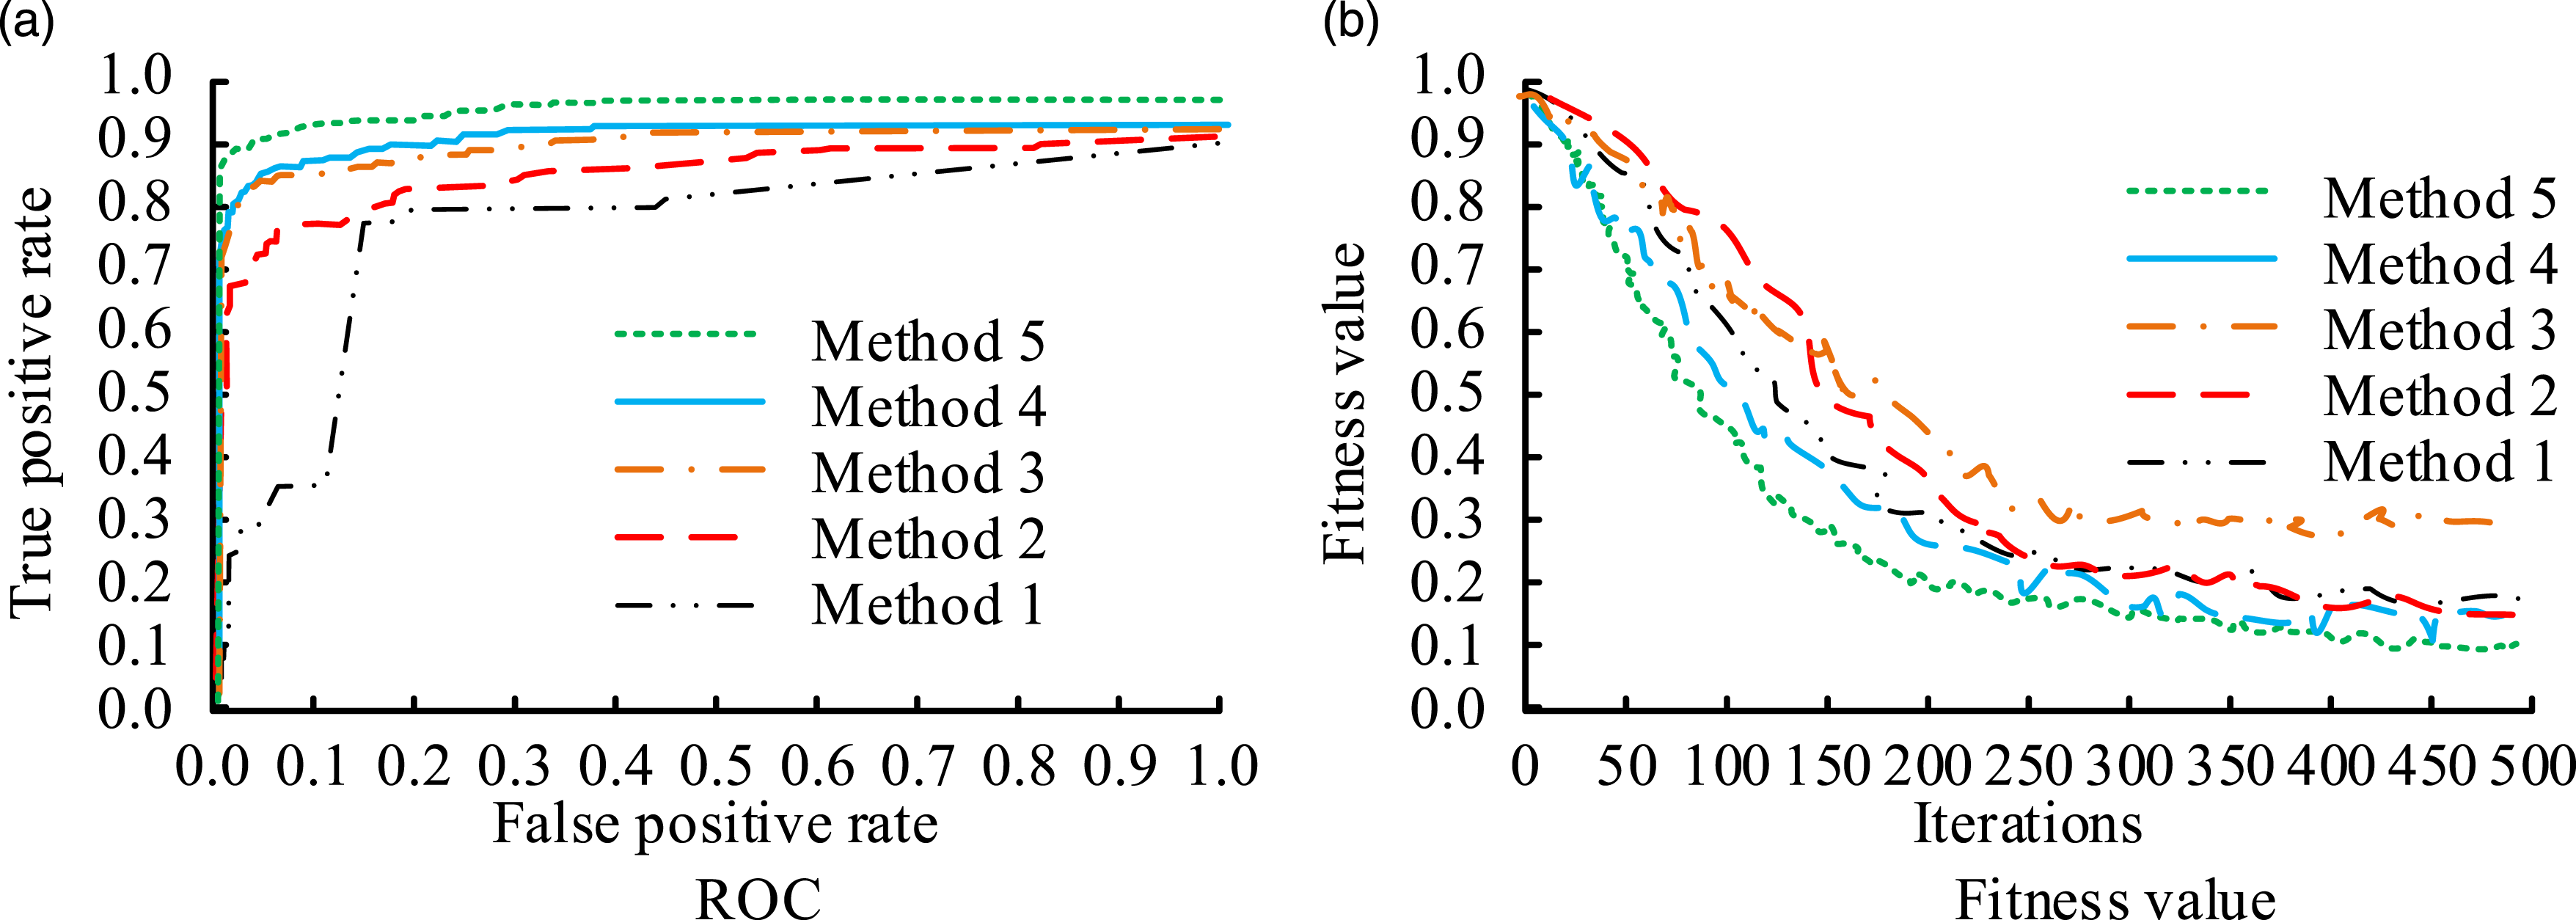
Taking the player’s attribute “Age” as an example, the “Age” of 5 team members is visualized. Taking the four time points of 2005, 2010, 2015, and 2020 as examples, the “Age” distribution of each team member is displayed in Figure 8. In Figure 8, the vertical axis signifies the player’s attributes, where the player’s “Age” is represented, and the horizontal axis represents the team number. From Figure 8(a), the age distribution of players in Team 2 and Team 4 was relatively more dispersed. From Figure 8(b), each team member had a significant age difference. In 2015, one player in Team 3 was relatively older, while the age distribution of other players was more concentrated. In 2020, the age distribution in Team 5 was relatively more dispersed. By visualizing the age data of team members, it is possible to clearly analyze the changes in the age attribute of the entire team members. If the “Age” attribute is replaced with other attributes, it can also show a clear change trend. Distribution of player “Age” attributes. (a) 2005, (b) 2010, (c) 2015, and (d) 2020.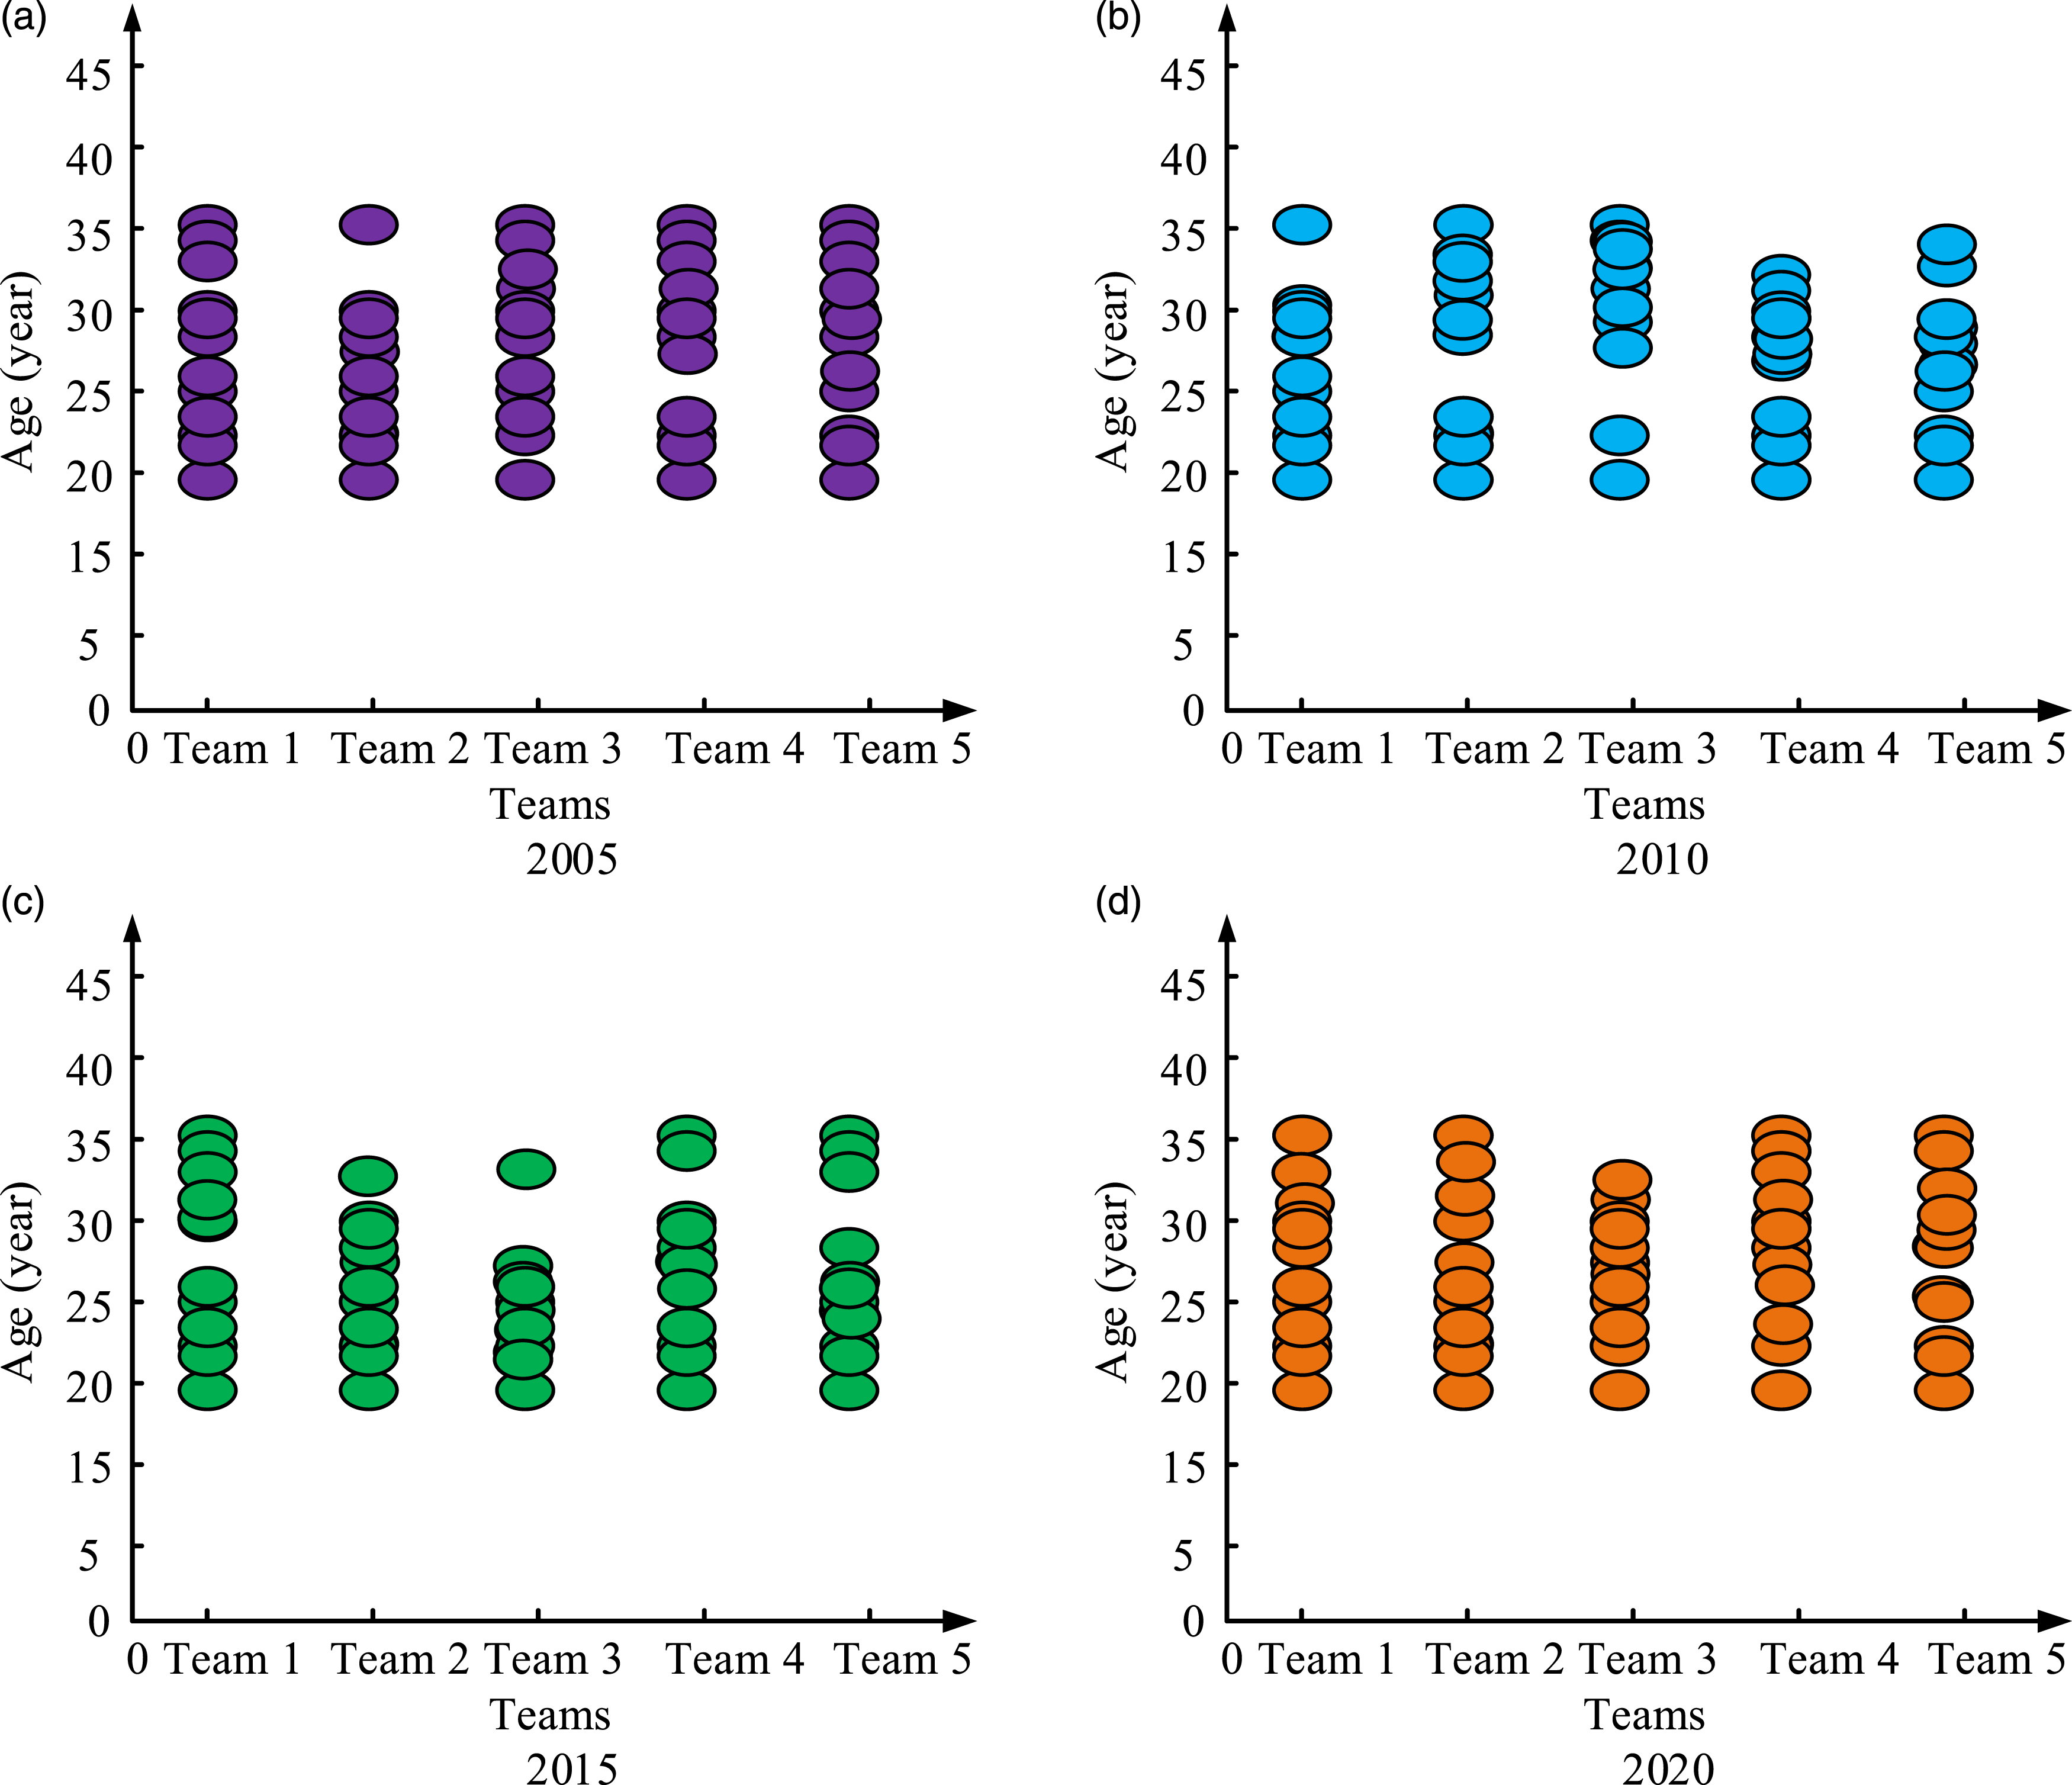
To further validate the predictive performance of this method on player data, six players are randomly selected from 2005 to 2020 for analysis of their ability changes. After analyzing and comparing the comprehensive data of players, the overall ranking of players can be obtained, which in turn reflects their overall level. The resulting player ability changes are shown in Figure 9. From the visualization results displayed in Figure 9, the closer the curve, the higher the ranking. Years without data indicate that the player has not joined or left the team. The ranking differences of the same player in different years were significant. Taking Player 1 as an example, the rankings from 2005 to 2014 were 3, 3, 1, 11, 10, 7, 9, 12, 13, and 14, respectively. By visualizing the overall abilities of team players, it is possible to clearly and intuitively analyze the changes in their overall ranking over a period of time. Changes in player abilities.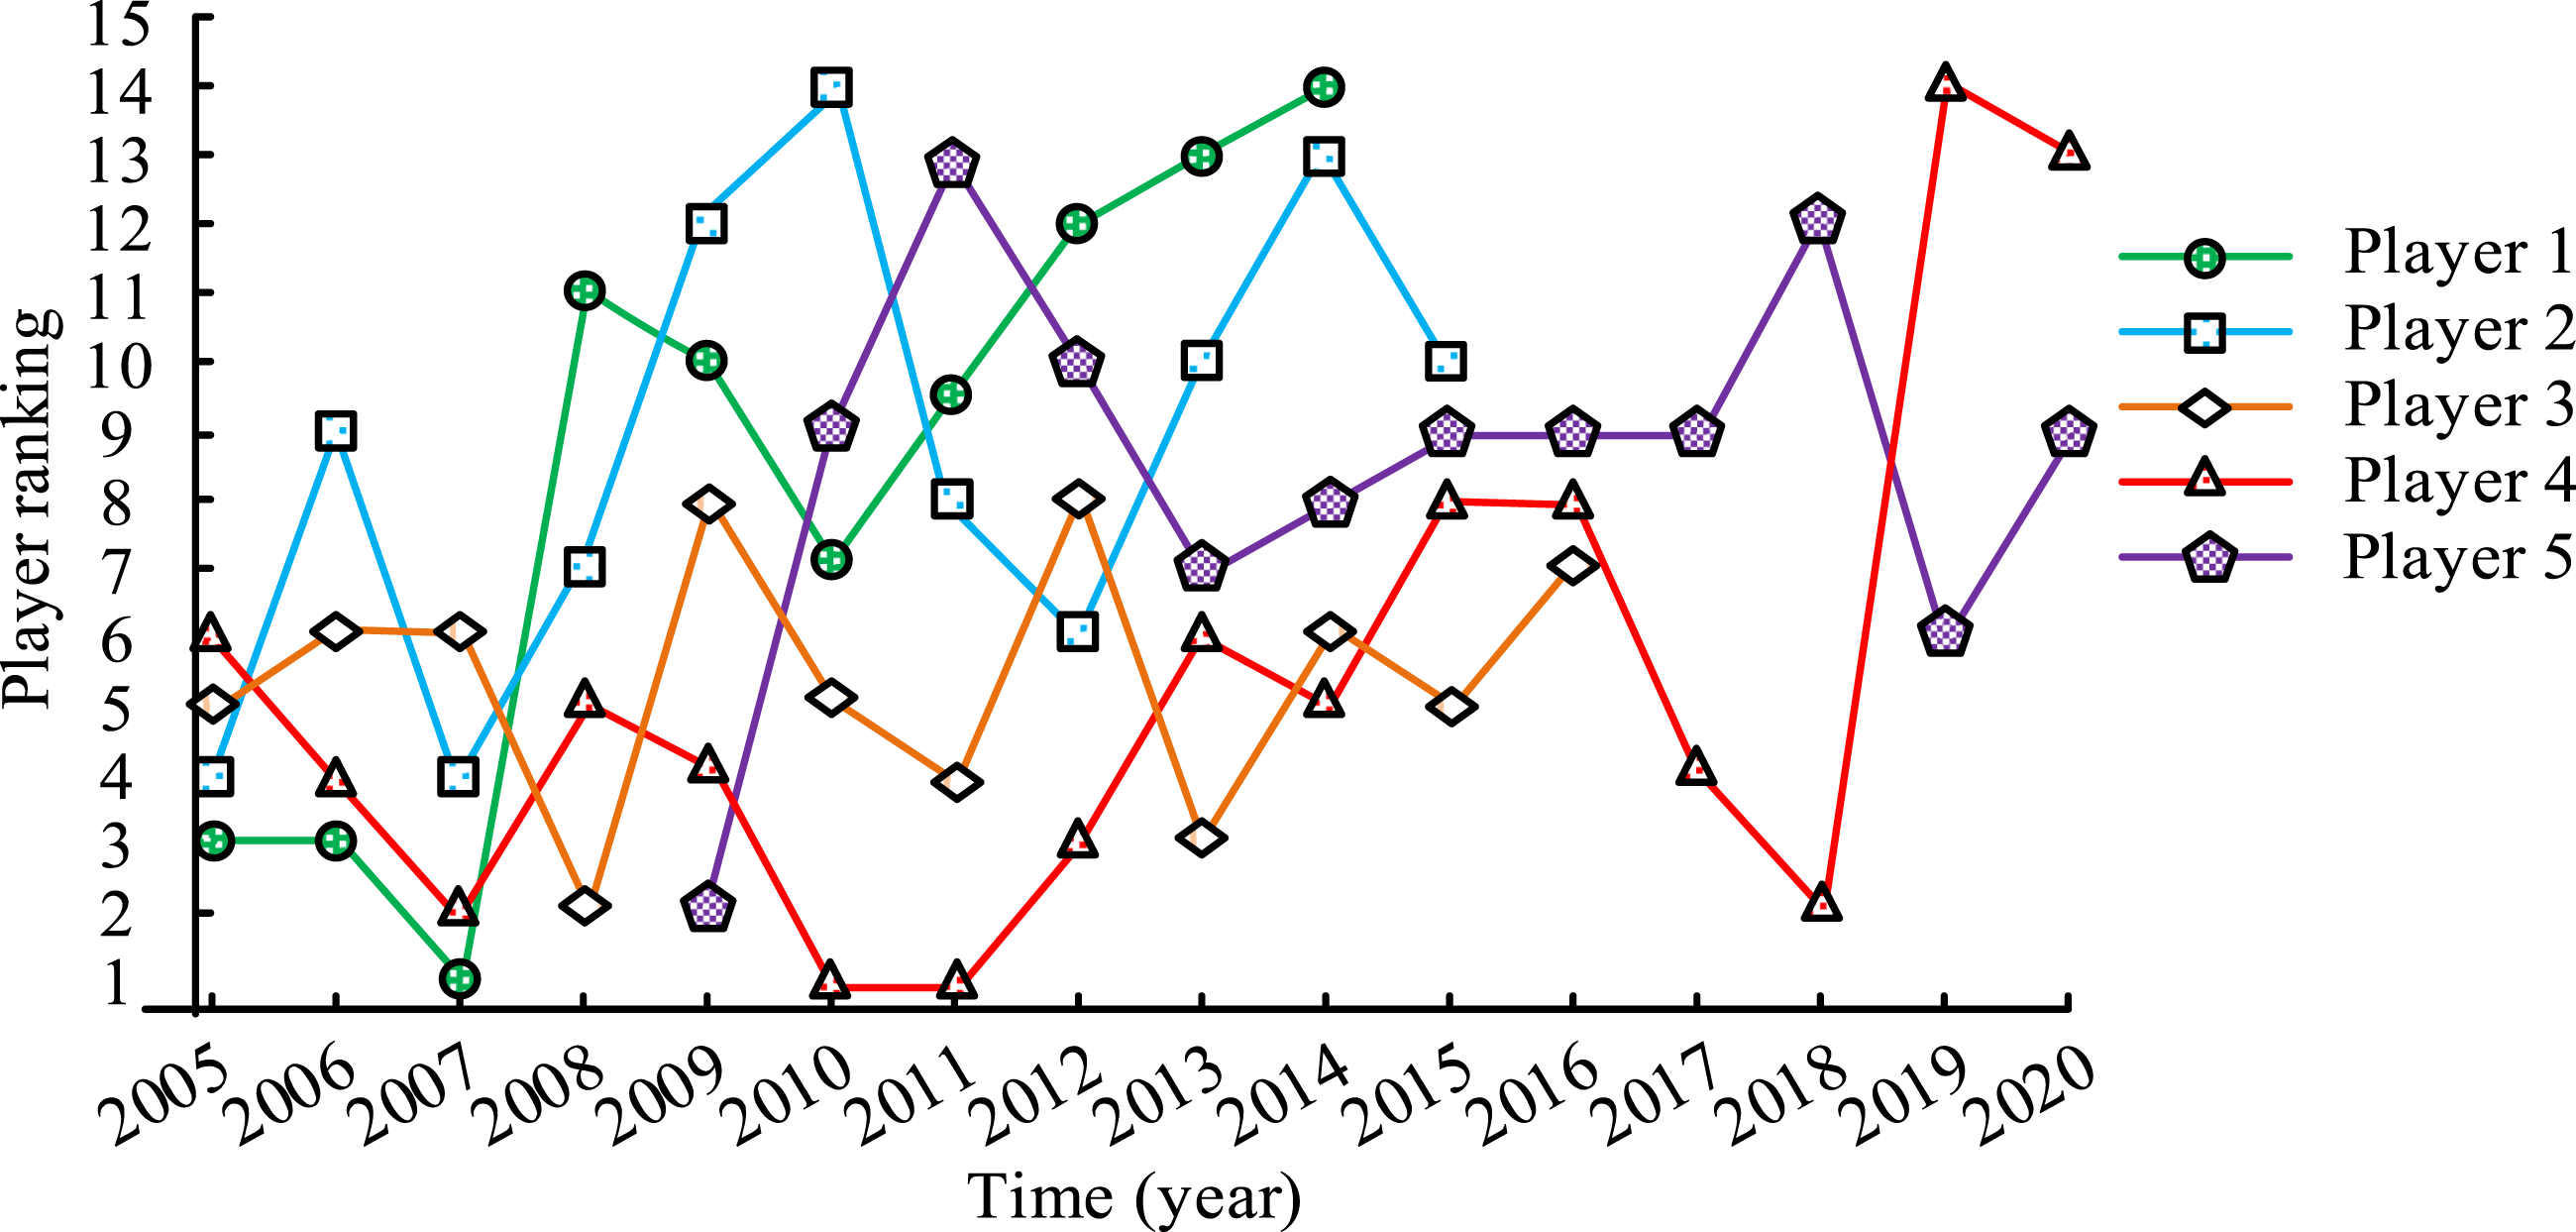
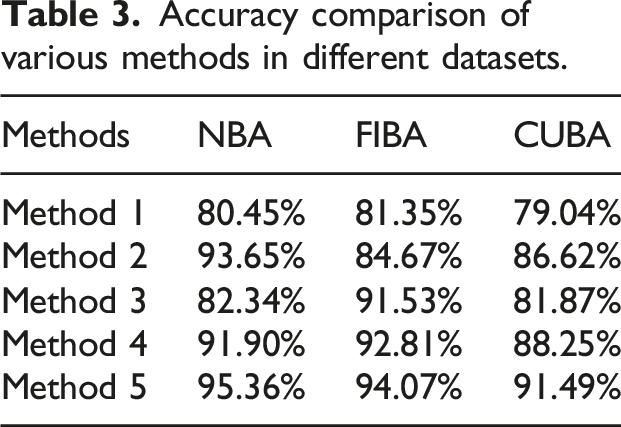
Accuracy comparison of various methods in different datasets.
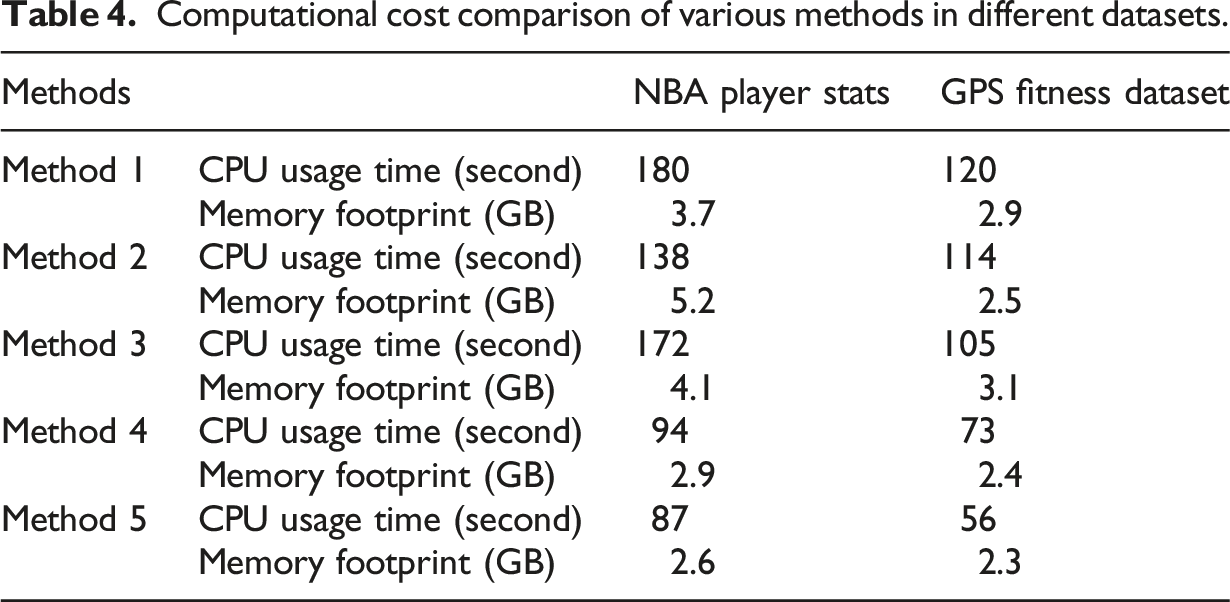
Computational cost comparison of various methods in different datasets.
Discussion and conclusion
Developing the competitive ability of basketball players is the fundamental goal of improving their performance. Therefore, analyzing the relevant data of team members is of great significance for analyzing the individual qualities and abilities. To better analyze ordinary players and competitive players, this study combined SMOTE and under-sampling techniques to handle the imbalance in the player dataset. Next, an ensemble learning method based on Voting was constructed to evaluate the performance of team players. In the analysis of imbalanced datasets, the G-mean and AUC values of the research method on the Credit Card dataset were 0.964 and 0.935, respectively. On the Credit Fraud dataset, the G-mean and AUC values were 0.931 and 0.956, respectively, which were higher than the comparison methods. In the player dataset analysis, the Precision, Recall, and F1 of the research method were 0.9486, 0.9588, and 0.9752, which were superior to comparison methods. The proposed method has a ROC value of 0.94 and a fitting value of 0.17, indicating better fitting performance. The accuracy of the proposed method in three datasets was 95.36%, 94.07%, and 91.49% on NBA, FIBA, and CUBA datasets, respectively, indicating higher accuracy in different datasets. The visualization results, taking the age of team members and their overall abilities as examples, clearly presented the specific personal basic data and comprehensive abilities of each team and player. This indicates that the player data visualization model based on Voting designed in the study can effectively analyze player related data and the overall quality of the team.
However, there are still shortcomings in the research. In player ability prediction, coaches have a guiding role in the development of the team. The study does not consider the influence of coaches on the team. Furthermore, this research method has only been applied to basketball players and its effectiveness in other scenarios has not been validated. In the future, this research method will further consider the impact of coaches on the development of players and teams when visualizing player abilities. At the same time, future attempts will be made to apply this research method to the visualization analysis of athletes in other sports such as football and volleyball.
Footnotes
Funding
The author(s) received no financial support for the research, authorship, and/or publication of this article.
Declaration of conflicting interests
The author(s) declared no potential conflicts of interest with respect to the research, authorship, and/or publication of this article.
Data Availability Statement
Data will be made available on reasonable request.