
Abstract
In response to the problem of traditional third-party logistics distribution evaluation methods ignoring the interaction and interdependence between evaluation indicators, this study constructs a comprehensive evaluation index system using the analytic network process and selects the most suitable logistics service provider. First, the optimization of third-party logistics distribution for agricultural products and the construction of an evaluation index system are carried out. Then, the analytic network process is used to establish a comprehensive evaluation system that includes multiple levels and evaluation index. The results indicate that the analytic network process has the best performance. When the evaluation process is 100%, the complexity, adaptability to dynamic environments, decision consistency, and usability are 57.3%, 19.2%, 92.6%, and 93.1%, respectively. The example analysis results show that the second service provider can be the preferred target. The above results demonstrate the effectiveness of the proposed method, provide scientific basis for the selection of agricultural product logistics service providers, and provide direction for logistics service providers to improve and optimize their services.
Keywords
Introduction
As the advancement of e-commerce and modern agriculture, effective logistics services are crucial for ensuring the quality of agricultural products and improving consumer satisfaction. The effective distribution of agricultural products plays a crucial role in ensuring food quality and meeting market demand. With the increasing demand from consumers for the freshness and quality of agricultural products, the importance of third-party logistics (TPL) services in the agricultural supply chain is becoming increasingly prominent. 1 As a bridge connecting producers and consumers, the service quality of TPL is directly related to the sales of agricultural products and consumer satisfaction. However, agricultural products have characteristics such as perishability and short shelf life, which pose special challenges to logistics and distribution. Therefore, establishing an efficient and scientific evaluation index system for the TPL and distribution of agricultural products is of great significance for improving the efficiency of the entire agricultural supply chain, reducing logistics costs, and ensuring the quality of agricultural products. Although many scholars have conducted extensive research on the evaluation methods of TPL service providers, there are still some deficiencies. Existing evaluation methods such as the Delphi method and genetic algorithm often regard the internal factors influencing the evaluation indicators as independent, ignoring the interdependence among the indicators. This assumption may not hold true in complex logistics service evaluation scenarios, resulting in deviations in the evaluation results. Analytic network process (ANP) is a systematic approach for complex decision-making, which can not only handle elements in a hierarchical structure, but also handle dependencies and feedback relationships between elements. ANP provides a quantitative evaluation method that helps decision-makers consider all relevant factors and determine their relative importance through pairwise comparisons.2,3 The aim of this study is to build an optimal evaluation index system for TPL distribution services of agricultural products through the ANP, to assist producers and distributors in making the best choices among numerous service providers. The purpose of this study is not only to improve the efficiency and effectiveness of logistics services, but also to promote the development of the entire agricultural supply chain toward greater efficiency and specialization.
The innovation of the research lies in the construction of a comprehensive and targeted evaluation index system in response to the special demands of TPL and distribution of agricultural products. Applying ANP to the field of TPL and distribution of agricultural products, a network evaluation system including the interdependence among indicators is constructed, providing a quantitative evaluation method capable of handling the complex interdependence among evaluation indicators. The relative importance of each factor is determined through pairwise comparison and evaluated by using super decision-making software, which effectively improves the scientificity of the evaluation process and the reliability of the decision-making results. The contribution of the research lies in that through the constructed evaluation index system, it provides a scientific basis for producers and distributors to select the most suitable TPL service providers among numerous service providers, which is conducive to improving the efficiency and effectiveness of logistics services. By integrating with ANP, it provides a direction for logistics service providers to improve and optimize their services, promoting the entire agricultural supply chain to develop in a more efficient and specialized direction.
This study is mainly contains four sections. The section 1 is a literature review, summarizing the research achievements in areas such as ANP. The section 2 is the research method, including the construction of the optimization and evaluation index system for TPL distribution of agricultural products, and the evaluation model based on ANP. The section 3 is the result analysis, which mainly compares the performance of research methods and analyzes examples. The section 4 is the conclusion, summarizing the research results and shortcomings.
Related works
The ANP is a complex multi-criteria evaluation method used for decision-making, which considers the dependency relationships and feedback effects between various factors and is suitable for handling complex decision-making problems. Regarding the adaptability of generally accepted accounting principles in digital transformation, Seo H et al. utilized the Analytic Hierarchy Process (AHP) to evaluate the key factors in building government platforms based on cloud computing and networks. The results demonstrated the significance of transparency in the public sector and suggested that the government should focus on its core functions, while the data-driven nature of government platforms was crucial for processing big data and improving governance efficiency. 4 Xintao M et al. evaluated 115 national level museum websites in China using the AHP to address the issue of museum websites in developing countries. The results showed that content updating and completeness had the greatest impact on utility. Most websites have shortcomings in technology, operation, and interaction, and research provides guidance for optimizing museum websites in the future. 5 To solve the problem of selecting locations for Asian bubble tea shops, Lin S H et al. improved the traditional network analysis method and constructed a mixed multi-attribute decision-making model to analyze three candidate locations for bubble tea shops in Nanjing. The results indicated that transportation and site characteristics were crucial for site selection, and specific site selection strategies and improvement suggestions were proposed. 6 Liao H et al. constructed a model that integrated social participation allocation networks and ANP to address the challenges of supplier selection in low-carbon supply chains, and evaluated it in a hesitant and ambiguous language environment. This model processed imprecise information through a delegation evaluation mechanism and network analysis method, and was analyzed as an example in a solar energy company to verify its practicality. 7 To assess the quality of the environmental influence evaluation report for hydropower stations, Sarmah P et al. created an objective type framework and a fuzzy logic toolbox. By analyzing network processes to determine the importance of nine attributes and applying the “If Then” rule to evaluate report quality, the research method was ultimately proven to be fast, comprehensive, and effective. 8
A scientific and reasonable evaluation index system is conducive to evaluating and selecting the best solution. Qin Z et al. conducted an evaluation and parameter optimization study on the operational comfort of clutch pedals in agricultural machinery with a multi-degree of freedom experimental platform. By establishing a comprehensive evaluation system and combining methods such as single-factor testing and analysis of variance, the optimal pedal position parameters were determined, providing reliable reference for optimized design. 9 Guo Q et al. established an evaluation index system using the TOPSIS method to analyze the international competitiveness of solar photovoltaic products in RCEP agreement countries, and studied the competitiveness of solar products in China, Japan, and South Korea. The results indicated that China’s competitiveness was strong and significantly improving, while Japan was declining and South Korea was growing slowly, with significant differences in the competitiveness structure of the three countries. 10 Jingjing X proposed a solution based on convolutional neural networks and ANP to address the difficulty of text recognition in online English homework, and constructed an evaluation index system. By combining wireless remote micro cloud platforms, an efficient online teaching environment was created. The experiment outcomes showed that this method could effectively improve and supervise student learning skills, and was conducive to helping teachers identify and guide disadvantaged students. 11 Vasconcelos T R S et al. artificially evaluated different logistics service providers and designed an evaluation method based on fuzzy reverse logistics index and fuzzy performance importance index, which considered multiple agents in the reverse supply chain to evaluate outsourcing companies. The results showed that this method could effectively identify key attributes that can improve customer satisfaction. 12 Zhang N et al. designed a combination weighting method to address the subjectivity and ambiguity in logistics service selection. This method combined the advantages of entropy weight method and improved AHP to calculate weights, and used fuzzy comprehensive evaluation method to generate the ranking order of logistics service providers and recommend the best service provider. The results showed that the evaluation and selection process of this method was objective. 13
The above research results show that both the ANP and the method of constructing evaluation index systems have broad applicability and practical significance in optimizing government platforms and museum websites, as well as in commercial site selection and supply chain management. However, in the evaluation of logistics service providers, these methods did not consider the interdependence between evaluation indicators, and the evaluation results were not ideal. In view of this, this study aims to construct a comprehensive and practical evaluation index system by applying the AHP to optimize TPL distribution services for agricultural products, to promote producers and distributors of agricultural products to make more reasonable logistics service choices.
Evaluation index system for the selective preference of third-party logistics distribution of agricultural products based on ANP
To construct an optimal evaluation index system for the TPL distribution of agricultural products based on the ANP, a comprehensive evaluation index system is first constructed, and the ANP is used to develop an evaluation model to evaluate and optimize TPL distribution service providers in agricultural product.
Construction of evaluation index system for the selective preference of third-party logistics distribution of agricultural products
In general, the distribution of agricultural products often adopts a TPL model, whose core is to apply the specialization and technology of logistics management to the entire agricultural product distribution chain. This includes a series of links, such as the storage and transportation of agricultural raw materials to the production process, then to the logistics integration of finished products, and finally to the distribution of the final product.
14
The operation mode of TPL for agricultural products is shown in Figure 1. Third-party logistics operation mode for agricultural products.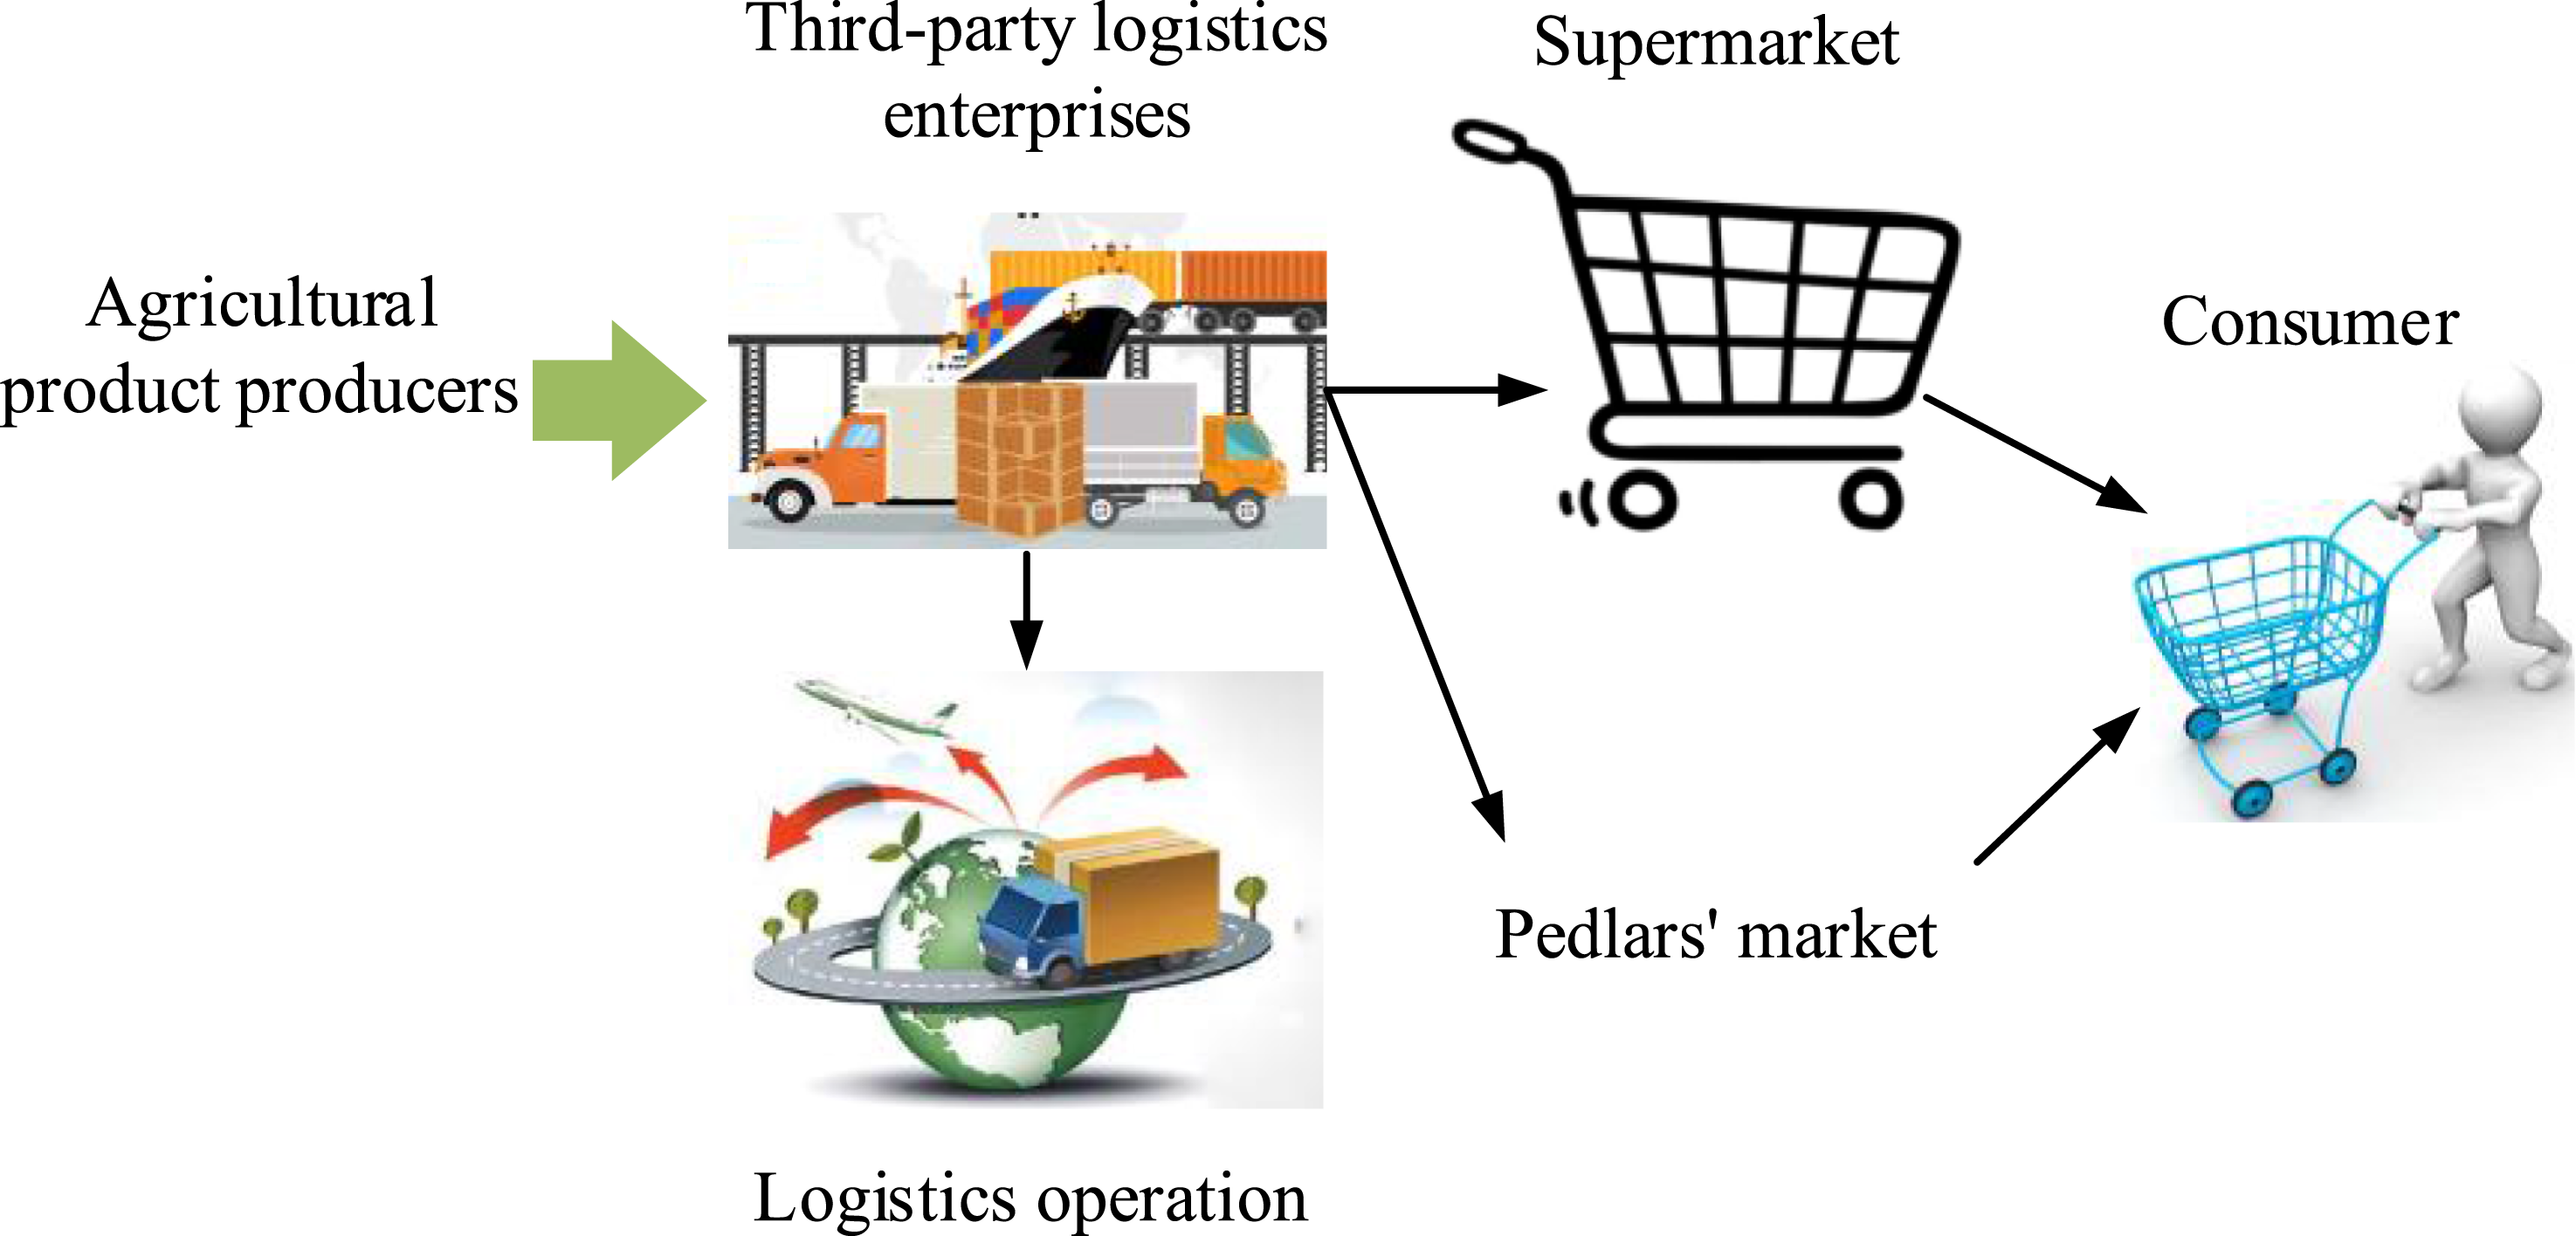
From Figure 1, agricultural product producers transmit information to TPL enterprises, which carry out logistics operations, including inspection and quarantine, classification, transportation, warehousing, packaging, distribution, and information processing, and transmit them to supermarkets and markets, and finally reach consumers. The TPL model for agricultural products involves professional logistics service providers, which are independent of the production and sales processes of agricultural products. In this mode, logistics services are based on contracts and cooperative relationships to provide customers with customized and information-based integrated logistics solutions.15,16 Specifically, agricultural product production and processing enterprises outsource logistics tasks to these specialized companies, enabling them to concentrate resources to optimize core businesses and reduce logistics costs. The starting point of this circulation system is agricultural organizations or individual farmers, and through this model, agricultural products ultimately reach the hands of consumers. In this logistics model, the flow of physical goods is a one-way process from the production end to the consumption end, while the flow of related information is a two-way interaction.
Evaluation index system for third-party logistics service providers of agricultural products.
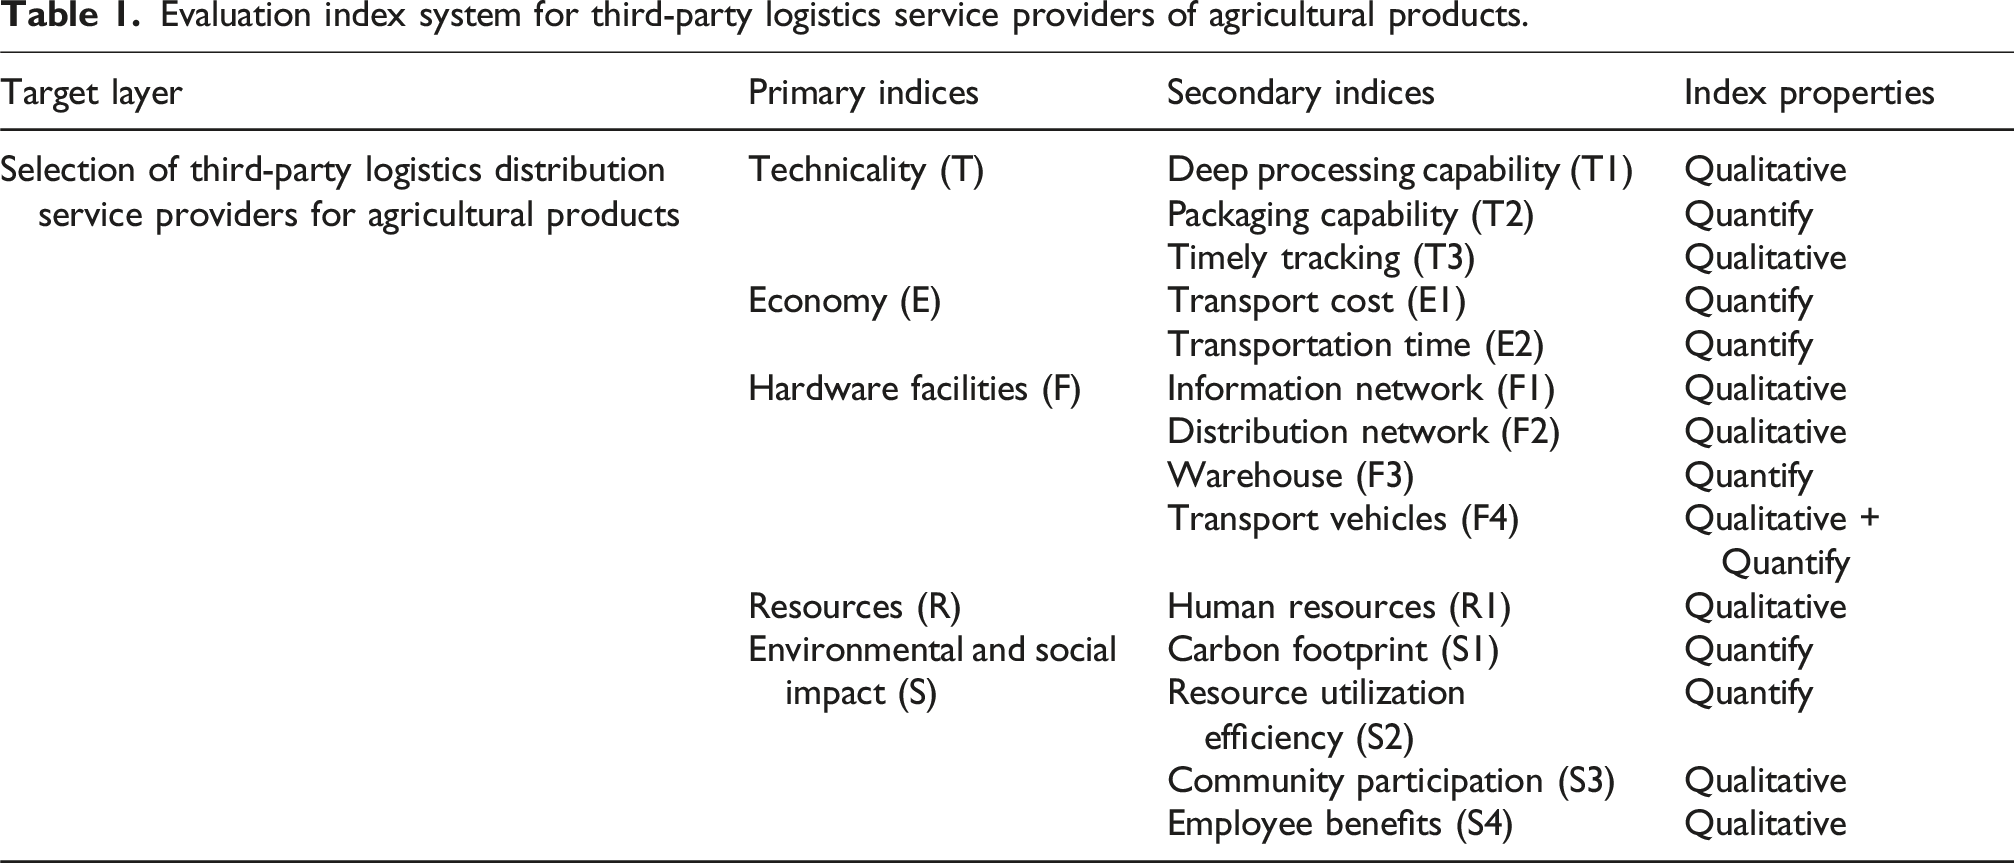
In Table 1, the key indices considered when evaluating agricultural product logistics services include qualitative and quantitative indicators. The scoring range for qualitative indicators is from 0 to 10, with higher scores indicating better performance. As for quantitative indicators, the first consideration is packaging capacity, that is, the amount of agricultural products that a company can process per unit of time, which is crucial for the transportation and storage of agricultural products. Next is transportation cost and time, which are crucial for low-cost agricultural products because high transportation costs weaken market competitiveness, while fast transportation responds to changes in market demand and product preservation requirements. Finally, the number of warehouses and their location from the consumption area are also decisive factors, as agricultural products need to be stored appropriately before they reach consumers after production. Meanwhile, environmental and social impacts are also aspects that cannot be ignored in agricultural product logistics services. Therefore, the research incorporates environmental and social impact indicators to comprehensively evaluate the overall performance of logistics suppliers. Among them, environmental impact indicators include carbon footprint and resource utilization efficiency, while social impact indicators include community participation and employee welfare. These indices together constitute a comprehensive evaluation system for the efficiency of agricultural product logistics.
Evaluation model based on ANP
The ANP standard structure generally contains two main parts: the control layer and the network layer. The control layer is responsible for clarifying the goals of decision-making and the criteria to be considered, forming a hierarchical system, similar to the hierarchical structure of traditional AHP.
18
The general structure of ANP is shown in Figure 2. The general structure of ANP.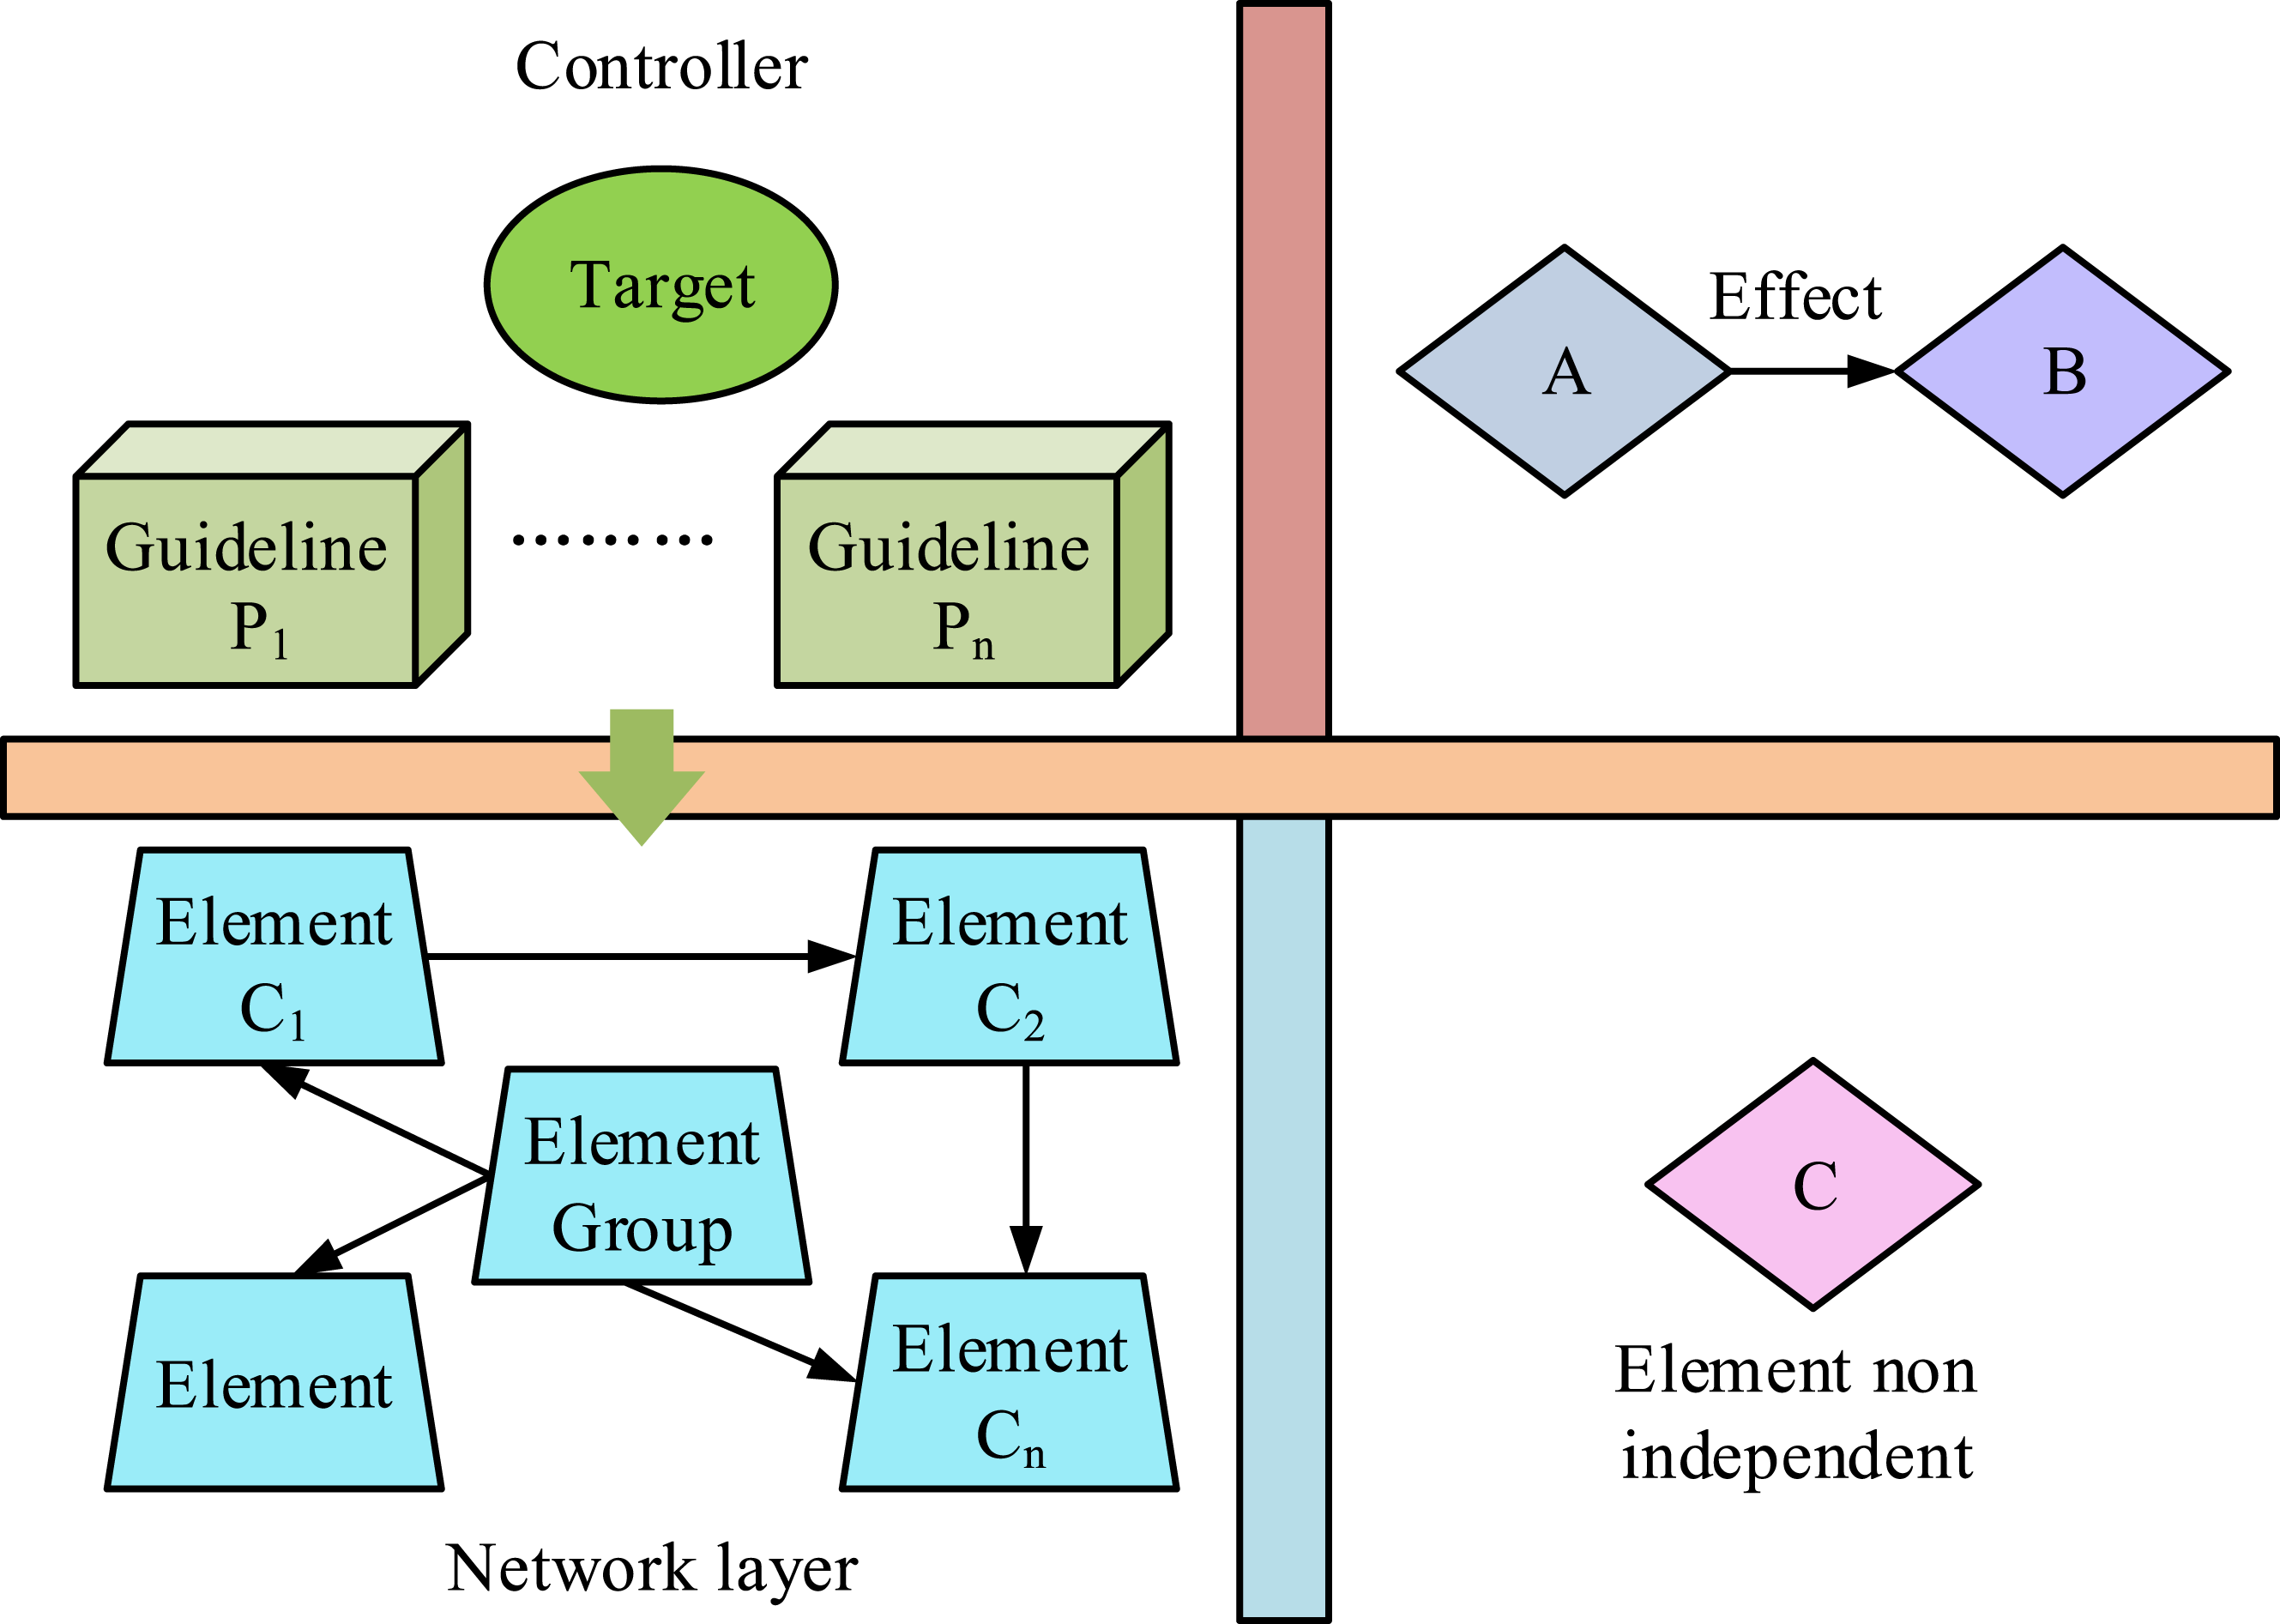
In Figure 2, ANP mainly includes a control layer and a network layer. The control layer usually contains the main objectives or decisions of the decision layer, while the network layer includes the elements or decision points that affect each other in the decision-making process. One of the key steps in ANP is to determine the hierarchical structure and compare the elements dominated by the main criteria pairwise to generate a judgment matrix. In contrast, in ANP, the compared elements are not independent of each other and can be compared using both direct and indirect influence measures. The calculation of ANP is shown in Figure 3. The calculation process of ANP.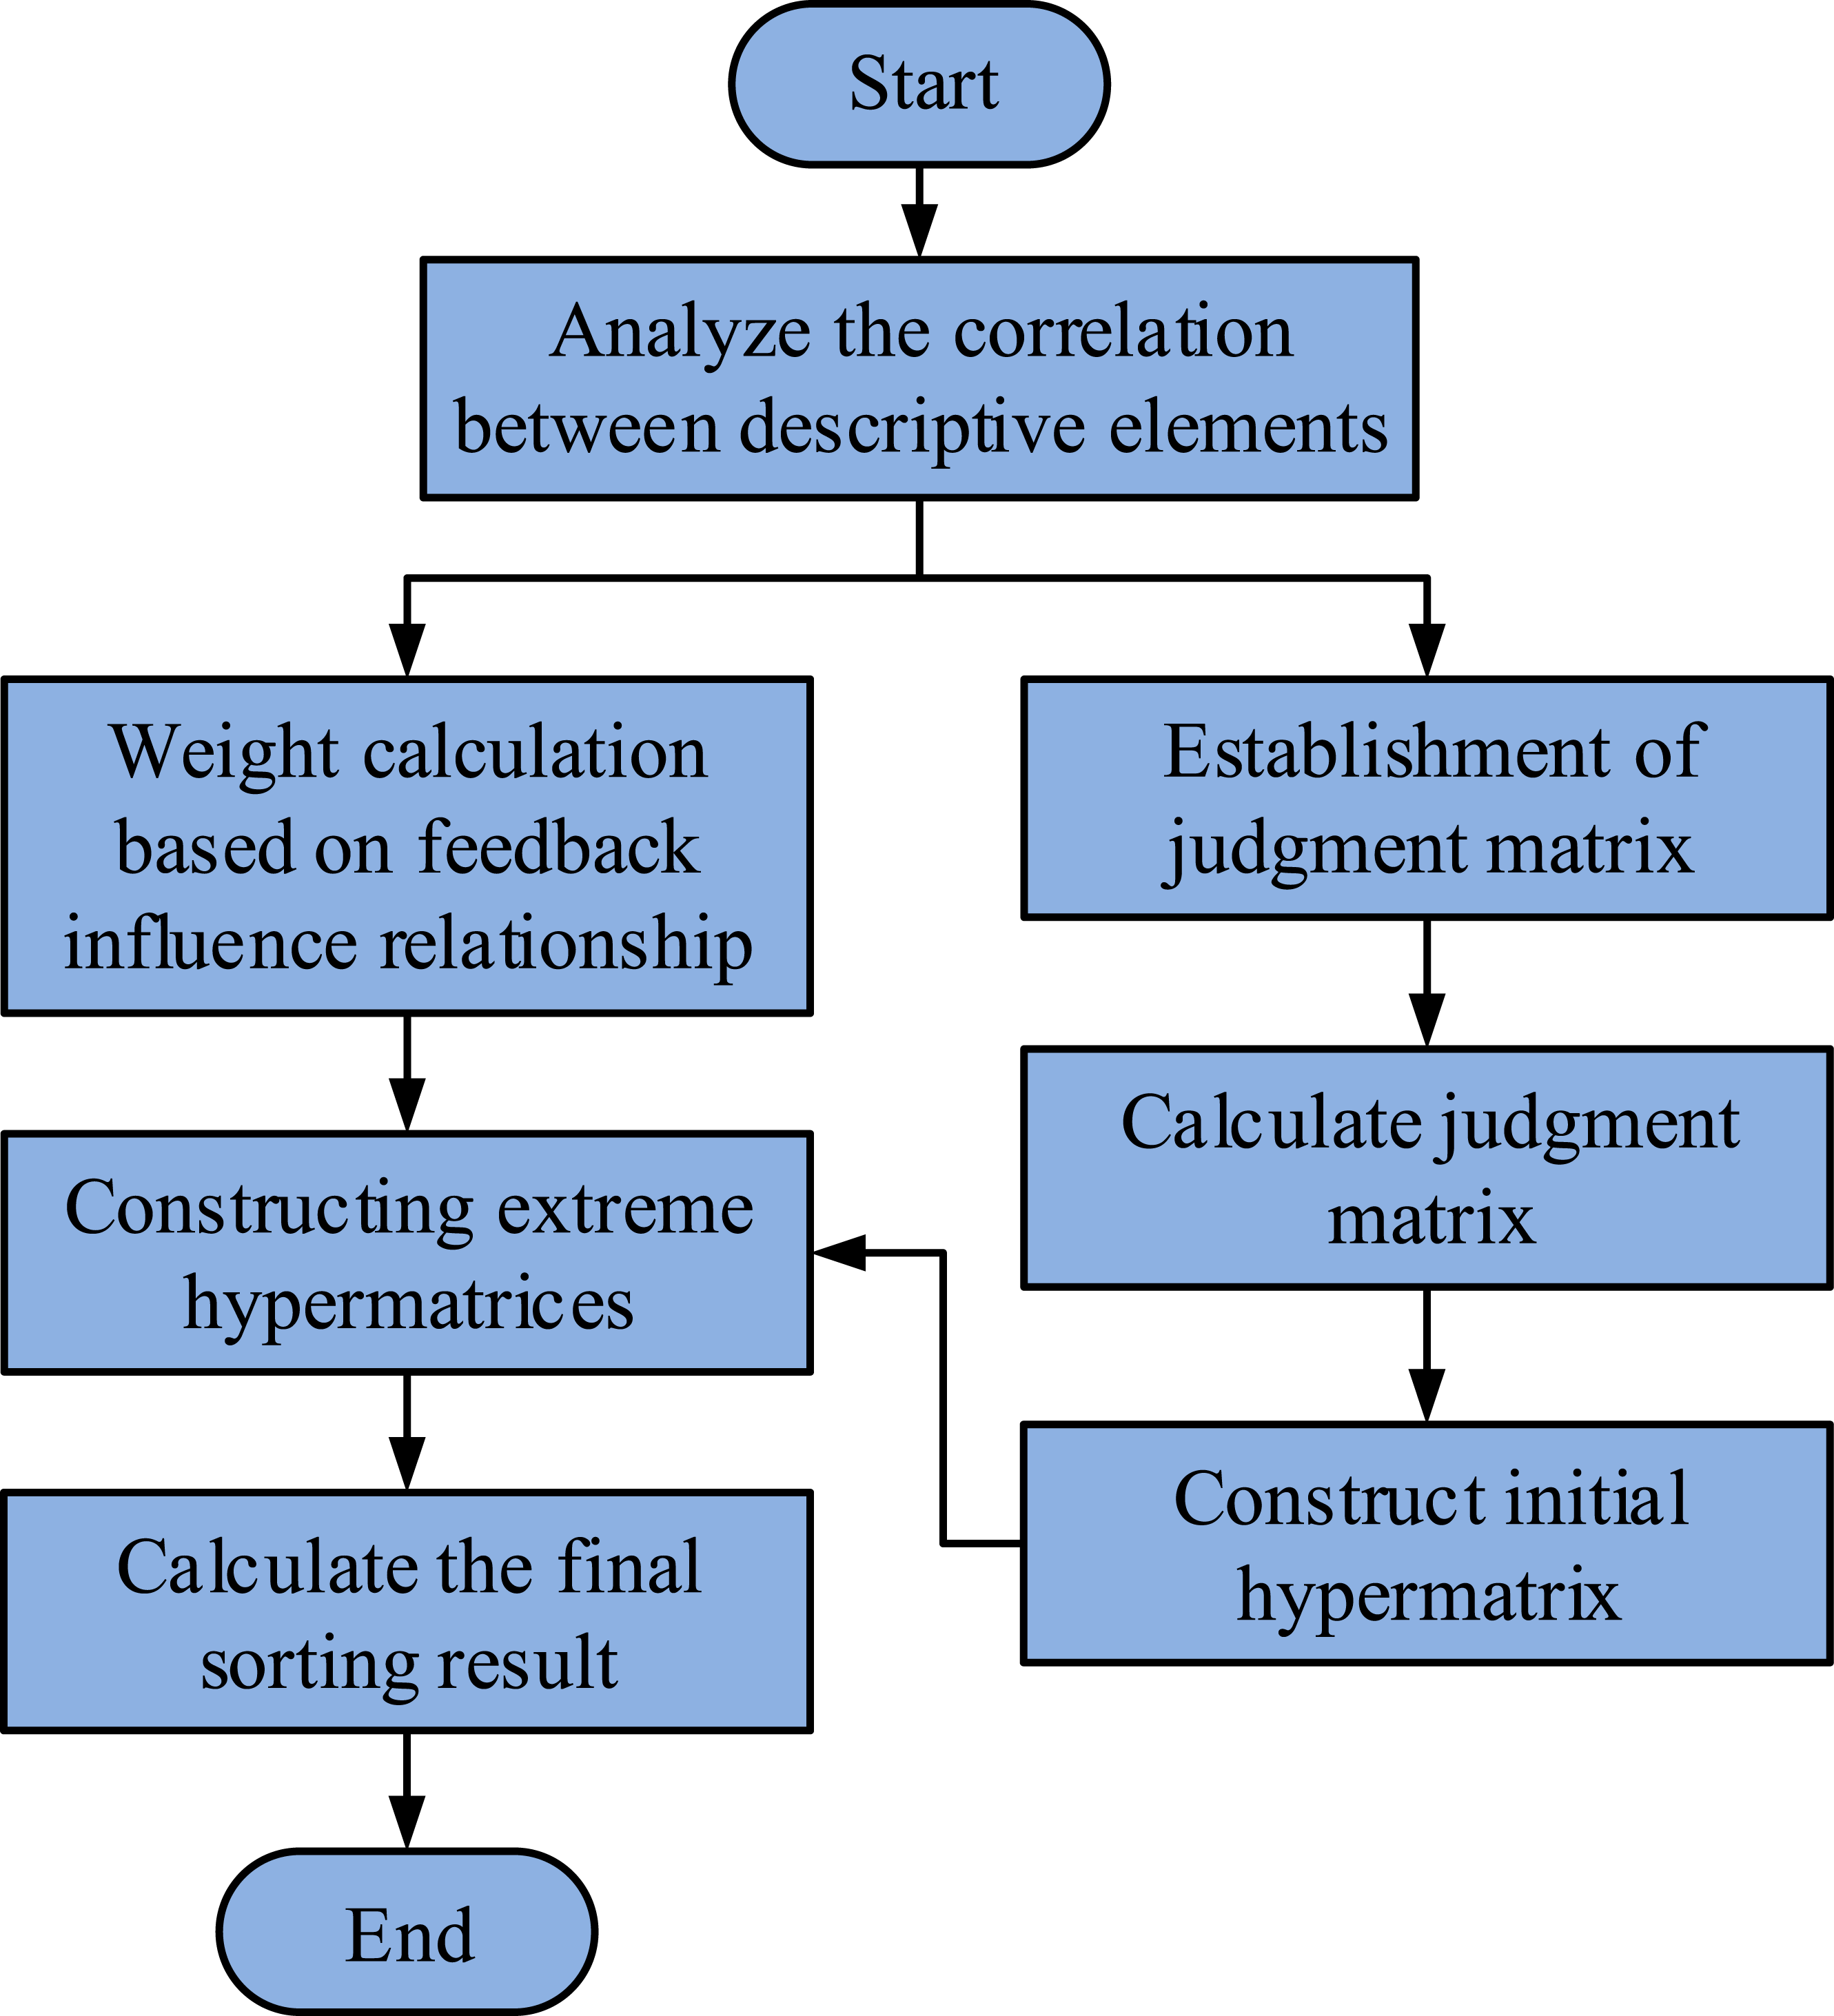
From Figure 3, in the calculation of ANP, the first step is to thoroughly analyze the decision-making problem, distinguish and classify the relevant elements in the problem, and determine whether these elements are independent or related. The next is to establish an ANP model, starting with setting goals and criteria for the control layer, and develop a network layer that includes the interrelationships between these elements. Finally, due to the relatively complex calculation process of ANP, it relies on specific software tools such as Super Decisions to quickly and accurately calculate the weights of each element.
19
There are control elements in the ANP structure diagram, namely, 

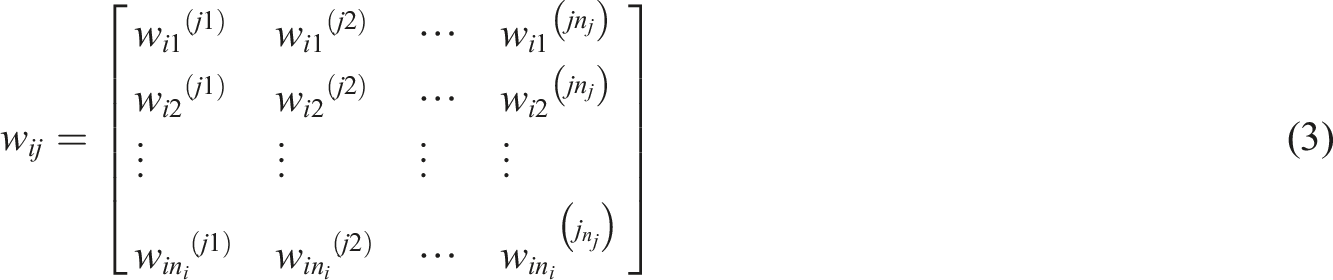
The column vector in equation (3) mainly consists of a sorting vector for the degree of influence of 
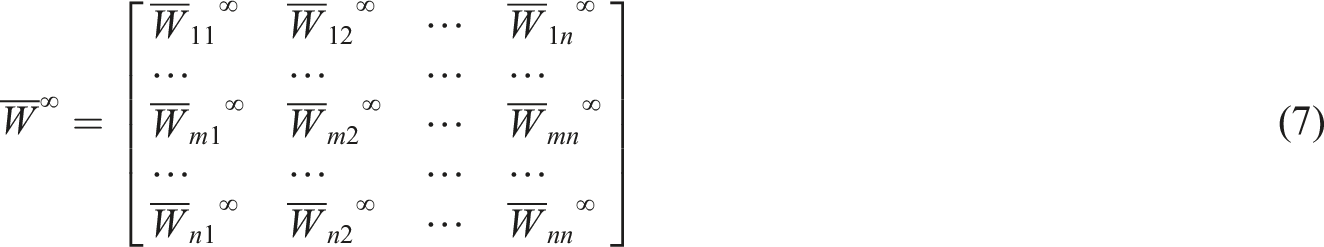
All hyper-matrices are non-negative, with a total of 
By weighting the hyper-matrix 
Importance comparison matrix importance scale value.
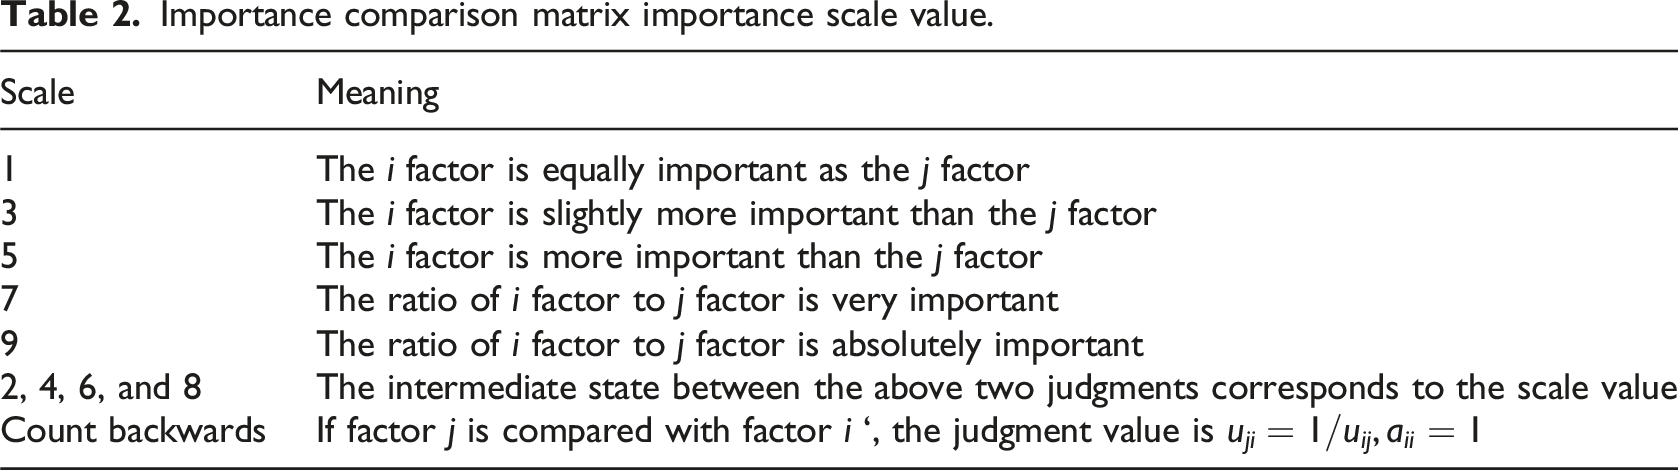
The research adopts Super decisions 3.0 for the construction of ANP. First, the control layer and network layer are defined in the network view. According to the evaluation index system, technical capability (T), economy (E), hardware facilities (F), and resources (R) are taken as the first-level index groups, and the second-level indicators are taken as subgroups. The interdependence among indicators is established through the “Link” function. Then, based on the control layer objectives, pairwise comparisons are made of the elements within each index group of the network layer. Then, the consistency ratio of each judgment matrix is automatically calculated by the software. When the consistency ratio is less than 0.1, the judgment matrix passes the consistency test. When the consistency ratio is greater than or equal to 0.1, the scale needs to be readjust until the requirements are met. For cross-group dependencies, the influence paths need to be manually set in the “Hyper-matrix” module. In the “Calculation” module, the software generates a weighted hyper-matrix through iterative calculation and automatically performs extreme processing, ultimately outputting the comprehensive weights of each index. The specific process is shown in Figure 4. ANP construction process.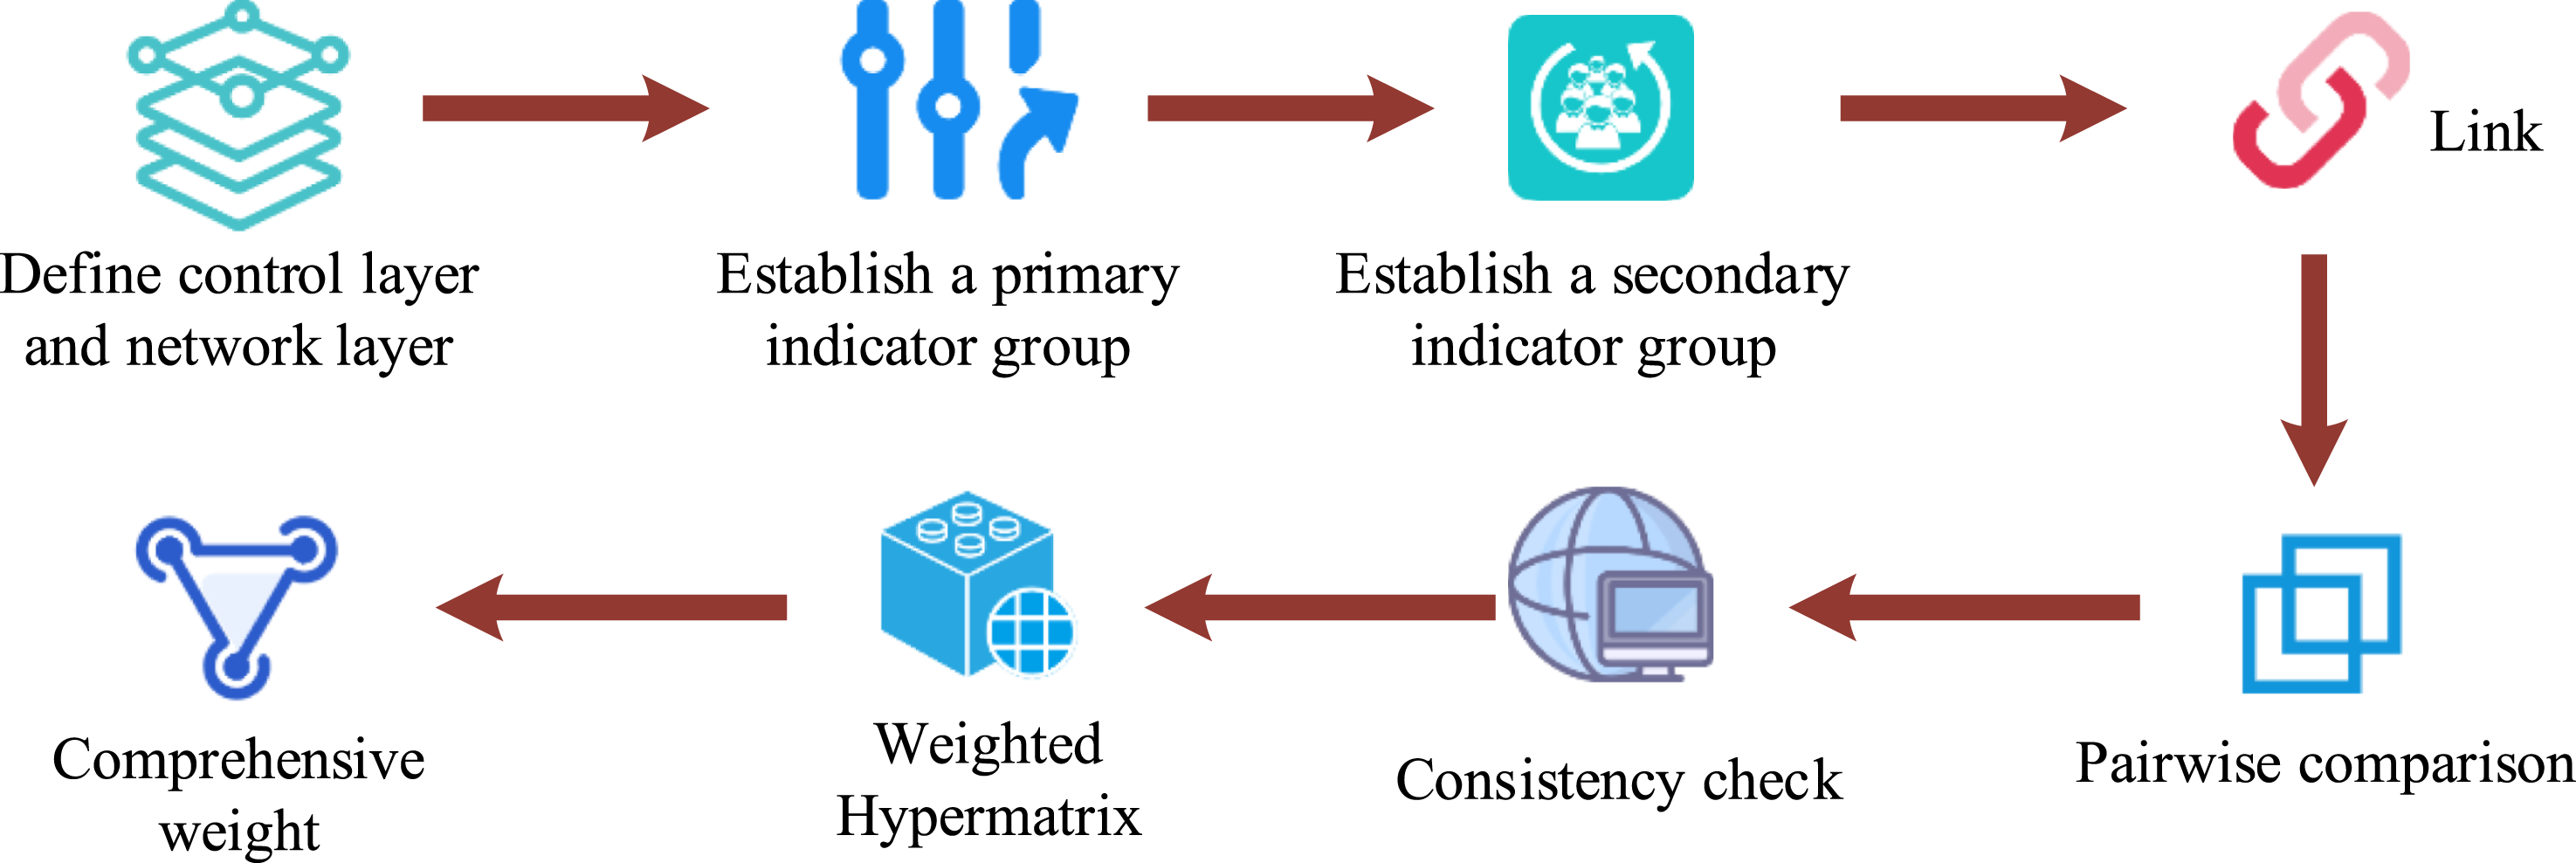
Analysis of the evaluation index system for the optimal selection of third-party logistics distribution of agricultural products based on AHP
To analyze the ANP-based evaluation index system for the optimal selection of TPL distribution of agricultural products, it first compared the differences and effectiveness of AHP, ANP, and D-ANP methods in evaluating the effectiveness of TPL distribution. By analyzing examples, the performance of three service providers in practical applications was compared to optimize the selection of agricultural product logistics distribution.
Performance analysis of evaluation methods
Environment of the experiment.

When analyzing the evaluation methods and evaluation index system, first was to select a specific case of TPL distribution of agricultural products, determine the evaluation index system, and collect relevant data. The same dataset was separately processed using AHP, ANP, and D-ANP, while noting the processing time and required input details for each method. The results of three methods were compared and the advantages and limitations of each method were analyzed. Experts in the fields of logistics and decision analysis were invited to evaluate and rate the experimental results for a more professional and comprehensive analysis. Sensitivity analysis on input parameters was conducted to evaluate the stability of different methods under parameter changes. Specifically, a single-factor analysis of the index weights was conducted first, that is, only one weight value was changed each time to observe the degree of its influence on the final result. Then, multi-factor sensitivity was conducted to simulate the changes in model results under different scenarios, to evaluate the stability of the model under the action of multiple uncertain factors. The results of three evaluation methods in dealing with the complexity, dynamic environmental adaptability, decision consistency, and usability of decision-making problems are shown in Figure 4.
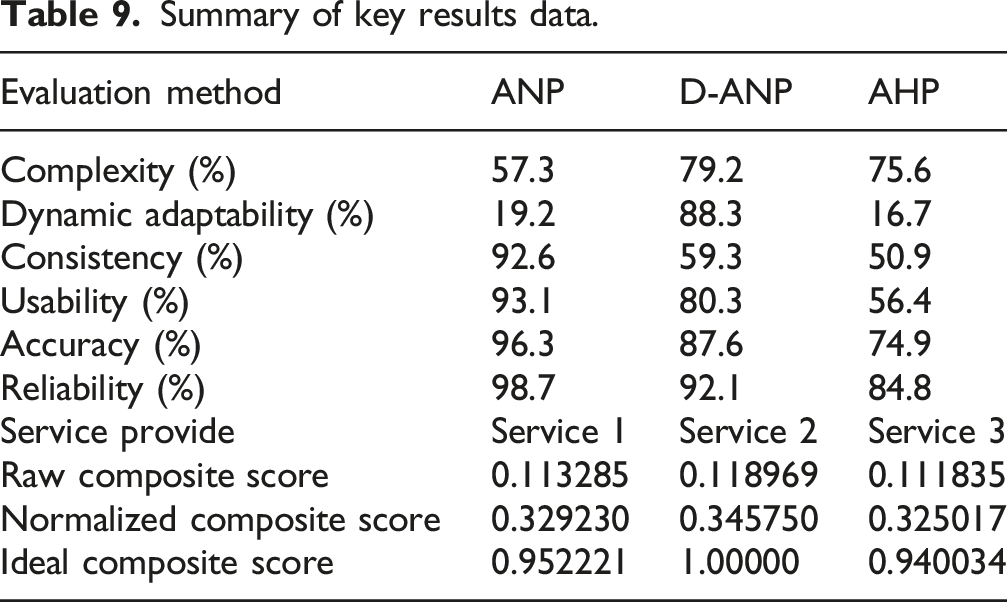
Figure 5(a)–(d) show the complexity, dynamic environmental adaptability, decision consistency, and usability of three algorithms when dealing with decision problems, respectively. From Figure 5, when the evaluation process was 100%, the complexity of ANP, D-ANP, and AHP were 57.3%, 79.2%, and 75.6%, respectively. The dynamic environmental adaptability was 19.2%, 88.3%, and 16.7%, respectively. The decision consistency was 92.6%, 59.3%, and 50.9%, and the usability was 93.1%, 80.3%, and 56.4%, respectively. The complexity and dynamic environmental adaptability of D-ANP were superior to ANP, but its decision consistency and usability were significantly lower than ANP. The four indicators of AHP were all lower than ANP and D-ANP, indicating that its performance was relatively average. Overall, ANP had the best performance. Next was to analyze the evaluation accuracy and reliability of the three methods, and the results are shown in Figure 6. General performance analysis of three evaluation methods. (a) Complexity. (b) Dynamic environmental adaptability. (c) Decision consistency. (d) Usability. Evaluation accuracy and reliability of three methods. (a) Accuracy. (b) Reliability.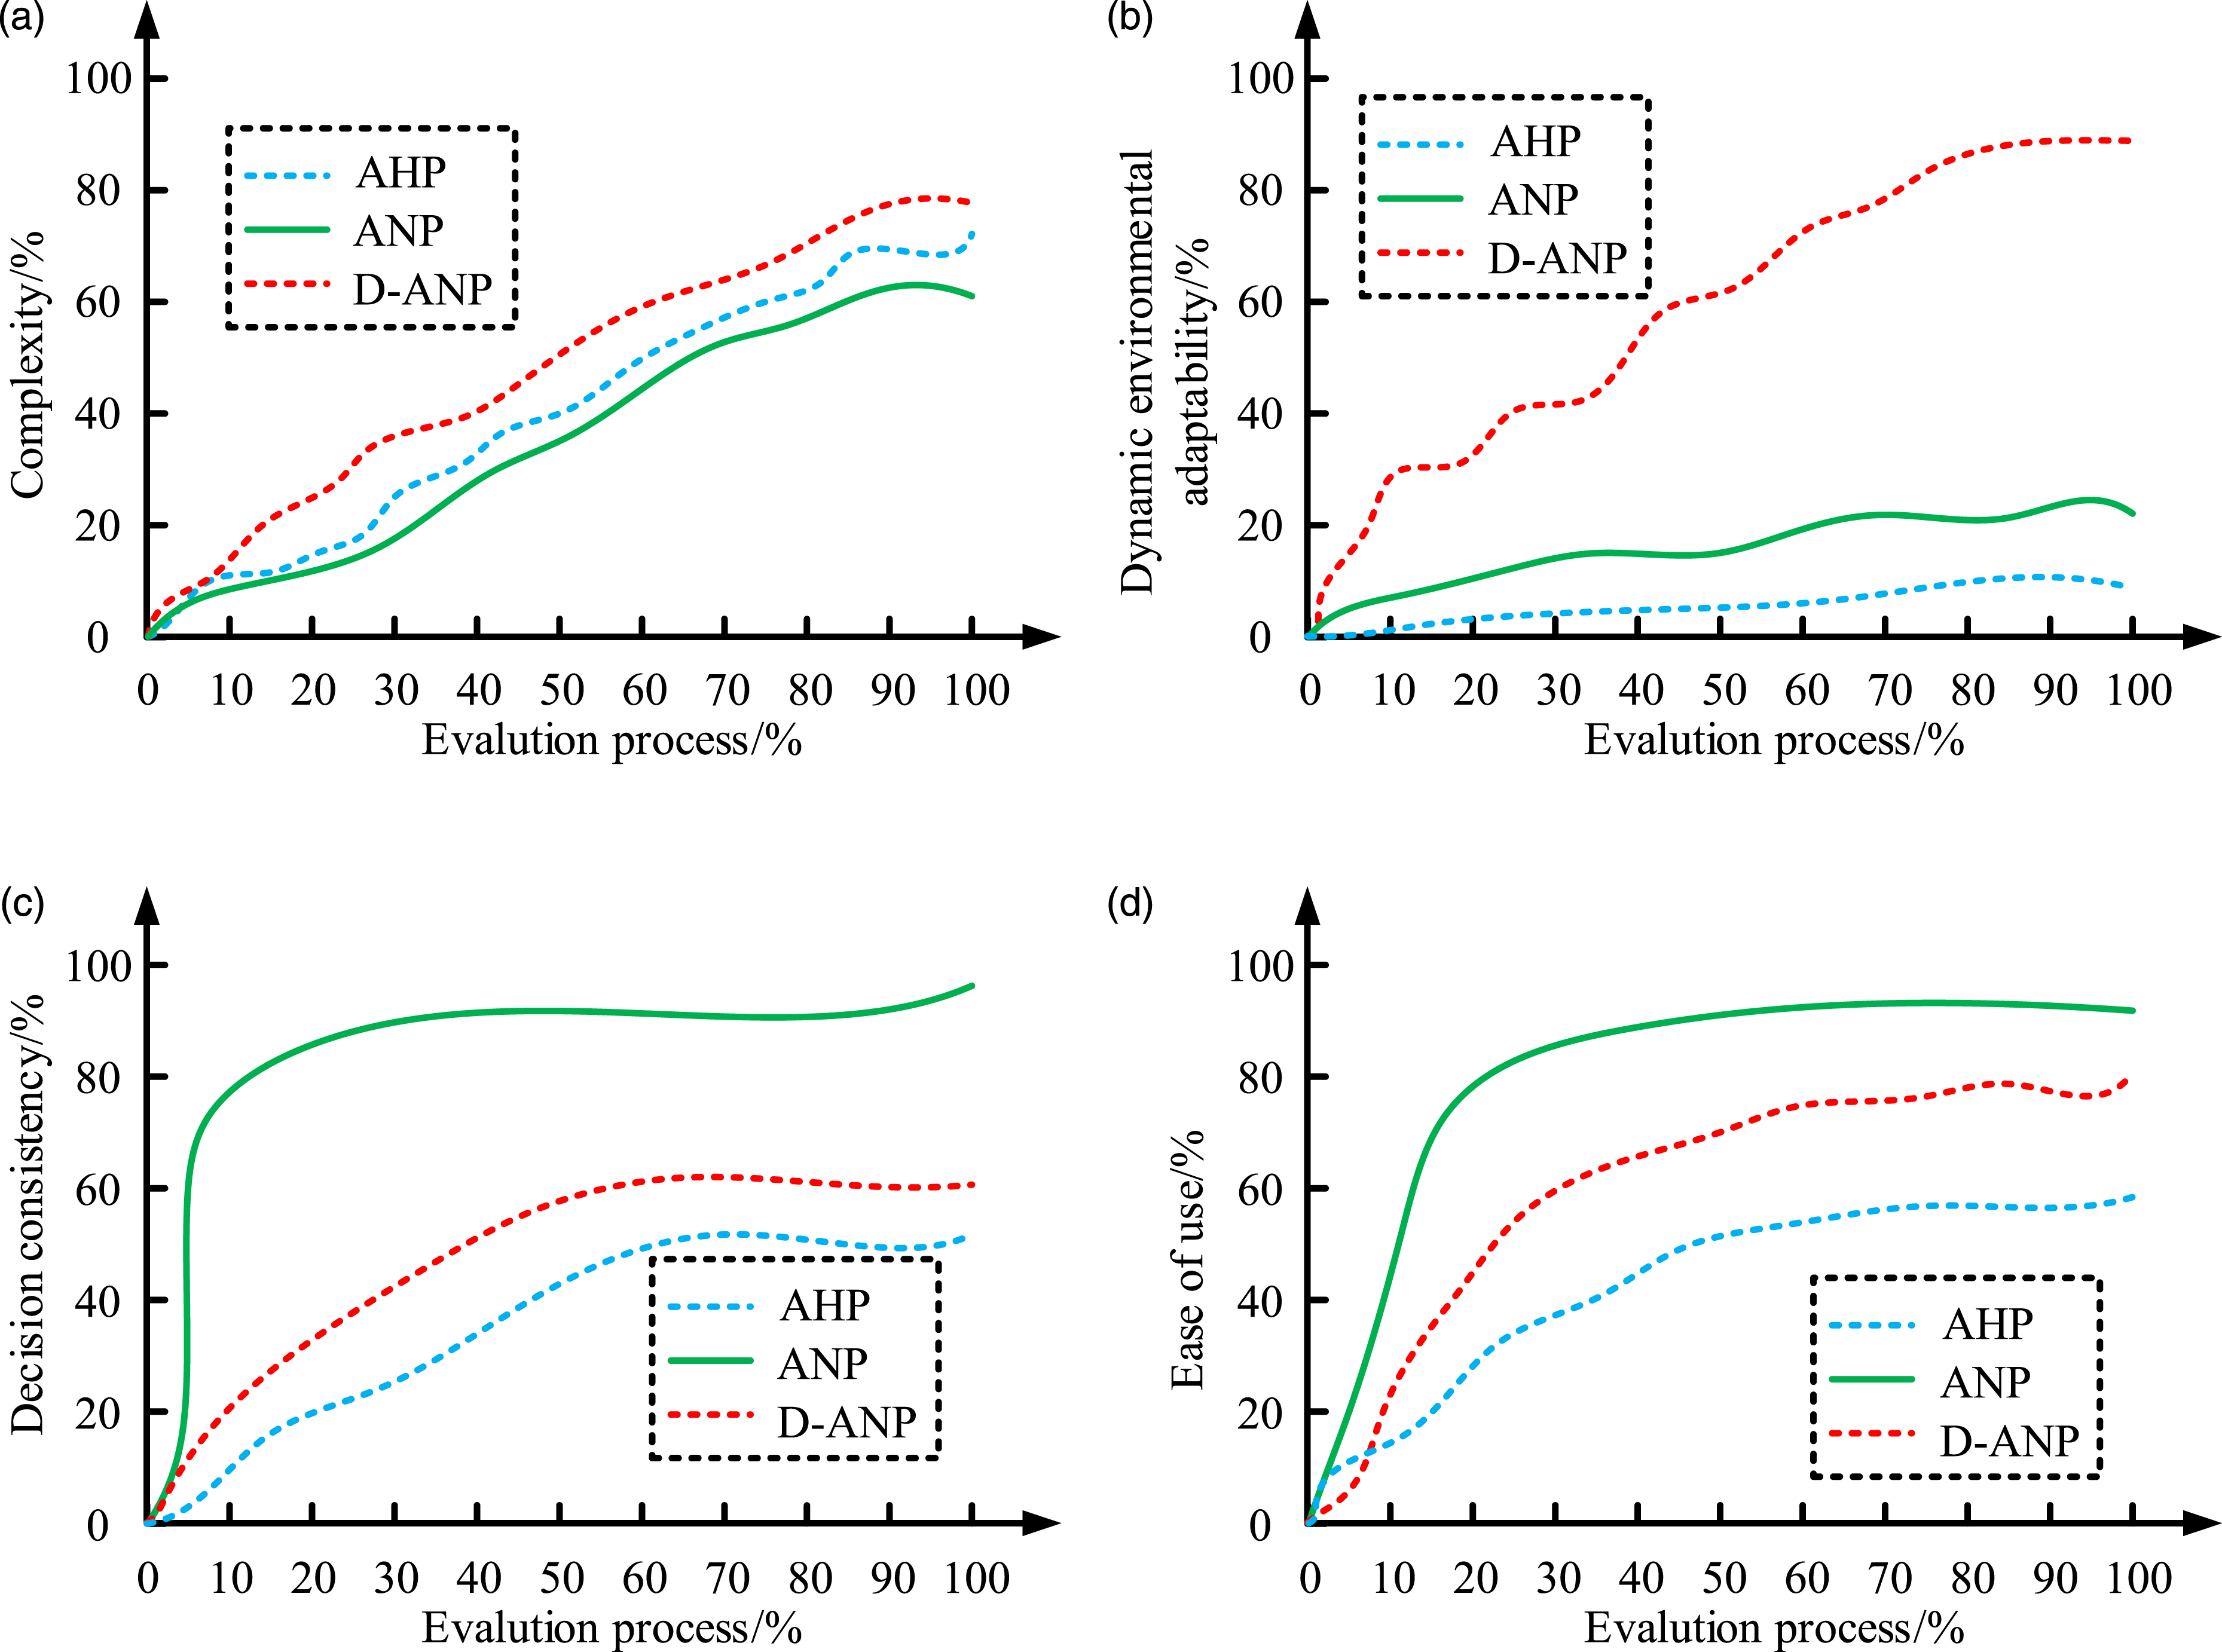
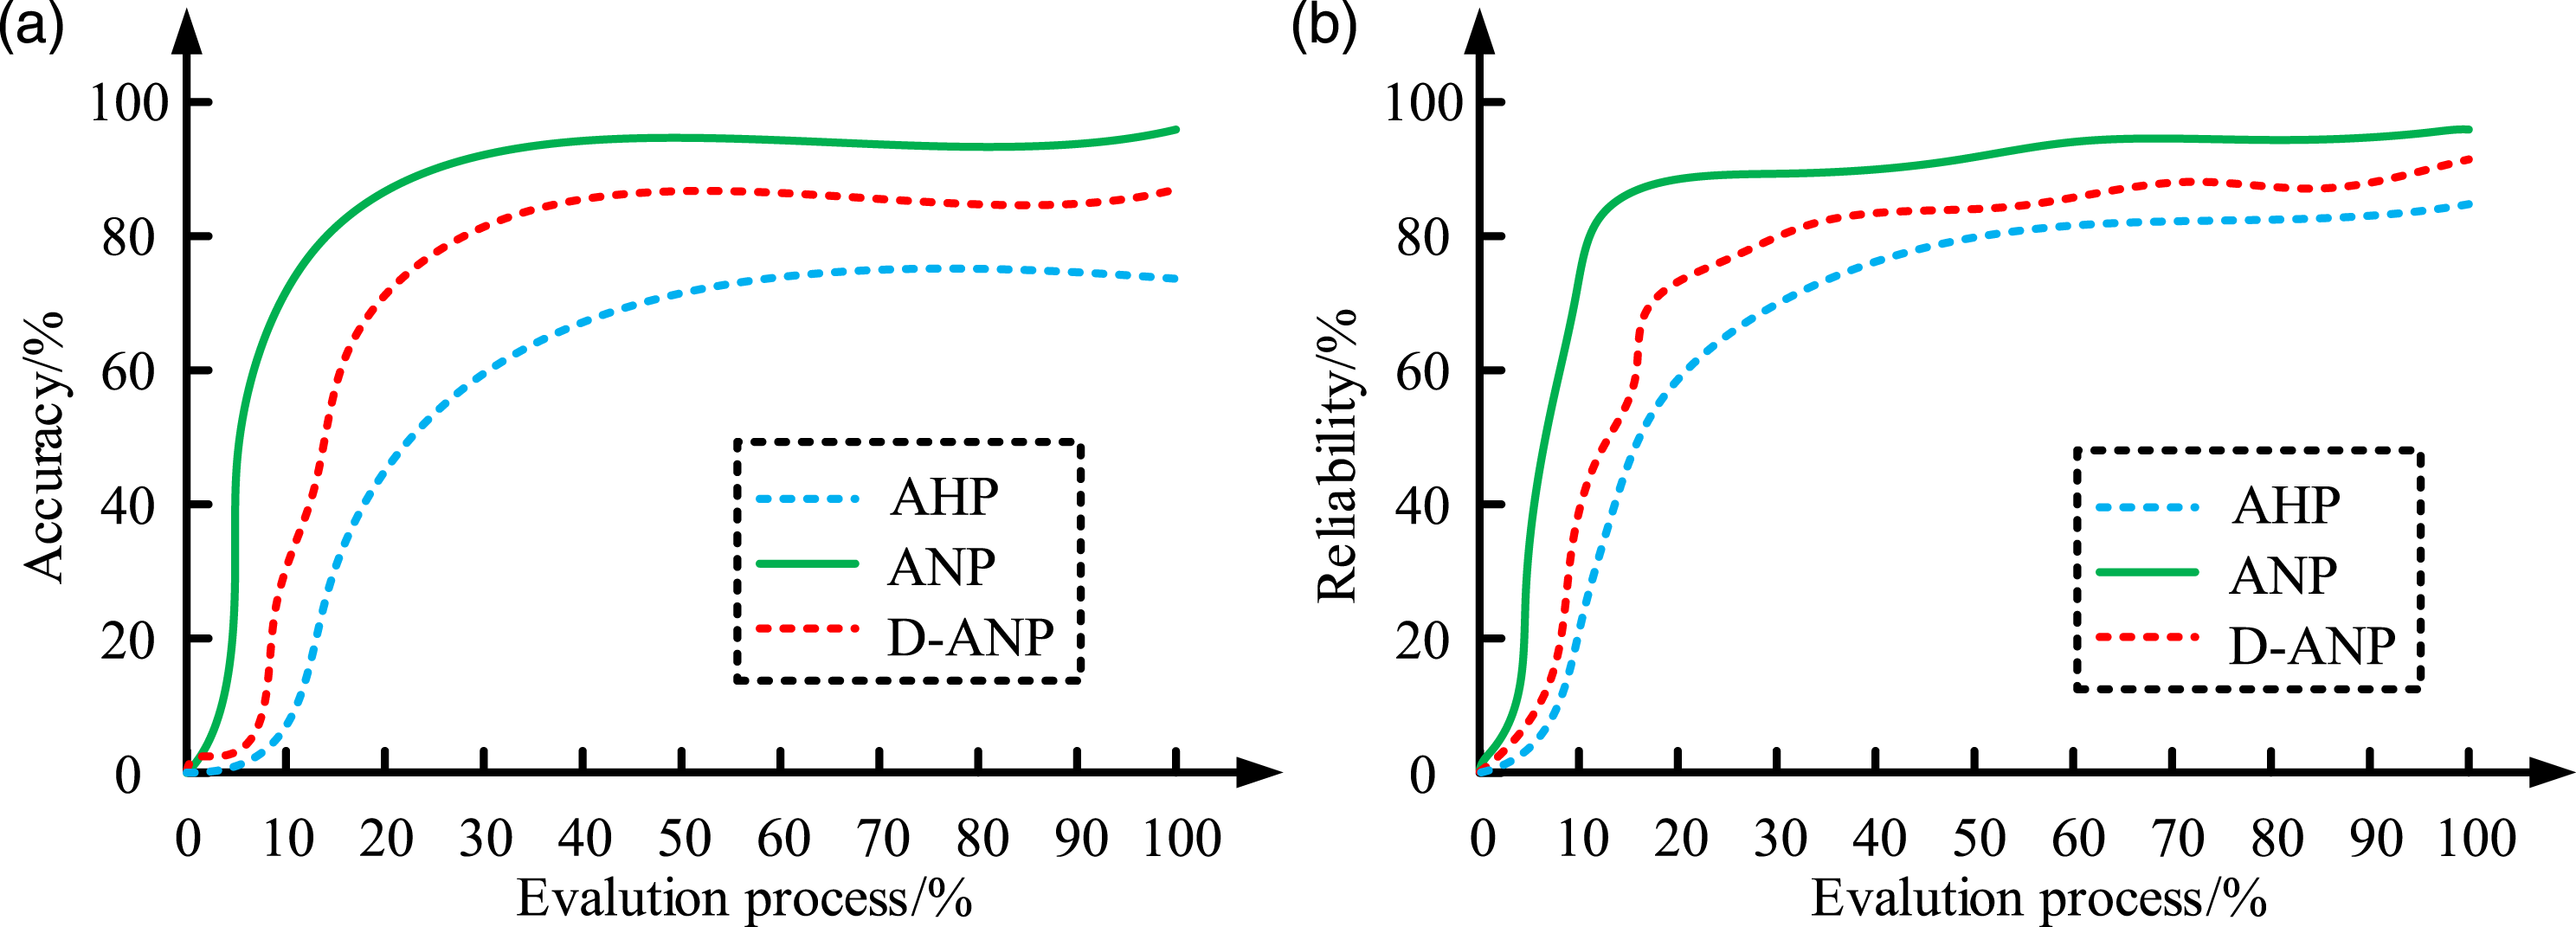
Figure 6(a) and (b) show the evaluation accuracy and evaluation reliability of AHP, ANP, and D-ANP methods, respectively. From Figure 6(a), the evaluation accuracies of ANP, D-ANP, and AHP were 96.3%, 87.6%, and 74.9%, respectively. From Figure 6(b), the evaluation reliability of ANP, D-ANP, and AHP methods were 98.7%, 92.1%, and 84.8%, respectively. Among the three methods, ANP had the highest accuracy and reliability and tended to stabilize faster. This indicated that ANP could obtain high accuracy evaluation results in the long term during the evaluation process, which is conducive to the selection and analysis of results.
Example analysis
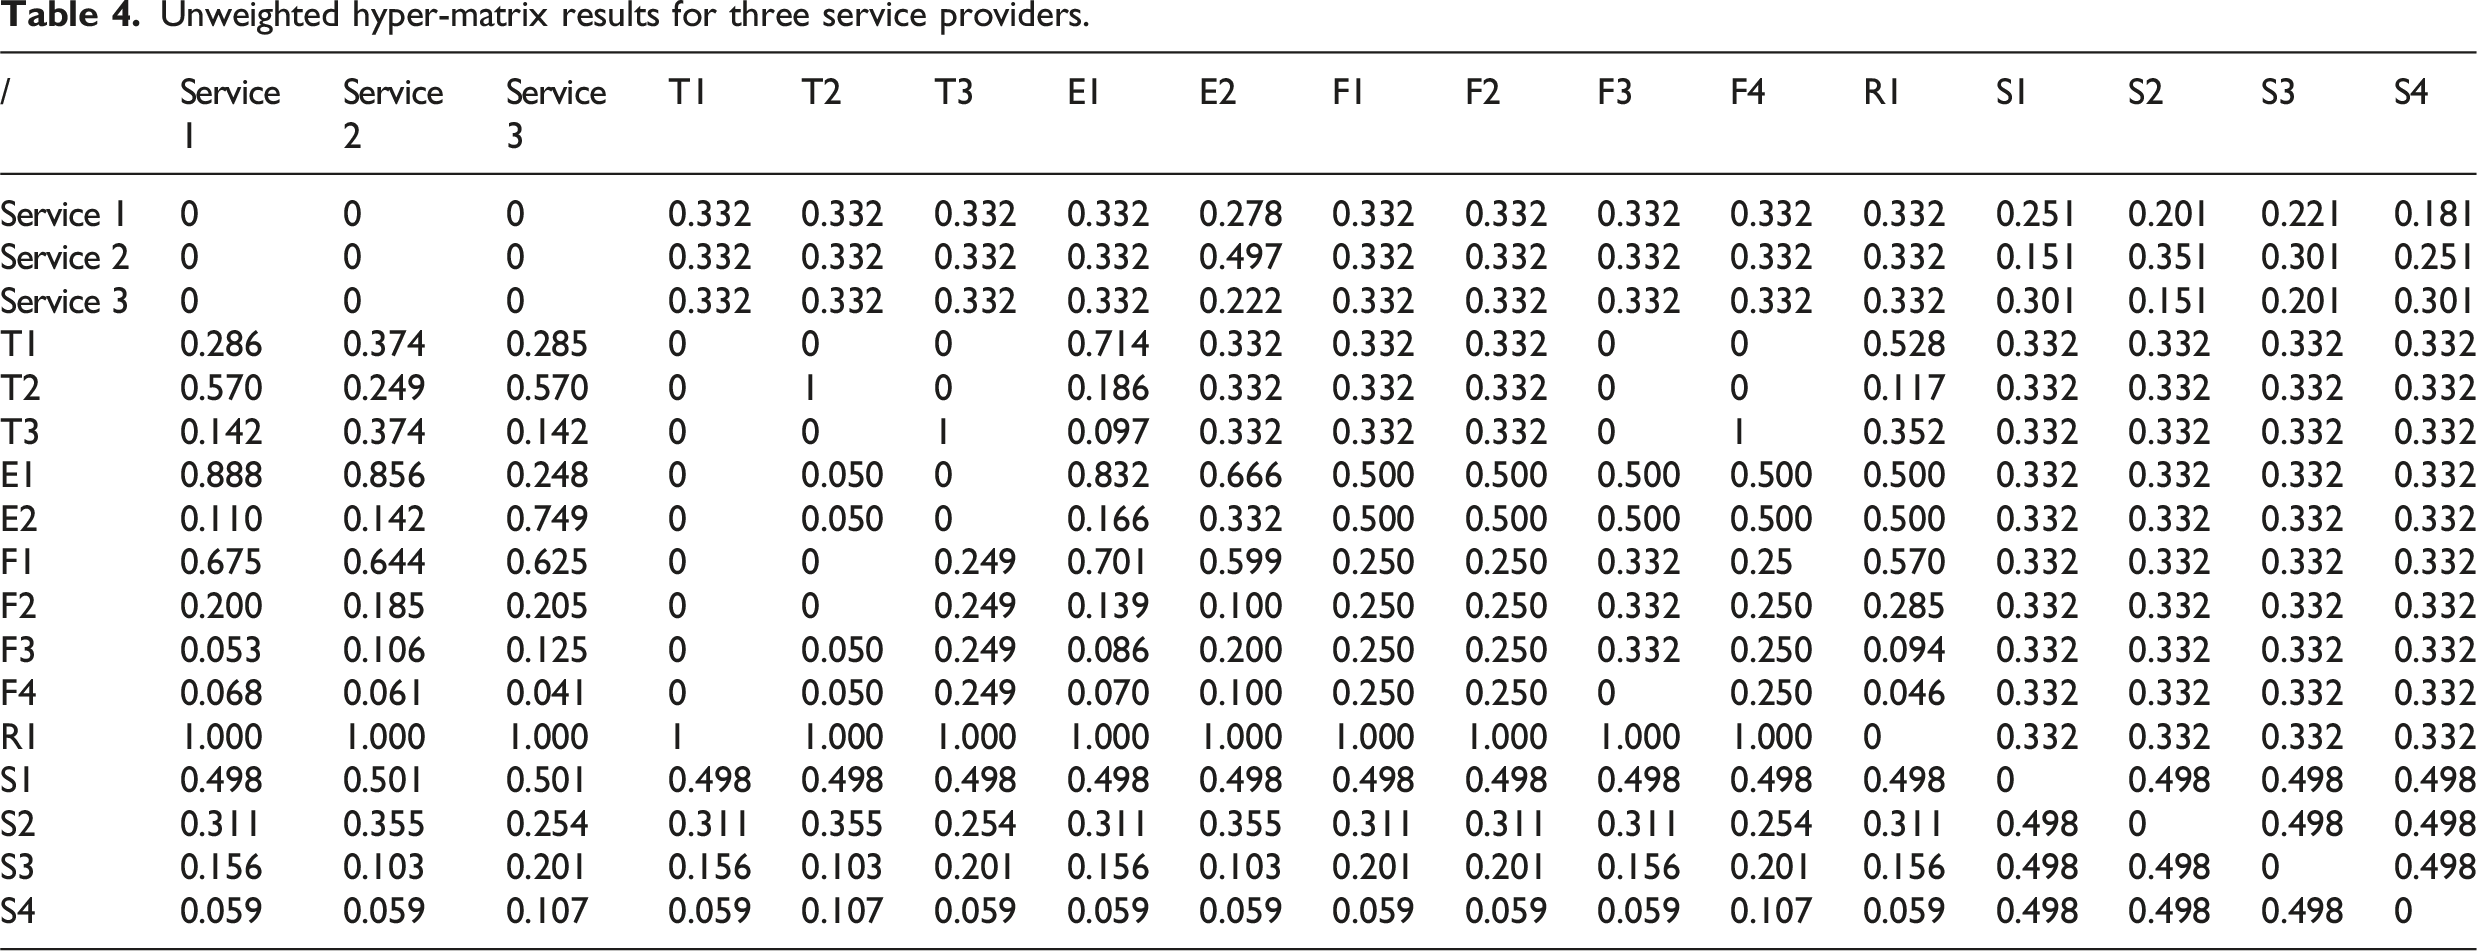
Unweighted hyper-matrix results for three service providers.
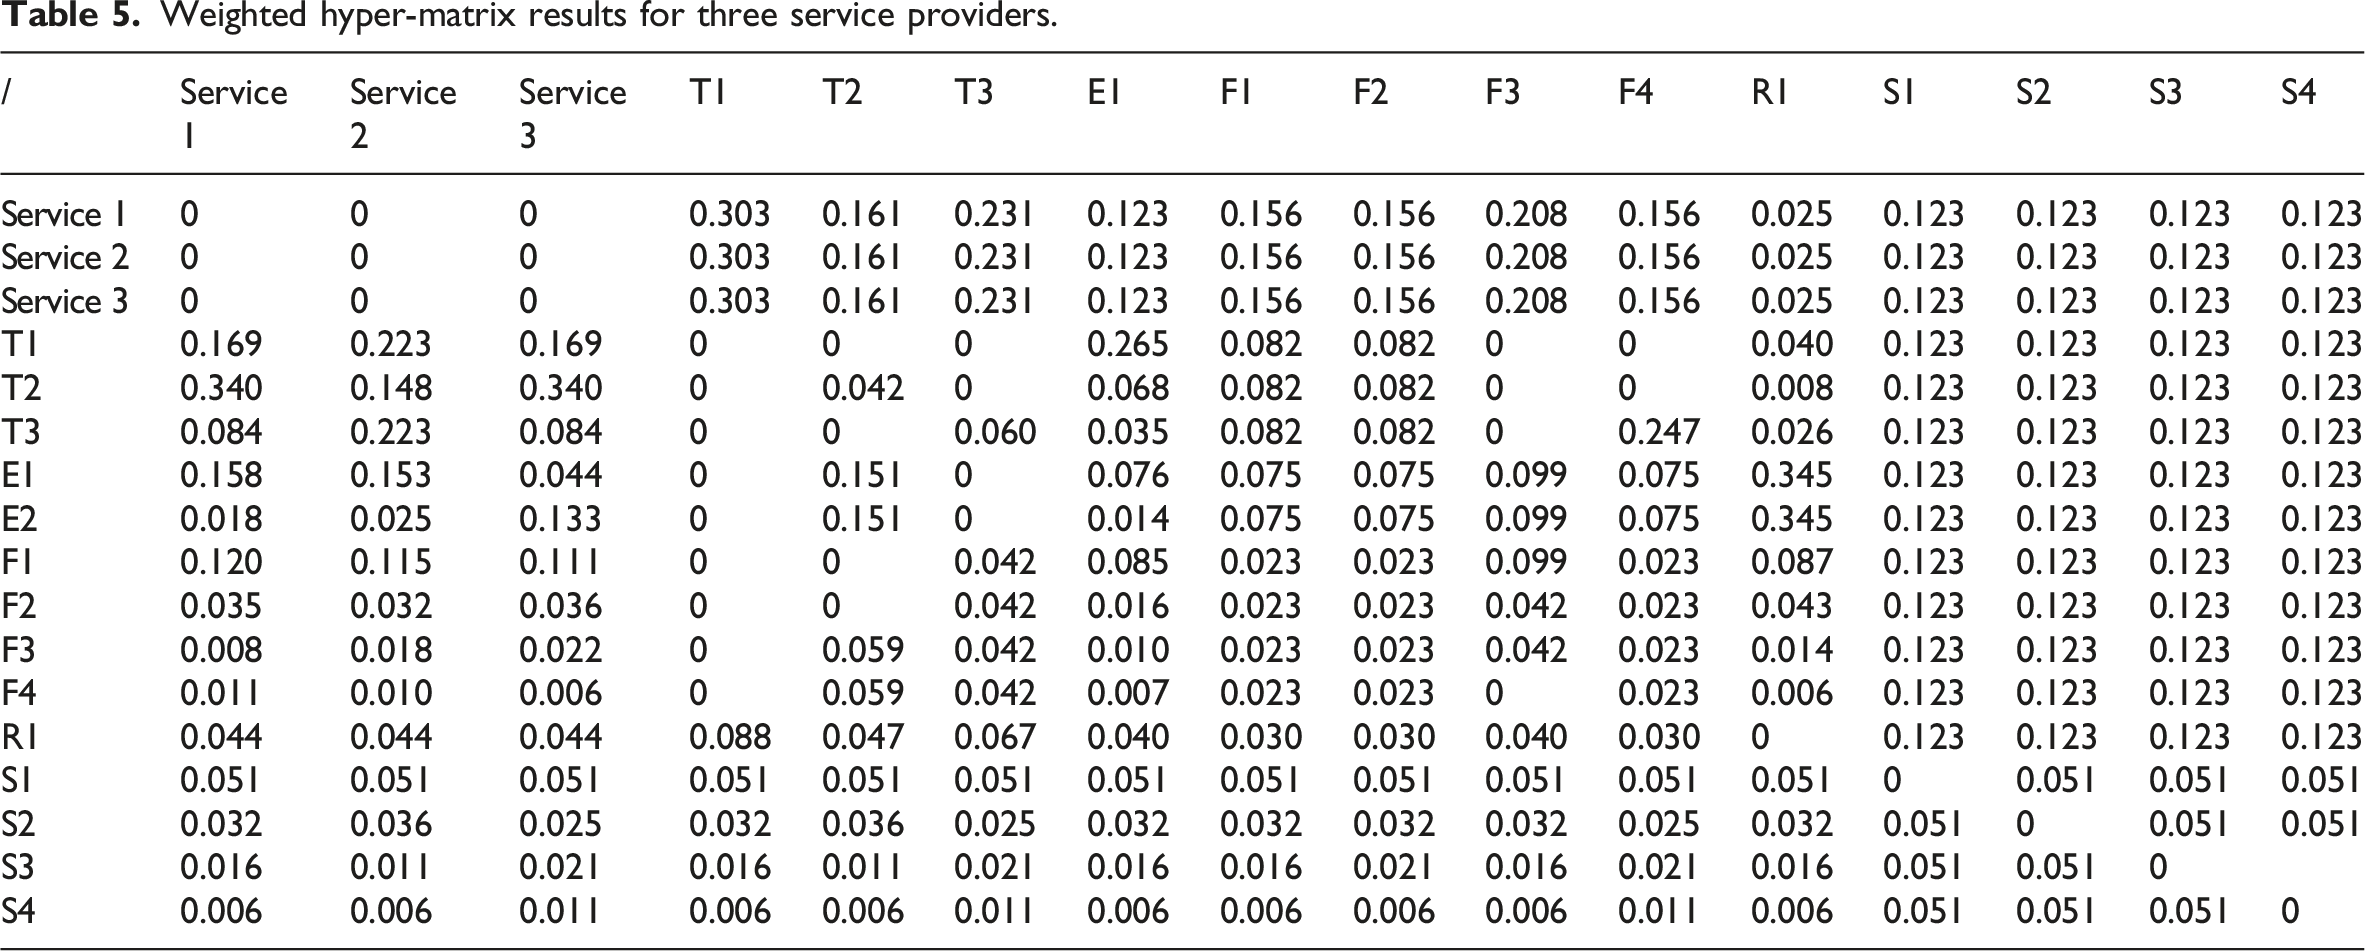
Weighted hyper-matrix results for three service providers.
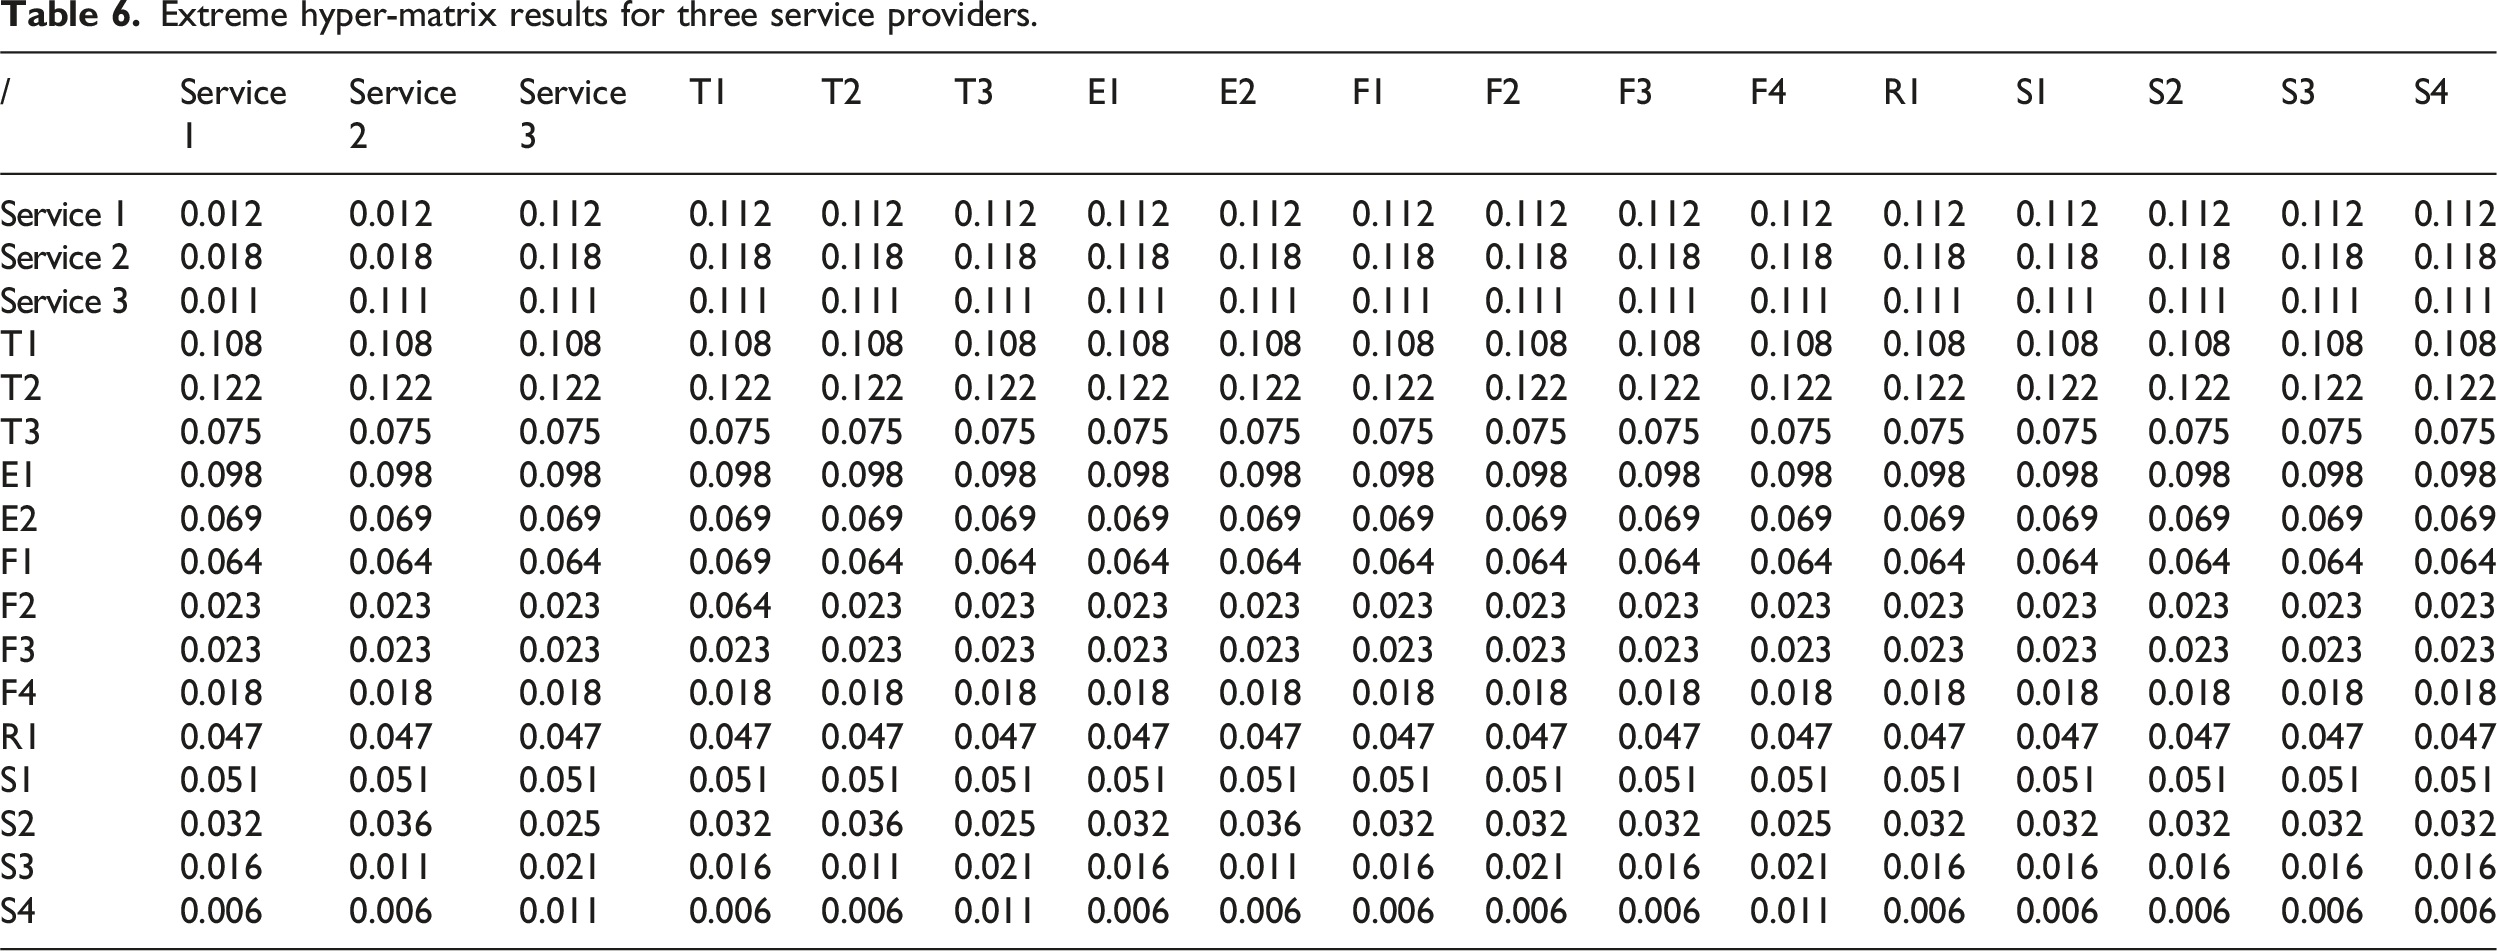
Extreme hyper-matrix results for three service providers.
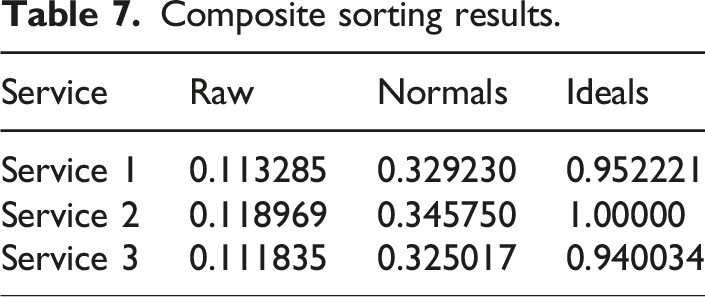
Composite sorting results.
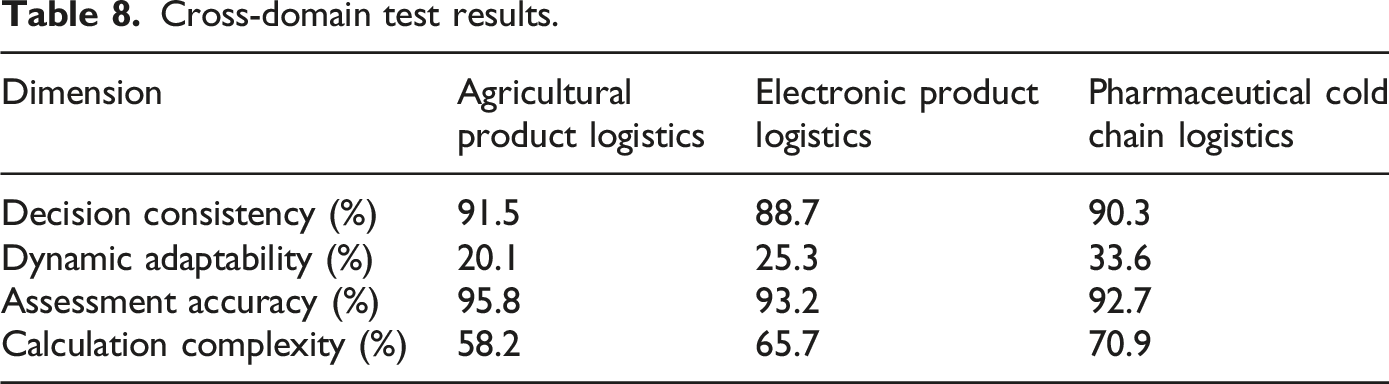
Cross-domain test results.
Summary of key results data.
Discussion
To construct evaluation indicators for TPL distribution services of agricultural products, this study applied the ANP method based on dependency and feedback to evaluate TPL service providers, and verified it using super decision software with examples. The results showed that after completing the evaluation process, the decision consistency and usability of ANP were 92.6% and 93.1%, respectively, significantly higher than other methods. Compared with the method proposed by Vasconcelos TRS et al., 12 the comprehensive performance of the method proposed in this study was significantly better. This is because ANP can quantitatively represent the degree of influence in the form of a super matrix, which can better reflect objective practical problems. The accuracy of ANP evaluation was 96.3%, significantly higher than AHP’s 74.9% and D-ANP’s 87.6%. The reliability of ANP was 98.7%, which was also significantly higher than other methods. Compared with the combination weighting method proposed by Zhang N et al., 13 the evaluation effect was better. This is because using ANP for evaluation relies less on the subjective judgment of decision-makers, and it can accurately capture the interdependence between factors, thereby revealing key elements and helping decision-makers understand the impact of these elements. Meanwhile, the case analysis results showed that the evaluation of agricultural product logistics service providers through ANP could accurately obtain the best selection object, while the weighted gray comprehensive decision-making method proposed by Chen K et al. 25 could only obtain approximate results, further proving the effectiveness of the design method. The reason is that ANP can present the relationships between factors in a graphical way, making complex problems more intuitive and visible. Although the ANP model has shown good performance in evaluating the preferred TPL distribution of agricultural products, the results may potentially be sensitive to expert judgments or model assumptions. Expert judgment plays a crucial role in determining the weights of indicators and conducting pairwise comparisons. Different experts may have different judgments on the relative importance of indicators due to differences in background, experience and professional knowledge. This subjectivity may lead to differences in the output results of the model. Meanwhile, model assumptions can also affect the accuracy and reliability of the results. If the model assumptions do not match the actual situation, it may lead to deviations in the results. To enhance the robustness and reliability of the model, future research can conduct more in-depth sensitivity analyses. In summary, the research method has shown good performance in evaluating TPL service providers and can provide decision support for agricultural product operations.
Conclusion
The objective is to establish an efficient and scientific evaluation index system for TPL distribution of agricultural products. This will facilitate improvements in the efficiency of the entire agricultural supply chain, reductions in logistics costs, and the assurance of product quality. An optimal evaluation index system was constructed in this study for TPL distribution services of agricultural products through the application of network AHP. This enabled the selection of the most suitable logistics service provider. The research results indicated that D-ANP had better complexity and dynamic environmental adaptability than ANP, but its decision consistency and usability were significantly lower than ANP. Overall, ANP had the best performance. When the evaluation process was 100%, the decision consistency of ANP was 92.6%, 33.3%, and 41.7% higher than that of D-ANP and AHP, respectively. The usability of ANP was 12.8% and 36.7% higher than that of D-ANP and AHP, respectively. The evaluation index system for optimal selection of TPL distribution of agricultural products based on network AHP provided detailed decision-making information for logistics company management, which helped identify areas for future improvement. Based on the decision information obtained through the proposed method, agricultural product logistics distributors could more accurately identify defects in their business processes and optimize them. However, although the method designed in this study has a good evaluation effect on TPL service providers, there are still some deficiencies. When applied to a larger set of suppliers or more evaluation criteria, the scalability of the model may have an impact on actual availability. As the number of suppliers or evaluation criteria increases, the computational complexity of the ANP model significantly increases, which may lead to extended processing time and higher hardware requirements, thereby limiting its application feasibility in large-scale data scenarios. Meanwhile, the subjectivity of experts may also lead to differences in the output results of the model. In practical applications, the real-time performance of the data acquisition system also faces challenges. Therefore, in the future, efficient computing algorithms and tools will be introduced to optimize the ANP model to meet the processing requirements of large-scale data. A combination of objective data and subjective judgment is explored to improve the objectivity and accuracy of the model. The model is combined with technologies such as the Internet of Things and big data to achieve real-time assessment of the performance of logistics service providers. Meanwhile, ECharts is adopted to achieve the visualization interaction of the hyper-matrix, and an expert judgment assistance system is built in to further enhance the applicability of the model.
Footnotes
Funding
The author(s) received no financial support for the research, authorship, and/or publication of this article.
Declaration of conflicting interests
The author(s) declared no potential conflicts of interest with respect to the research, authorship, and/or publication of this article.