




Abstract
Whether tourism resources can be scientifically and effectively developed and utilized is directly related to the amount of economic benefits that tourism resources bring to developers, as well as the revenue data of the local tourism industry. Therefore, how to develop tourism resources has become the main issue that countless scenic area developers need to study today. When formulating a tourism resource development plan using traditional methods, it is usually necessary to arrange researchers to evaluate the quantity and quality of the tourism resources owned by the scenic area. This process often takes several months, and after obtaining the evaluation data, it will be submitted to the decision-making level for repeated and unpredictable meetings and discussions. The discussion mainly focuses on the proportion of service investment and specific measures for each resource in the scenic area, and finally a preliminary plan is obtained. In response to the drawbacks of traditional methods such as time-consuming and cumbersome steps, this study attempts to apply genetic algorithms to optimize the development of tourism resources, hoping to provide an intelligent and efficient method for formulating development plans. The process of using genetic algorithms to develop tourism resource development plans is as follows. Firstly, the optimization task was modeled, abstracted into a mathematical representation that the model can understand, and model parameters were set for subsequent iterative tasks; then, the population was randomly initialized to provide a richer gene pool for the entire population, allowing individuals in the population to be distributed throughout the solution space. Next, it is necessary to iterate the population, where individuals within the population undergo selection, crossover, and mutation in each iteration round, while adding randomness to evolve towards higher fitness values. When the iteration round ends, the highest fitness value of individuals in the population can converge, and this individual represents the best solution considered by the model. Five simulation experiments were conducted in this article. The initial population size was 100, 120, 140, 80, and 70, and the number of iteration rounds was 100, 80, 70, 110, and 130. Finally, the highest fitness values of the five experiments all converge to 208.9, and the X of the individual with the highest fitness values converges to [1,1,1,0,0]. Y converges approximately at [0.44, 0.41, 0.15, 0,0], and Z converges at [0.4, 0.3, 0.3]. Finally, this article also compares with examples of rural tourism development to verify the effectiveness and practicality of genetic algorithms in optimizing tourism resources. After calculation, the sample distance between excellent development cases and model generated solutions is 7.512, the sample distance between negative cases and model generated solutions is 31.836, and the sample distance between fuzzy cases and model generated solutions is 16.757. The experimental results demonstrate that the use of genetic algorithms can provide scientific decision support and methodological guidance for the development and utilization of tourism resources.
Keywords
Introduction
The tourism industry, as a huge industry deeply influenced by global economic development, plays an important role in connecting people and regions, culture, and economy. The development and utilization of tourism resources is not only a key factor in economic growth but also an important guarantee for cultural inheritance, ecological protection, and social development.1–3 With the continuous advancement of globalization, the development and utilization of tourism resources are increasingly valued, becoming an important component of economic growth and cultural exchange among countries. In this context, optimizing the development and utilization of tourism resources through scientific methods and effective means has become one of the important issues in the development of the tourism industry today.4,5
The traditional development and utilization model of tourism resources often relies on experience and rules, lacking systematicity and scientificity. This can lead to many problems such as low resource utilization efficiency and low quality of tourism experience, limiting the development and benefits of the tourism industry. Therefore, it is imperative to seek a new method that can optimize resource allocation and improve utilization efficiency. Genetic algorithm, 6 as an optimization algorithm that simulates natural selection and genetic mechanisms, has unique advantages in solving complex combinatorial optimization problems7,8 and can effectively solve various difficulties in optimizing the allocation of tourism resources. This algorithm simulates natural selection 9 and genetic mechanisms 10 to search for potential solutions in the solution space, and continuously optimizes individual gene combinations through fitness evaluation and genetic operations to find the optimal or approximate optimal solution. Therefore, genetic algorithms can be applied to optimize the allocation of tourism resources. This is expected to effectively improve resource utilization efficiency and optimize the design and promotion of tourism products, thereby promoting the healthy development of the tourism industry and the prosperity of the regional economy. In addition to genetic algorithms, there are other types of optimization algorithms that can be used to find the optimal solution for tourism resource development plans, such as linear regression methods or neural network methods. However, compared with them, genetic algorithms can find global or near optimal solutions in the search space, and are less prone to getting stuck in local optimal solutions. Moreover, genetic algorithms are easy to parallelize and can accelerate the optimization process by processing multiple individuals simultaneously. With sufficient computing resources, they can effectively improve search efficiency. Therefore, genetic algorithms are chosen for this study. Among various forms of tourism, rural tourism has gradually become a popular choice among tourists due to its unique cultural charm, natural landscape, and leisure experience. Therefore, this article can mainly take rural tourism11,12 as an example to explore the optimization application of genetic algorithms in the development and utilization of tourism resources.
This article can explore the application of genetic algorithms in the development and utilization of tourism resources from the perspective of combining theory and practice. The content of this article can mainly include the following aspects. Firstly, a detailed analysis can be conducted on the main practices of traditional tourism resource development methods, as well as their corresponding drawbacks and shortcomings. After clarifying the pain points in the industry, it introduces the implementation principle of genetic algorithm and analyzes the advantages brought by genetic algorithm in tourism resource development. Subsequently, by constructing a reasonable optimization model, based on mathematical modeling and algorithm design, the optimal allocation of tourism resources is achieved. It can be proven through data that genetic algorithms have the utility of improving resource utilization efficiency and promoting sustainable development of the tourism industry. The specific approach is to first model the optimization task, abstract it into a mathematical representation for the model to understand, and set the model parameters. Secondly, the population is randomly initialized to cover as many genes as possible in the solution space, including the genes of the optimal solution; next, it is necessary to iterate the population. Individuals within the population must undergo selection, crossover, and mutation in each iteration round. The selection operation is to eliminate genes associated with low fitness values in the population. The main purpose of crossover and mutation operations is to introduce diversity into the population to avoid the algorithm falling into local optima. When the iteration round ends, the highest fitness value of individuals in the population can converge, and this individual represents the best solution considered by the model. In order to verify the degree of conformity between the proposed method and the actual situation, this article also crawled 134 examples of rural tourism attraction development and compared and analyzed the two. The obtained results indicate that the genetic algorithm scheme is more closely related to successful scenic spot opening schemes in reality, which proves that this method can effectively help scenic spot developers make scientific decisions on tourism resource development and utilization.
Related work
Currently, numerous researchers have conducted research and analysis on the development methods of tourism resources in different regions. Zhu Huifang et al. 13 explored the correlation between rural digitization and high-quality development of rural tourism in Guizhou. Pencarelli T. 14 also analyzed the impact of industrial digitization on the tourism industry. These two studies mainly focus on analyzing the driving role of advanced digital industries in the local tourism industry and provide detailed suggestions on how to improve tourism attractiveness from the direction of building digital industries. Dai Chao et al. 15 studied the development prospects brought about by the combination of leisure sports and tourism in Sichuan from the perspective of rural revitalization. In this study, the author identified the current development issues in the fields of leisure sports and sports tourism, and provided suggestions for the integrated development path of leisure sports and tourism industries. Ercan F et al. 16 studied the application of immersive reality technology in the tourism industry and proposed using virtual reality technology to improve tourists’ travel experience and the richness of tourist attractions. Cai Jialing et al. 17 proposed methods for promoting Guangxi’s red tourism scenic spots from the perspective of communication strategies. Xia Yuanli et al. 18 conducted a study on the integration and development of intangible heritage culture and rural tourism. Both approach from a humanistic perspective, attracting tourists and expanding the revenue of scenic spots by creating a cultural atmosphere.
The above studies analyzed the integration points with the development and utilization of rural tourism industry from the perspectives of front-end industry development, cultural shaping, and media dissemination and proposed optimization plans, which are much more detailed than the broad development direction obtained by genetic algorithm in this article. However, these plans still only consider individual factors and fail to achieve analysis from point to surface and from parts to the whole. This article hopes to achieve a more coordinated strategic layout while considering different open methods comprehensively.
Tourism development methods
According to the statistics of the Ministry of Culture and Tourism, during the May Day holiday in 2024, a total of 295 million tourists visited China, with a total consumption of 166.89 billion yuan. Among them, rural tourism received 172 million visitors, accounting for 58% of the total number of visitors, with a revenue of 51.817 billion yuan, accounting for 31% of the total revenue. Figure 1 shows the statistical situation of the total number of tourists and consumption in China from 2016 to 2023. Driven by economic development, the number of tourists and consumption data have been increasing year by year from 2016 to 2019. From 2020 to 2022, China’s tourism industry was greatly affected by the epidemic, with a significant decrease in business data.
19
However, with the opening of epidemic prevention policies, the tourism industry in various provinces gradually rebounded in 2023.
20
Changes in the number of tourists and total consumption in China.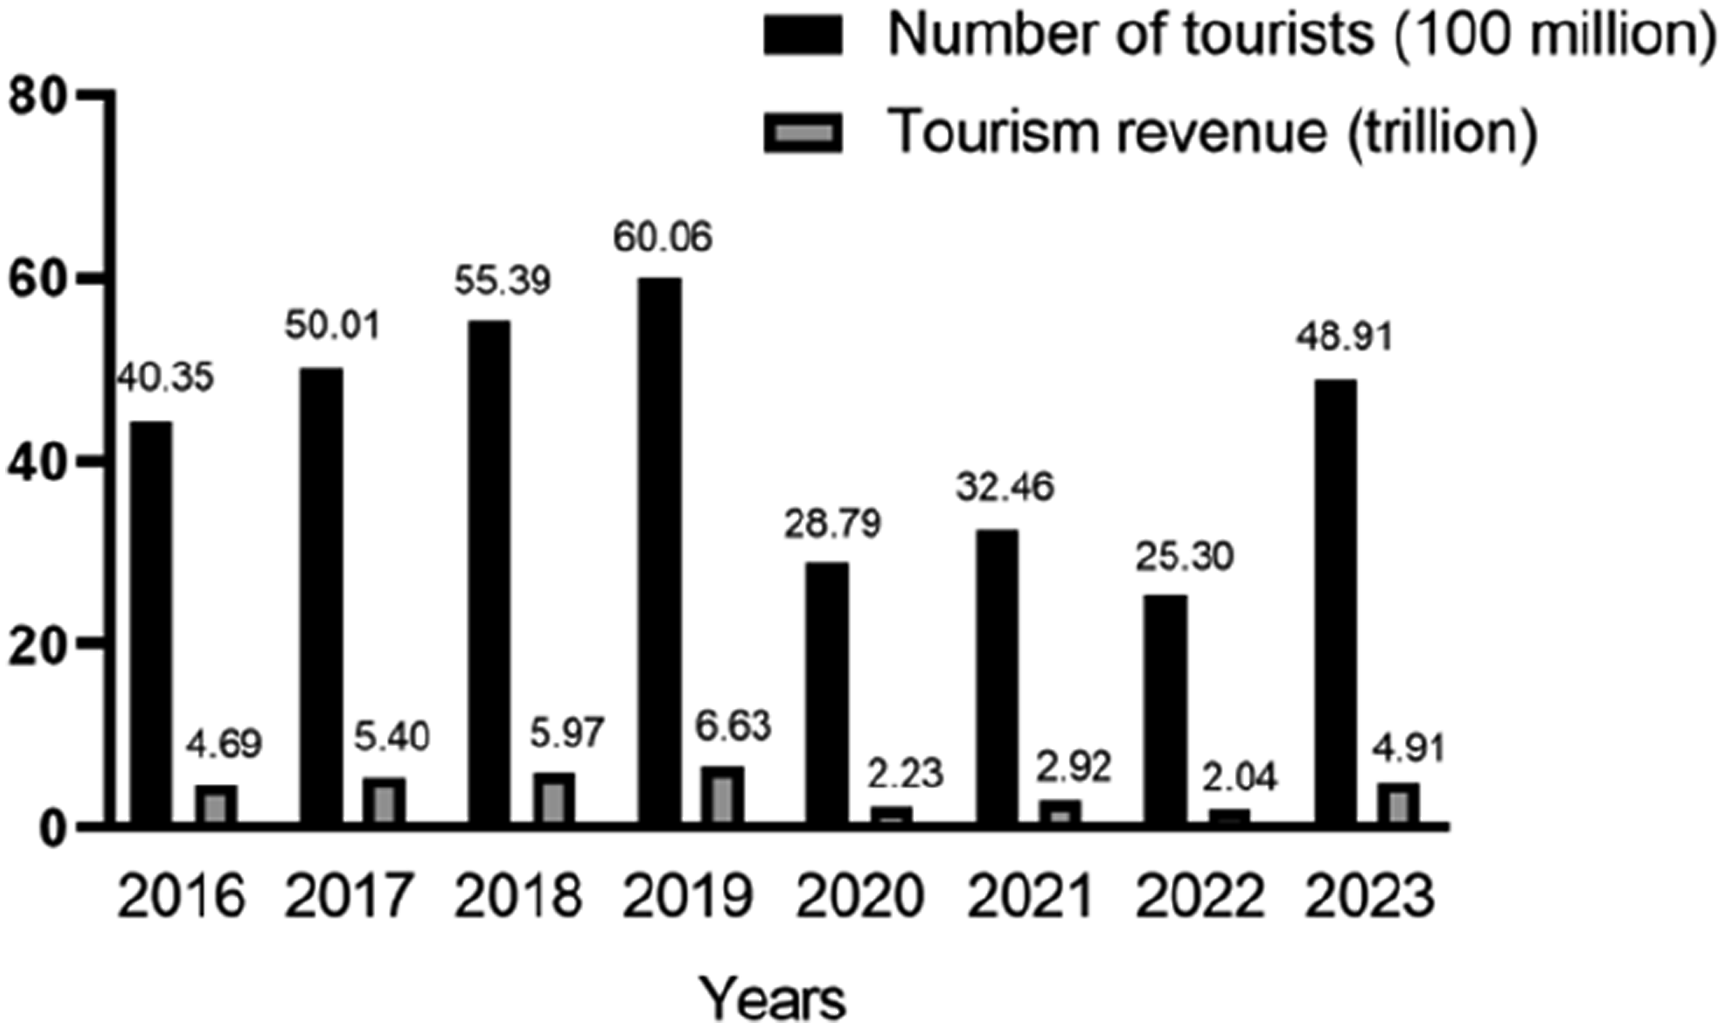
In the past decade, common methods for developing tourist attractions in various parts of China include but are not limited to infrastructure construction,
21
which improves local roads, transportation, accommodation, and catering conditions, and builds supporting facilities such as tourist reception centers, parking lots, and tourist signs; scenic spot development, which involves developing natural landscapes such as mountains, rivers, and forests,
22
or creating cultural landscapes such as ancient villages, traditional dwellings, and cultural sites.
23
Cultural shaping refers to promoting local folk activities, traditional handicrafts, local cuisine, organizing festival activities, folk performances, etc., to enhance the cultural experience of tourists; ecotourism
24
refers to the development of agricultural tourism such as agricultural experiences and fruit and vegetable picking, as well as leisure and vacation tourism such as farmhouses and rural homestays. Tourism publicity
25
refers to the promotion of popularity through traditional media such as TV, newspapers, magazines, and emerging online media such as TikTok, Kwai, and Little Red Book, as shown in Figure 2. Main development directions of tourist attractions.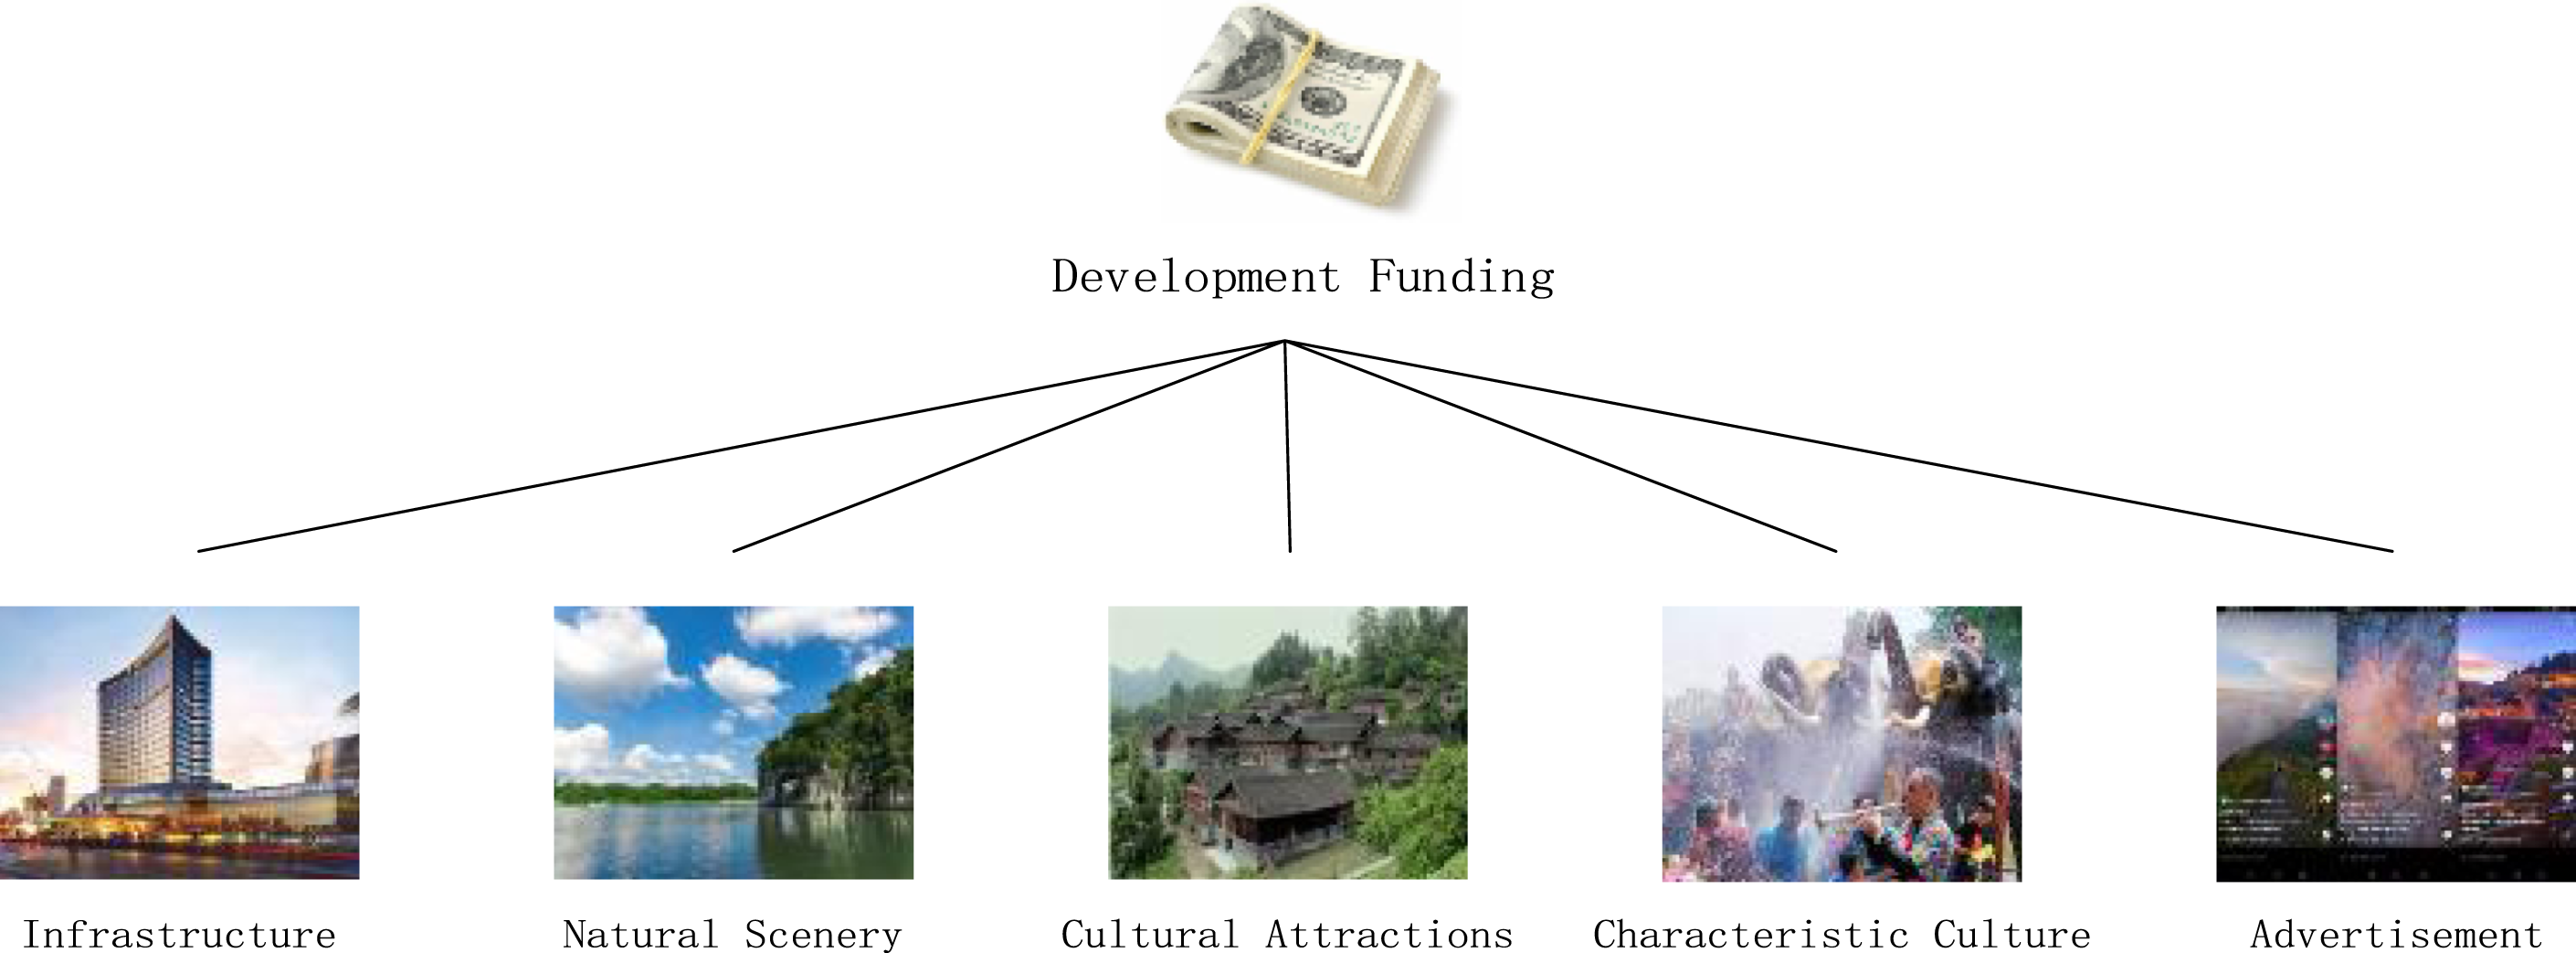
When developing tourism resources in a region, it is usually not limited to one method but a combination of multiple methods. In different development methods, decision-makers generally allocate funds based on the quality of tourism resources owned by the scenic area. However, one of the main pain points currently faced by regional tourism development work is that due to the limitations of corresponding development funds, it is impossible to develop every aspect of local tourism points in an unplanned manner. It is necessary to combine the quality of existing tourism resources in the local area for reasonable and scientific resource allocation. Investing more funds in high-quality tourism resources in the region can better leverage the local tourism advantages, but reducing the allocation of funds to low-quality tourism resources may also lead to the impact of the barrel effect on scenic spots. The tourism strategy related to resource allocation relies on the experience and intuition of decision-makers, and may not be scientific in many cases, lacking systematic and forward-looking planning. At this point, algorithm tools can be considered to help solve the problem.
Principles of genetic algorithm
Genetic algorithm (GA) is a computational model that simulates the natural selection process in biological evolution theory and the biological evolution process in genetic mechanisms. It is an optimal solution optimization algorithm.
26
This algorithm first generates an initial population by encoding the solution space of the problem to be optimized using chromosomes. The initial population contains several individuals, each representing a solution to the problem. After generating the initial population, the algorithm can evaluate the fitness of each individual in the population one by one, retaining those individuals with high fitness (good performance in problem solving) to form a new population and eliminating the old population. Individuals in the new population may produce individuals with higher fitness after crossover and mutation operations. Next, the previous step can be repeated, and after multiple iterations, the optimal solution for this problem can be generated. The main process is shown in Figure 3. Genetic algorithm process.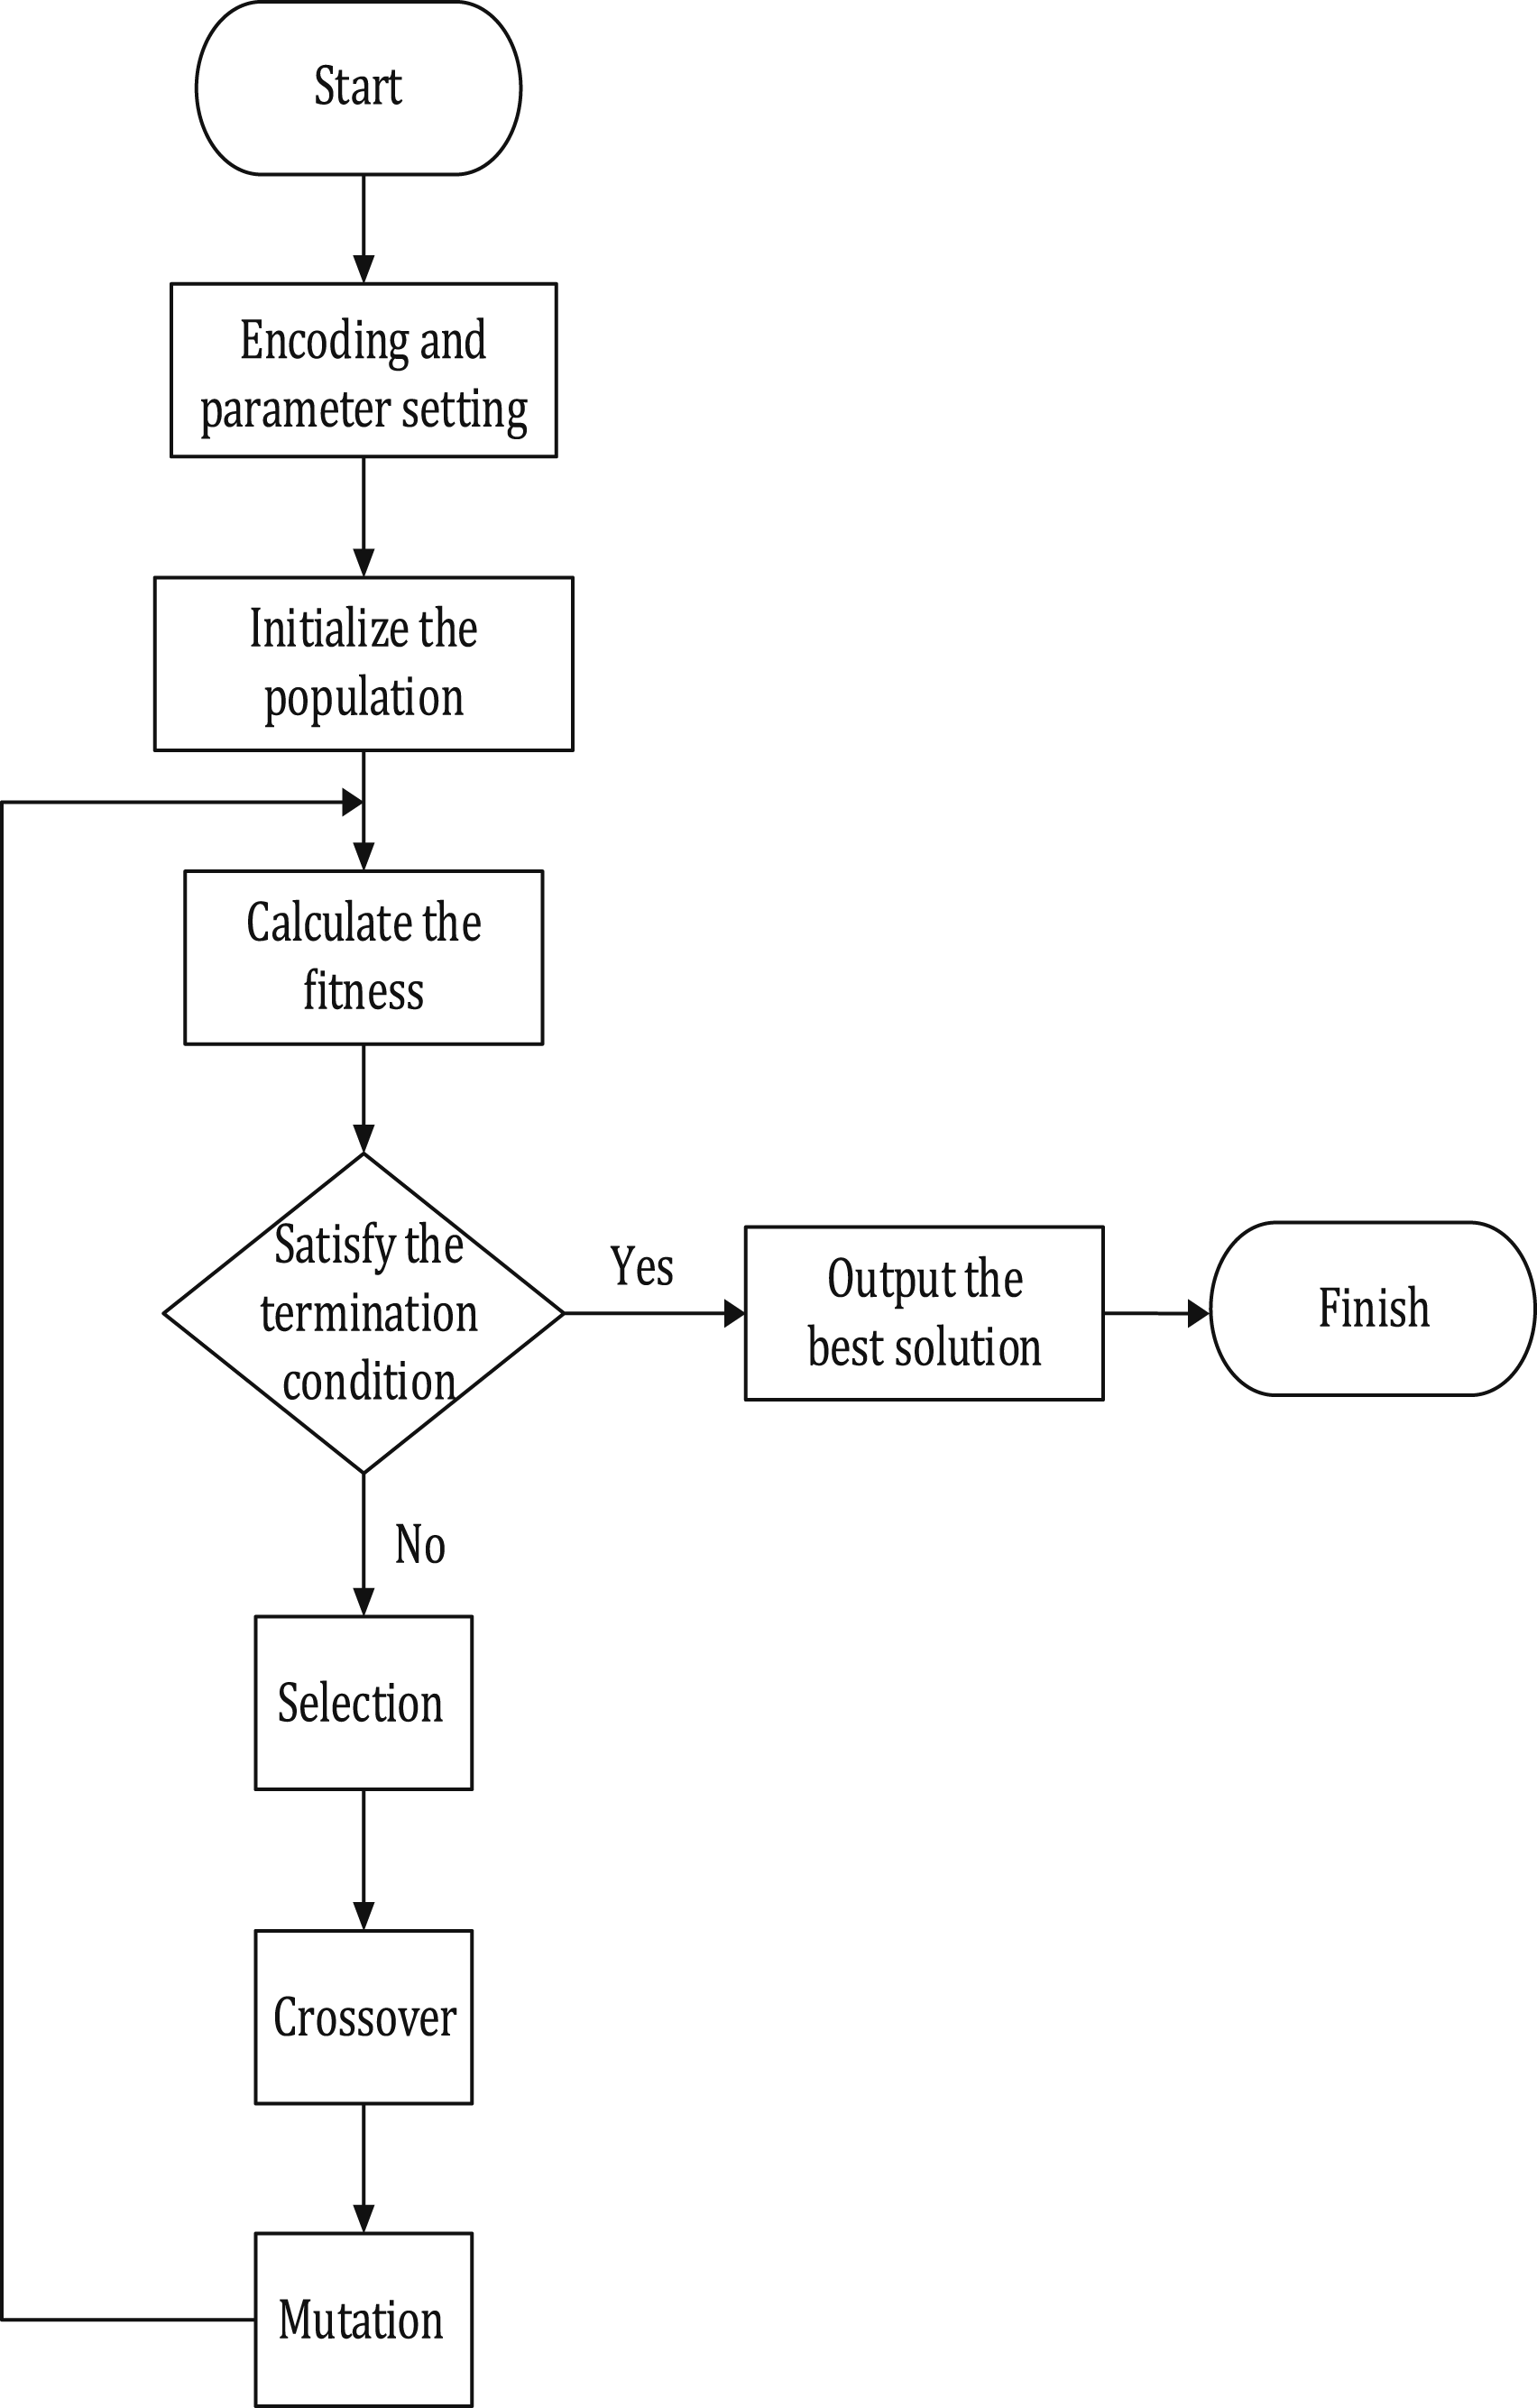
Compared with other optimizations, the main characteristics of genetic algorithms 27 are as follows: adopting probabilistic optimization methods can automatically obtain and guide the optimized search space without the need for certain rules, and adaptively adjust the search direction; it can directly operate on structural objects without the constraints of differentiation and function continuity; it has inherent implicit parallelism and better global optimization ability.
Digital coding
Encoding is the primary problem to be solved when applying genetic algorithms, and it is also a crucial step in designing genetic algorithms. The encoding method affects the operational methods of genetic operators such as crossover and mutation operators and largely determines the efficiency of genetic evolution. So far, there have been many different encoding methods, which can be generally divided into three categories: binary encoding, floating-point encoding, and symbol encoding.
In binary coding, one digit can represent information for two states, while an n-bit binary code string can represent information for 2n states. The binary encoding method has the following advantages: simple and easy encoding and decoding operations; genetic operations such as crossover and mutation are easy to implement; complies with the minimum character set encoding principle. But there are also its drawbacks, such as when the solution approaches the optimal solution, the large variation in phenotype after mutation may make it difficult for the model to converge to the optimal solution.
Floating point coding refers to the representation of each gene value of an individual using a floating-point number within a certain range. In floating-point coding methods, it is necessary to ensure that gene values are within the given range of interval limitations. The genetic operators used in genetic algorithms, such as crossover and mutation, must also ensure that the gene values of the new individuals generated by their operation results are within this range of limitations. The advantages of floating-point encoding include the following: it is suitable for representing numbers with a large range and high accuracy in genetic algorithms; easy to handle complex decision variable constraints; convenient for genetic search in larger spaces.
Symbolic coding refers to the collection of gene values in an individual’s chromosome coding string taken from a set of symbols with no numerical meaning but only code meaning. The advantages of this encoding method are as follows: facilitate the mixed use between genetic algorithms and related approximation algorithms; facilitate the use of specialized knowledge in genetic algorithms to solve problems; complies with the principle of meaningful block encoding.
The model established in this article selects three decision variables: development direction X, direction resource proportion Y, and total resource proportion Z. Binary encoding is used for X, and floating-point encoding is used for Y and Z. The development direction X includes 5 dimensions, including infrastructure, cultural landscape, natural scenery, cultural festivals, and local specialties. The proportion of directional resources Y is also divided into 5 dimensions. They correspond to the proportion of development resources occupied by each direction in X. The proportion of total resources Z is divided into three dimensions, which are the proportion of construction investment, publicity investment, and human resources investment in the total funds. After binary encoding, X takes the form of a 5-dimensional vector, with 0 or 1 indicating whether to develop in that direction. Y and Z are encoded with floating-point numbers to form a 5-dimensional and 3-dimensional vector, respectively. Floating-point numbers between 0 and 1 are used to represent the corresponding proportion of investment funds. X cannot be all zeros. When a certain bit in X is 0, the corresponding element in Y is also 0. All elements within Y and Z should have a sum of 1. Each individual is represented by three decision variables: X, Y, and Z.
Evaluation of fitness and elimination
The fitness function, also known as the evaluation function, is a standard used to distinguish between good and bad individuals in a group based on the objective function. For example, in the rural tourism resource development problem studied in this article, tourist satisfaction S, attraction development cost C, and attraction total revenue M can be set as the objective functions, and the fitness function is positively correlated with S and M, and negatively correlated with C. The fitness function is always non-negative, while the objective function may have both positive and negative values, so it is necessary to transform between the objective function and the fitness function.
The general process of evaluating individual fitness is as follows: first, the individual’s encoding string can be decoded to obtain the individual’s phenotype; then, the objective function value of the corresponding individual can be calculated based on their phenotype; finally, based on the type of optimization problem, the fitness of the individual is calculated using a certain transformation rule from the objective function value.
In order to simulate the process of natural selection as much as possible, selecting individuals for retention and elimination is not simply retaining the group of individuals with the highest fitness but eliminating other individuals. It can be considered that some low fitness individuals may still harbor genes that are beneficial to the environment, and some high fitness individuals may still harbor genes that are unfavorable to the environment. It should incorporate a certain degree of randomness, so that high fitness individuals and low fitness individuals only have higher and lower retention probabilities. For this reason, some selection operators are used. The commonly used selection operators are roulette selection (the probability of each individual entering the next generation is equal to the ratio of its fitness value to the sum of the individual fitness value in the entire population), random competitive selection (a pair of individuals can be selected according to the roulette wheel each time, and then let the two individuals compete, the one with high fitness is selected, and so on until the selection is full), and the best reserved selection (on the basis of roulette selection, the structure of the individual with the highest fitness in the current group is completely copied to the next generation of the group).
The model established in this article adopts the roulette wheel selection method for individual preservation, so here the article takes roulette wheel selection as an example. Assuming that the number of individuals in the population is N and the fitness of each individual i is Fitnessi, the probability of each individual being retained to the next generation Pi is shown in formula (1) and Figure 4. Roulette selection selects individuals.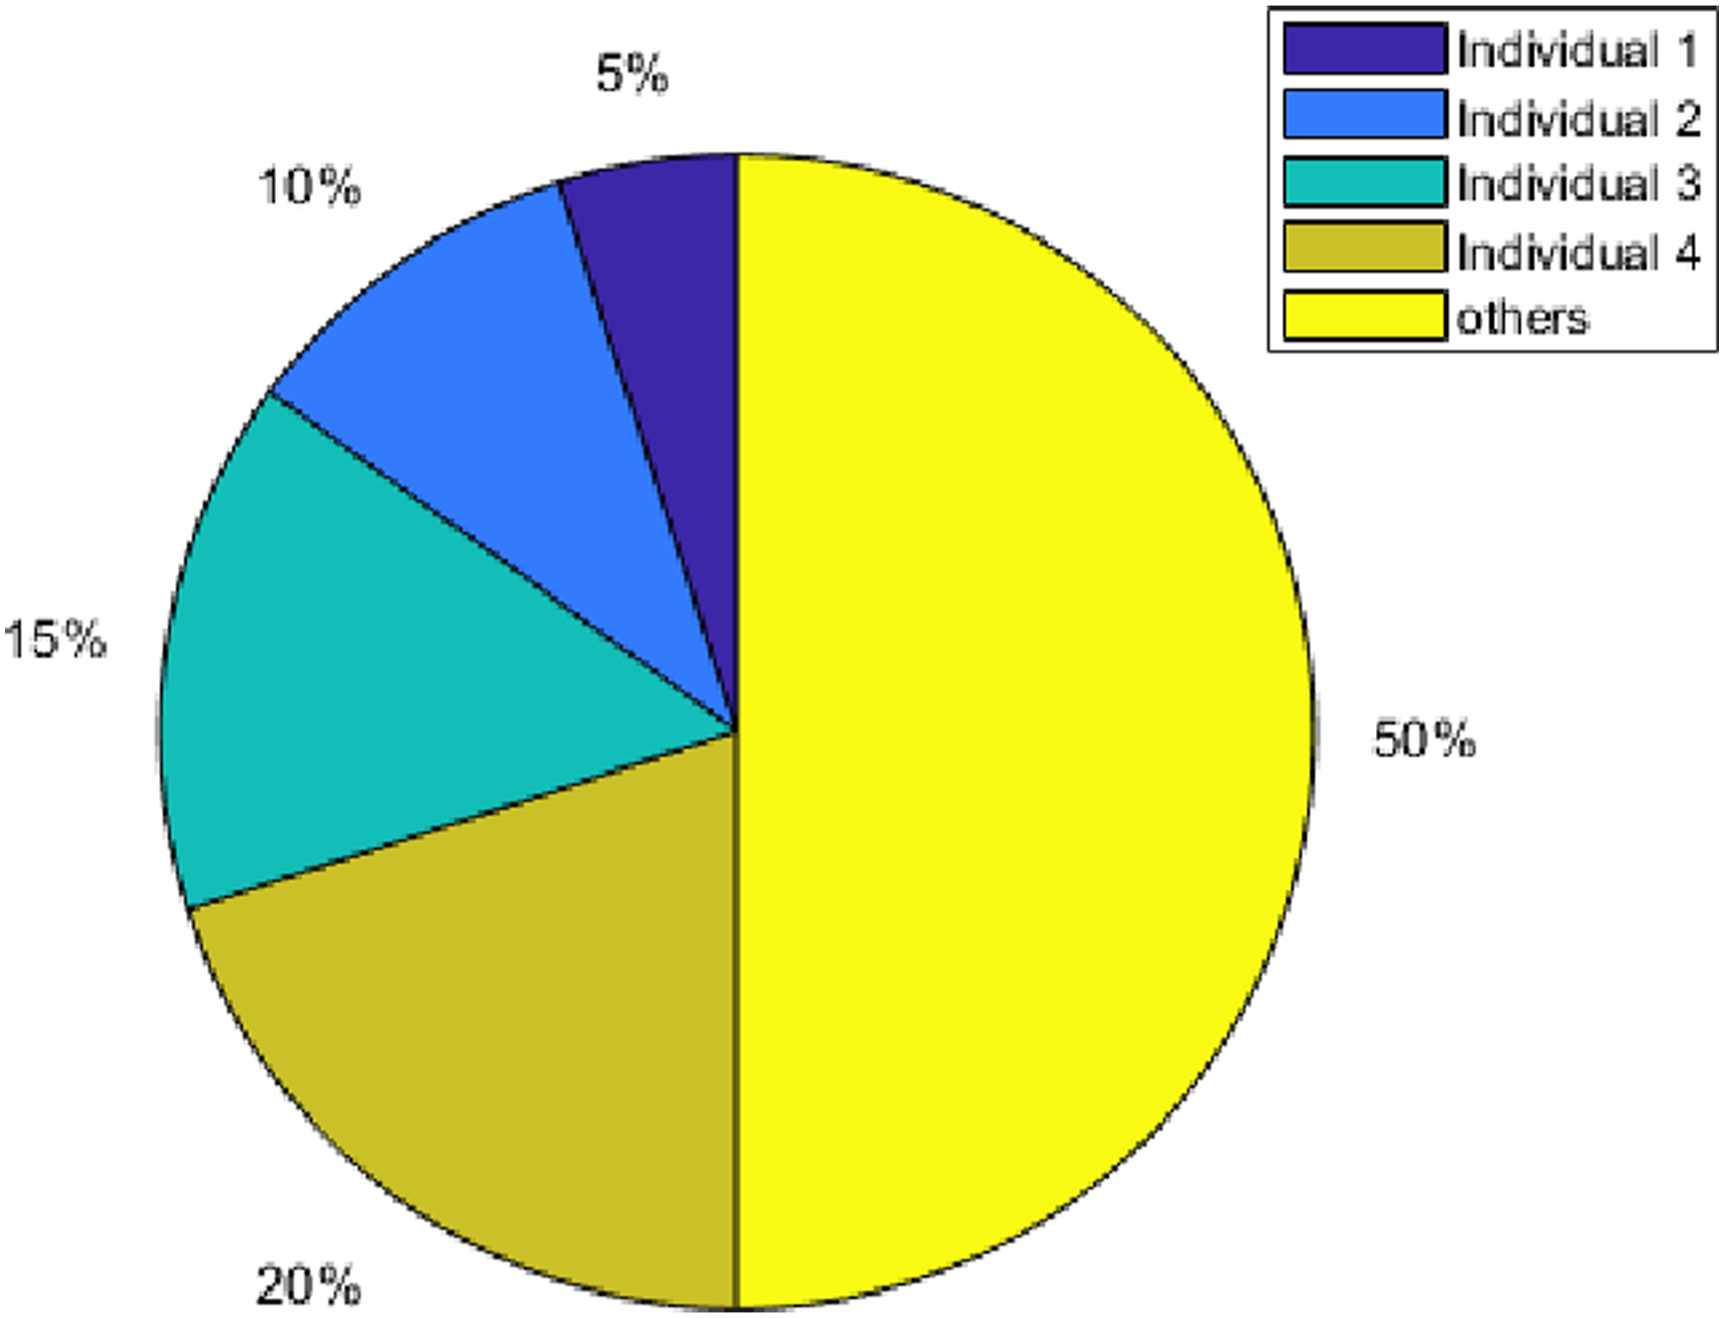

Assuming the sum of fitness values for all individuals is 1000, the fitness value for individual 1 is 50, the fitness value for individual 2 is 100, the fitness value for individual 3 is 150, and the fitness value for individual 4 is 200. Then the probabilities of them being selected for retention are 50/1000 = 5%, 100/1000 = 10%, 150/1000 = 15%, and 200/1000 = 20%, respectively.
Crossover and variation
The crossover operation of genetic algorithms simulates the phenomenon of paired chromosomes crossing and exchanging genes in biology. In the optimization problem of tourism resource development, genes represent specific selection and allocation plans, such as which development directions to choose and how to allocate resources. Cross operation plays an important role in improving the global search ability of algorithms, increasing population diversity, and accelerating convergence. The commonly used crossover operators for binary encoding and floating-point encoding individuals include single-point crossover, multi-point crossover, and uniform crossover.
Single-point crossover is one of the simplest crossover operators, and its implementation steps are as follows: a random crossover point can be selected to swap the gene parts of two parent chromosomes after the crossover point, generating two offspring chromosomes. Multipoint crossing refers to gene exchange at multiple intersections, which introduces more intersections and increases the degree of gene recombination compared to single-point crossing. The main principle of uniform crossover is to randomly select genes from two-parent individuals to form offspring based on a pre-set crossover probability (usually 0.5), as shown in formulas (2) and (3). X1 and X2 are the parental chromosomes, X3 and X4 are the offspring chromosomes, M is a random mask, and i is a gene locus.


The crossover operator used in the model established in this article is uniform crossover, so here the article takes uniform crossover as an example, as shown in Figure 5. If two-parent chromosomes to be crossed are X1 = [11001] and X2 = [01110], a random mask M with the same number of digits as them can be generated before uniform crossing (assuming “10101”), with a probability of taking 0 or 1 for each digit in the mask of 0.5. Uniform crossing.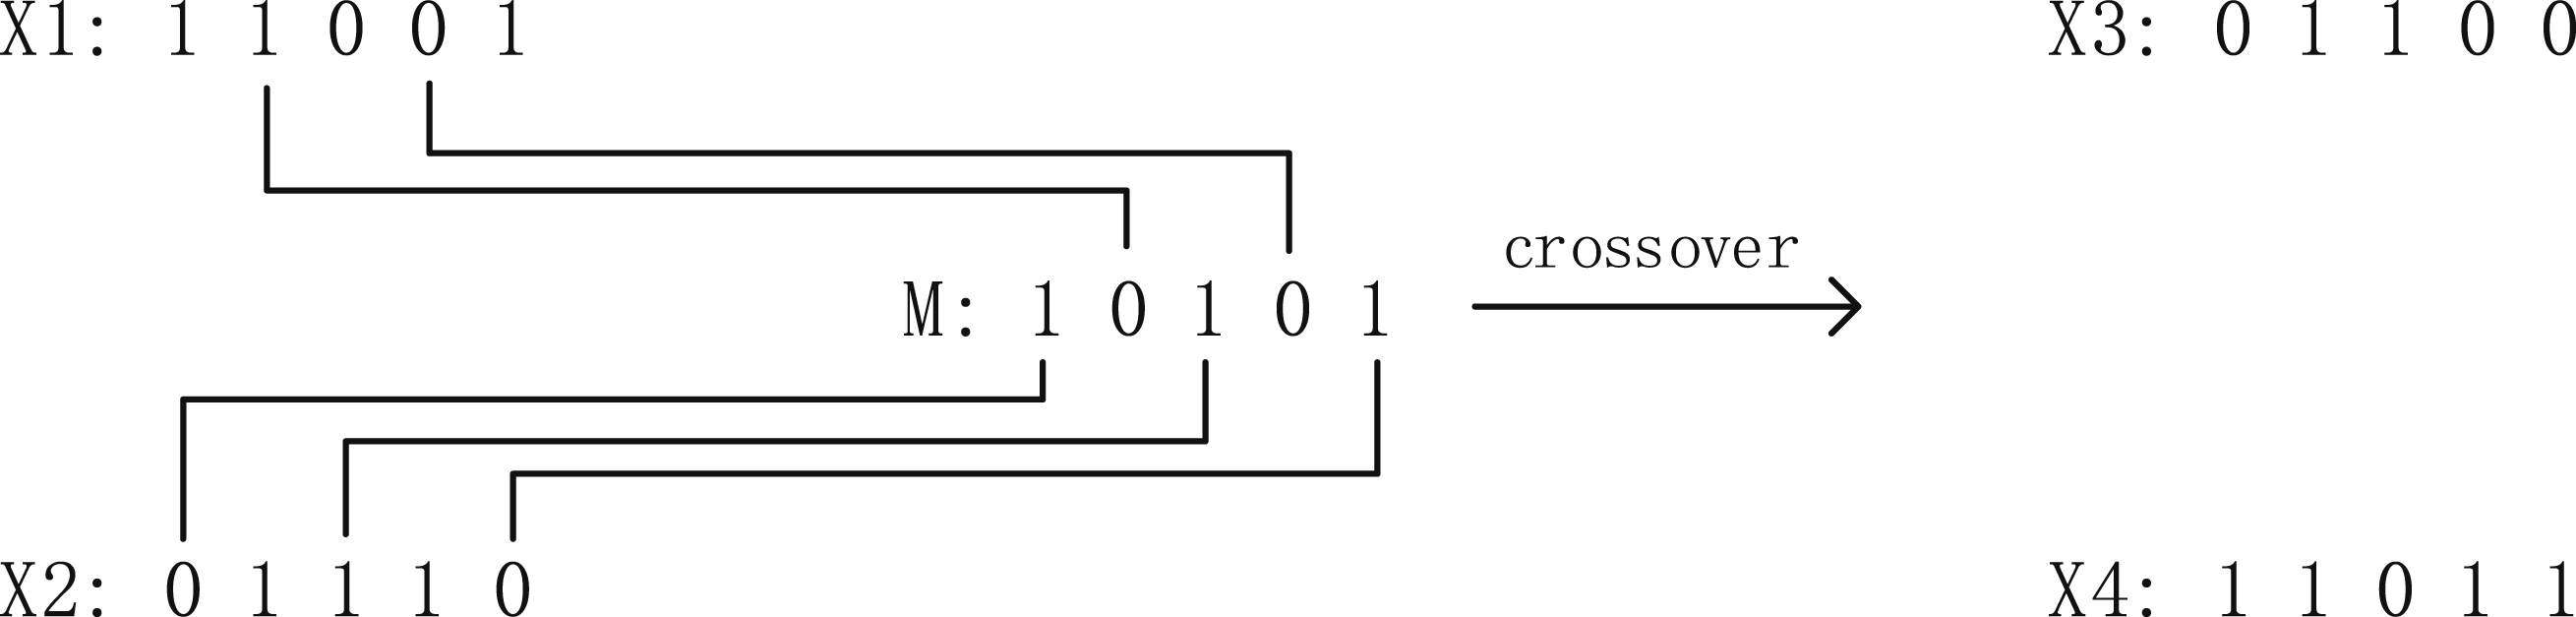
The mutation operation in genetic algorithms refers to randomly changing or replacing certain gene loci in an individual’s chromosome coding string to form new individuals. Mutation operations introduce new genetic information to maintain population diversity, enhance the algorithm’s global search ability, avoid premature convergence, and help the algorithm explore the solution space more effectively. Common mutation methods include transposition mutation, exchange mutation, and uniform mutation.
Bit flipping anomaly is used for binary encoding, which involves randomly selecting one or more gene loci from a binary string with a certain probability, and changing 0 to 1 or 1 to 0. The method of exchanging mutations is to randomly select two gene loci and exchange their values. Uniform variation is commonly used in floating-point encoding. Random numbers that conform to a uniform distribution within a certain range can be used to replace the original gene values at each locus in the individual coding string with a relatively small probability.
The model established in this article adopts a flip transformation for development direction X, as shown in formula (4). Each gene locus i of binary encoding X is mutated with a mutation probability p, and the mutated locus value is the inverse of the pre-mutated locus value.

Uniform variation is used for the proportion of directional resources Y and the proportion of total resources Z, as shown in formula (5). Each gene locus i of floating-point code C is mutated with a probability p, and the mutated locus value is a random number between the preset numbers a and b.

The range of values for the proportion of directional resources Y and the proportion of total resources Z in this article is from 0 to 1. Therefore, when performing uniform mutation, each digit has a probability of p mutating into a random 2 decimal places between 0 and 1. To meet the constraint that the sum of each chromosome is equal to 1, the difference between the mutation sites should be evenly distributed to other sites.
Experiment and result analysis
Training parameters.
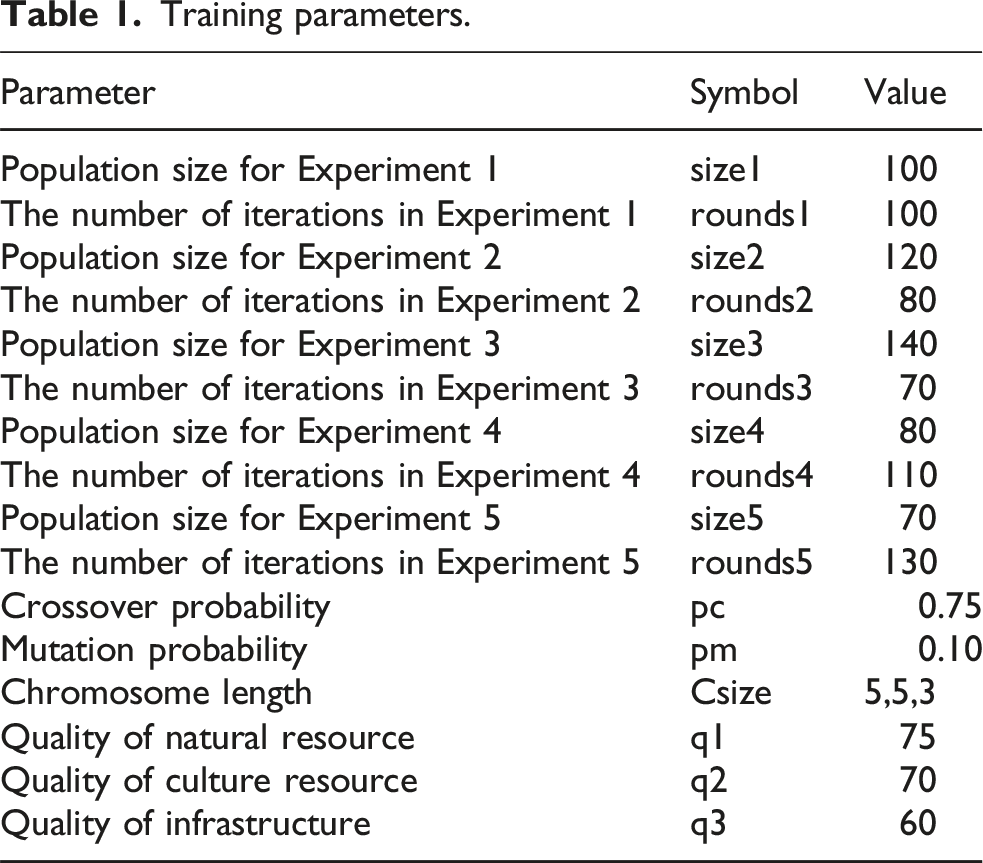
In the initialization phase, each individual in the population can be initialized and assigned values, using methods such as generating random binary numbers and generating random floating-point numbers with limited ranges and digits. Only when an individual decides to develop in a certain direction, that is, when a certain position in X is 1, can the proportion of investment in that direction in Y be meaningful, therefore a constraint condition if (
After initialization, evaluate the fitness value of each initial individual. The calculation formula for fitness value is shown in formula (6). Among them, 0.87 and 0.55 are feature coefficients fitted based on 134 rural tourism attraction development cases used in the following text. This article abstracts real-life development cases into specific chromosome features X, Y, and Z and evaluates the fitness values of these cases through manual methods. Finally, these data are used for curve fitting to obtain feature coefficients. q1, q2, and q3 represent the quality of exploitable resources currently available in the scenic area.
According to statistics, the highest fitness of individuals in the initial population in the first simulation experiment was 178.9, corresponding to individual chromosomes of X = [1, 1, 1, 0, 0], Y = [0.39, 0.37, 0.24, 0, 0], Z = [0.4, 0.3, 0.3]. The minimum fitness is 0, corresponding to individual chromosomes X = [0, 0, 0, 0, 0], Y = [0, 0, 0, 0, 0], Z = [0, 0, 0]. The distribution of individuals with fitness at different levels at intervals of 20 is shown in Figure 6. From the bar chart, it can be seen that the fitness values of individuals in the initial population follow the characteristics of a normal distribution. Distribution of initial population fitness values.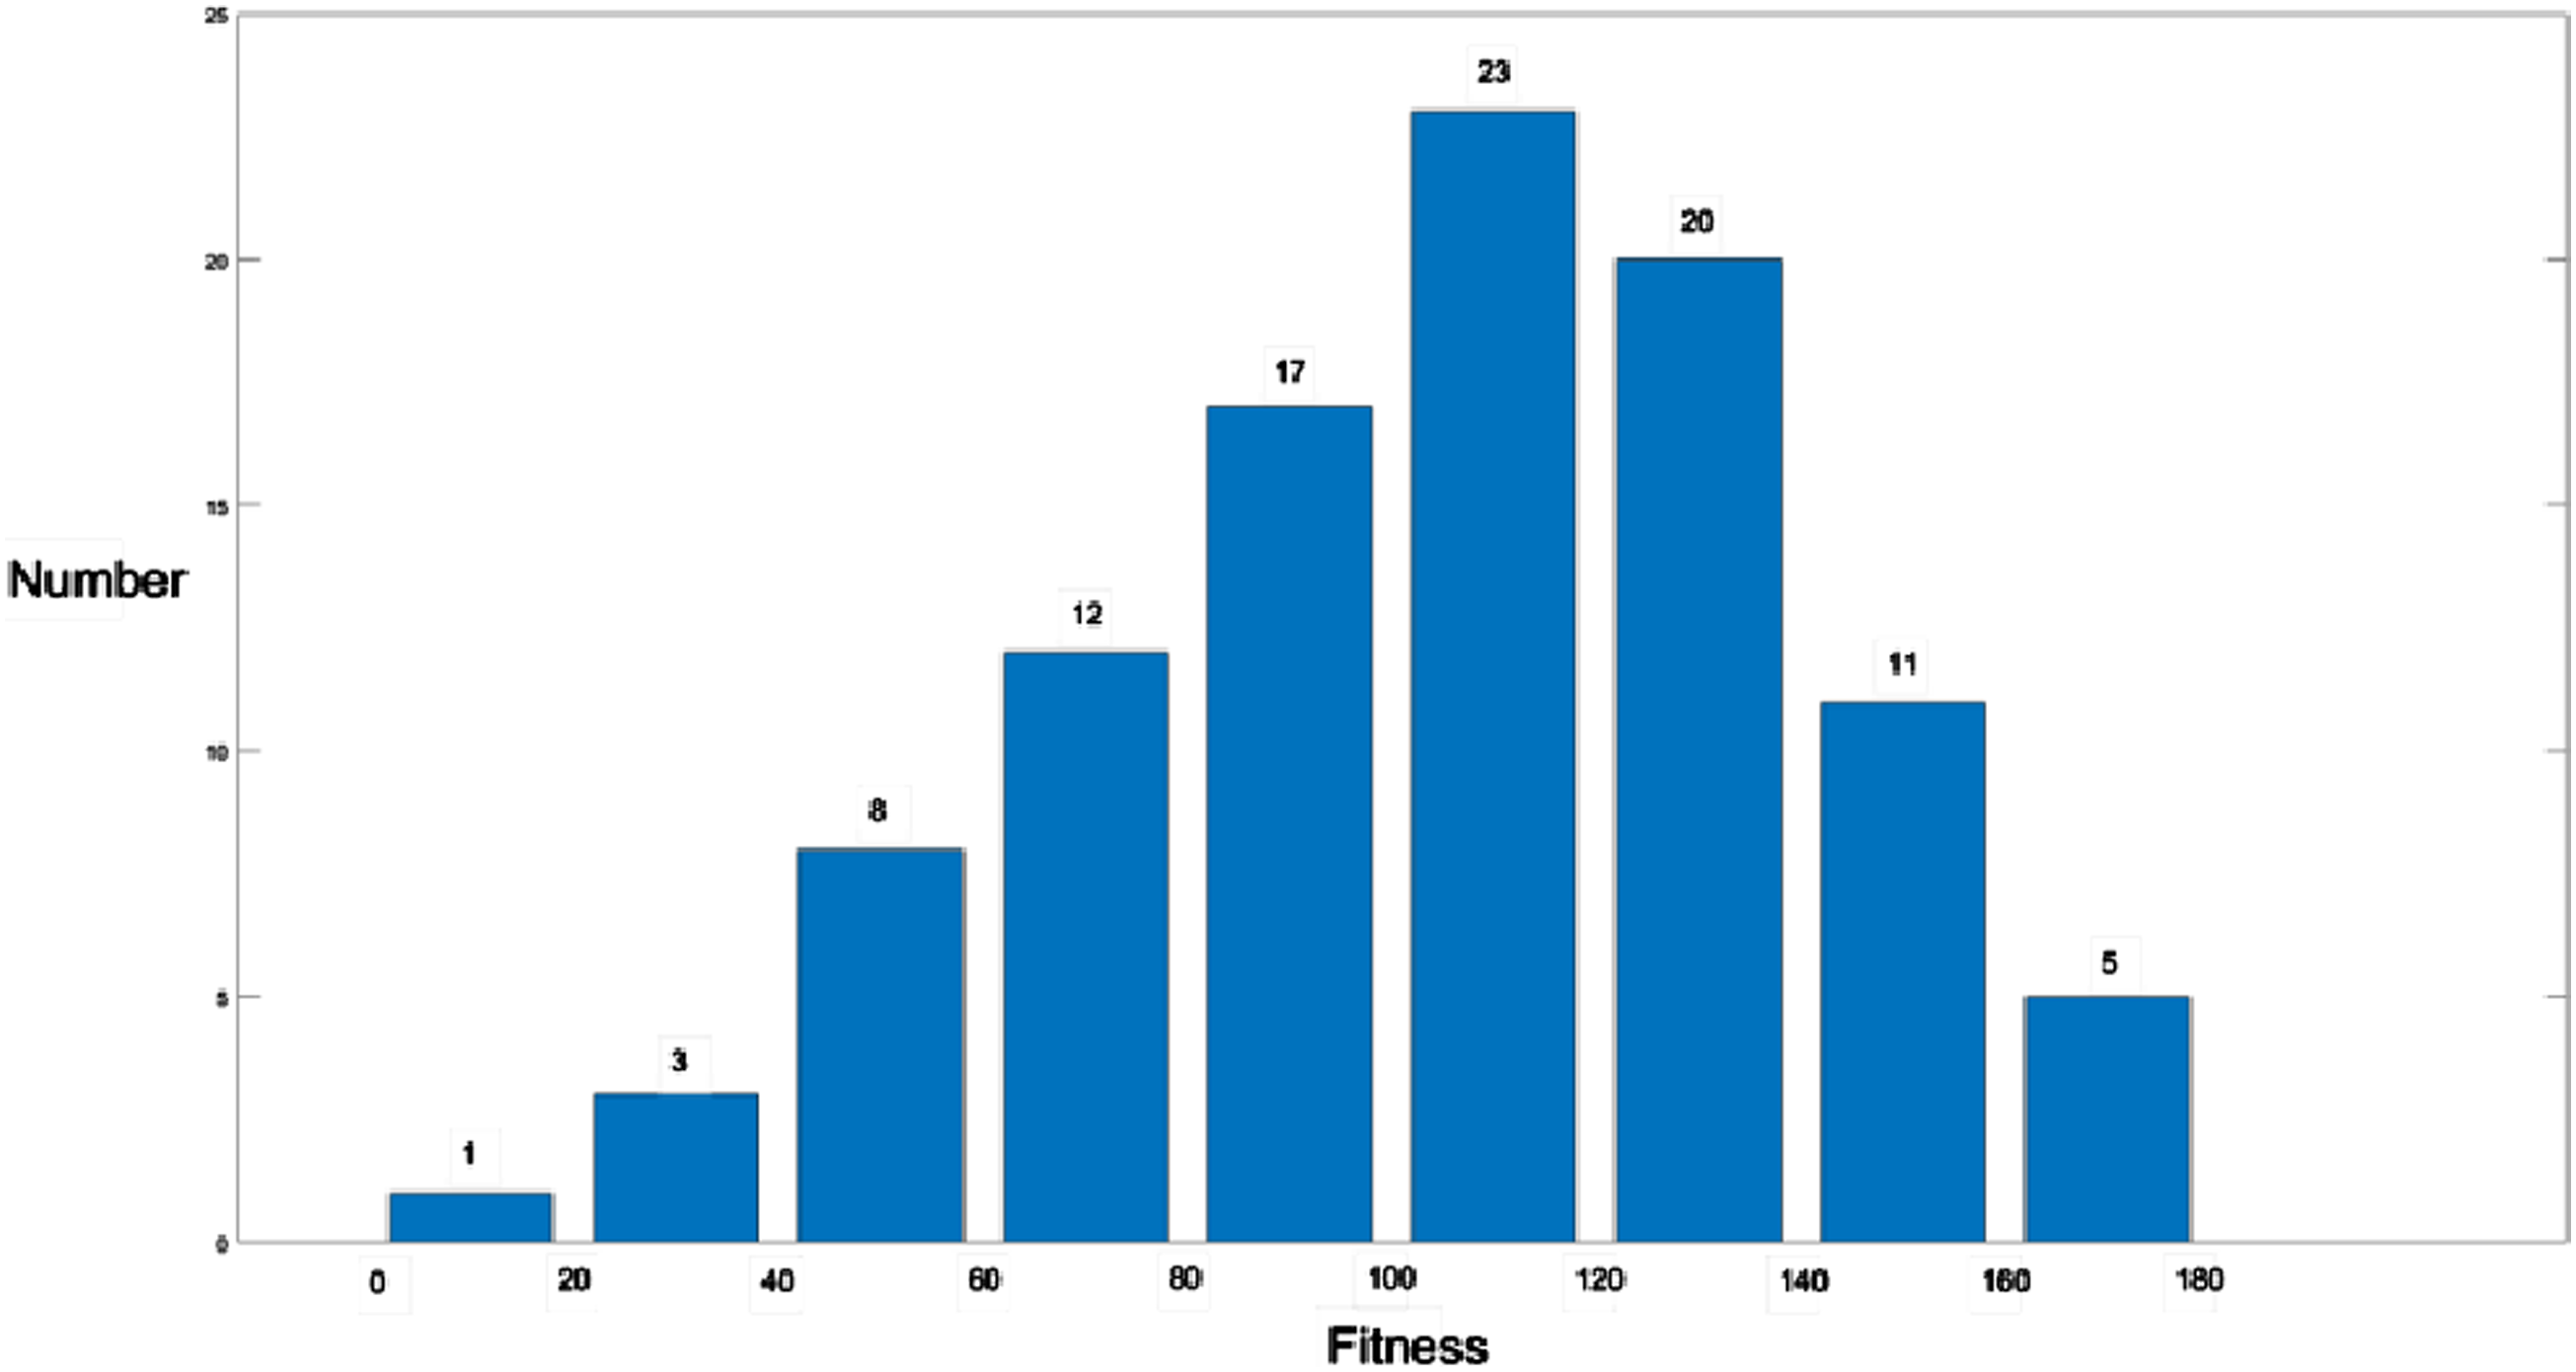
The first generation of individuals subsequently retained the parent generation of the next generation under the roulette wheel selection method, while all other individuals were eliminated. Individuals that can be retained can undergo crossover and mutation operations to generate the next generation of individuals. The second-generation individuals repeat the steps of the previous generation, conducting selection, crossover, and mutation, and continuously iterating to improve the overall fitness of the population. When the number of iteration rounds reaches the termination round set for this experiment, the iteration can be stopped and data can be collected. In the first simulation experiment, the growth of the lowest, highest, and average fitness values for every 10 generations of individuals is shown in Figure 7. As iterations continue, the highest fitness value, lowest fitness value, and average fitness value of the population all increase with the number of rounds, and the growth rate decreases continuously, preferably tending to converge. The highest fitness value converges to the exact value, while the lowest and average fitness values fluctuate within a certain range, making it difficult to converge accurately. The reason for this individual distribution is that there is an optimal solution to the optimization problem, so when multiple individuals reach the optimal solution position, the highest fitness value in the population will converge. Due to the existence of mutation operations, each iteration will generate discrete individuals with random positions and far from the optimal solution, which makes it difficult for the population’s minimum and average fitness values to converge. Growth of the lowest adaptation value, the highest adaptation value, and the average adaptation value.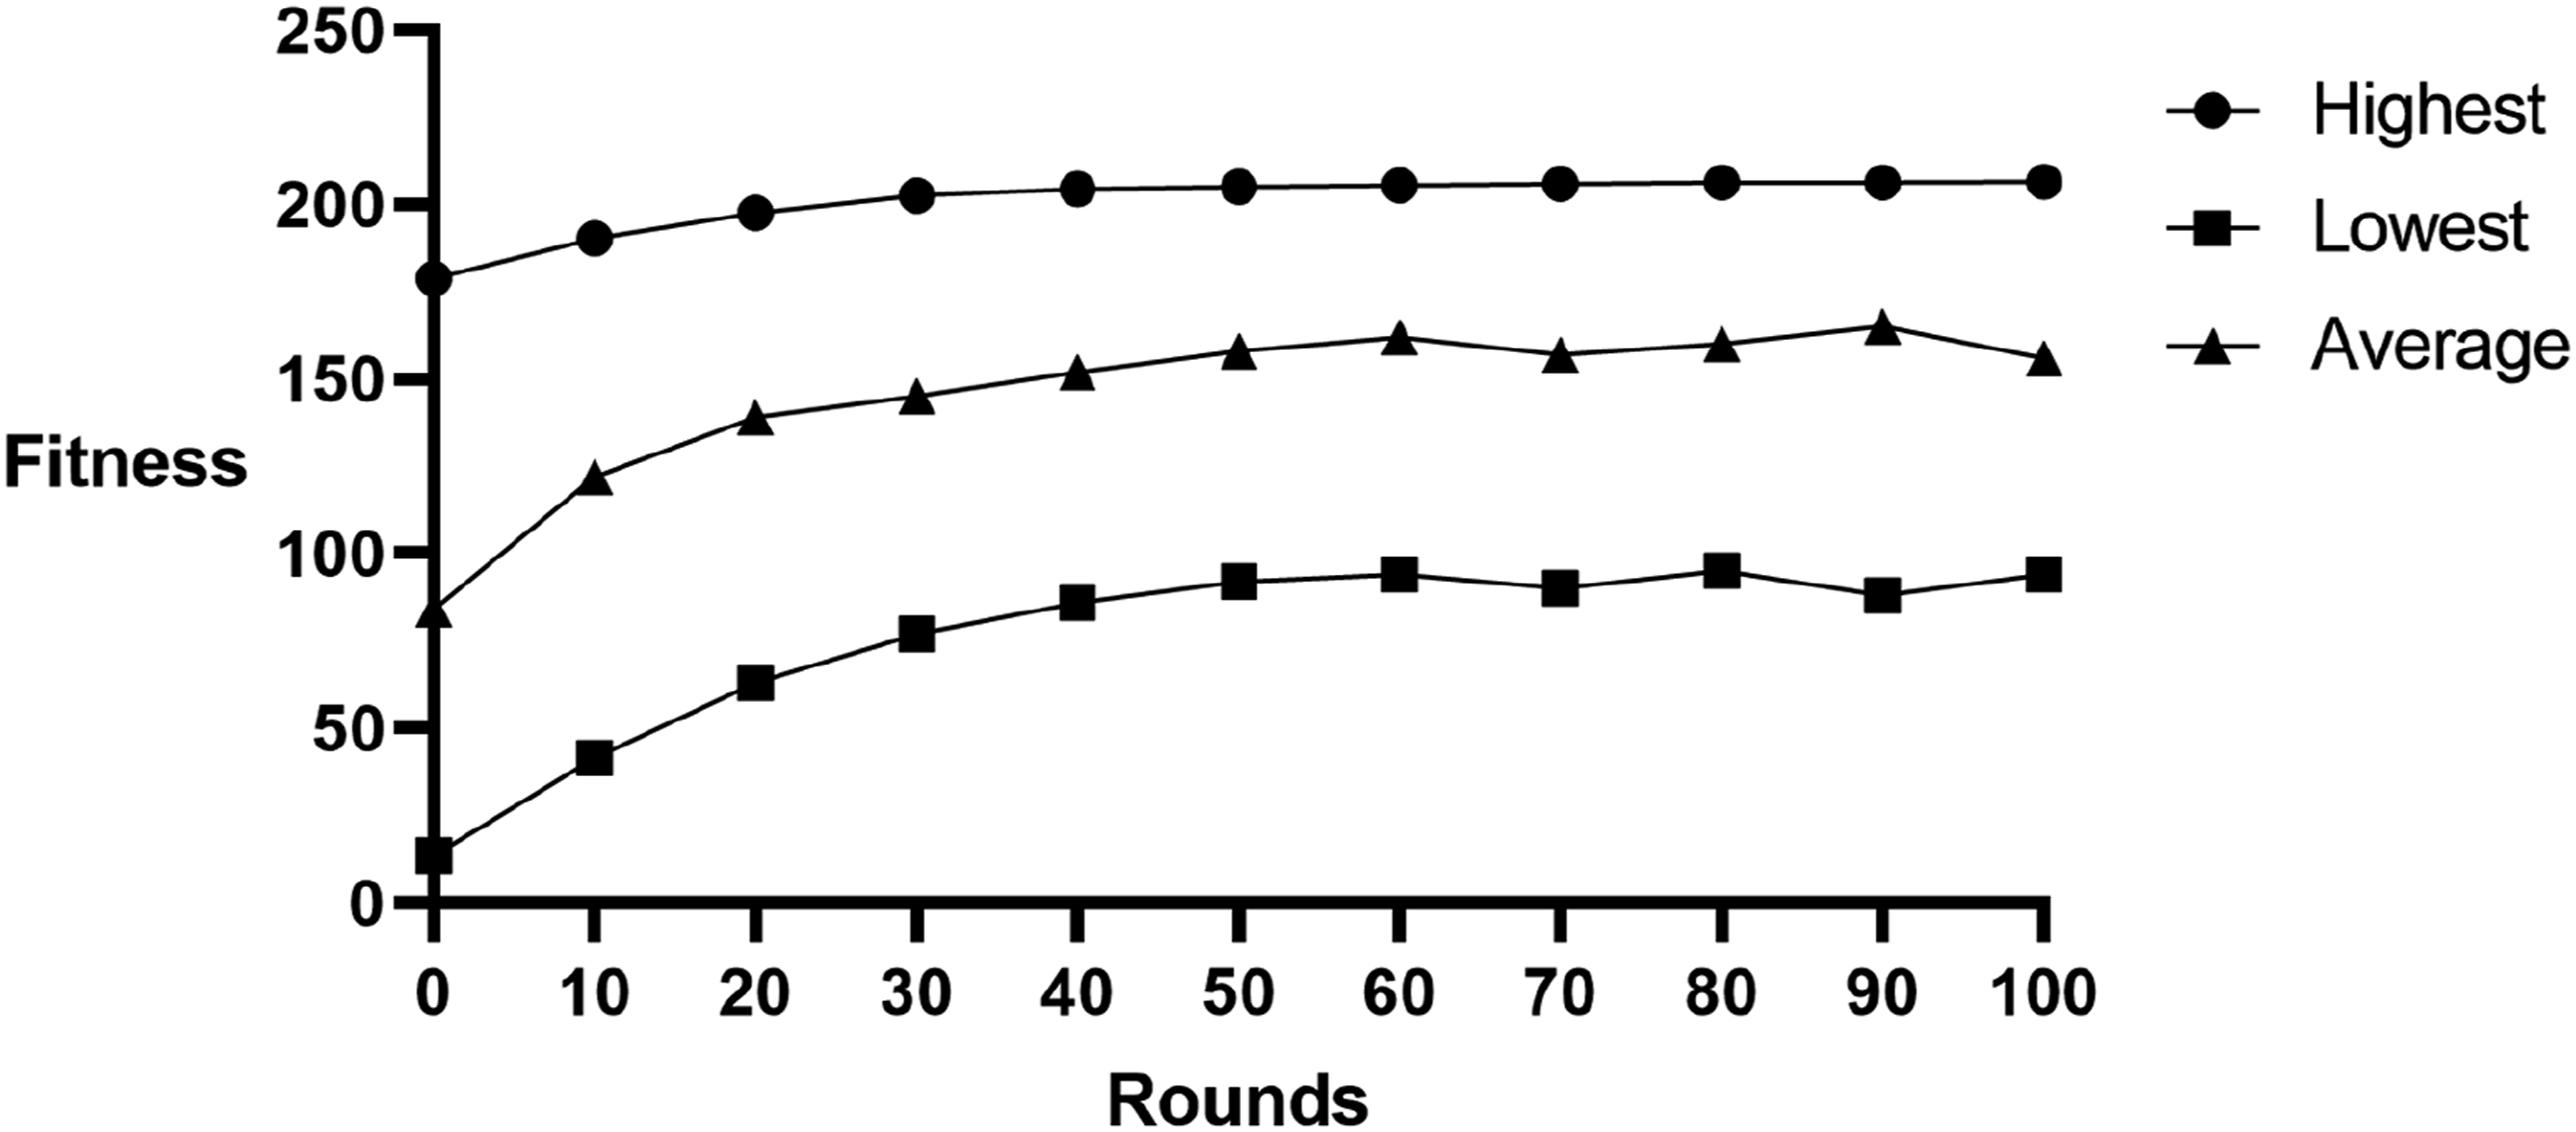
Data from five simulation experiments.
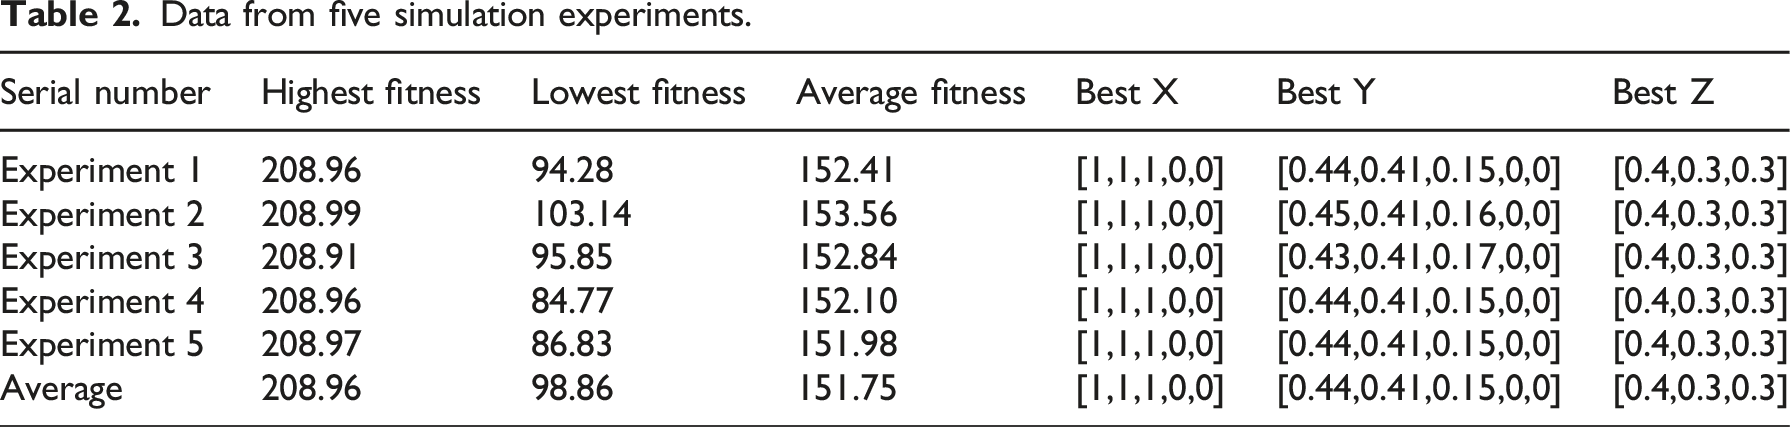
If the simulated data obtained from the experiment can be compared with actual cases, it can better evaluate the performance of the method. For this purpose, this article crawled a total of 134 examples of rural tourism attraction development, with data sourced from news websites of tourism management bureaus in various provinces and cities. The construction investment data of the scenic spot can be abstracted into the chromosome format mentioned earlier, and the fitness value can be manually evaluated based on the income and number of tourists of the scenic spot, organizing and creating a small dataset. Through manual sorting, three types of samples were selected in the dataset: samples with high return and high positive reviews, samples with low return and low positive reviews, and fuzzy samples. The least squares method can be used to calculate the distance between the three types of samples and the optimal solution obtained by the genetic algorithm. Among these 134 development examples, there are 54 samples with high return rates and high positive ratings, with an average distance of 7.512 from the corresponding solution to the genetic algorithm generated solution. There are 41 samples with low return rates and low positive ratings, with an average distance of 31.836 from the corresponding solution to the genetic algorithm generated solution. There are 39 fuzzy samples, with an average distance of 16.757 from the corresponding solution to the genetic algorithm generated solution.
From the above data, it can be seen that the instance samples with high return rates and many positive reviews have the smallest average distance from the optimal solution obtained by the genetic algorithm. The sample with low return rate and few positive reviews has the highest average distance from the optimal solution obtained by genetic algorithm, proving that genetic algorithm can effectively optimize the development plan of tourism resources.
Conclusions
In the current booming tourism industry, the scientific and rational development and utilization of tourism resources can significantly increase the revenue of scenic spots and create economic benefits. In order to better assist scenic area developers in making scientific decisions, this article studied a method of using genetic algorithms to optimize tourism resource development plans. By modeling, initializing, and iteratively selecting development plans, funding, and other conditions, a model can ultimately predict the optimal development plan. However, there is still room for further optimization in this study. For example, more constraints can be introduced within the allowable range of complexity, such as environmental protection constraints on development and time cost constraints on development. In subsequent research, the accuracy of the model can be improved by refining the modeling of scenic area conditions. In addition, how to reasonably define the fitness value of development plans is also a key issue in research. The method adopted in this article is to abstract real-life development cases into data features and manually evaluate the fitness value, which requires a large number of samples as support. However, the 134 cases collected through web crawling technology in this article are still relatively small, which will have an impact on the performance of the model. In the future, more instance data can be collected to optimize the model. In general, when there is a lack of clear best solution standards, there can be risks when directly applying the tourism resource development plan provided by genetic algorithms. However, it can be used as an auxiliary tool for scenic area developers to provide optimization ideas and reference opinions to help them make better plan decisions.
Footnotes
Funding
The authors received no financial support for the research, authorship, and/or publication of this article.
Declaration of conflicting interests
The authors declared no potential conflicts of interest with respect to the research, authorship, and/or publication of this article.