




Abstract
To realize the fault early warning function of healthcare medical equipment, this study constructs an equipment fault early warning model and combines particle swarm optimization and long-short term memory network to test the performance. The study obtains the optimal value of data feature vectors through particle swarm optimization algorithm and uses long-short term memory prediction model to predict and classify feature signals. In addition, the study uses the binning method to denoise the collected data and normalizes the denoised data so that each feature data was distributed between 0 and 1. The results showed that the fitting between actual values and predicted values was good. The maximum values of Precision, Recall, and F1 of the designed warning model were 97.98%, 97.82%, and 97.68%, respectively, which were significantly better than the control model. This indicated that the warning model designed by the research had good performance. The combination of the particle swarm optimization algorithm and the long short-term memory network model offered unique advantages in the medical field. The particle swarm optimization algorithm could efficiently identify key features, avoid local optima, and improve the model’s generalization ability. Long short-term memory networks could accurately capture the dynamic trends of faults and adapt to the temporal nature of medical data. Combining the two could meet the high-precision, real-time, and adaptive requirements of medical equipment fault warnings, effectively improving their accuracy.
Keywords
Introduction
Due to the change of the concept of public pension, many countries have also begun to advocate the development of healthcare and medical undertakings. The healthcare equipment has been continuously improved, and the degree of scientific and technological development has been continuously deepened. 1 The proper functioning of medical equipment is essential to ensuring patient safety and effective treatment. Accurately and promptly predicting equipment failures can prevent medical accidents, reduce costs, and improve the quality and efficiency of medical services. Therefore, exploring a high-precision, highly adaptable, real-time method for warning of medical equipment faults is particularly important. The application of computers in the medical field is becoming more and more widespread, and daily maintenance and fault early warning of healthcare medical equipment are also important. The commonly used monitoring methods in the world include time-frequency analysis, fuzzy recognition, signal analysis, Wavelet Transform (WT), and neural networks. 2 The time-frequency analysis method has the advantage of clearly displaying the time-frequency characteristics of a signal. However, it has the disadvantage of being computationally complex. The method’s correlation with fault prediction is reflected in its ability to detect changes in the time-frequency characteristics of a signal when a fault is detected in the equipment. The advantage of the fuzzy recognition method is that it can effectively handle problems of ambiguity and uncertainty. However, the results depend on the rationality, accuracy, and relevance of the fuzzy rules. The method’s relevance to fault prediction lies in its ability to identify early fuzzy fault characteristics. The advantage of the signal analysis method is that it can obtain information directly from equipment operation signals. However, it is susceptible to noise interference. Its relevance to fault prediction lies in its ability to detect fault characteristics in a timely manner. The WT method is sensitive to sudden changes and singular points in a signal. However, it is computationally complex. The method is relevant to fault prediction because it can capture sudden changes and singular points in a signal caused by equipment faults. The advantage of the neural network method is that it can automatically extract complex fault features. However, it requires a large amount of sample data for training and takes a long time to train. Its relevance to fault prediction stems from its ability to learn the relationship between equipment operating status and faults, thereby enabling fault prediction and diagnosis. With the wide application of neural network, more and more experts and scholars are committed to introducing neural network into equipment fault early warning models and have made many breakthroughs. 3 Among them, the performance of Convolutional Neural Network (CNN) and Support Vector Machine (SVM) is better, which has been unanimously recognized by the academic community. 4 However, most of the current researches tend to identify the fault type after the fault occurs, and the relevant research on fault early warning is relatively few. 5 The timely detection of potential medical equipment malfunctions is contingent upon the normal functioning of the equipment itself and the accurate assessment of the patient’s condition. Therefore, it is imperative to implement effective mechanisms for the early identification of such malfunctions.
At present, research on medical equipment fault warning mainly focuses on three aspects: (1) Combining microcontroller modules and software. (2) Utilizing rough neural networks. (3) Using machine learning algorithms. However, the microcontroller module cannot detect faults in advance or provide an early warning. Rough neural networks are prone to overfitting and have a longer learning time. In addition, the feature extraction of traditional machine learning algorithms mainly relies on human intervention, and the adaptability and learning ability of the algorithms are poor. Deep learning algorithms represent an advancement over traditional machine learning algorithms, exhibiting enhanced learning capacity and adaptability. Nevertheless, the field of medical equipment fault warning remains relatively under-researched. The majority of existing studies have focused on hardware devices and traditional neural networks, with relatively limited application of deep learning and other technologies. This has resulted in a notable decline in warning accuracy.
With the rapid development of artificial intelligence and big data technology, deep learning algorithms have shown strong application potential in various fields. In the field of medical equipment fault warning, deep learning algorithms have gradually received attention. Particle Swarm Optimization (PSO) and Long Short-Term Memory (LSTM) are swarm intelligence optimization algorithms and special recurrent neural networks (RNNs), respectively. They have unique advantages in feature optimization and time series processing. PSO is a swarm intelligence optimization algorithm, and its application in medical equipment fault diagnosis mainly includes four aspects: optimizing feature selection, optimizing model parameters, optimizing neural network weights, and improving the robustness of diagnostic models. 6 The PSO algorithm simulates the foraging behavior of bird flocks. It initializes a group of random particles and updates their velocity and position based on individual and global extremums. This process approaches an optimal solution. The PSO algorithm has the advantages of strong applicability, fast convergence, and good parallelism, and it can effectively avoid local optima. Additionally, an LSTM is a special type of RNN that uses gating mechanisms (input, forget, and output gates) to selectively transmit information, effectively solving the gradient vanishing and exploding problems of traditional RNNs. It can effectively store information for a long time and reduce feature loss. It is particularly suitable for processing the fault diagnosis of medical equipment that relies on long-term sequence data. 7
Therefore, in order to fill the gap of deep learning technology in the field of medical equipment fault warning and improve the accuracy of warning, the research combines PSO and LSTM to build fault diagnosis models of healthcare medical equipment. It tests the performance of a medical infrared imager as an example. Currently, most methods that combine PSO and LSTM use PSO to optimize LSTM hyperparameters, such as the learning rate and number of neurons, to improve model performance. However, the innovative combination approach presented in this article differs significantly from these methods. The study uses the PSO algorithm to optimize and screen the input features, extracting the most valuable feature vectors for fault warning. These vectors are then input into an LSTM network for deep learning, achieving accurate, early detection of medical equipment faults. The novelty of the research lies in its deep integration of the PSO feature optimization ability and the LSTM time series processing advantages. This improves feature quality by intelligently screening the PSO algorithm and reducing the LSTM network’s input dimension. The research effectively integrates the feature optimization capability of PSO and the time series processing capability of LSTM. This integration achieves fault warnings for medical infrared imagers, improves warning accuracy, reduces missed and false alarms, and prevents medical accidents caused by delayed detection of device faults. At the same time, it also provides a new technical approach and method in the field of medical equipment fault warning and expands the application of deep learning in medical equipment fault alarm. This is of great significance in promoting intelligent maintenance and management of medical equipment.
References 1 and 2 provide background knowledge on the development of medical equipment and fault detection methods. References 3 and 4 demonstrate the application of neural networks in device fault warning, providing a foundation for the deep learning application in this study. Reference 5 points out that current research is mostly focused on type recognition after the occurrence of faults, highlighting the innovation of this study in early warning of faults. References 6 and 7, respectively, demonstrate the advantages of the PSO algorithm and the LSTM network in fault diagnosis. These references provide the theoretical basis and technical support for combining the two algorithms in this study.
The research is divided into four sections. The first section summarizes the current status of research on the diagnosis and analysis of faults in medical equipment, and introduces the research methods. The second section introduces the identification and preprocessing of fault signals, extracts the optimal value of data using PSO algorithm, and establishes an LSTM fault prediction model. The third section takes the medical infrared thermal imaging device as an example to simulate and test the LSTM fault prediction model, and analyze the experimental data. The fourth section is the conclusion section of the study. It includes a summary and generalization of the experimental results and highlights the limitations and future prospects of the research. It also analyzes the application of advanced optimization algorithms in other fields.
Literature review
At present, the healthcare industry in developed countries has developed very mature. The maintenance and fault detection of various medical equipment has become a hotpot. Experts and scholars have conducted a lot of research on intelligent fault early warning of medical equipment and achieved some results. These achievements have been described according to anti-noise models, hybrid models, time series methods, optimization models, and other methods.
On the anti-noise model, Jin et al. proposed a new Anti-noise Multi-scale CNN (AM-CNN) to solve composite fault diagnosis problems under different noise intensities. According to the principle of noise superposition, the residual loss was expressed and the loss function was constructed. Experimental data showed that AM-CNN accuracy was improved by 39.93% under noiseless working conditions. 8 Wang et al. proposed a model by granular computing. CNN with super parameter optimization was used for the fault features, which were used as granularity input by granularity calculation to determine the fault type. The experimental results verified its effectiveness. 9 However, although the anti-noise model shows improvement in anti-noise performance and diagnostic accuracy, it lacks the ability to effectively recognize weak features in the early stages of faults.
On the mixed model, Huo et al. used Fuzzy C-Means Clustering (FCMC) to classify the fault detection. By comparing with CNN method for mechanical equipment fault detection, the experimental results confirmed its superiority. 10 Han et al. used the short-term wavelet entropy calculation method to extract fault information. LSTM output was set as SVM input to obtain fault diagnosis results by adaptive classification. Experimental results verified the effectiveness of the algorithm. 11 Sheela et al. designed an artificial intelligence algorithm based on hybrid PSO-SVM for the diagnosis of COVID-19, which was used to analyze and judge computed tomography images. The results showed that the proposed work showed a specificity of 0.85, a sensitivity of 0.956, and an accuracy of 95.78%. 12 Amooei et al. designed two new models based on CNN-LSTM networks for the diagnosis of neurodegenerative diseases. This study used the first CNN-LSTM model to process spectrogram images and combined the second CNN-LSTM model with WT to perform secondary processing on spectrogram images. The results demonstrated that the classification accuracy achieved using only approximate sub-bands was 95.37%, while that attained using three sub-bands was 94.04%, and the accuracy obtained when all sub-bands were included was 94.53%. 13
In the time series method, Liu et al. introduced an intelligent method by LSTM network. Without the circuit diagram and the unknown signal direction of the circuit board, the symptoms and port electrical signals were collected. Moreover, the fault diagnosis, classification, and identification experiments were carried out by using the fused and screened multimodal features. The final experimental results verified its effectiveness. 14 Hou et al. proposed a method by blind deconvolution for impact response enhancement and chirp Z-transform for characteristics matches. The experimental results confirmed the effectiveness of the algorithm. 15 Hybrid models and time series methods have certain dynamic analysis and fault diagnosis capabilities. However, there is still room for improvement in the timeliness and accuracy of fault warnings. Time series methods can capture the evolution process of faults, but they are insufficiently sensitive to weak features in the early stages of faults.
In optimizing the model, Yang et al. used Genetic Algorithm (GA) and SVM for data parameter optimization, preference weight adjustment of the two indicators in the optimization direction, and the best parameter selection after iteration. Results showed good accuracy. 16 To overcome that it was difficult to collect analog signals for fault detection, Su et al. proposed a fault diagnosis method and optimized fault detection model through Gray Wolf Optimization (GWO) algorithm. Results showed that the fault diagnosis time of the research algorithm was shortened by about 90%. 17 Optimization models often focus on improving diagnostic efficiency and performance, rather than fault warning functions.
On other models, Wang et al. proposed a new CNN for equipment fault classification. Through convolution and subsampling operations, the learning process was iterated, and data features were automatically obtained. Finally, t-distribution random neighborhood embedding technology could visualize learned features. Experimental data proved the superiority of this method. 18
Comparison of methods, results, and contributions between different literature and this study.
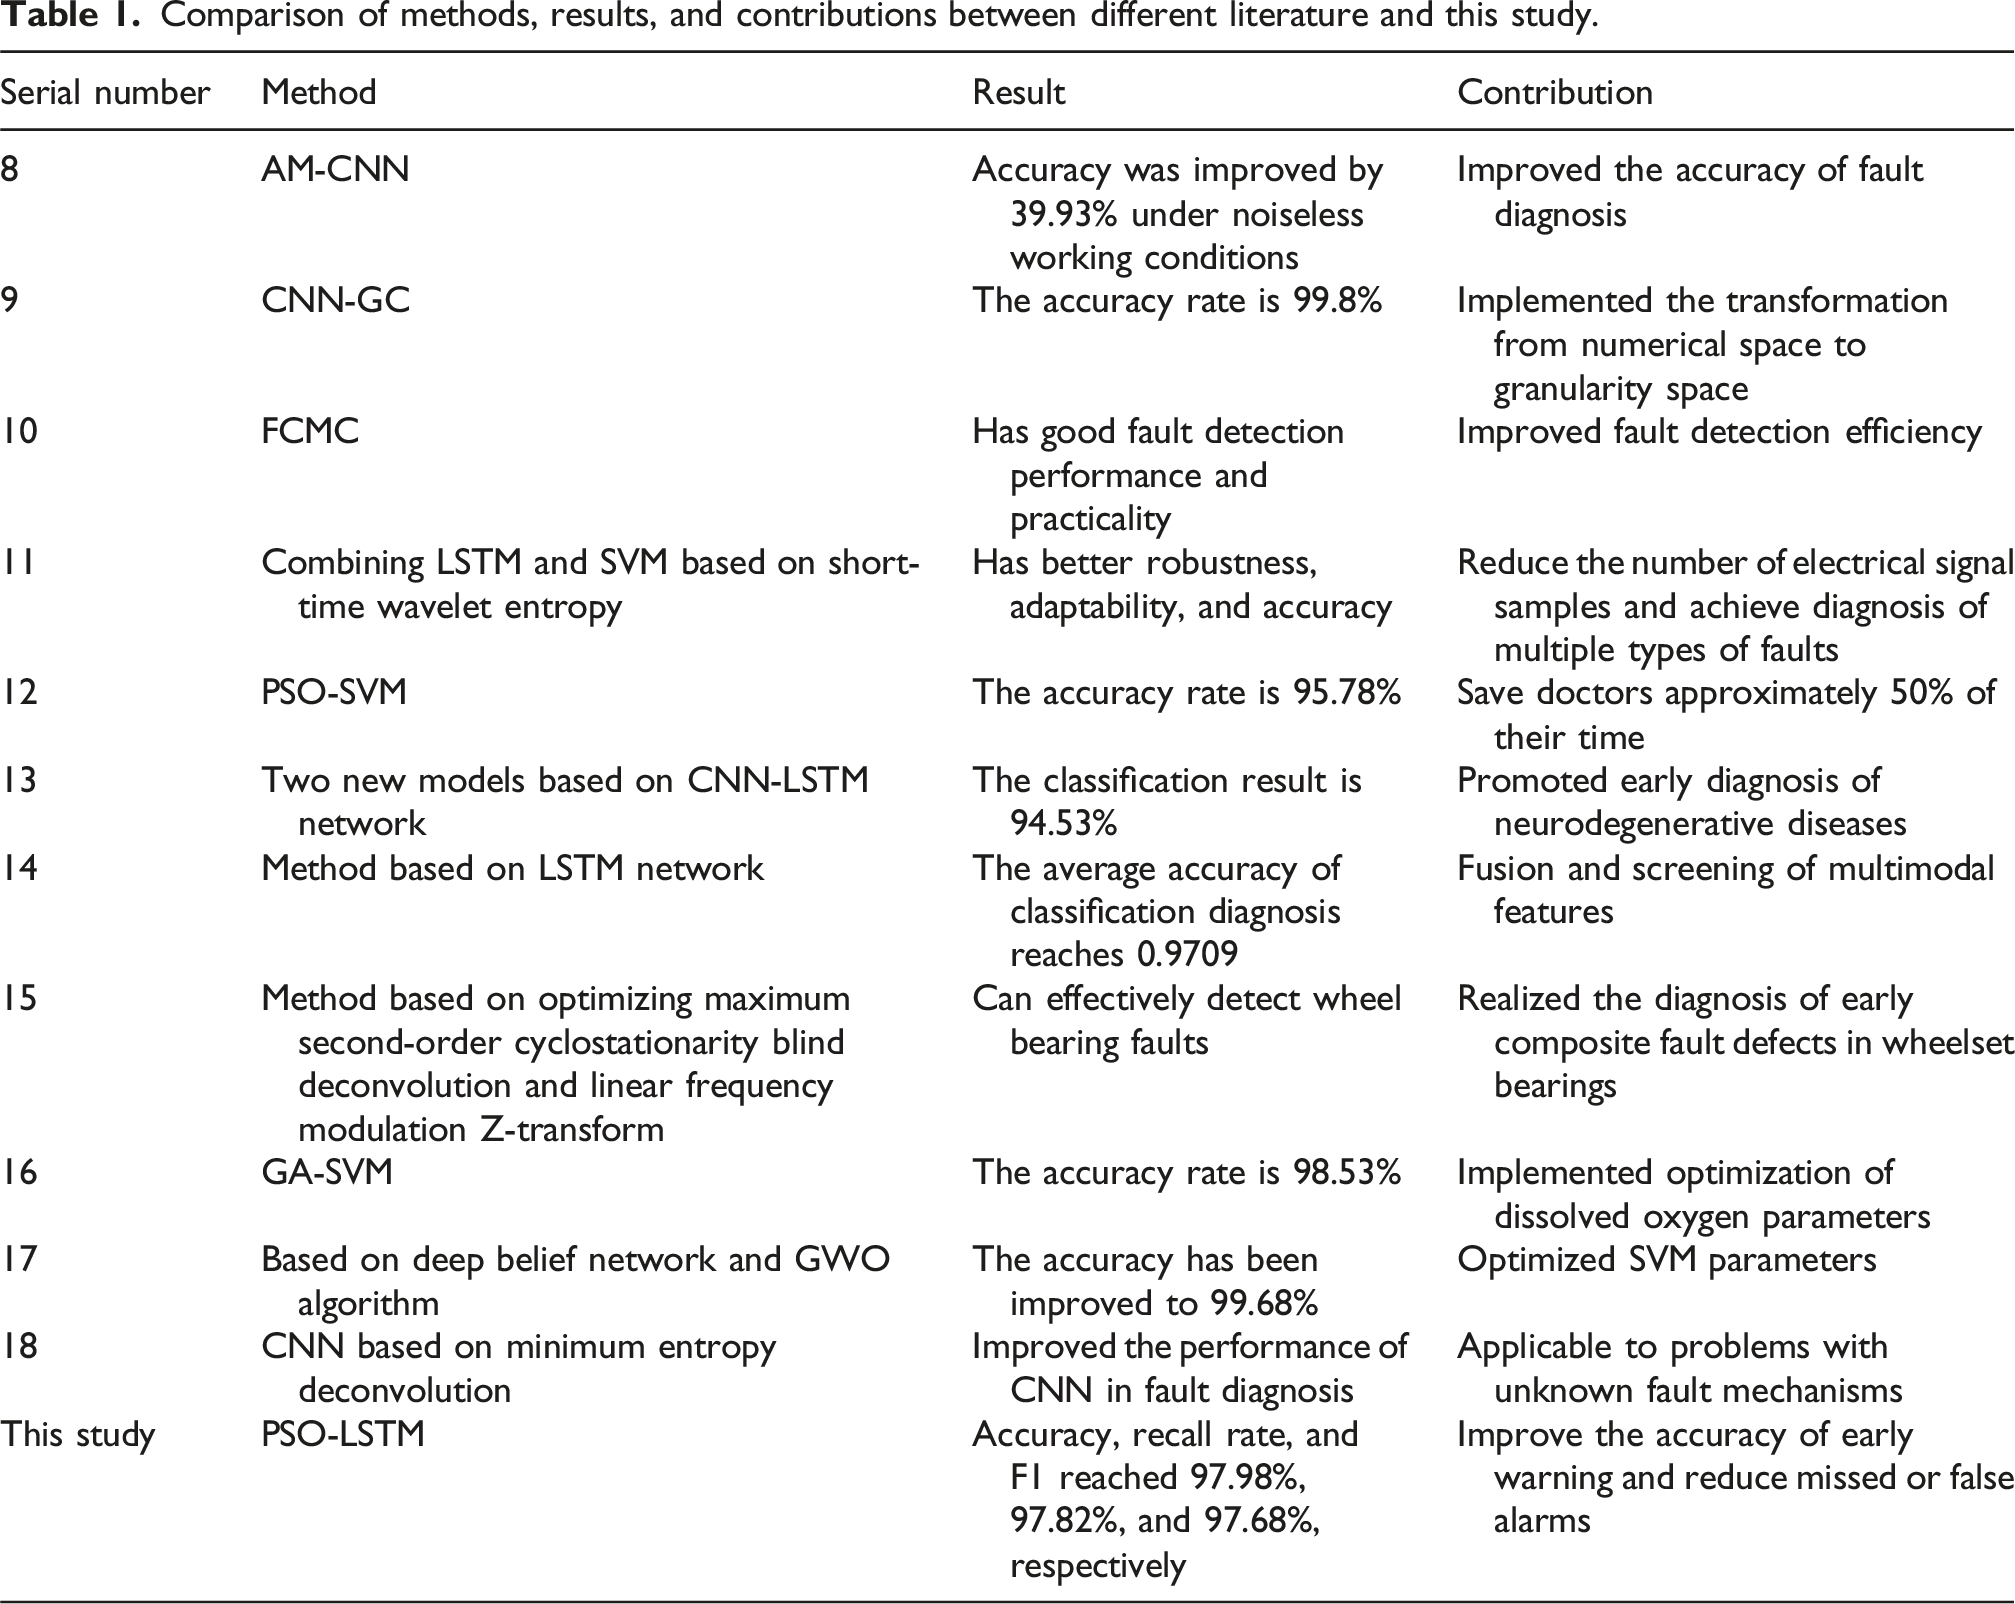
As shown in Table 1, although numerous studies have been conducted in the past, most of them have focused on diagnosing types after faults occur, with little research on providing early warnings before faults occur. This study combines PSO and LSTM to construct a predictive model for early warning of faults in medical infrared thermal imagers, successfully filling this gap. At the same time, building on the strengths of previous research, the study leverages the PSO algorithm’s feature optimization capabilities and the LSTM time series’ processing advantages to advance medical equipment fault warning technology.
Method description
In order to carry out real-time and accurate fault early warning analysis on healthcare medical equipment, two methods of sensor and Universal Serial Bus (USB) interface are used to collect the original data, and then the data are preprocessed by noise reduction and normalization. Finally, the optimal value of the data feature vector is extracted and substituted into the built prediction model for identification.
Fault signal identification and preprocessing
Once the concept of health physiotherapy is put forward, it has been vigorously promoted and developed worldwide. A variety of intelligent medical equipment also emerged, covering all aspects of the field of healthcare, of which the most widely used medical equipment is the medical infrared imager. It uses infrared thermal imaging technology combined with optical components and imaging circuit components to detect the infrared radiation of patients. Moreover, it visually diagnoses the temperature distribution of patients through signal processing, photoelectric conversion, and other steps so as to provide a diagnostic basis for the treatment of the disease.
19
Taking the medical infrared thermal imager as an example, this study used deep learning neural networks to build an intelligent healthcare equipment fault early warning model and perform performance tests. First, the study aims to optimize the data feature vector through PSO algorithm and use the optimized data as high-quality input for subsequent fault warning models. Second, a fault warning model based on LSTM is designed, which utilizes the advantages of LSTM in time series data processing to predict and classify the characteristic signals of intelligent healthcare equipment. The flowchart of building the fault warning model is shown in Figure 1. Flowchart for building a fault warning model.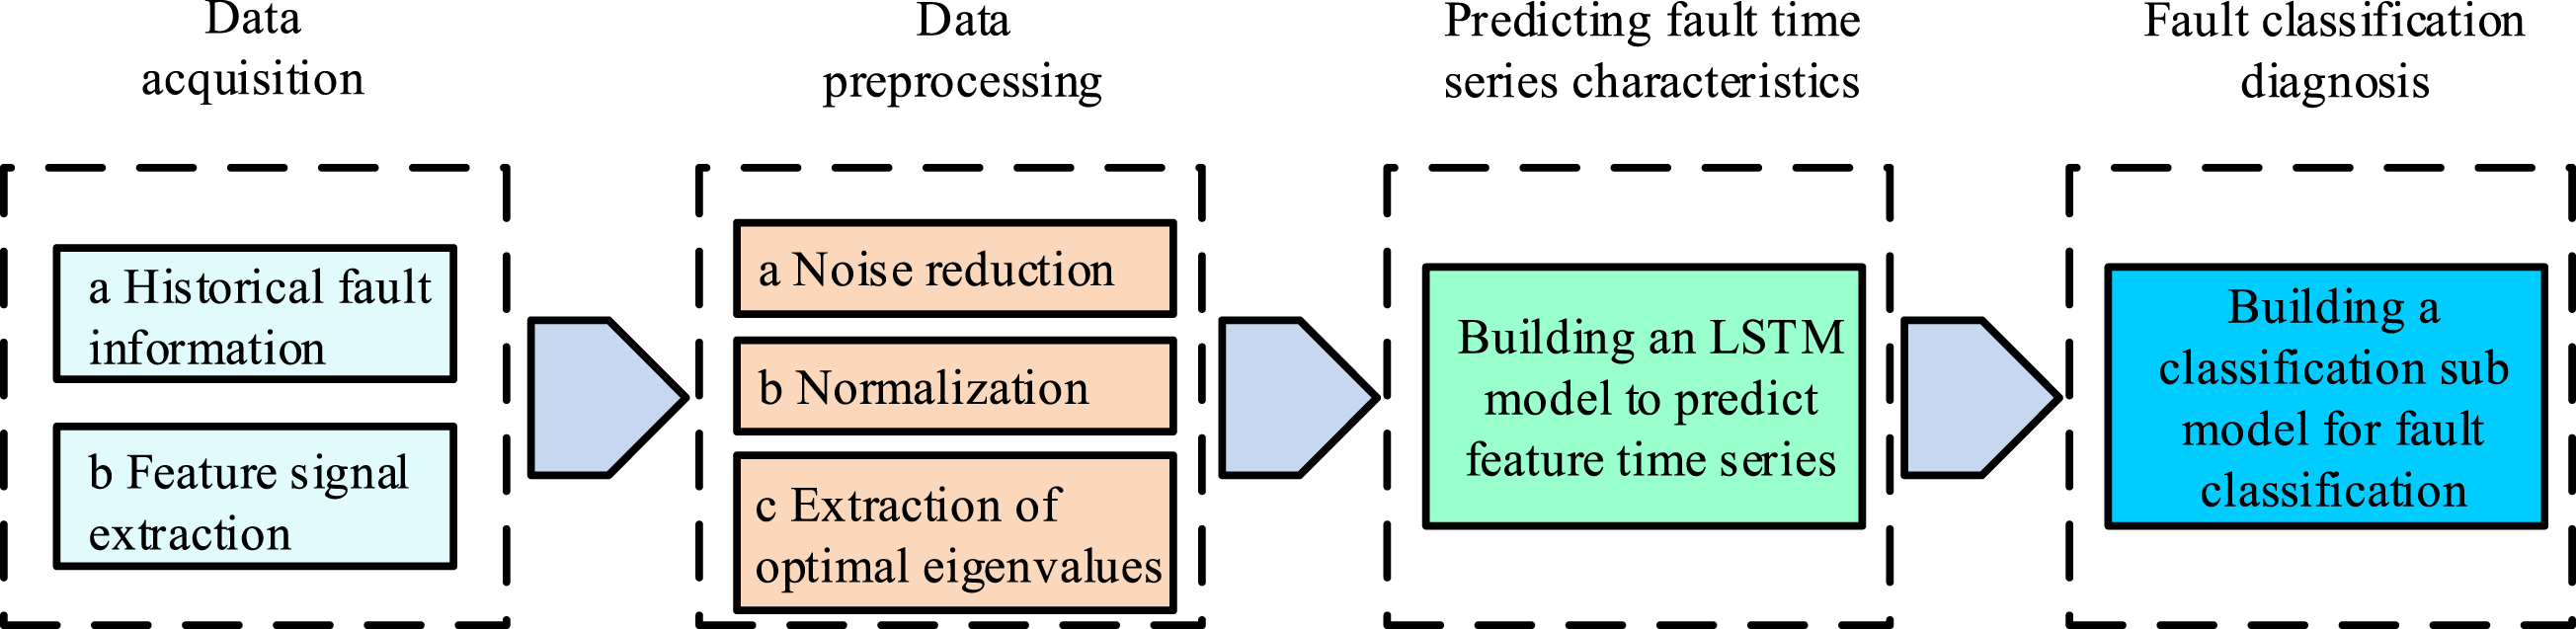
As shown in Figure 1, the whole fault early warning model is divided into four steps, namely, signal acquisition, signal preprocessing, prediction of fault time sequence characteristics, and signal classification diagnosis. First, the fault feature points are determined by collecting the fault information of the equipment. Then, aiming at noise problems and data chaos in original data, the preprocessing of noise reduction and normalization operations are carried out. PSO can extract optimal solution from feature data. Processed data are divided into training set and test set, and the time series analysis and prediction are carried out through LSTM. Therefore, it can complete the identification and classification of fault signals and achieve the role of medical equipment failure early warning.
Considering the complex working environment of medical equipment, the causes of equipment failure often come from the comprehensive influence of multiple factors. Therefore, to ensure multi-directional early warning of equipment failure, this experiment studies the use of sensors to sample and extract original equipment data, and analyzes the historical failure conditions to identify and collect the failure related indicators. Next, the raw data collected by various sensors are preprocessed.
In Figure 2, the image preprocessing part has three parts: signal denoising, normalization, and extraction of optimal feature data. The research adopts the box method for noise reduction, and the noise signal is generally divided into two types, namely, data loss and data mutation.
20
For missing data, the mean value of its adjacent data can be used to make up. For data mutation, it is necessary to locate the mutation data point first. The specific judgment formula (1) is as follows.
21
Data preprocessing flowchart.

In formula (1), 
In formula (2), Schematic diagram of PSO algorithm.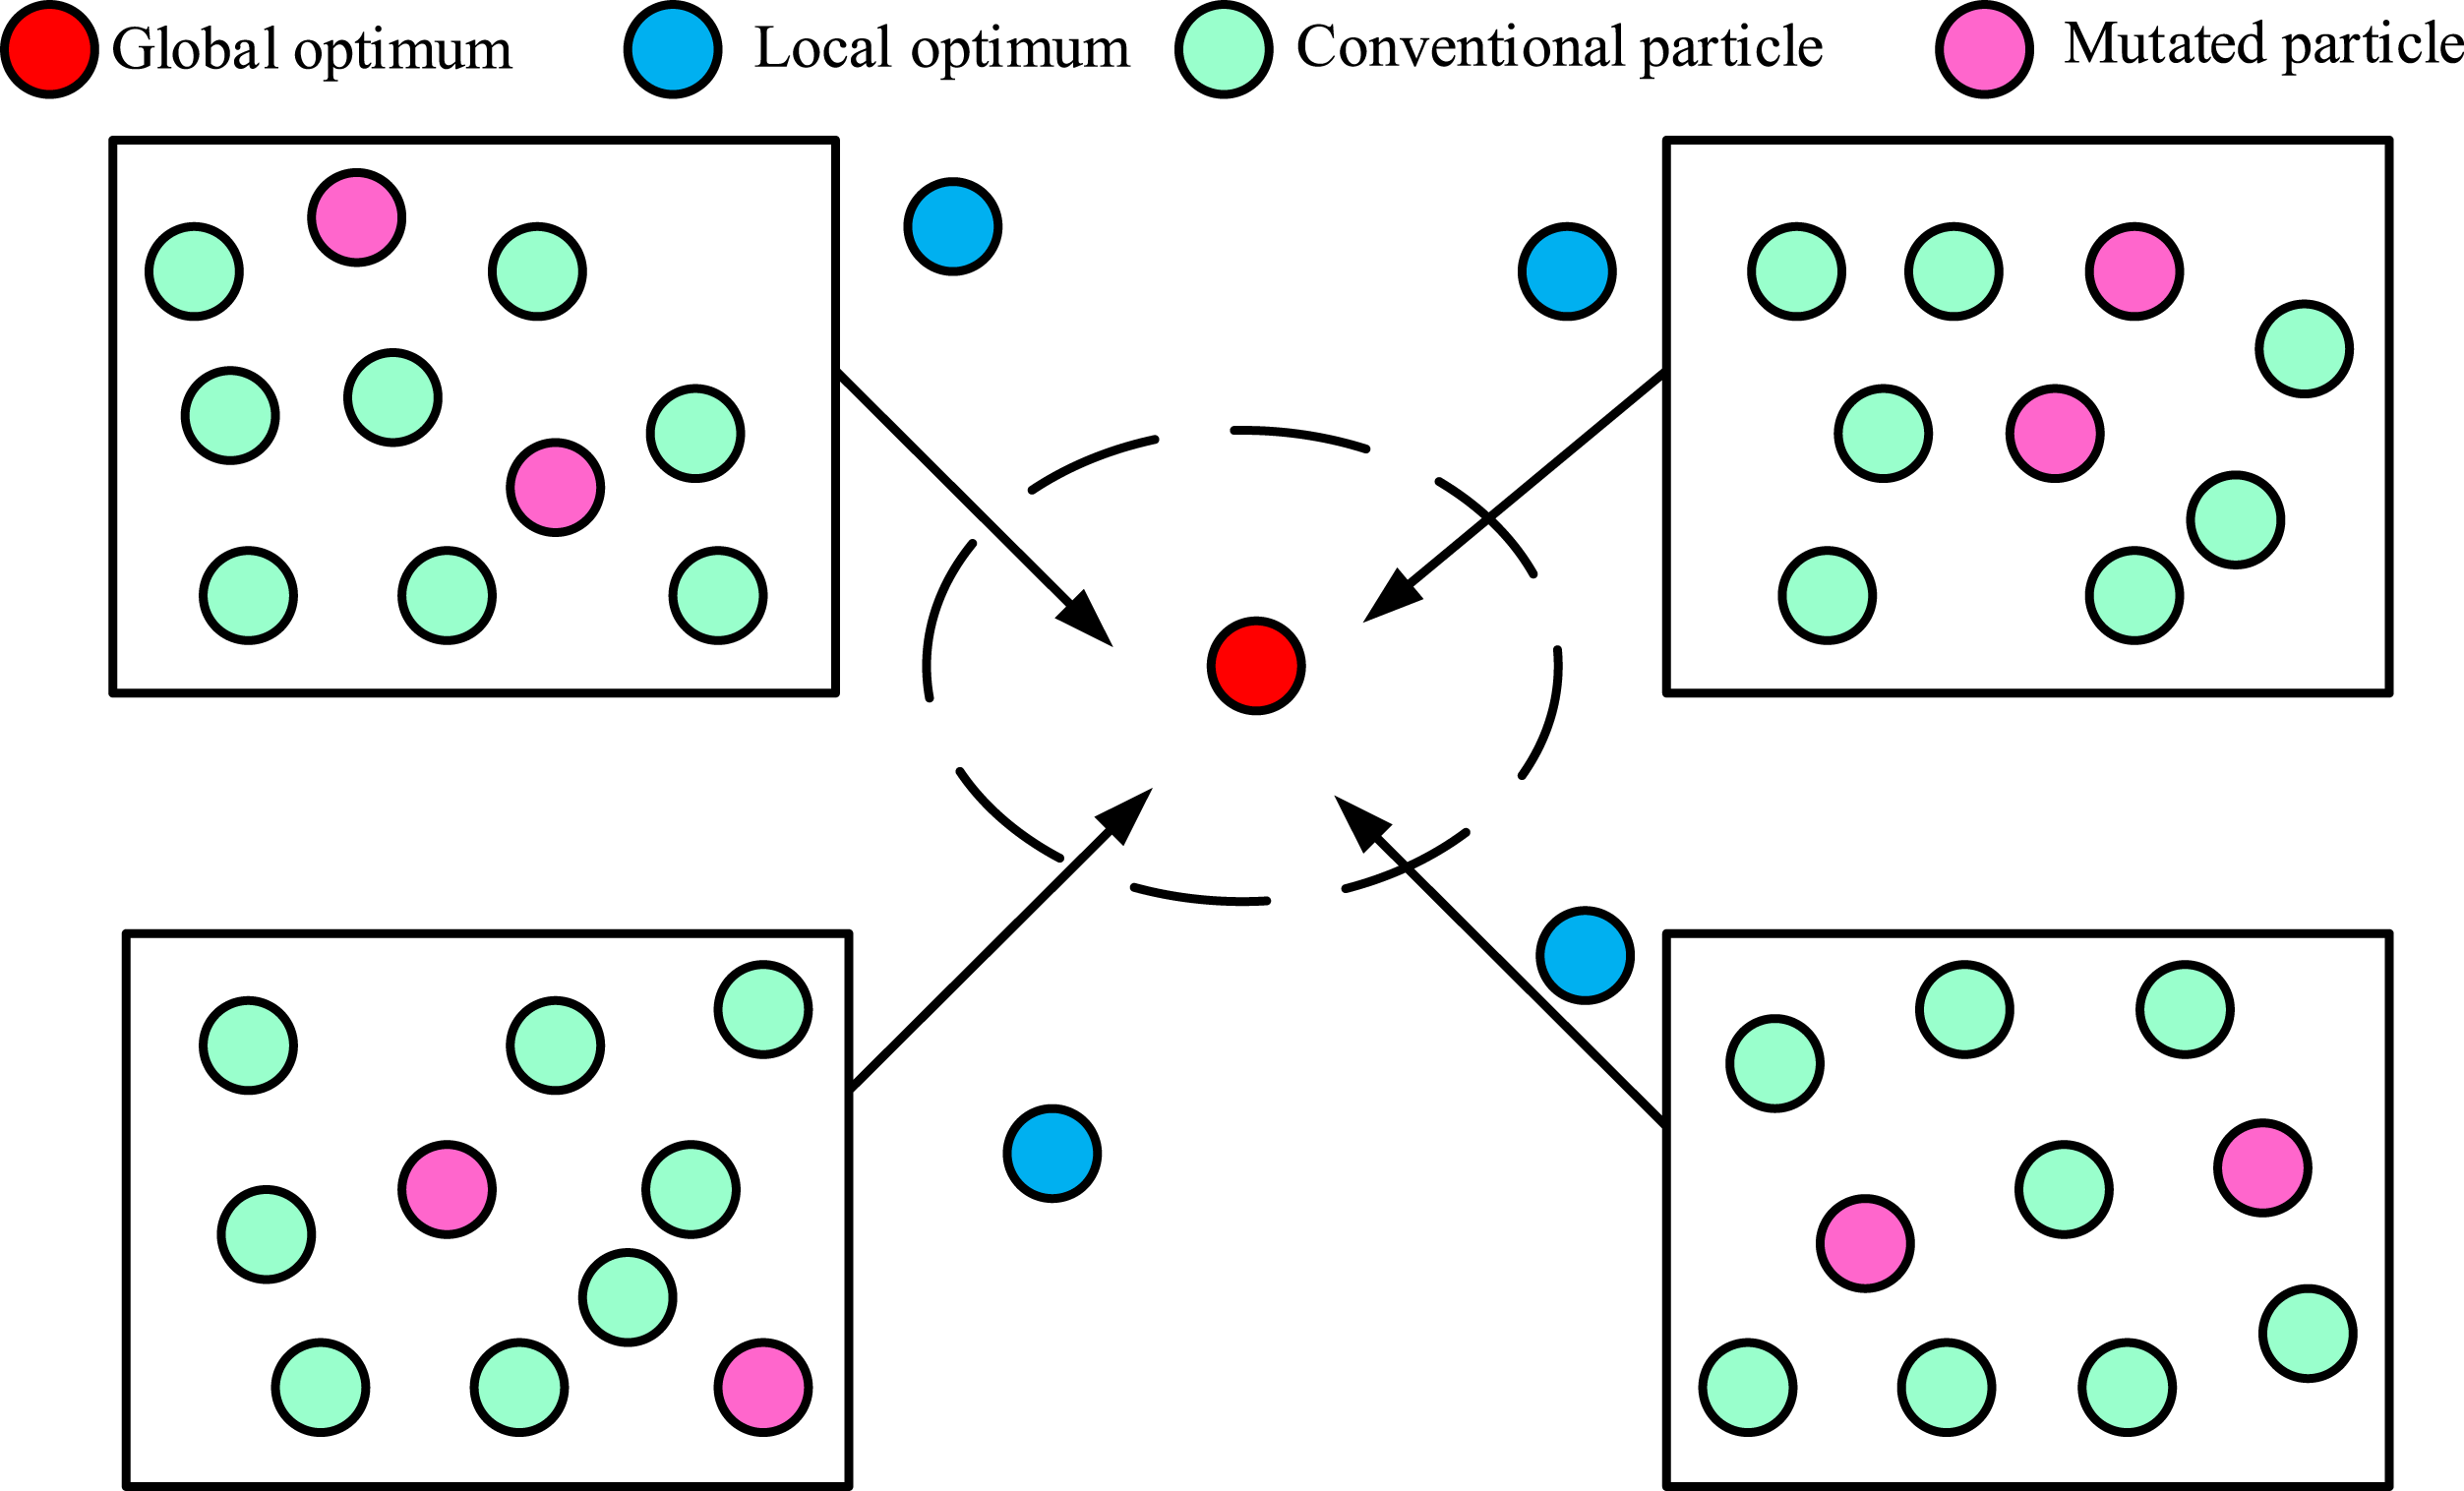
In Figure 3, the PSO algorithm follows a series of steps. It begins by initializing the original data and determining the size of the particle swarm and the maximum number of algorithm iterations. Each particle is assigned randomly generated speed and position attributes. The individual extreme values are then calculated, and the global optimal solution is obtained. Subsequently, the particle attributes are updated using the speed and position attributes to identify the global optimal solution position for each particle. Formula (3) represents the update calculation formula for the particle speed.
In formula (3), 
Next, the inertia weight 
In formula (5), 
Through the dynamic change of formula (6), the particles tend to the particle optimal solution in the early iteration process 
In formula (7), Flowchart of PSO algorithm.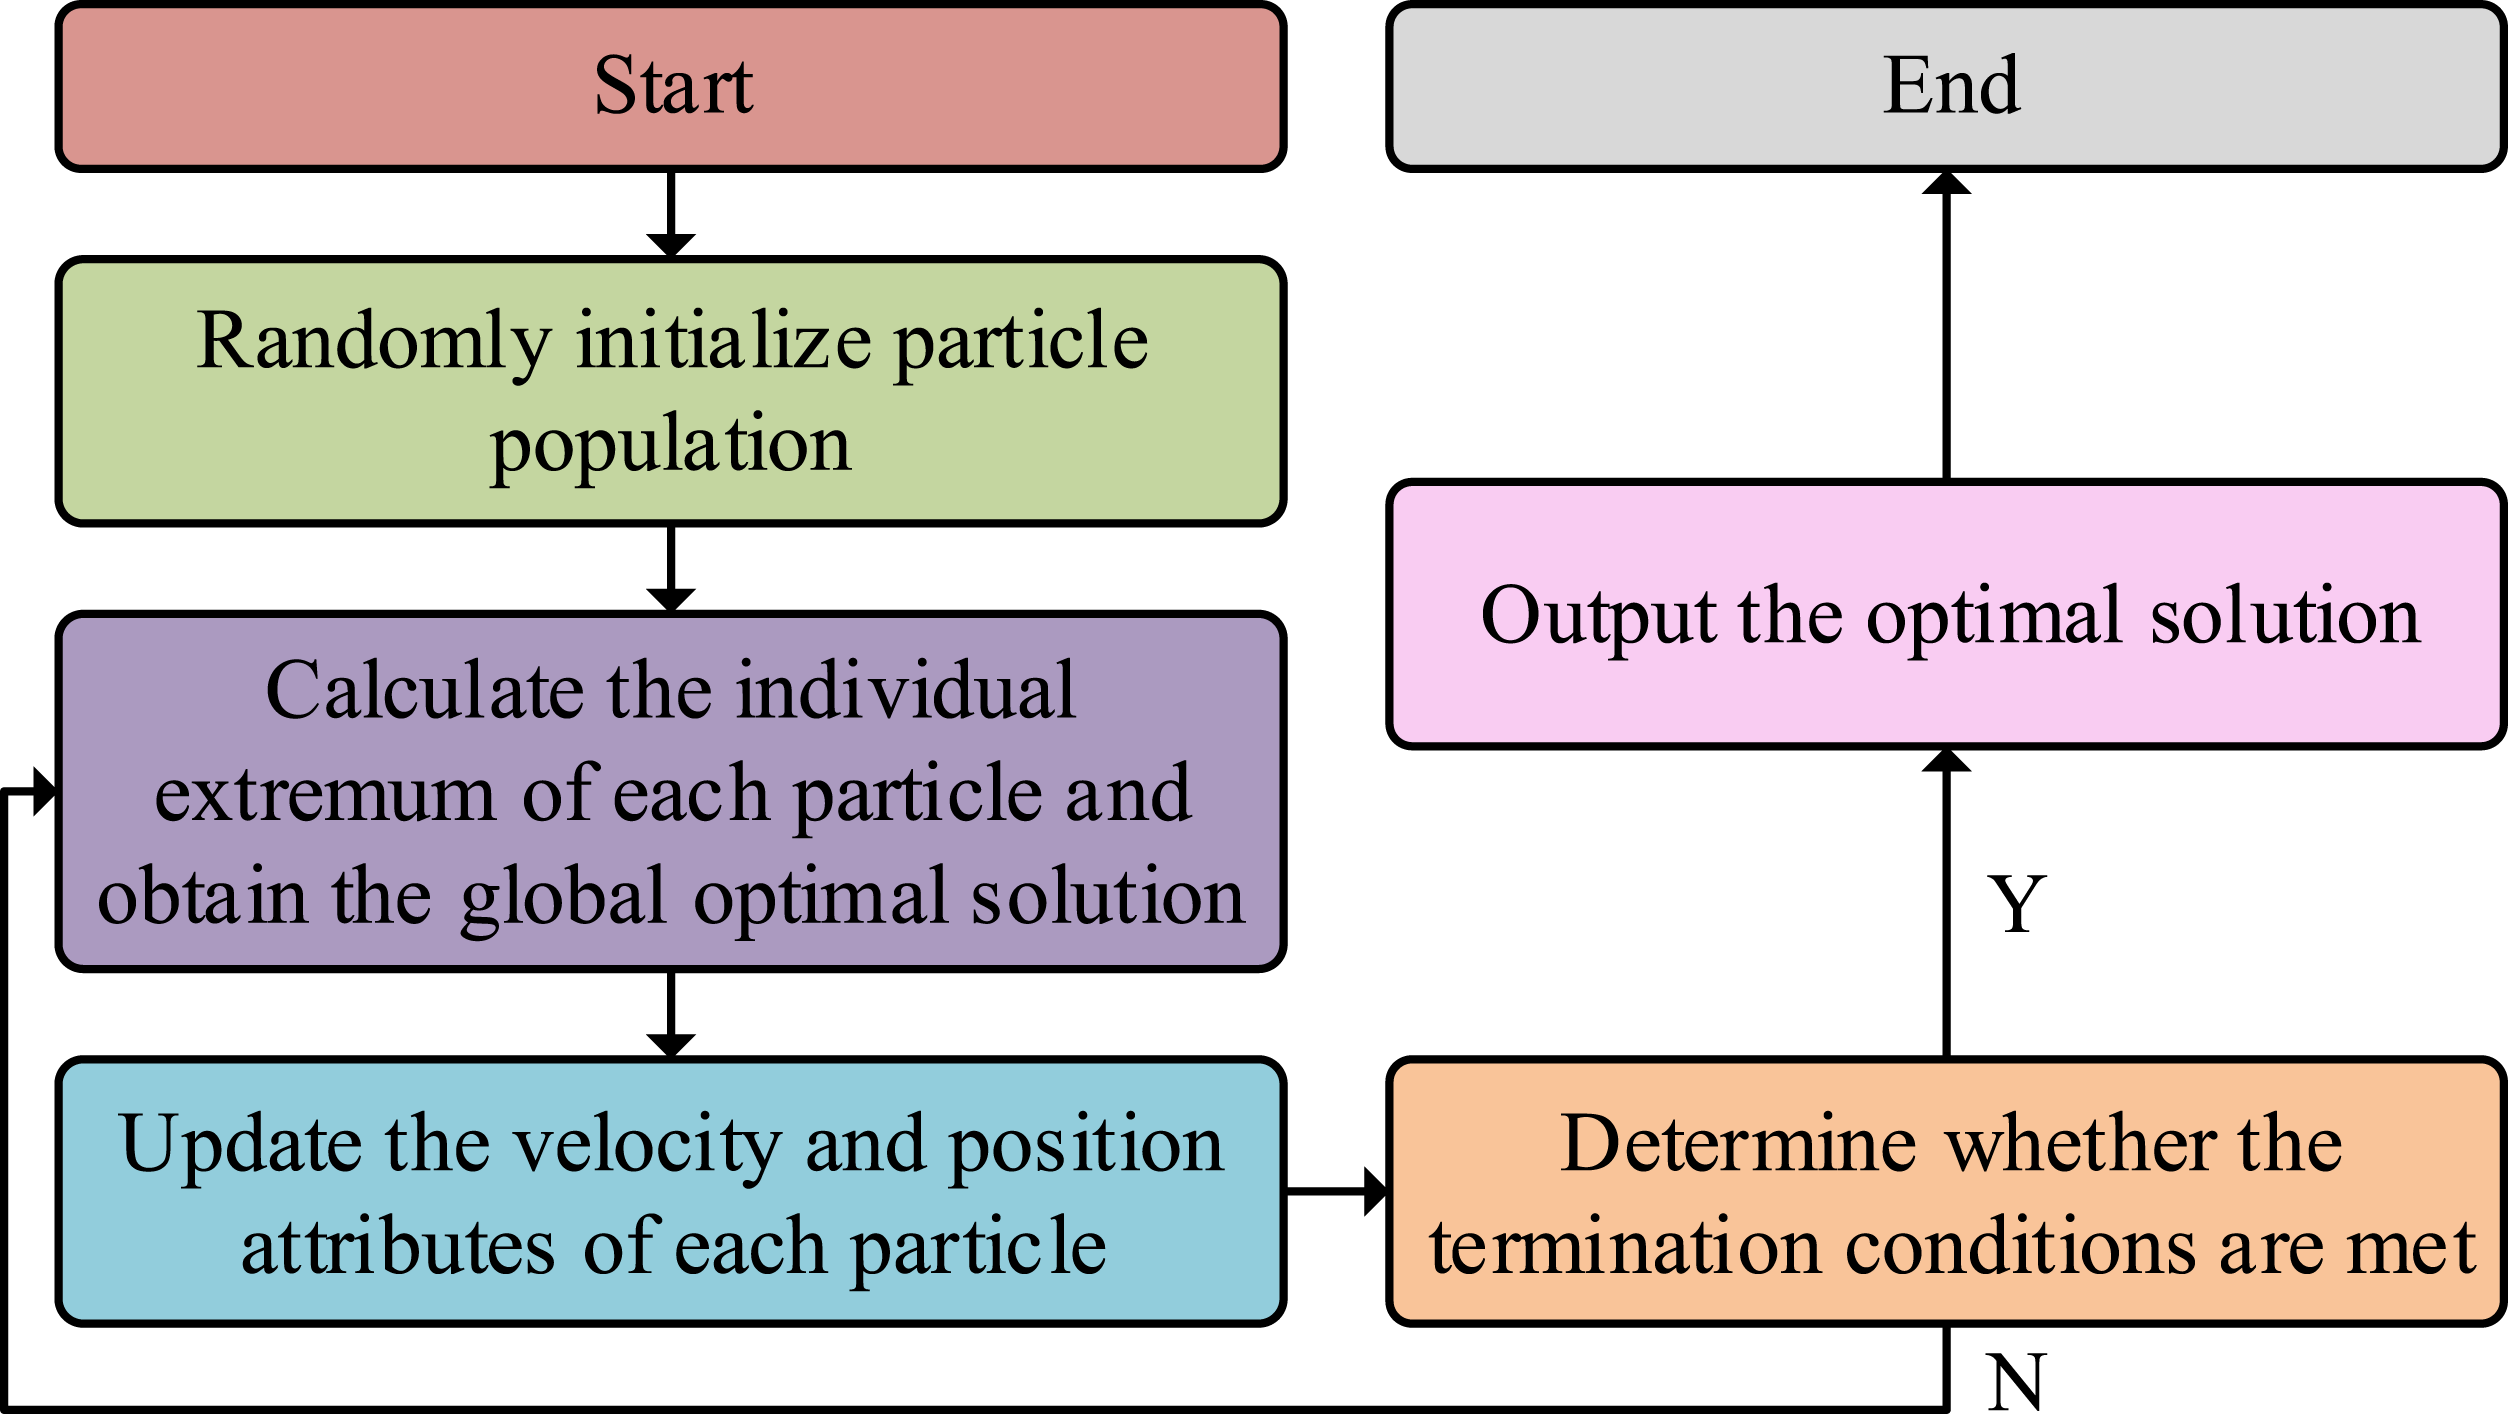
In Figure 4, the process of the PSO algorithm is mainly divided into four steps. The first step is to randomly initialize the particle population. The second step is to calculate the individual extremum of each particle and obtain the global optimal solution. The third step is to update the velocity and position attributes of each particle. The fourth step is to ascertain whether the termination condition has been satisfied. If the optimal solution is deemed satisfactory, it should be outputted and the process concluded. Otherwise, the second step should be revisited.
Medical infrared imager equipment failure warning model construction
This study uses PSO and LSTM to build an equipment fault prediction model, obtains the optimal value of the original data characteristic signal through the PSO algorithm, and uses the LSTM prediction model to complete the prediction and classification of the characteristic signal to achieve the medical equipment fault early warning function. The study demonstrates the optimization of feature signal values using the PSO algorithm. Now, the study will construct a fault warning model based on LSTM. LSTM uses gate design to store effective information for a long time, reducing feature loss and avoiding gradient disappearance and explosion. It performs better in predictive analysis that relies on long-term sequence data. The working principle of the equipment fault early warning model by LSTM is shown in Figure 5.
In Figure 5, the whole prediction has two parts, the PSO algorithm and the LSTM algorithm. For the selection of hyperparameters in PSO algorithm, the study will compare the fitness values of different combinations of hyperparameters through experiments. In addition, for the hyperparameters of LSTM, the study selects the softsign activation function and solves the training loss function through matrix multiplication. The LSTM algorithm is evolved from RNN. As a common deep learning network, the RNN not only has memory but also can share parameters.
22
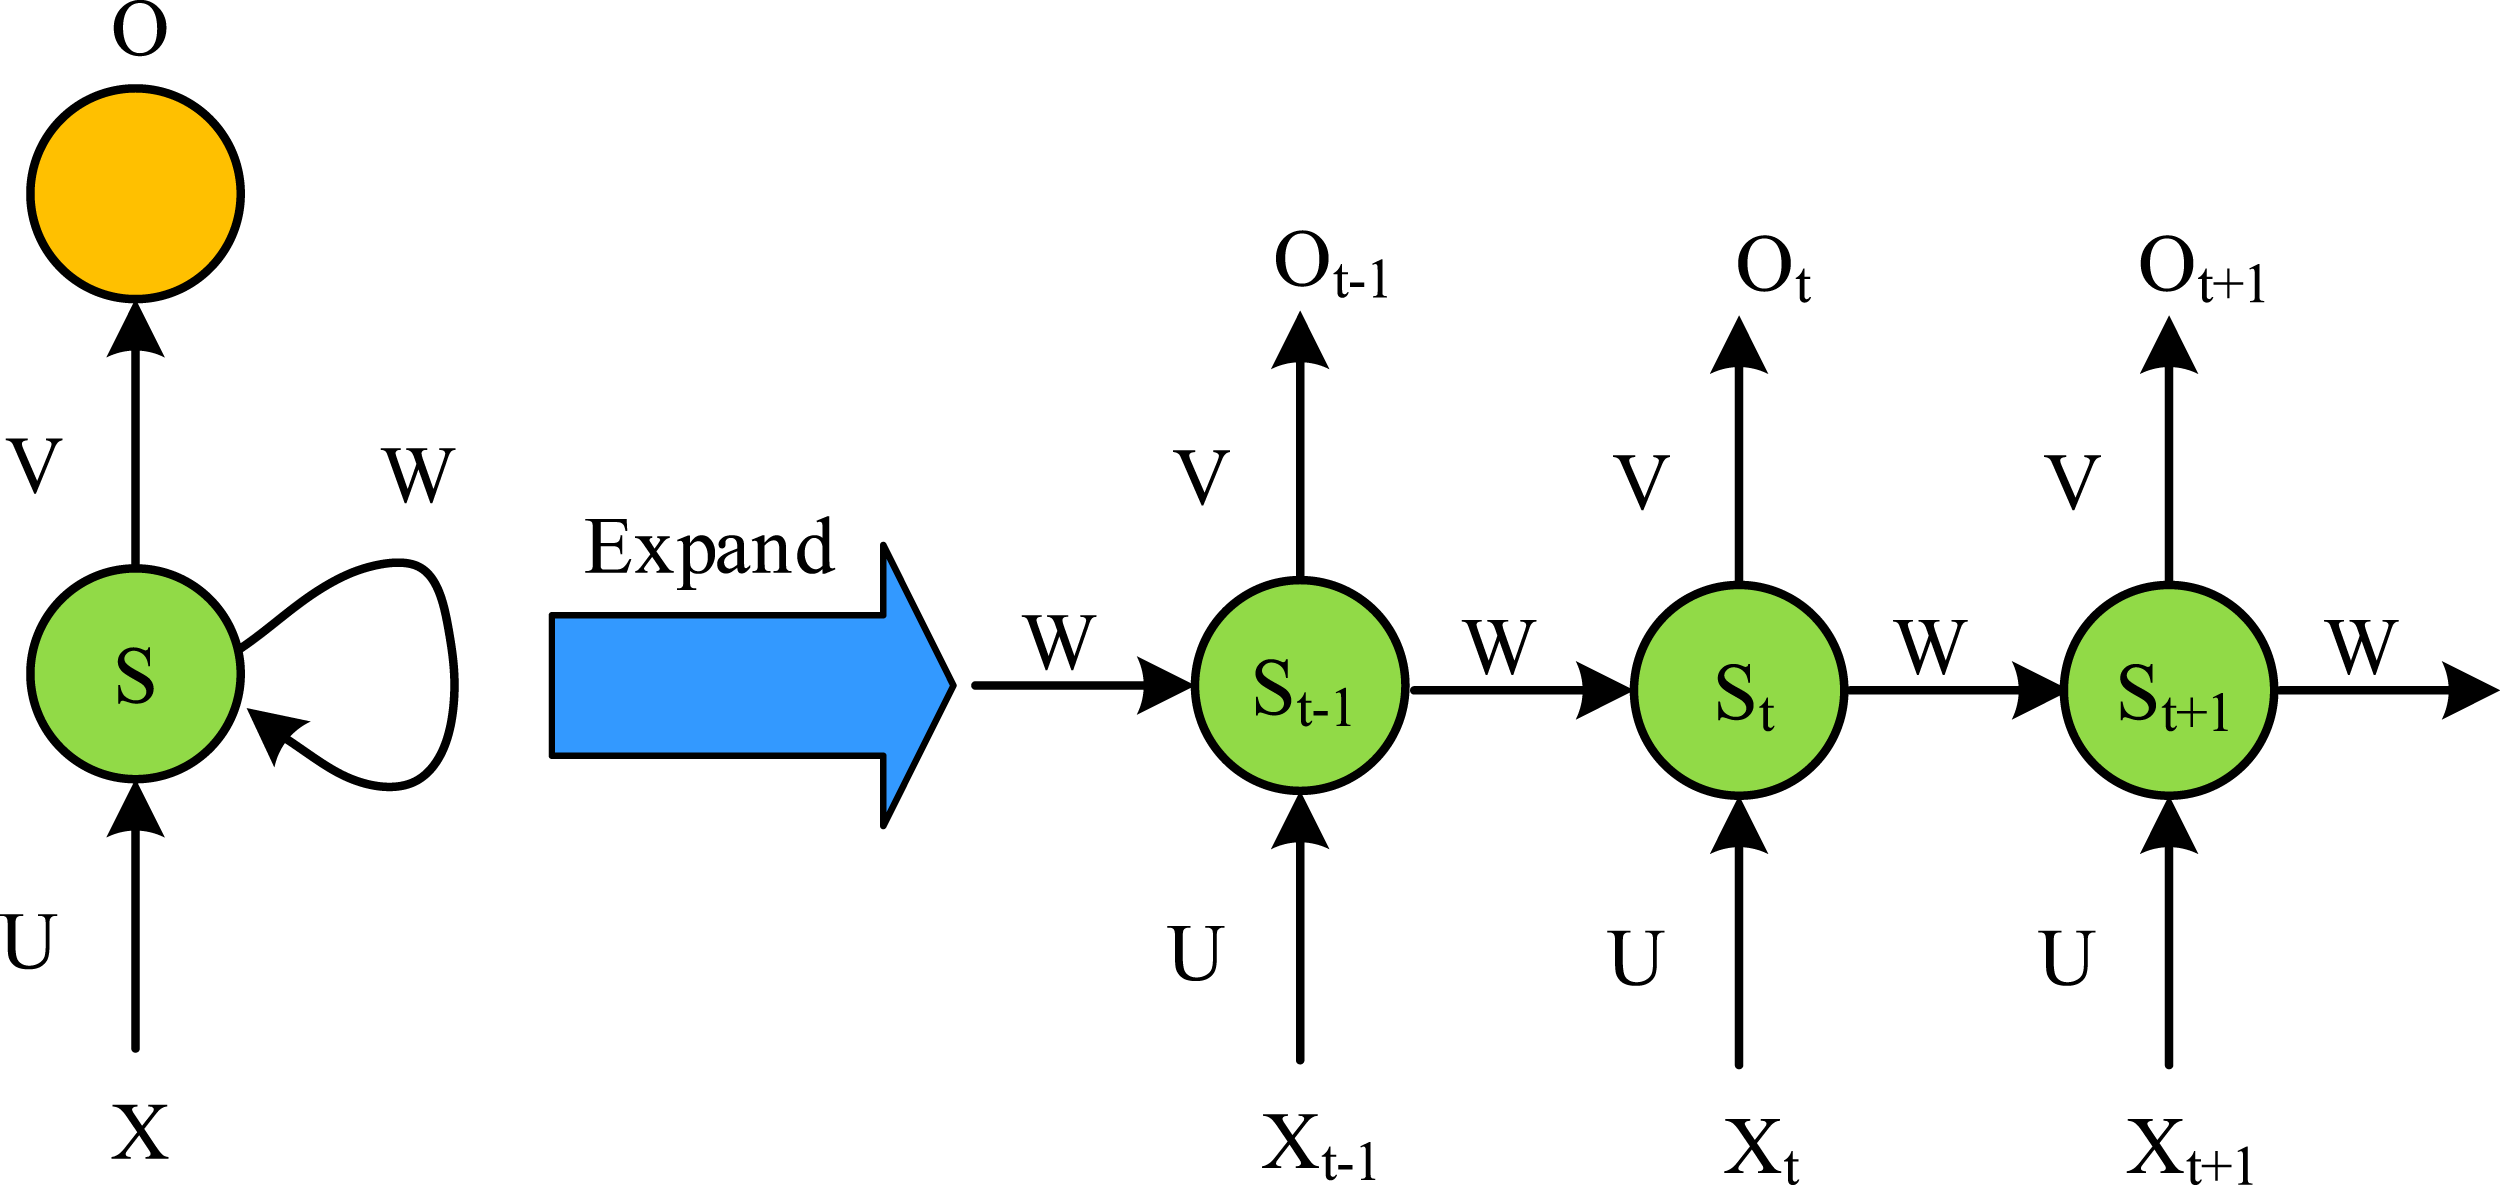
It can recognize and analyze past memories and process and transmit information in the form of a chain link. This makes it very suitable for processing nonlinear data features based on sequences. RNN has input, hidden, and output layers. Working principal diagram of LSTM warning model.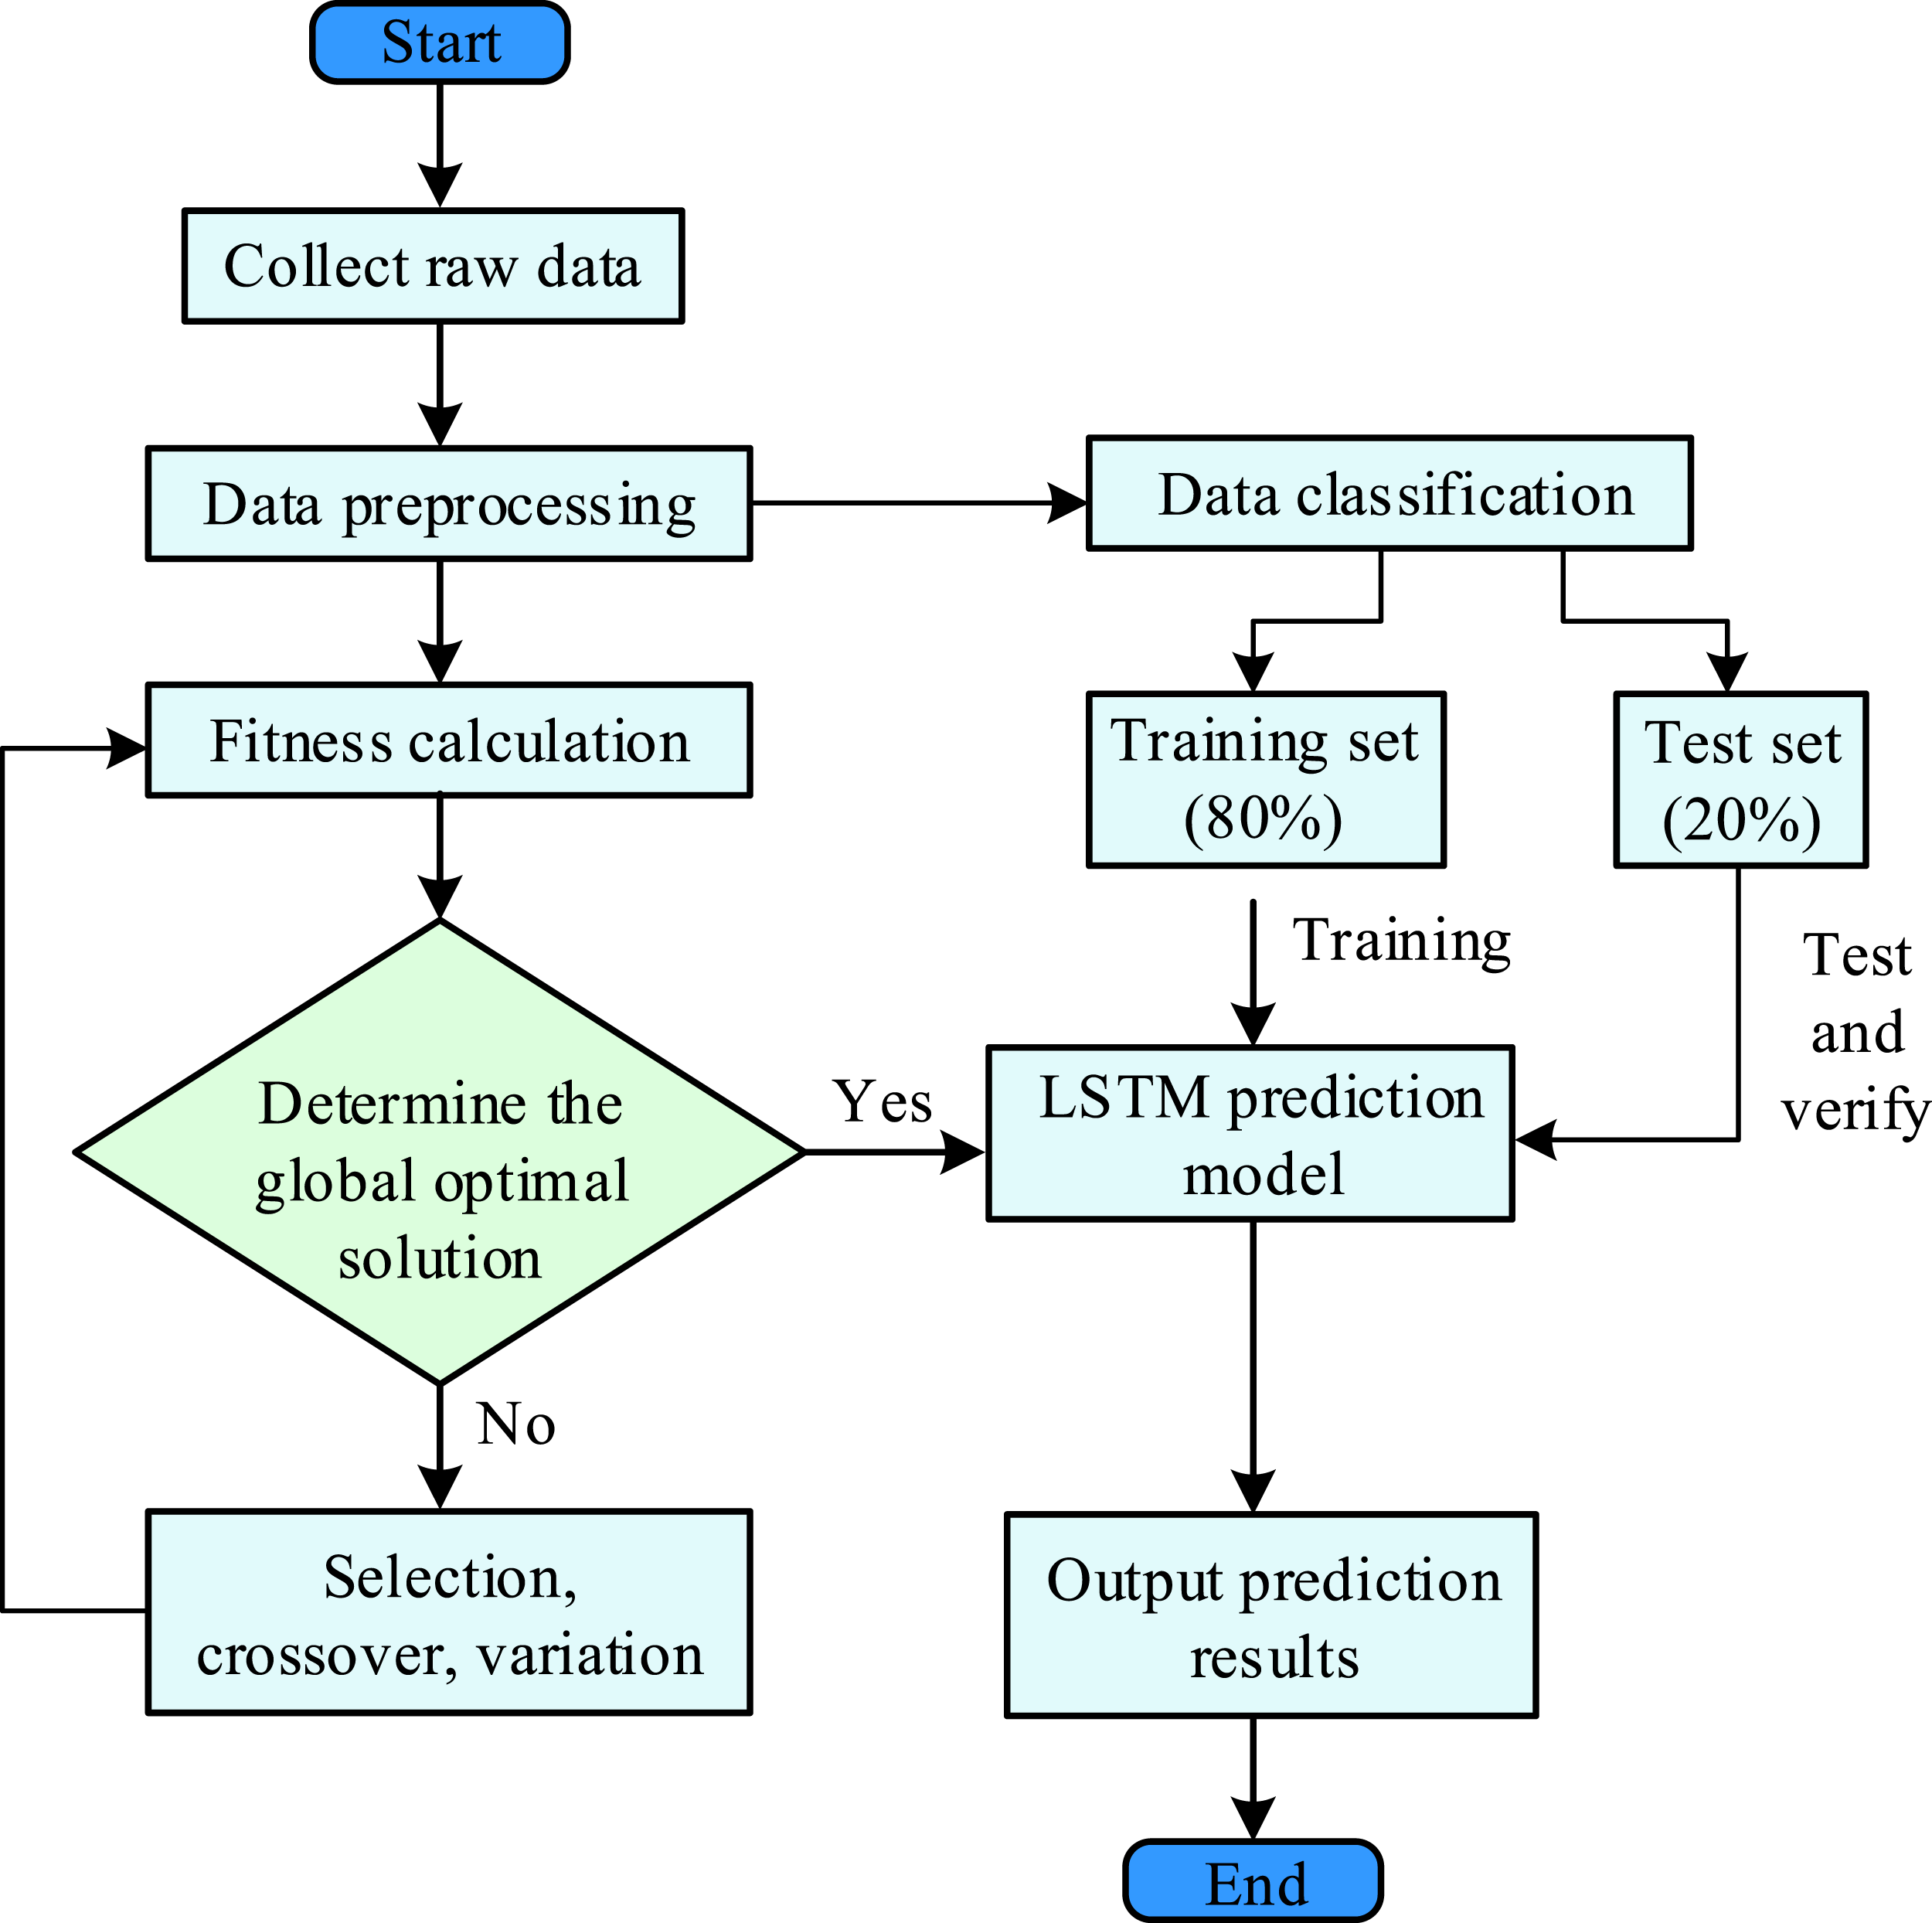
As shown in Figure 6, RNN network structure expansion diagram.
In formula (8), 
In formula (8), Schematic diagram of LSTM cell structure.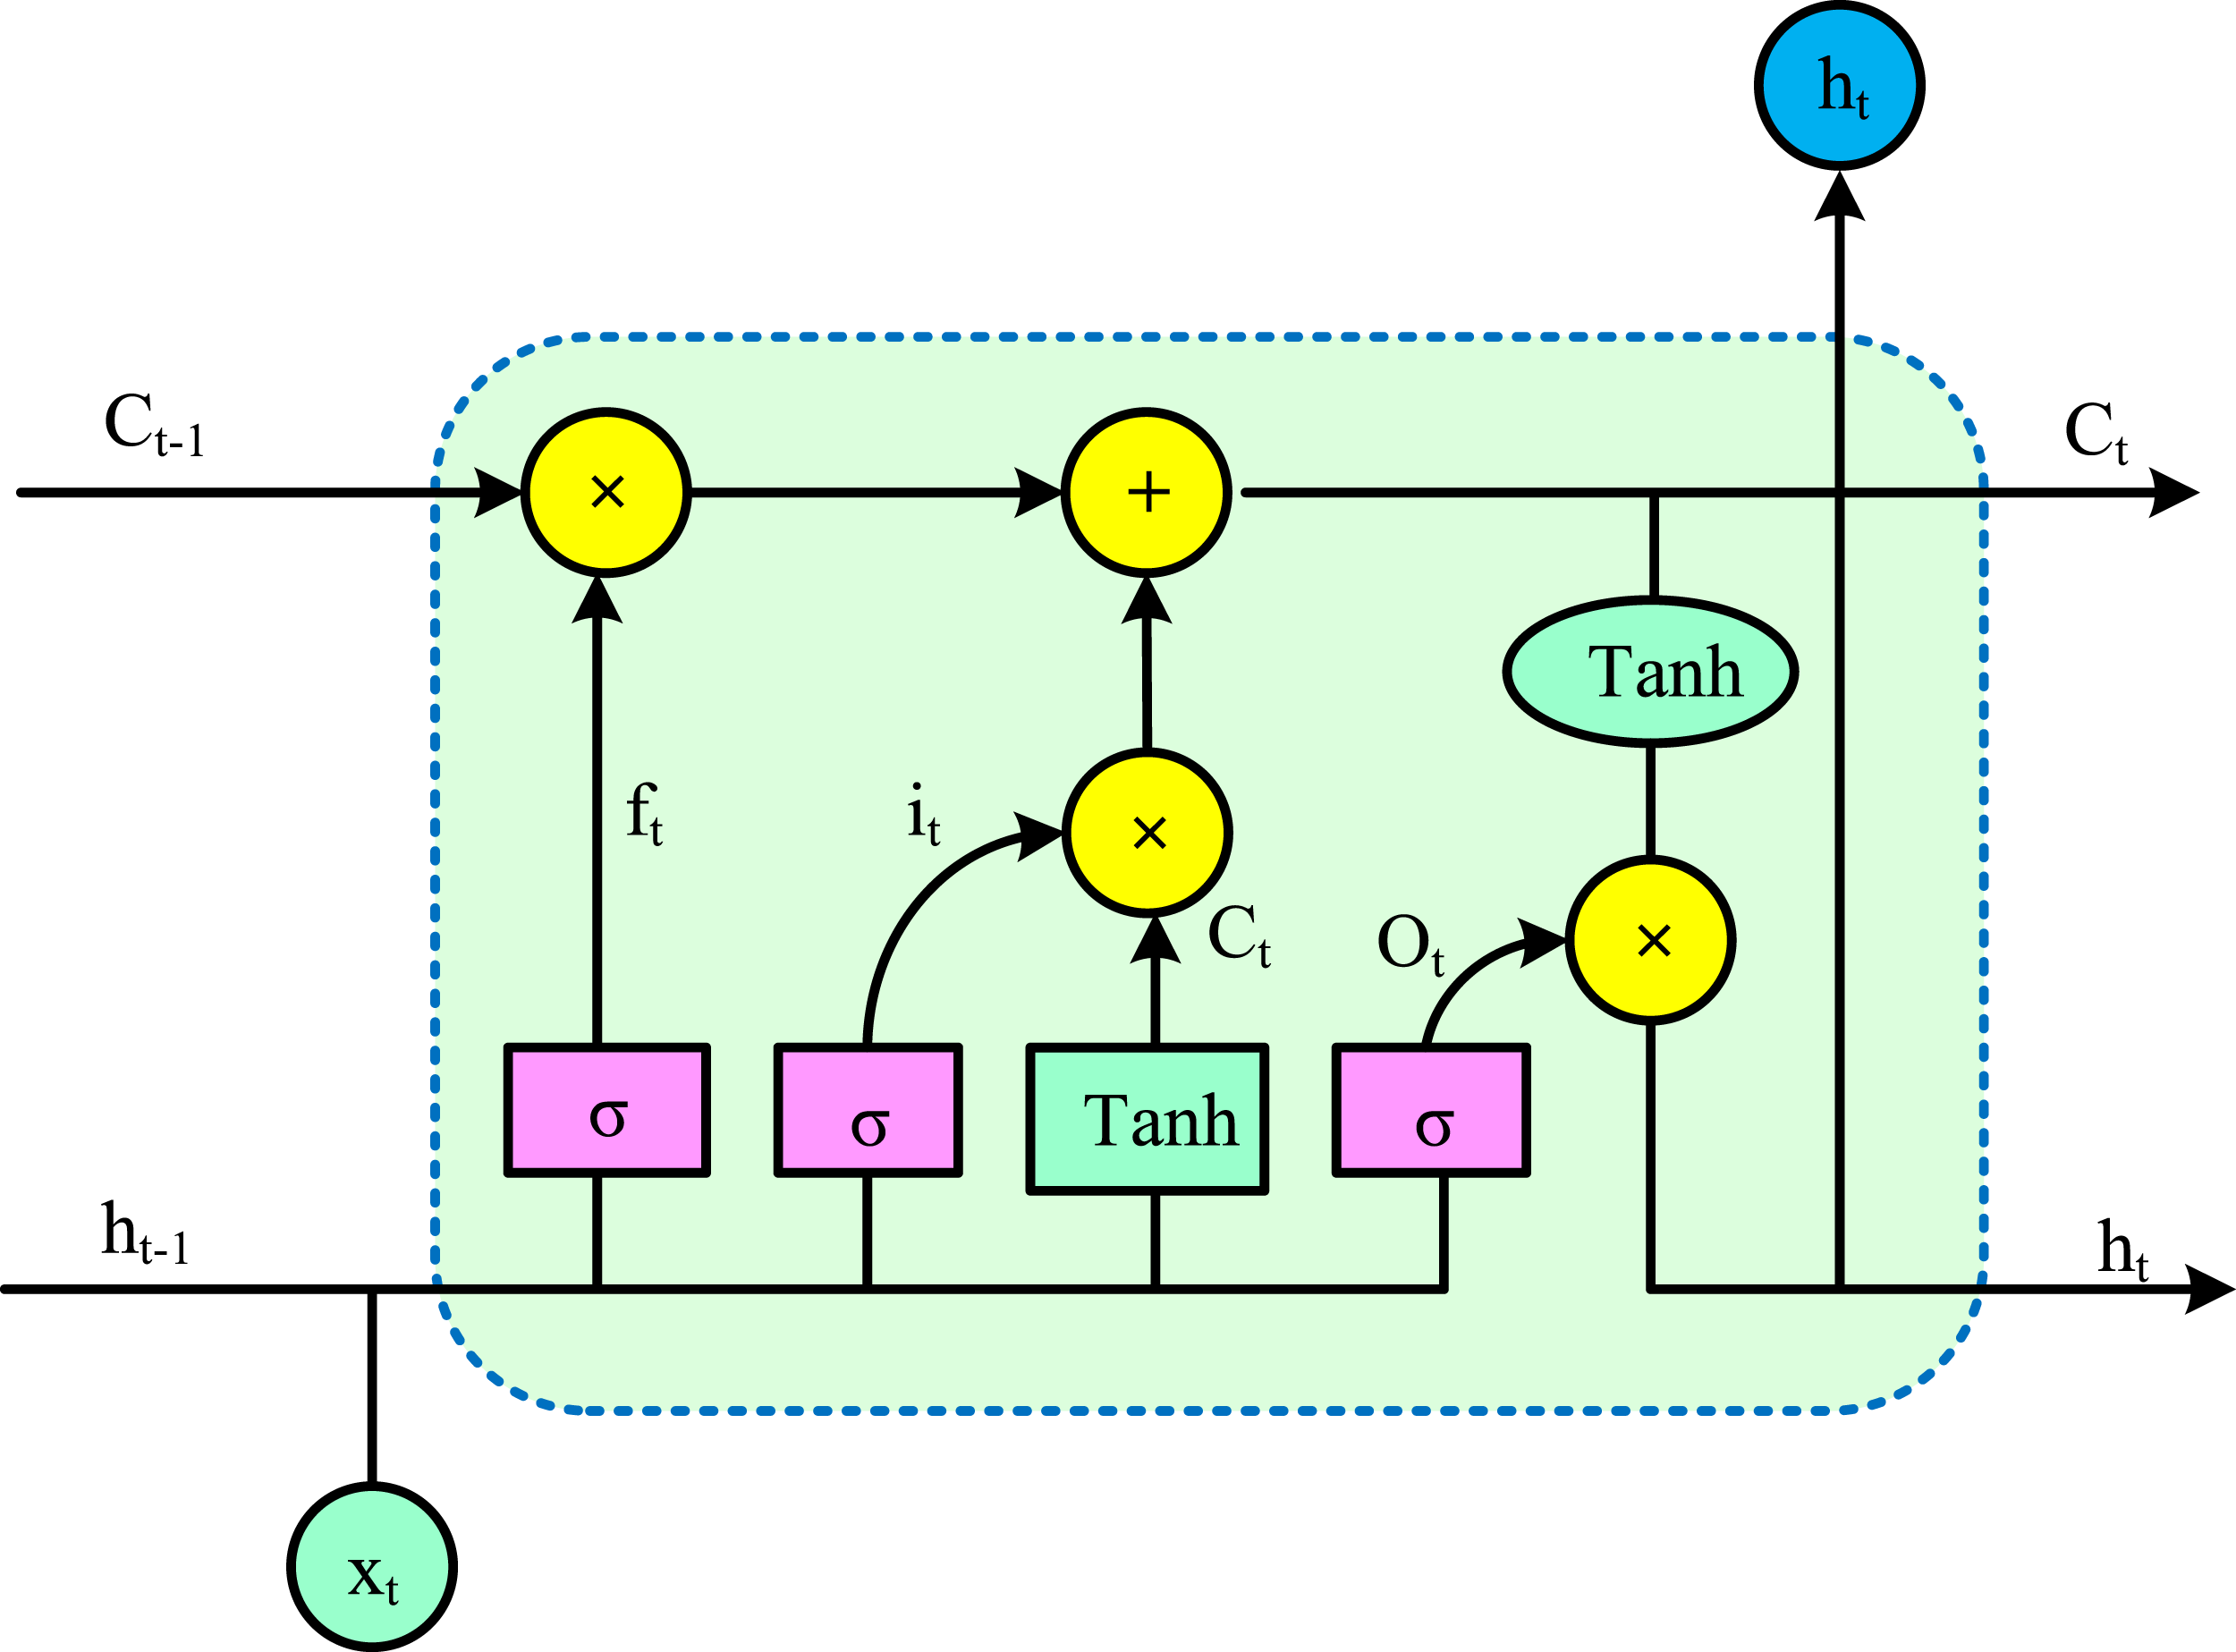
As shown in Figure 7, 
As shown in formula (10), the forgetting gate determines the number of cells retained in the input vector. 
In formula (11), 
Formula (12) 
In formula (13), 
In formula (14), 
Numerical experiments
Taking the medical infrared thermal imager equipment of a hospital as an example, the performance test of the tmt-9000b equipment fault early warning model is carried out. The main parameters include the working band of 8–14 um, the input voltage range of 5–12 v, the imaging distance of 0.5–3 m, the ambient temperature of 10–30°C, the temperature measurement range of 30–42°C, and the temperature measurement accuracy of <0.4°C.
To validate the performance of the fault warning model designed in the study, the data required for performance validation is collected first. When collecting raw data, the study follows the collection method of Minghui et al. 26 The research adopts two ways of sensor and USB interface to collect original signal data, and collects raw data on the operating status of the device from June 2022 to December 2022. Finally, 26357 data are obtained. The cross-validation method used in the experiment is simple cross-validation, which directly divides the dataset into a training set and a validation set. The most commonly utilized partitioning ratios for datasets include 8:1:1, 7:3, 6:2:2, 98:1:1, and so forth. The specific ratio employed is contingent upon the size of the dataset and the requirements of the machine learning project. When the dataset size is small, a ratio of 7:3 or 8:2 is usually used to divide it into training and testing sets. Due to the fact that the raw data used in the experiment is collected by oneself and the quantity is relatively small, the original data is split into a training set and a test set in an 8:2 ratio. Specifically, the training set consists of 21,085 data points, while the test set contains 5,272 data points. In addition to the previously mentioned TMT-9000B medical thermal imaging camera device, temperature sensors, voltage sensors, and current sensors are used in the acquisition of data. These sensors are installed in key parts of the medical infrared camera and are used to monitor the operational status of the device in real time. Additionally, to obtain historical fault labels, the study examines equipment maintenance records containing information such as the time and type of equipment failure and the repair measures taken. The study also invites domain experts to annotate these data. Among the 21085 data collected in the study, the data types are all medical infrared thermal imaging equipment operation status data. Each sample contains 16 key parameters such as temperature, voltage, current, imaging distance, and ambient temperature during equipment operation, with a data size of approximately 2.5 GB.
Next, noise reduction and normalization are performed on the original data, and the comparison between the original signal and noise reduction waveform is shown in Figure 8. Figure 8(a) shows the waveform of the original signal, while Figure 8(b) shows the waveform after denoising. As shown in Figure 8, in the original signal, the waveform vibration amplitude is relatively large. For example, the average waveform vibration amplitude interval1,9 in the first 4 seconds of the original signal is calculated to be 5.46. Whereas, the average waveform vibration amplitude interval in the first 4 seconds of the denoised waveform is [4, 6], and the average waveform is 5.23. In Figure 8, the trend of the waveform and the positions of inflection points are roughly the same before and after noise reduction. Therefore, it can be concluded that the study of noise reduction methods can reduce the interference of noise on the premise of ensuring original data characteristics. Additionally, combining amplitude and data calculations reveals that the original signal’s signal-to-noise ratio is 28.5 dB, with an information entropy of 0.92. After denoising, however, the signal-to-noise ratio increases to 41.1 dB, while the information entropy decreases to 0.70. This also indicates that denoising effectively suppresses noise and enhances signal regularity. Comparison between original signal and denoised waveform.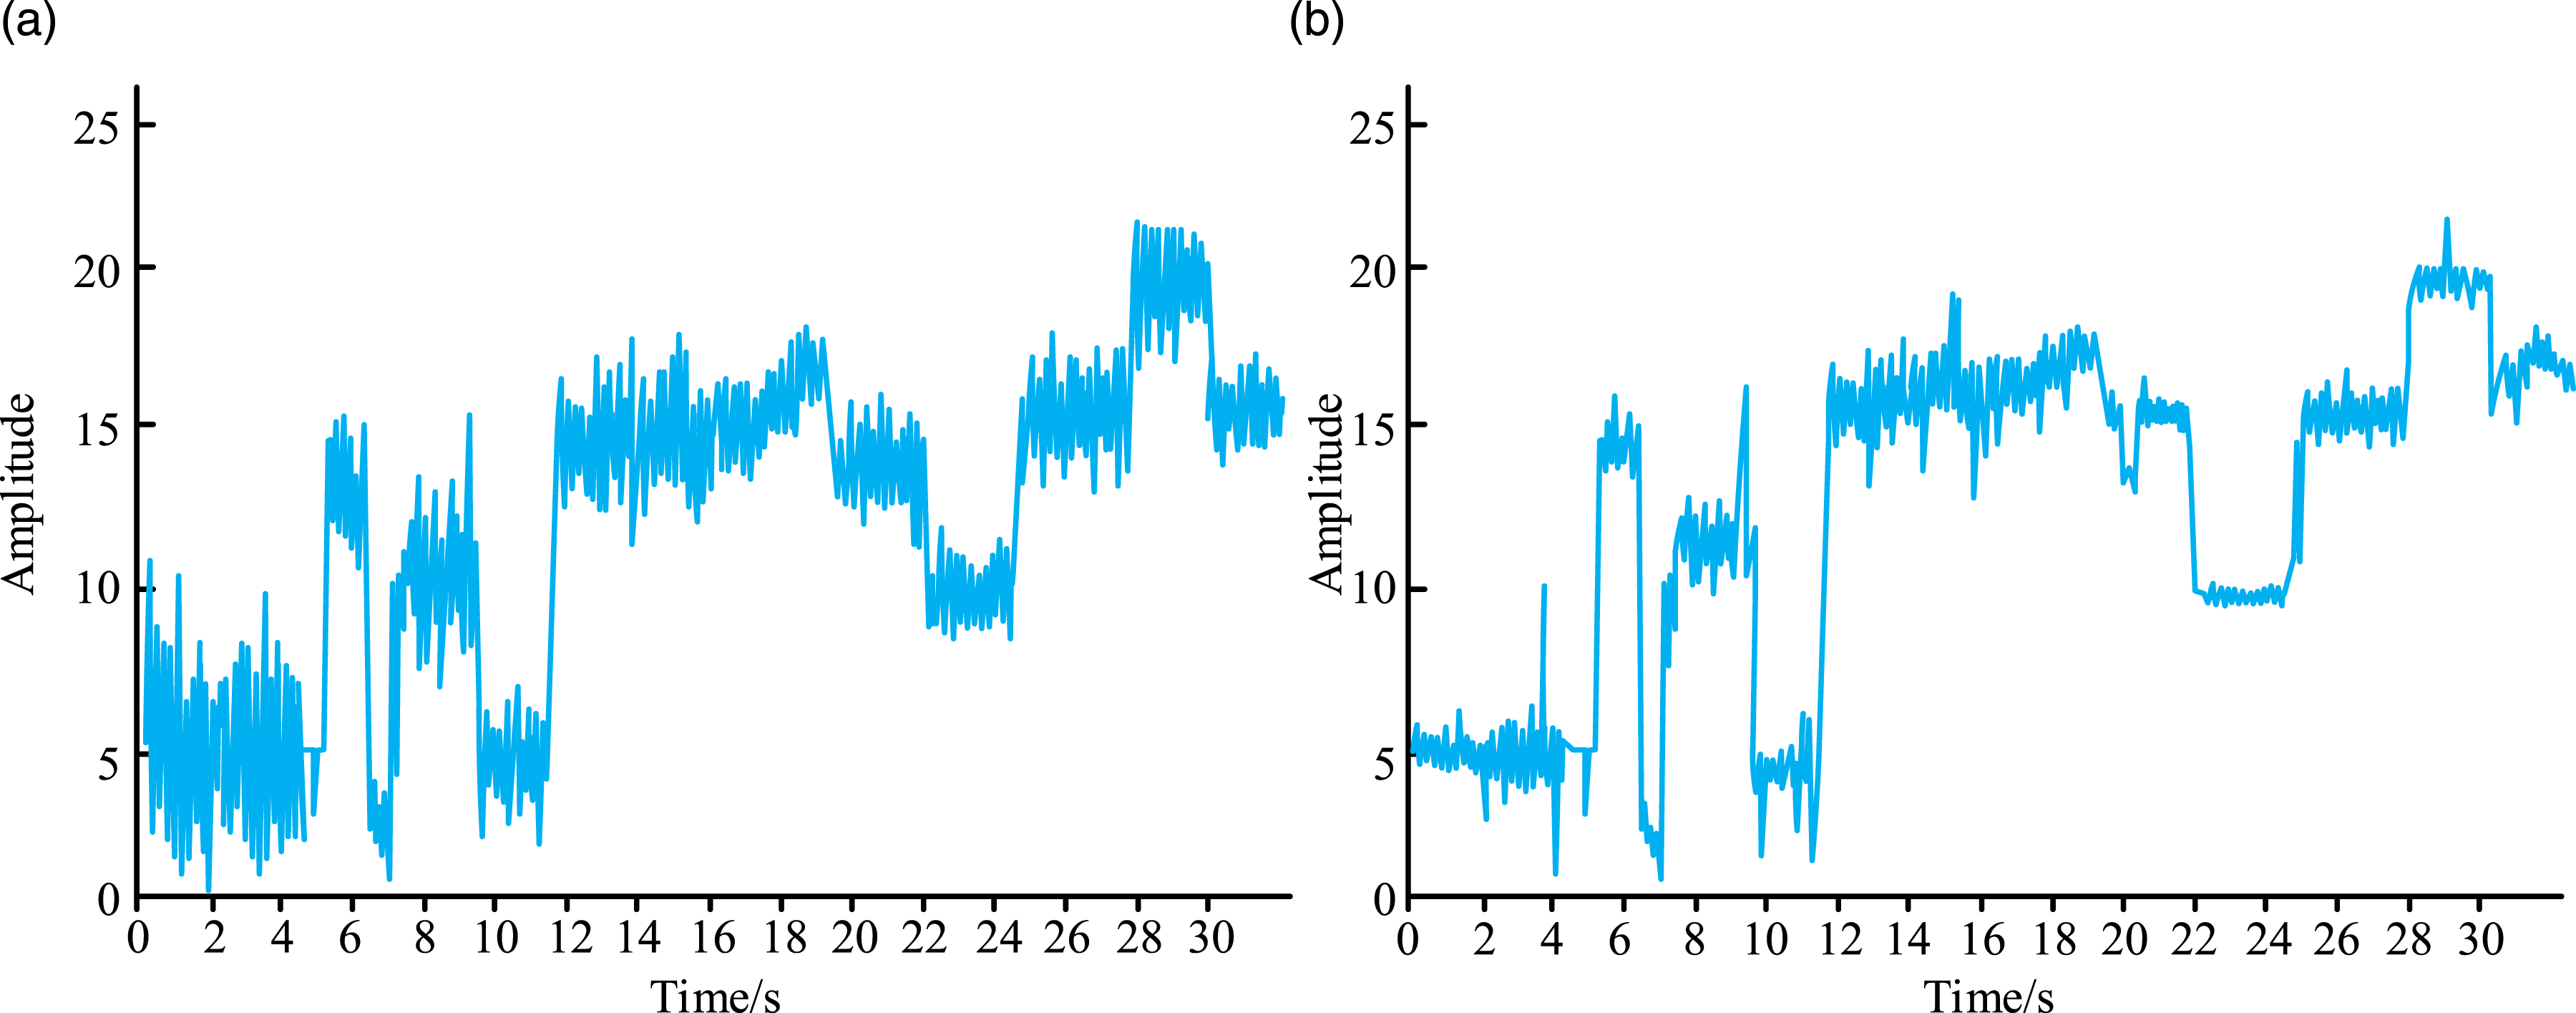
Next, the study normalizes the original data after noise reduction according to a certain proportion to make its wave value range within the [0, 1] range. Taking the measured temperature as an example, the normalized results of the measured temperature characteristic data are shown in Figure 9. As shown in Figure 9, the temperature measured in the previous 10 seconds is taken as an example. In Figure 9(a), excluding the time of the 0th second, the Maximum and Minimum Values (MMV) of the original data in the first 10 seconds are 40.3 and 34.2, respectively. The results after normalization are shown in Figure 9(b). At this time, the data MMV in the first 10 seconds is 1.00 and 0.29, respectively. Thus, the results are distributed in the range of [0, 1], which greatly reduces calculation and improves operation efficiency on the premise of ensuring operation accuracy. Comparison of normalized results of temperature characteristic data.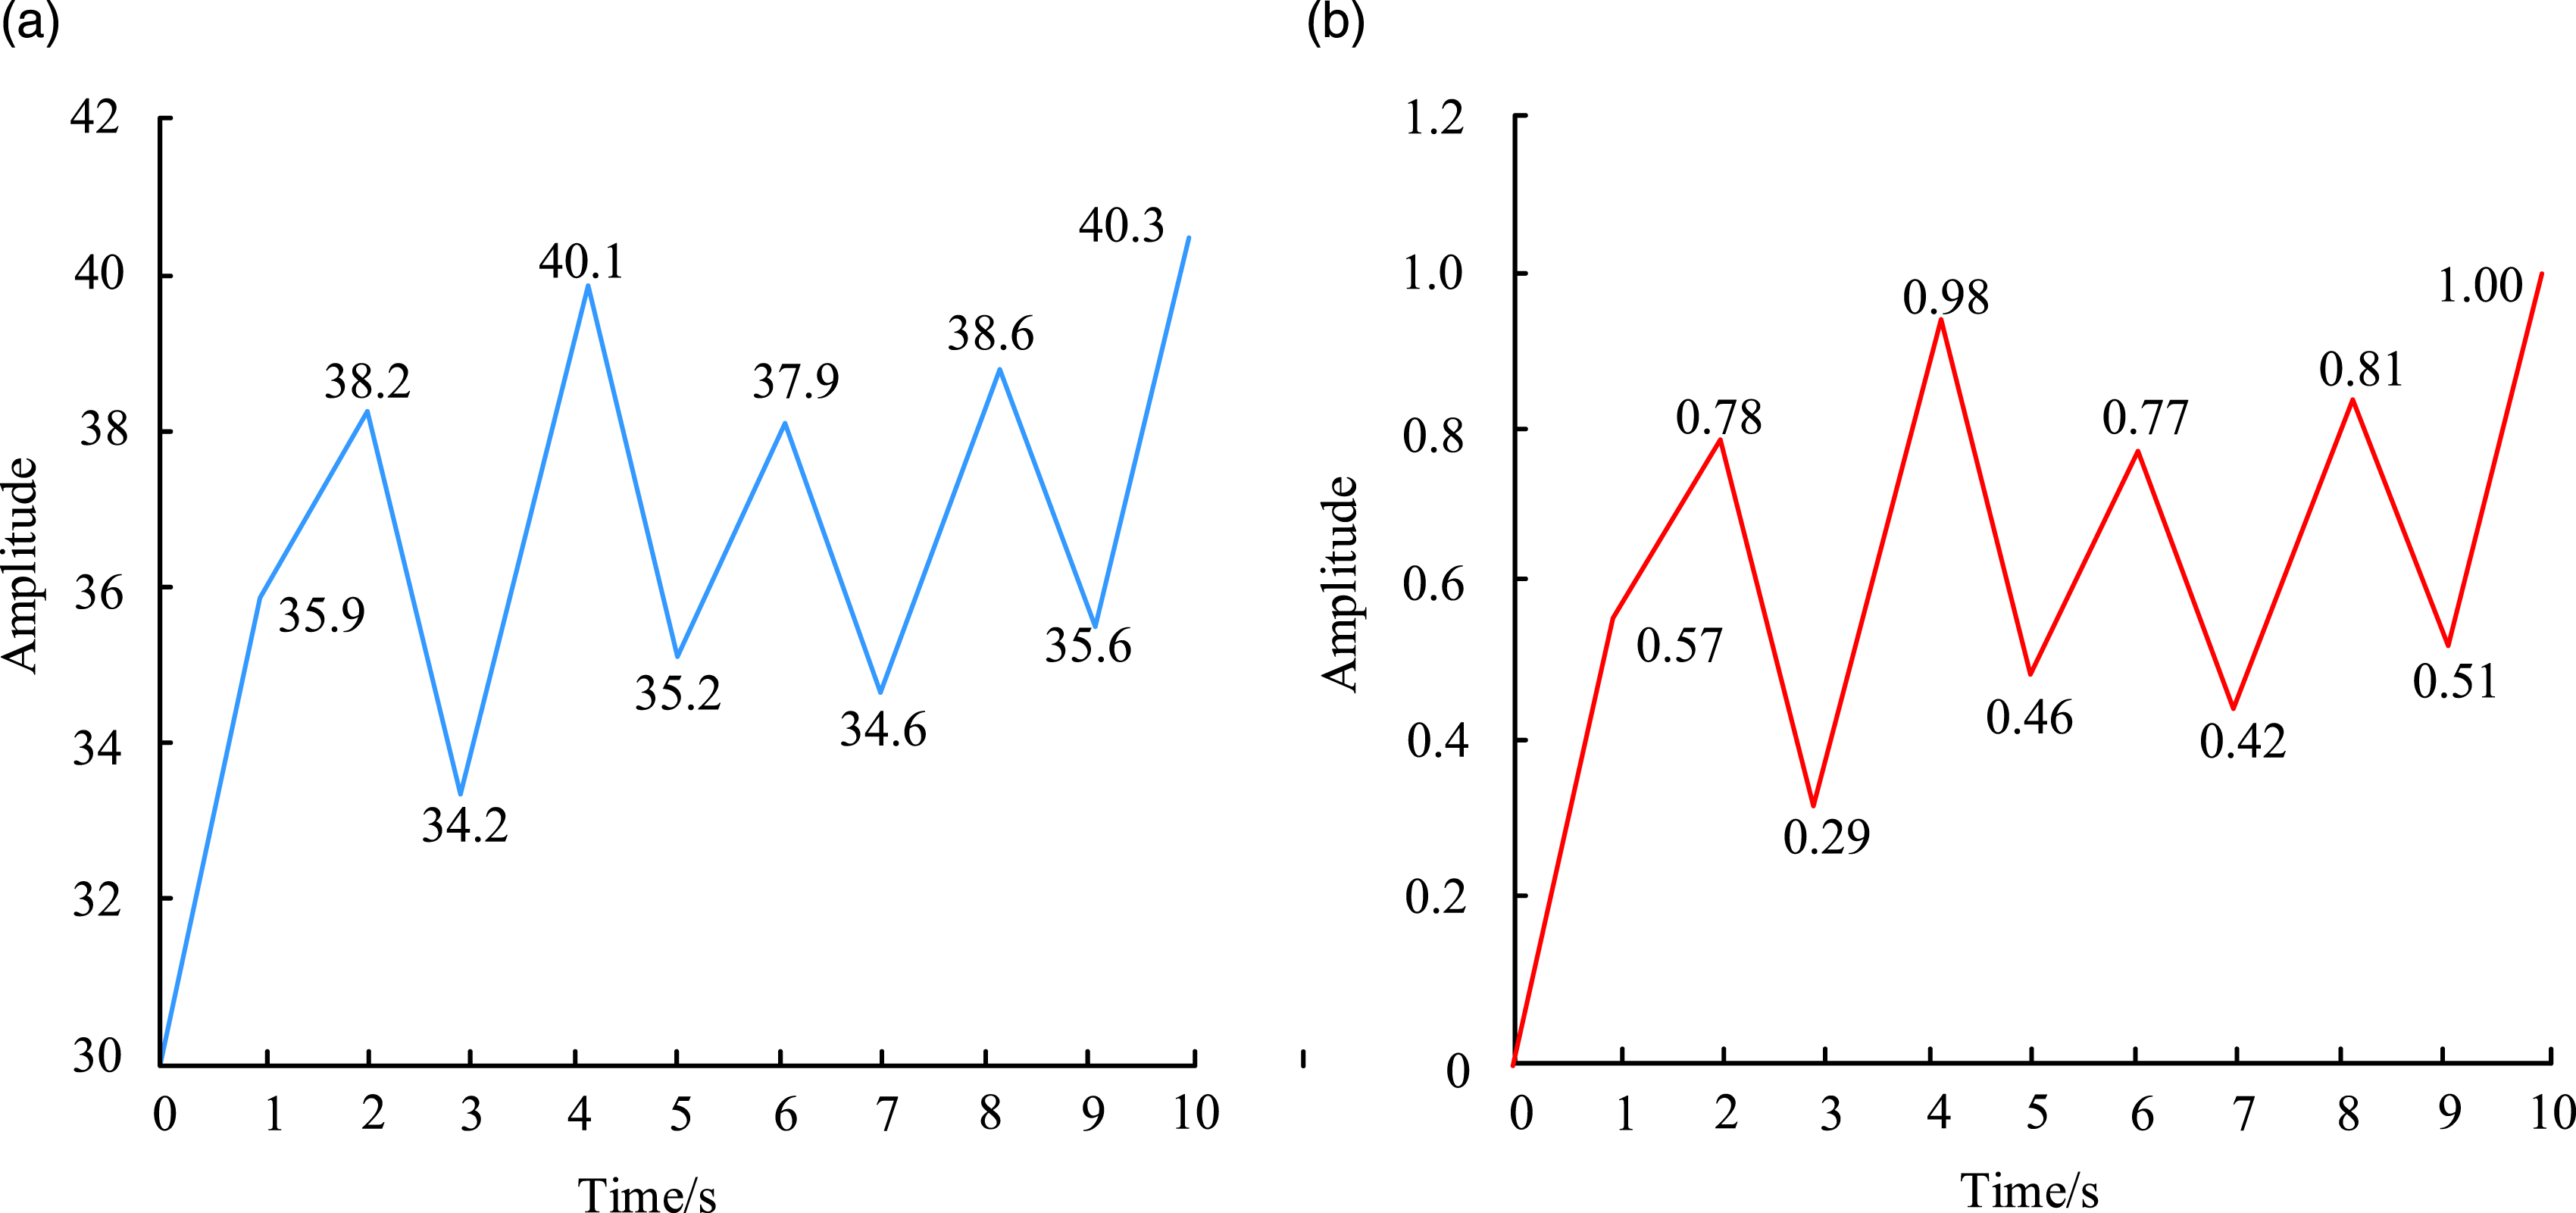
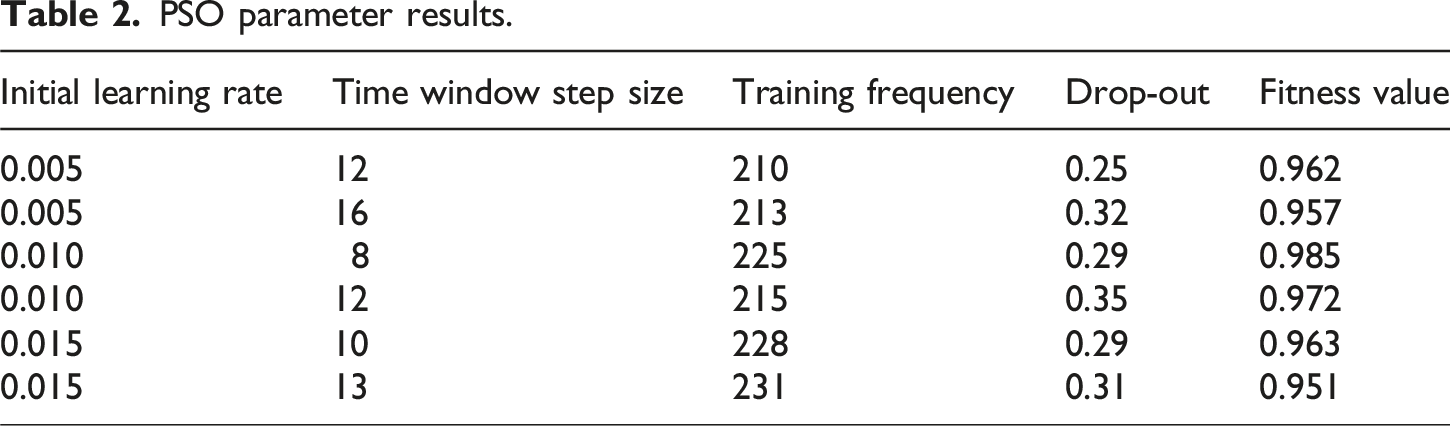
PSO parameter results.
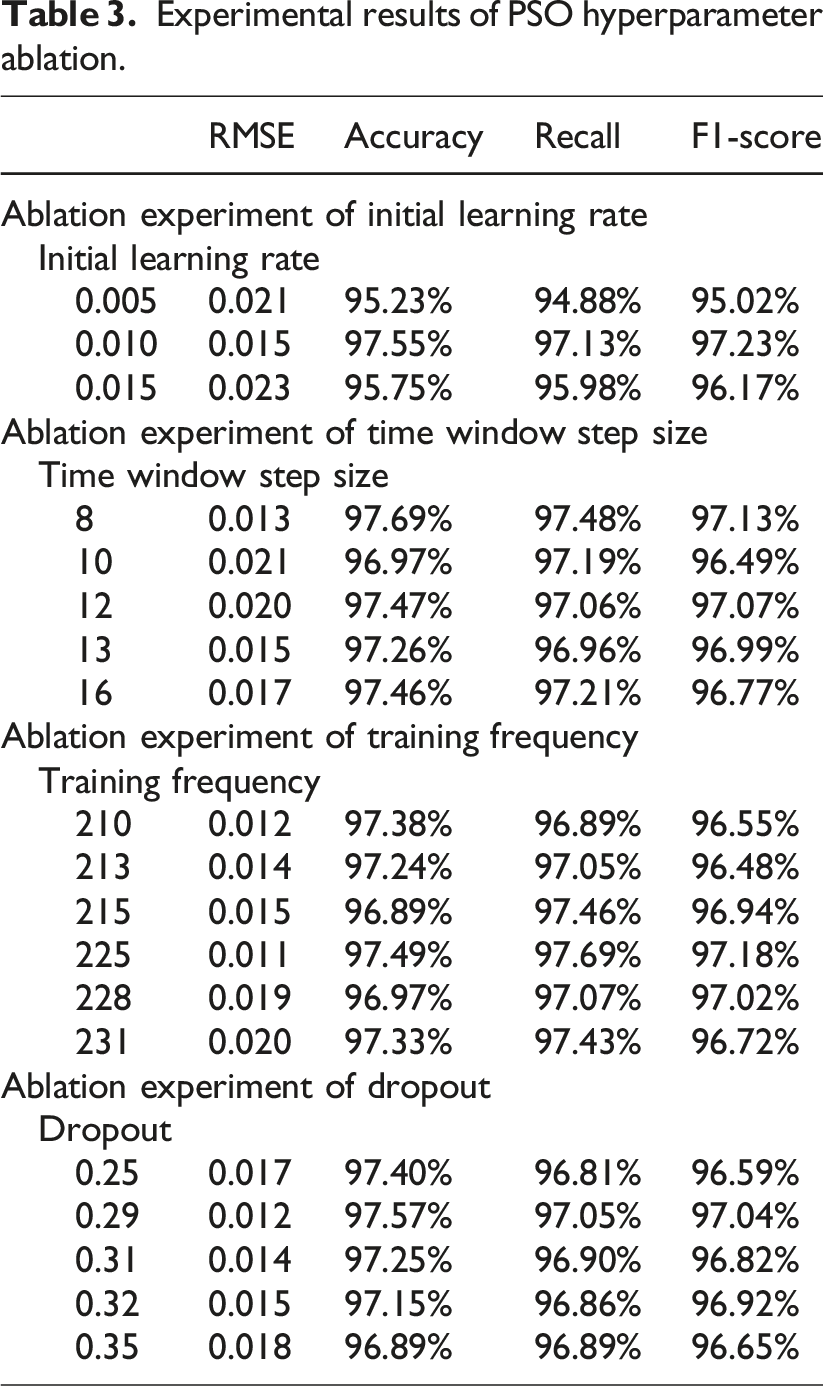
Experimental results of PSO hyperparameter ablation.
LSTM model hyperparameters and training configuration table.
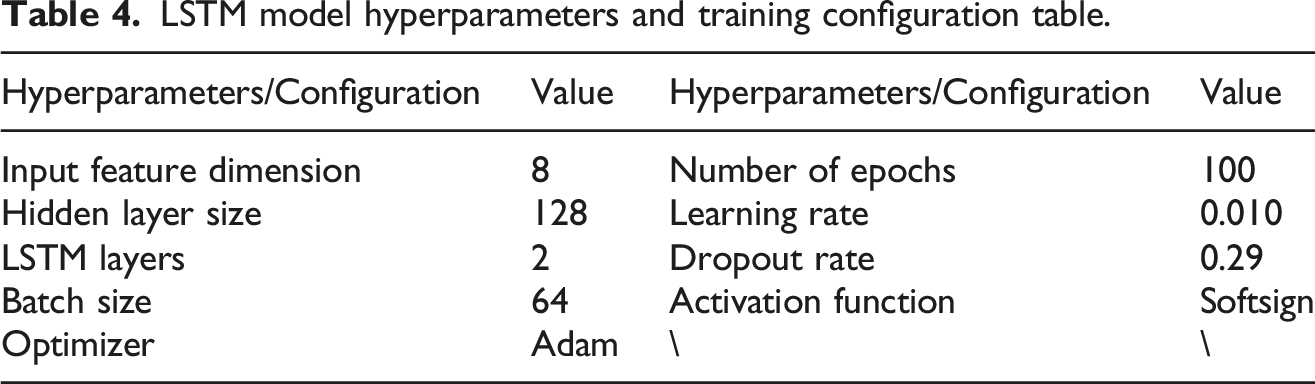
As shown in Table 4, the LSTM model has a hidden layer size of 128, two LSTM layers, and a dropout rate of 0.29. These parameters are set to optimize the model’s learning efficiency and prediction accuracy, thereby achieving effective early warning of medical equipment failures.
To test LSTM performance, optimal value data obtained by PSO is substituted into it. The loss function of the dataset is calculated, and the predicted value is compared. The LSTM performance comparison chart is shown in Figure 10. Figure 10(a) shows the loss function curve of the training set and verification set under LSTM. By observing the trend of the curve, it can be found that when iterations reach 43, the loss function of the training set and verification set stops falling sharply and gradually stabilizes. The loss functions after stabilization are 0.03 and 0.19, respectively. Next, real value and predicted value are compared at the normalized temperature, and the comparison result is shown in Figure 10(b). When the number of samples is 20, normalized temperature reaches a maximum value of 0.62. Moreover, the curve changes of real and predicted values are basically consistent, which proves LSTM prediction accuracy. LSTM prediction model performance comparison chart.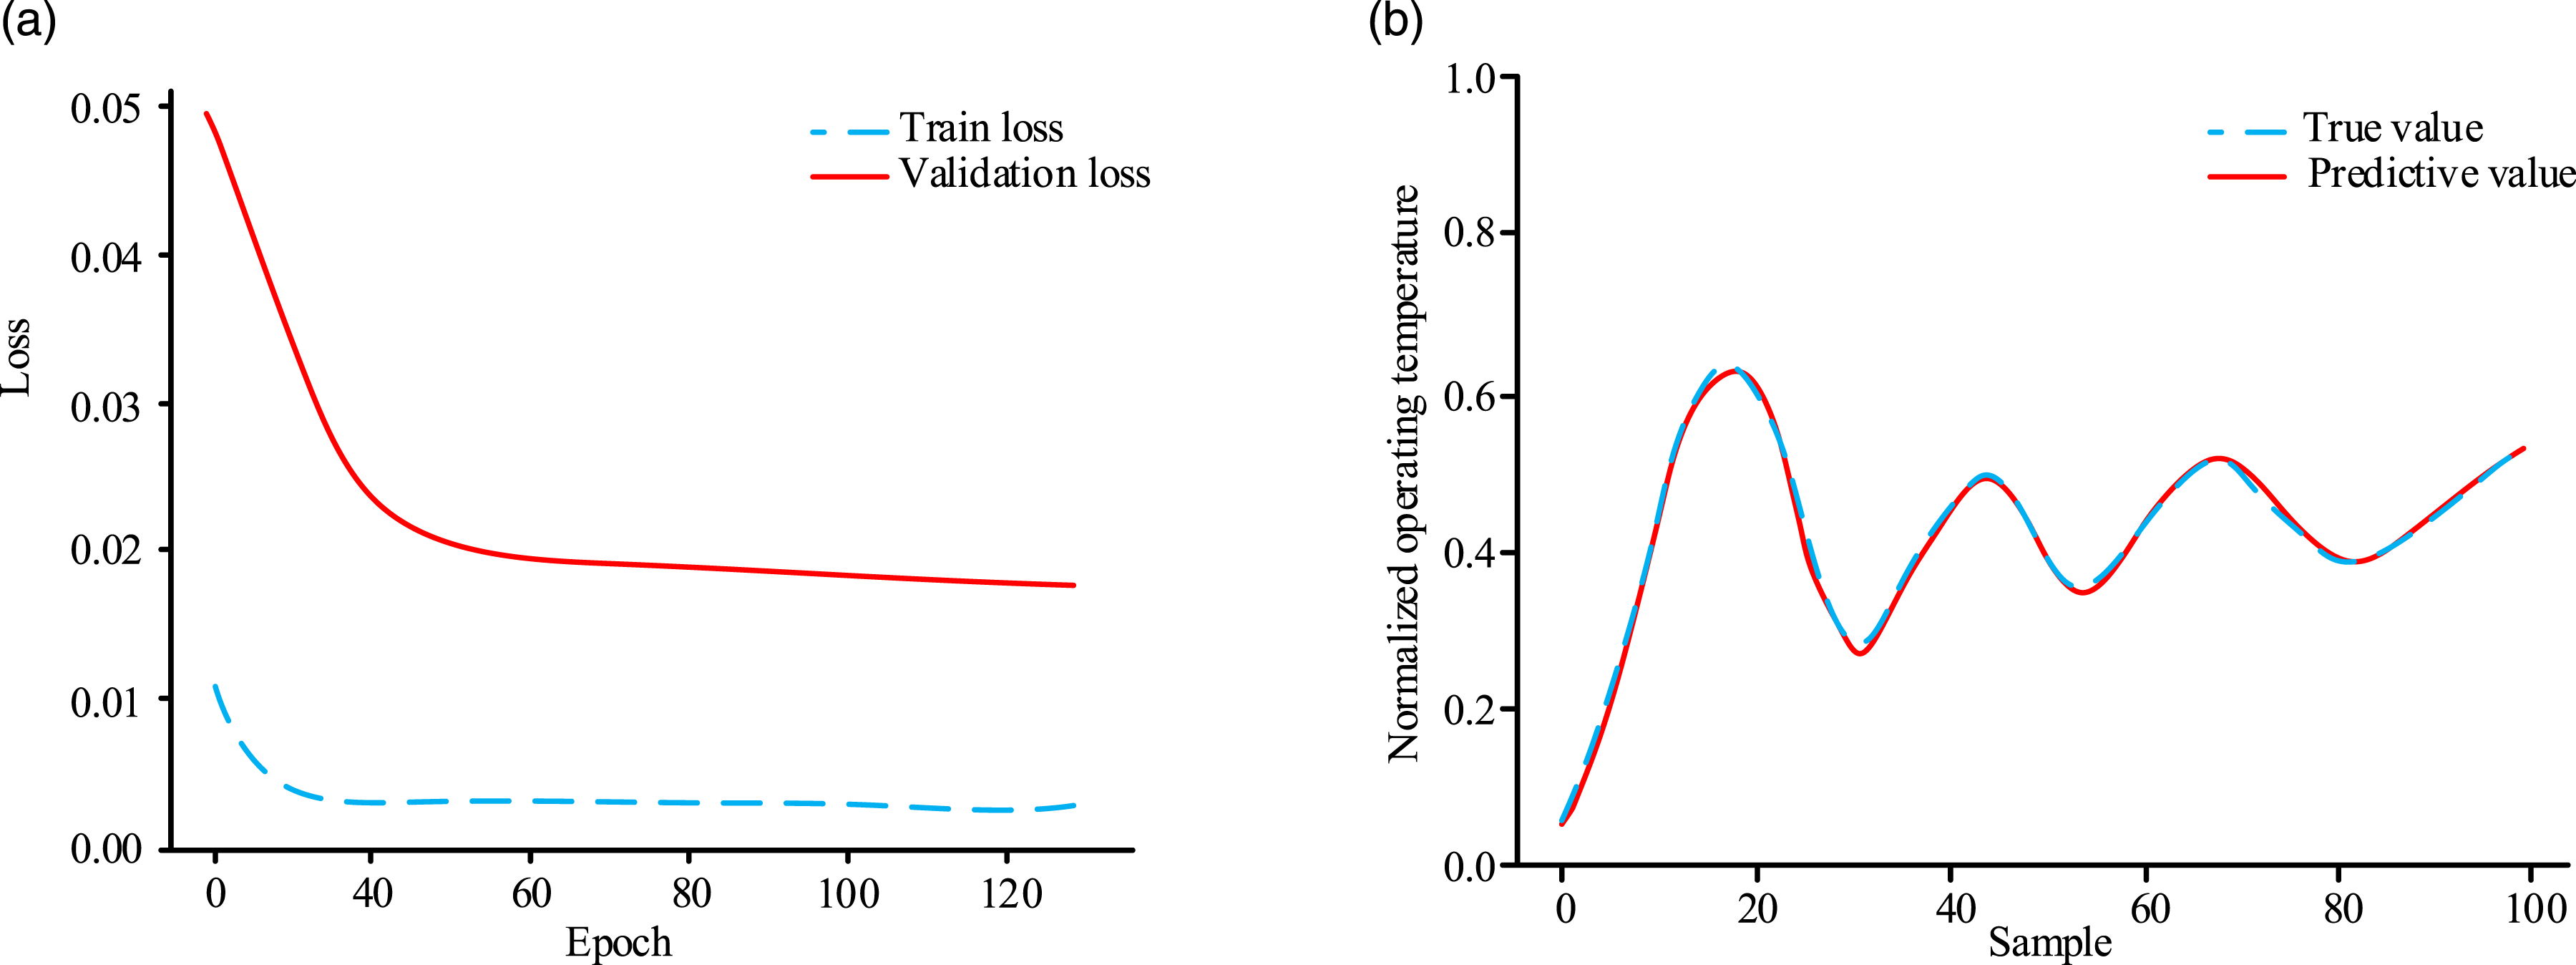
Experimental results on the effect of PSO optimization input on the performance of LSTM model in ablation experiments.
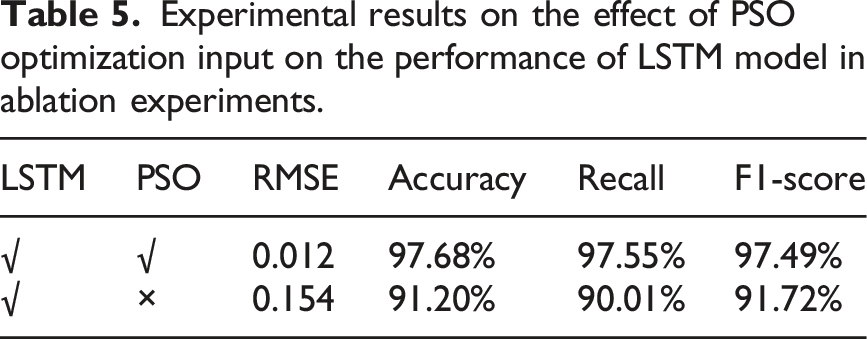
As shown in Table 5, optimizing the input features using PSO significantly reduces the RMSE of the model compared to a model with unoptimized features. The accuracy, recall, and F1-score of the model are also significantly improved after optimizing the input features. These results suggest that PSO optimization can substantially enhance model performance. To verify performance of the model used in this study, a variety of similar prediction models is compared. The prediction models include RNN, Back Propagation (BP)-GA, Bidirectional LSTM (Bi-LSTM), and Attention-LSTM, which are trained and predicted in the same way. Finally, the absolute error comparison of the prediction of the operating temperature characteristics of each model is shown in Figure 11. Comparison chart of absolute prediction errors among variable models.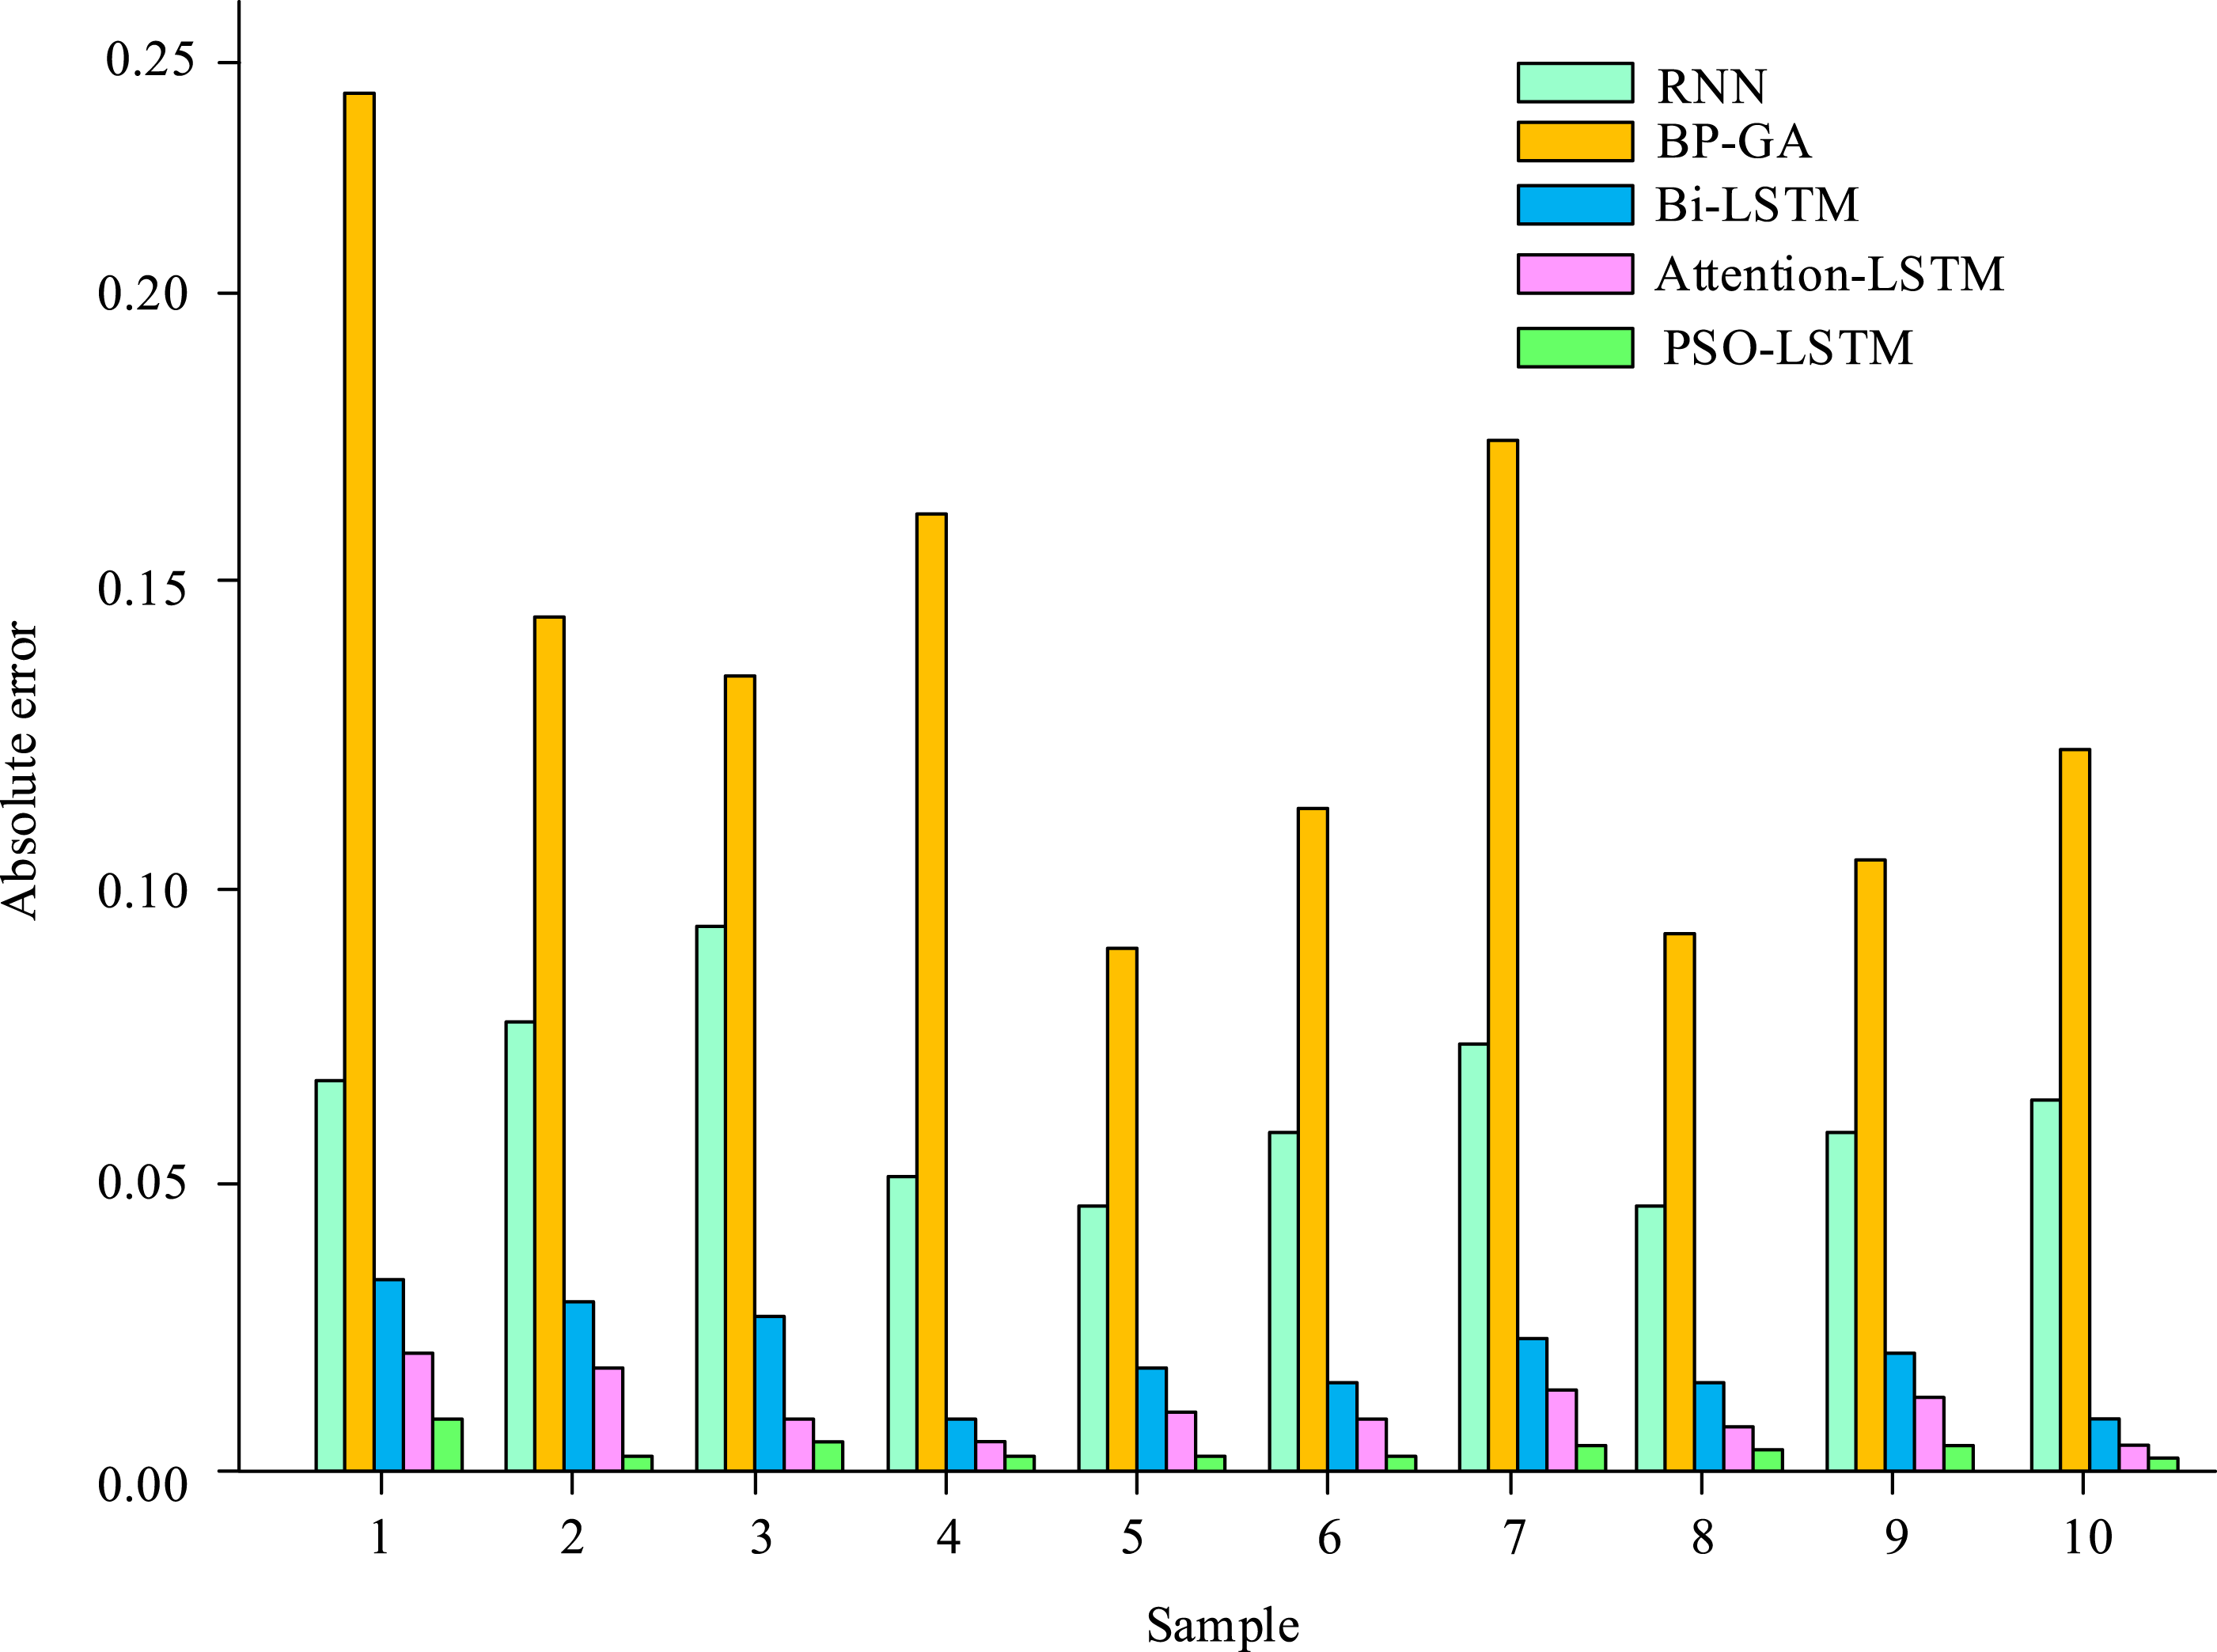
Variable models performance results.
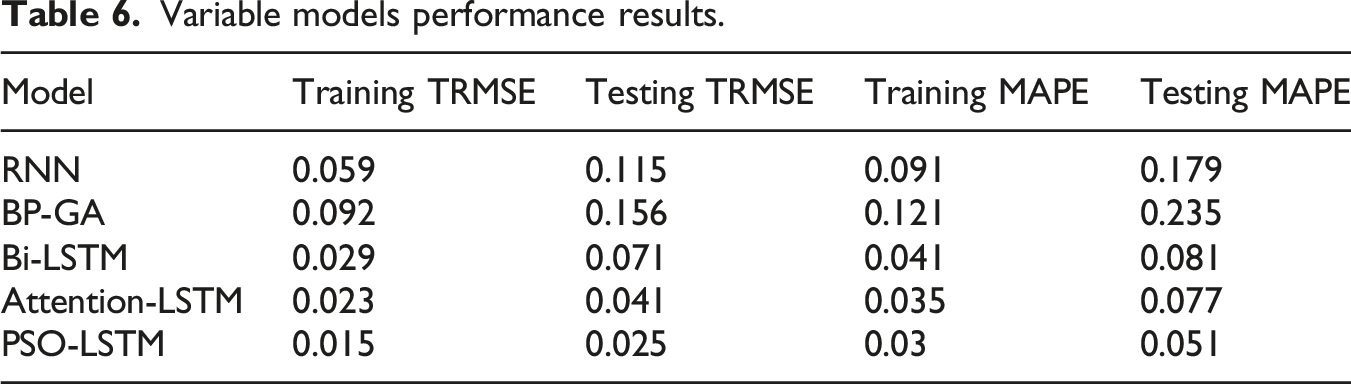
In Table 6, BP-GA prediction performance is the worst, and each index is the maximum value among the models, followed by RNN. The model indicators based on the LSTM model have little difference. However, Bi-LSTM prediction RMSE in test set is 0.071, which is much larger than attention LSTM prediction and PSO-LSTM prediction. The average absolute percentage error of attention LSTM prediction in test set is too large, and the specific value is 0.077. The differences between the RMSE of training set, average absolute percentage error of training set, RMSE of test set, and average absolute percentage error of test set of PSO-LSTM proposed in this study are 0.015, 0.030, 0.025, and 0.051, respectively. They are the lowest values of all indicators, which proves the performance superiority of PSO-LSTM proposed in this study.
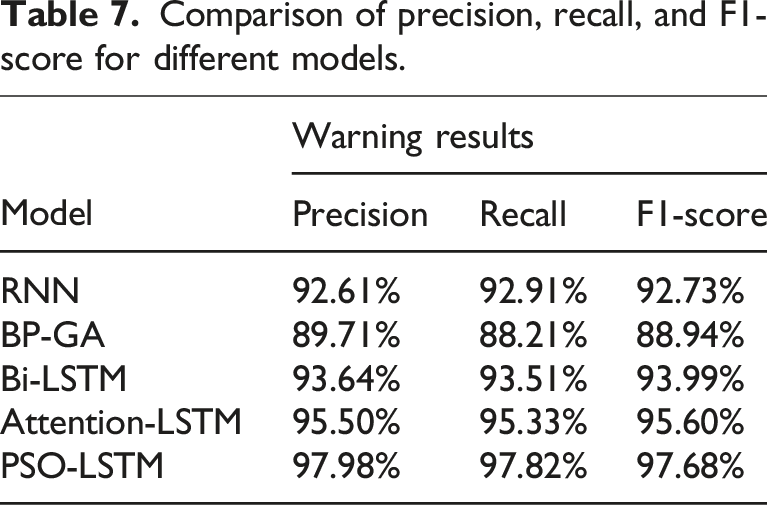
Comparison of precision, recall, and F1-score for different models.
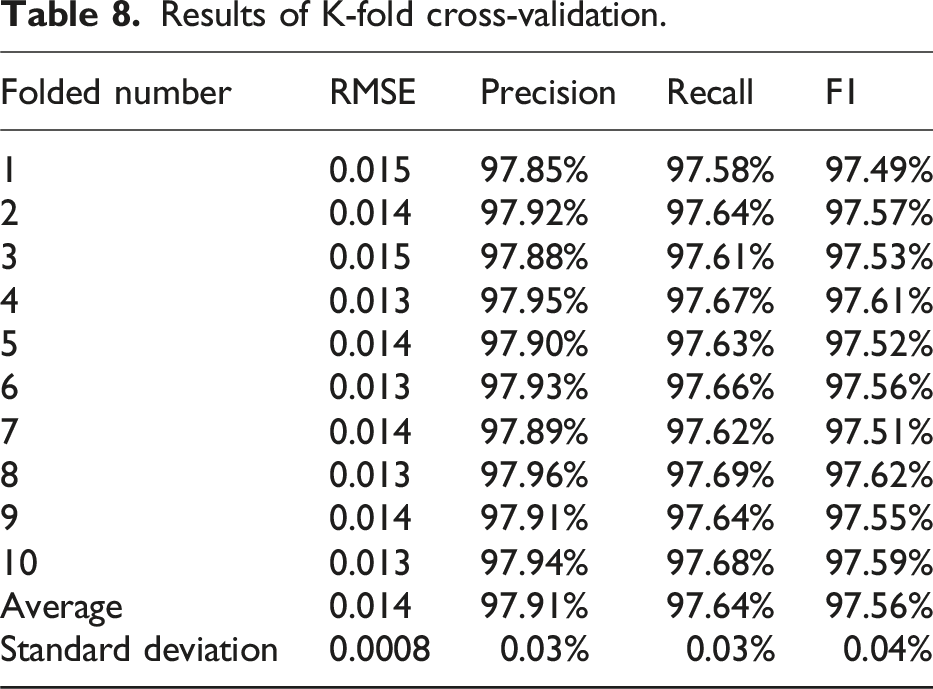
Results of K-fold cross-validation.
Practical application effect of PSO-LSTM model.

As shown in Table 9, the PSO-LSTM model is highly compatible with existing hospital information systems and has an adaptation rate of over 95%. In terms of latency, the model’s average latency is 54 milliseconds. Data transmission latency is less than 30 milliseconds, and model inference latency is less than 55 milliseconds. These results meet real-time monitoring requirements. In terms of sensor reliability, the model achieves a fault detection accuracy of 98.85% and a data collection reliability of 99.32%. These results indicate that the model is highly stable and reliable in practical applications. These results validate the PSO-LSTM model’s effectiveness and practicality in medical equipment fault warning.
Conclusions
Aiming at fault detection of healthcare medical equipment, the fault diagnosis model of healthcare medical equipment is built by combining the PSO algorithm and LSTM. The performance test is carried out by taking the medical infrared imager as an example. In data preprocessing part, the average waveform vibration amplitude interval1,9 in the first 4 seconds of the original signal was 5.46, while the average waveform vibration amplitude interval4,6 in the first 4 seconds of the denoised waveform was 5.23. It showed that the noise reduction effect was good. Original data MMV in the first 10 seconds were 40.3 and 34.2, respectively, and data MMV in the first 10 seconds after normalization were 1.00 and 0.29, respectively. Thus, the results were distributed in the [0, 1] interval, which saved a lot of data computation. By observing the loss function curves under LSTM, it was evident that the model tended to be stable when the number of iterations reached 43. After stabilization, the loss functions of two sets were 0.03 and 0.19, respectively. By comparing the performance of PSO-LSTM with a variety of similar prediction models, the differences of prediction model in the training set RMSE and MAPE, test set RMSE, and MAPE were 0.015, 0.030, 0.025, and 0.051, respectively, which were the lowest values of all indicators. The AER of the PSO-LSTM model was between [0, 0.01], and the performance was stable. The performance superiority of the PSO-LSTM model was proved. The precision, recall, and F1-score of the PSO-LSTM model were 97.98%, 97.82%, and 97.68%, respectively, which were significantly higher than those of the control model. In conclusion, data preprocessing had the potential to effectively denoise raw data. The PSO-LSTM prediction model demonstrated the capacity to effectively warn of medical equipment failures with excellent performance. These results suggest that the PSO-LSTM model can accurately detect potential equipment failures and respond in real time. These studies also demonstrate that the model provides excellent technical support for monitoring medical equipment in real-world settings. This significantly improves maintenance and management processes, enhances the quality and efficiency of medical services, and controls medical costs.
Based on the government’s emphasis on risk warning management of adverse events in medical devices, the requirements for risk warning of medical device equipment will become increasingly high and strict in the future, which will also prompt further exploration in risk warning of medical device equipment in future research. To implement the PSO-LSTM prediction model in a practical setting, it is essential to integrate the model as a functional plugin within the hospital’s existing information system and to ensure compatibility with the specific version of the model in use. Sufficient testing and monitoring are also required to ensure that the model goes live normally. In a real testing environment, the model also requires sensors and USB interfaces to obtain data and uses PSO-LSTM function plugins to complete device warnings. In addition, in order to enhance the practical value of the model, some basic training can be provided to relevant medical personnel, including the data collection process and methods, the usage process of PSO-LSTM functional modules, and the analysis and interpretation of results. Therefore, medical personnel can use the model and analyze the predicted results of the model.
However, there are also certain shortcomings in the research. First, affected by the experimental conditions, the study collected only two datasets for model training and experimental analysis, lacking the performance test of diversified data. In the actual working environment, the factors affecting the fault diagnosis of medical equipment are often complex and changeable, so future research will consider more diversified sample data for further research. Secondly, the PSO-LSTM prediction model also has certain limitations. On the one hand, the PSO algorithm is prone to getting stuck in local optima, which can lead to poor feature optimization performance and affect the accuracy of the PSO-LSTM model. Future research could explore introducing multiple population PSO or multi-strategy PSO to enhance its global search capability. This would optimize the feature selection process and improve the accuracy of the PSO-LSTM model. On the other hand, the LSTM model requires a large amount of data and is prone to overfitting. This can lead to unstable performance of the PSO-LSTM model on small datasets, reducing its generalization ability and reliability. Future research could employ transfer learning and data augmentation techniques to increase the size of the dataset, thereby enhancing the generalization ability and reliability of PSO-LSTM models. Third, although PSO algorithm performs well in feature vector optimization, its parameter selection (such as learning rate and time window step size) has a significant impact on model performance. Future research can optimize the parameters of PSO algorithm to further improve the optimization results of feature vectors, thereby enhancing the accuracy of medical equipment fault diagnosis. In addition, other feature selection methods can be further explored, such as model-based feature importance assessment, to reduce redundant features. In summary, future research should explore introducing multi-population PSO algorithms or transfer learning techniques to improve model performance. At the same time, combining multiple feature selection methods can reduce redundant features and improve the optimization efficiency of feature vectors, thereby enhancing model performance.
Advanced optimization algorithms have played an important role in fields such as online learning, scheduling, multi-objective optimization, transportation, medicine, and data classification. Chen et al. designed an adaptive fast fireworks algorithm to improve the computational efficiency of large-scale black box optimization algorithms. This study constructed mechanisms for expressing fast explosions and competition cooperation between fireworks, achieving optimization of neural network controllers. 32 Dulebenets scholars designed a new adaptive polyploid meme algorithm to address the complex decision scheduling problems faced by cross docking terminal operators. This algorithm used hybridization techniques to facilitate the search process and directly relied on the concept of polyploidy, with better performance than well-known advanced metaheuristic algorithms. 33 Safaeian et al. designed a new three-objective optimization model to solve the scheduling decision problem of carpooling. This study constructed a multi-objective deer algorithm to intelligently find effective Pareto solutions, achieving intelligent planning of carpooling systems with better performance than other methods. 34
It is evident that advanced optimization algorithms demonstrate efficacy in the domains of scheduling and multi-objective optimization. Furthermore, these methods can be employed to address the decision-making challenge in this study, thereby enhancing the efficacy of the equipment warning model. Moreover, future research may wish to compare the proposed method with more advanced optimization algorithms, which could be used to address issues in other fields.
