
Abstract
Smart elderly care systems often struggle with accurate anomaly detection and health trend prediction due to the multi-source heterogeneity and high noise characteristics of health data. Existing methods face limitations in handling structural differences across data sources and capturing task correlations. To address these challenges, this study proposes a novel framework that integrates multi-task learning (MTL) with support vector machines (SVMs). Health data are collected from smart wearable devices, electronic medical records, and environmental monitoring sensors. Following data cleaning and normalization, an MTL framework is constructed to extract shared representations between anomaly detection and health trend prediction tasks. An SVM model with a radial basis function (RBF) kernel is employed for robust anomaly detection in high-dimensional data. Additionally, a hierarchical prediction mechanism is developed to dynamically forecast health trends using shared features and classification boundaries. Experimental evaluations on a real-world smart elderly care dataset demonstrate that the proposed method achieves an anomaly detection accuracy of 97% and a mean squared error (MSE) of 0.12 in health trend prediction. These results confirm the effectiveness of the approach in enhancing the analysis of complex health data, offering a promising solution for intelligent data processing in elderly care applications.
Keywords
Introduction
Smart elderly care, as an important measure for modern society to cope with the problem of aging, has become a research hotspot in many fields such as medicine, technology, and social management. In the smart elderly care system,1,2 the real-time collection3,4 and processing5,6 of health data are key links, involving the physiological, 7 behavioral, 8 environmental, 9 and medical information 10 of the elderly in their daily lives. These data usually come from diverse sources and show obvious multi-source heterogeneity. Moreover, due to the complex collection environment and the limitations of sensor11,12 devices, they are often accompanied by noise interference and uneven data quality. Smart elderly care13,14 health data also have problems such as uneven distribution of abnormal events, high feature dimensions, and complex interactions, which makes the effective identification15,16 and trend prediction of abnormal patterns in data face major challenges. Traditional single-task learning methods often focus on a single goal in a specific scenario, and lack sufficient exploration of the potential correlation 17 between data and the synergy between multiple tasks. In the existing anomaly detection technology,18,19 the statistical method based on the Grubbs test assumes that the data follows a normal distribution and detects outliers by calculating the degree of deviation of the data point from the mean. However, in smart elderly care health data, the feature distribution is often complex, and there is a significant nonlinear correlation. The Grubbs test has a significantly reduced accuracy in identifying outliers in high-dimensional data, and it is difficult to handle situations where multiple outliers coexist. The anomaly detection method based on K-means20,21 clustering relies on the calculation of the Euclidean distance between the cluster center and the sample. When the data dimension is high, the distance between samples tends to be balanced, resulting in a fuzzy cluster structure. K-means is difficult to accurately distinguish between normal data and outliers, and in the presence of highly correlated features within the class, this method is prone to misjudge normal edge samples as outliers. The above difficulties in the field of smart elderly care health data processing limit the intelligence and practicality of the system. There is an urgent need for an innovative method that can comprehensively process multi-source heterogeneous data, improve anomaly detection accuracy and health trend prediction capabilities, so as to provide more powerful technical support for the health protection of the elderly.22,23
In recent years, numerous studies have focused on the development and optimization of intelligent sensing and data transmission solutions for elderly health monitoring. Banerjee et al. 24 designed a smart bracelet integrated with multiple sensors, along with a companion application, to enable remote health monitoring for the elderly. Their system demonstrated significant improvements in both monitoring efficiency and user comfort. This study highlighted the critical role of multi-sensor fusion25,26 in capturing a comprehensive overview of individual health status,27,28 providing a solid foundation for further investigation into the dynamic variations of physiological features.
Yang 29 further explored the use of intelligent sensing technology to analyze changes in the physiological characteristics of the elderly, developing a customized physical health monitoring system and validating its effectiveness. To enhance the overall performance and reliability of such monitoring systems,30,31 optimizing the communication network has become an essential focus, as it directly influences the stability of real-time data transmission and the effectiveness of remote monitoring.
Hassan et al. 32 proposed and evaluated a multi-path routing protocol aimed at improving the application of wireless body area networks (WBANs) in elderly care and health monitoring. Their findings indicated that the scheme significantly enhanced network longevity and data packet transmission efficiency. Despite these advancements in sensor design, data acquisition,33,34 and transmission technologies, there remain limitations in the intelligent modeling of anomaly detection and health status prediction. 35 These shortcomings restrict the depth and scope of monitoring systems in applications such as early health risk warning and intervention.
The research on MTL (multi-task learning) and support vector machines (SVMs) has shown significant potential in the field of anomaly detection and classification, providing a new direction for solving complex data problems. Shi et al. 36 used a deep tensor multi-task anomaly detection model and a rule adaptation mechanism to deal with the problem of online early fault detection, realizing adaptive and accurate assessment of early fault occurrence from unlabeled streaming data, while reducing the false alarm rate and improving the convergence speed. This study highlighted the important value of MTL37,38 in the adaptive processing of unlabeled streaming data, and provided new theoretical support for optimizing data distribution representation through geometric construction. Pang et al. 39 used a multi-task dual hypersphere support vector machine method to solve the multi-task classification problem, which better described the data distribution by generating two hyperspheres instead of hyperplanes for each task, thereby improving prediction accuracy and computational efficiency. In MTL, choosing appropriate feature expressions and classification strategies is crucial to balancing the relevance and independence between tasks, which provides a reference for multi-task problems in other fields. Jain et al. 40 used GoogLeNet features and SVM classifiers for MTL and achieved signature recognition, showing that the proposed method was effective and robust in distinguishing real signatures from forged signatures. These studies still have certain limitations in the generalization ability of the model and the stability of adapting to complex scenarios, especially when facing potential conflicts between diverse tasks, which needs further exploration.
To address the aforementioned challenges, this paper proposes a novel solution based on multi-task learning (MTL) and support vector machines (SVMs), aiming to achieve comprehensive and accurate processing of smart elderly care health data by integrating feature-sharing modeling with efficient classification techniques. Multi-source health data encompassing physiological, behavioral, and environmental dimensions are collected from smart wearable devices, electronic medical record systems, and environmental monitoring sensors. Data preprocessing procedures—including cleaning and normalization—are conducted to mitigate the impact of data quality issues on subsequent analytical tasks. Within the MTL framework, a shared feature representation module is developed, enabling simultaneous optimization of anomaly detection and health trend prediction tasks through joint learning. For anomaly detection, the SVM model is employed, wherein data are mapped to a high-dimensional space using a RBF kernel. This allows the model to establish optimized classification boundaries for the precise identification of anomalous feature points. In the health trend prediction module, a dynamic forecasting mechanism is designed by integrating time series analysis models with the shared features extracted by the MTL framework, enabling accurate modeling of elderly health status trends over time. To enhance the system’s adaptability and robustness, a tailored feature selection and classification integration strategy for multi-source heterogeneous data is introduced, ensuring consistent model performance across diverse data scenarios. This study overcomes the limitations of traditional single-task or source-specific methods in multi-source health data analysis, offering a new technical pathway for intelligent data processing in the domain of smart elderly care through the synergistic application of MTL and SVM methodologies.
Elderly care health data detection and prediction methods
Data collection and preprocessing
Smart elderly care health data comes from smart wearable devices, medical record systems, and environmental monitoring sensors. The data collected by smart wearable devices include real-time physiological monitoring data such as heart rate, blood pressure, number of steps, and exercise volume, with a collection frequency of once per minute, and the data is presented in the form of continuous time series. The medical record system provides patients with historical health records, including disease diagnosis, treatment records, and drug use, and the data is in the form of structured text. Environmental monitoring sensors collect health-related environmental parameters such as air quality, temperature, and humidity, with a low sampling frequency, usually once an hour or a day, and the data type is a mixture of numerical and categorical types. The dataset has a total of 5000 samples with a feature dimension of 30, of which smart wearable device data accounts for 60%, and medical record system and environmental monitoring sensor data each account for 20%.
In the process of data preprocessing, data cleaning is first performed to handle missing values, outliers, and redundant information. For missing values, mean filling and linear interpolation are used for processing. The mean filling method calculates the mean of a specific feature and fills it in the missing value position:

Among them,

Among them,
Outlier detection uses the Z-score method. By calculating the Z-score of each data point, it is determined whether it is an outlier. The Z-score calculation formula is:

Among them,

Among them,
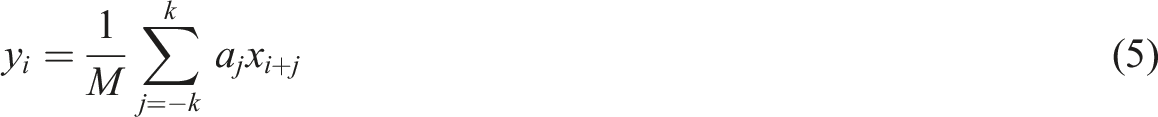
Noise removal is achieved through smoothing using the Savitzky-Golay filter. This method smoothes the original data by applying a sliding window and polynomial fitting to the data. The processed data
Comparison of noise removal effects.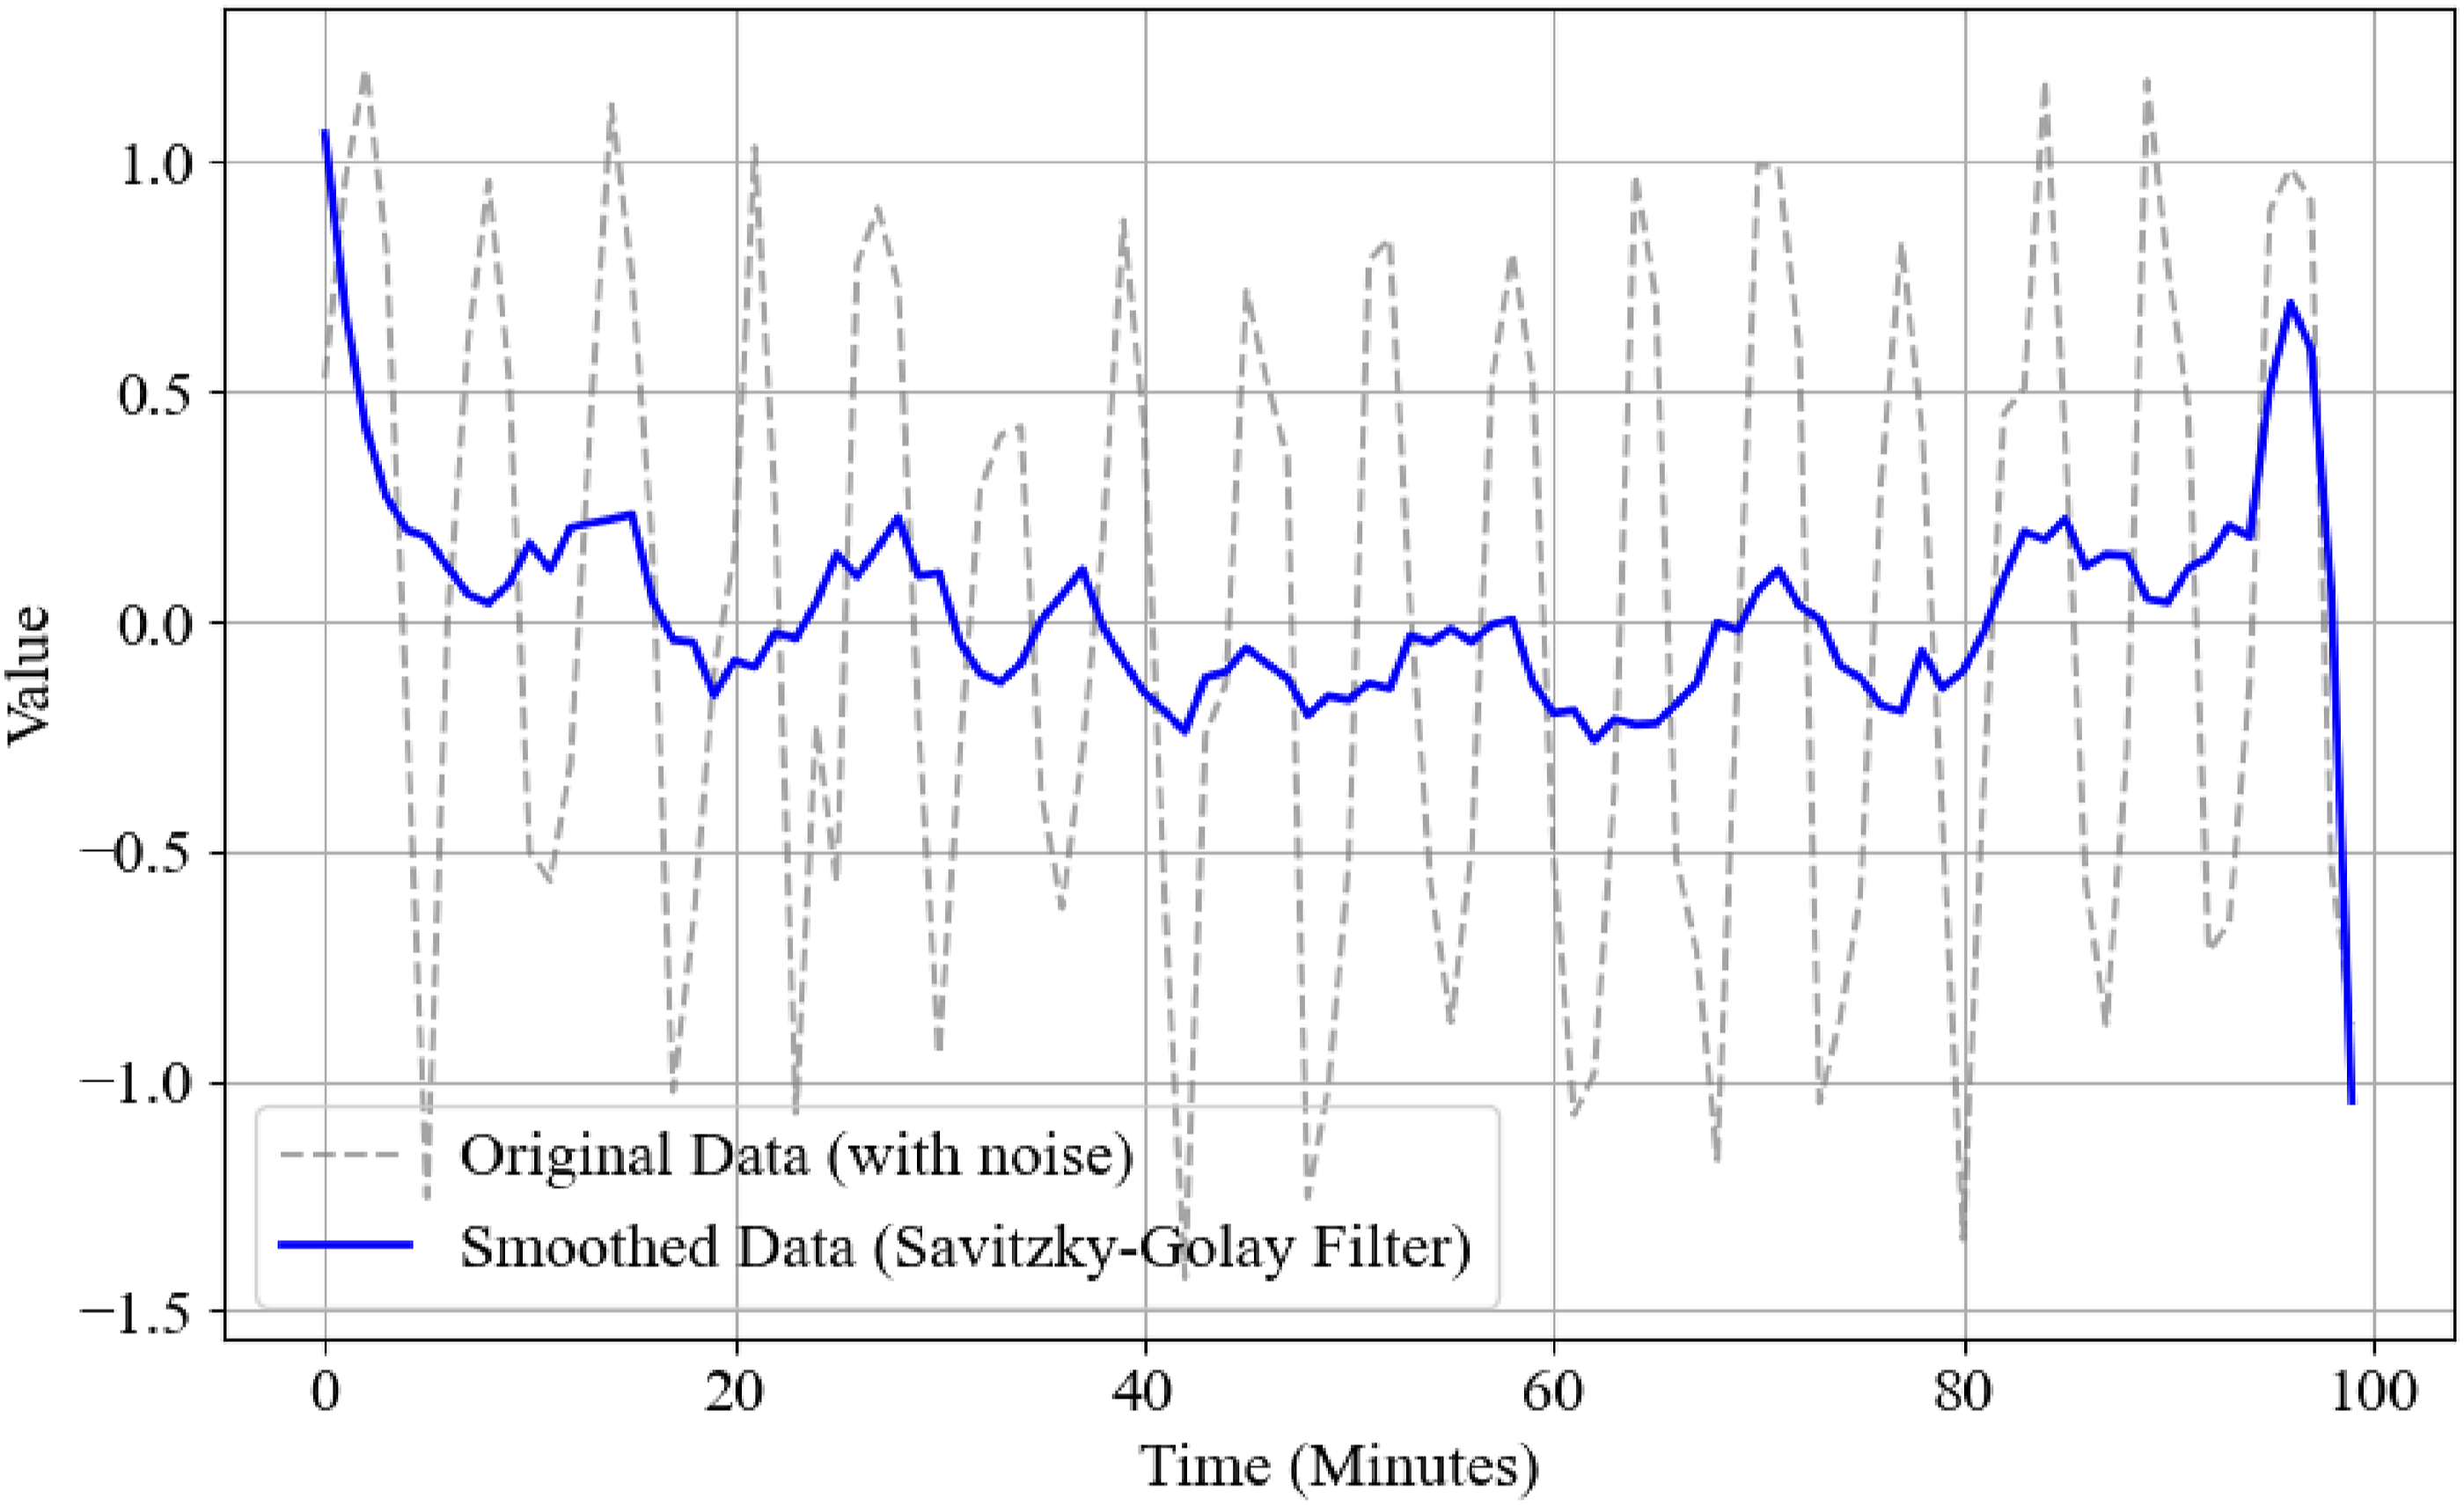
Through the above processing steps, the outliers, missing values, and noise in the dataset are effectively cleaned, and the data is normalized to ensure that it has the same scale and structure, providing a sufficient foundation for subsequent MTL and anomaly detection. The final form of the dataset contains 5000 samples and 30 features, of which 10% of the samples are marked as abnormal.
MTL framework construction
MTL improves the learning efficiency and performance of multiple related tasks by sharing some features of the data. In the anomaly detection and health trend prediction tasks of smart elderly care health data, the potential association between data provides a good foundation for the collaborative learning of the two. A shared feature representation module is designed so that the two tasks can obtain the optimal representation from the same feature space is the core of this framework. Figure 2 illustrates the overall structure of the MTL framework. MTL framework.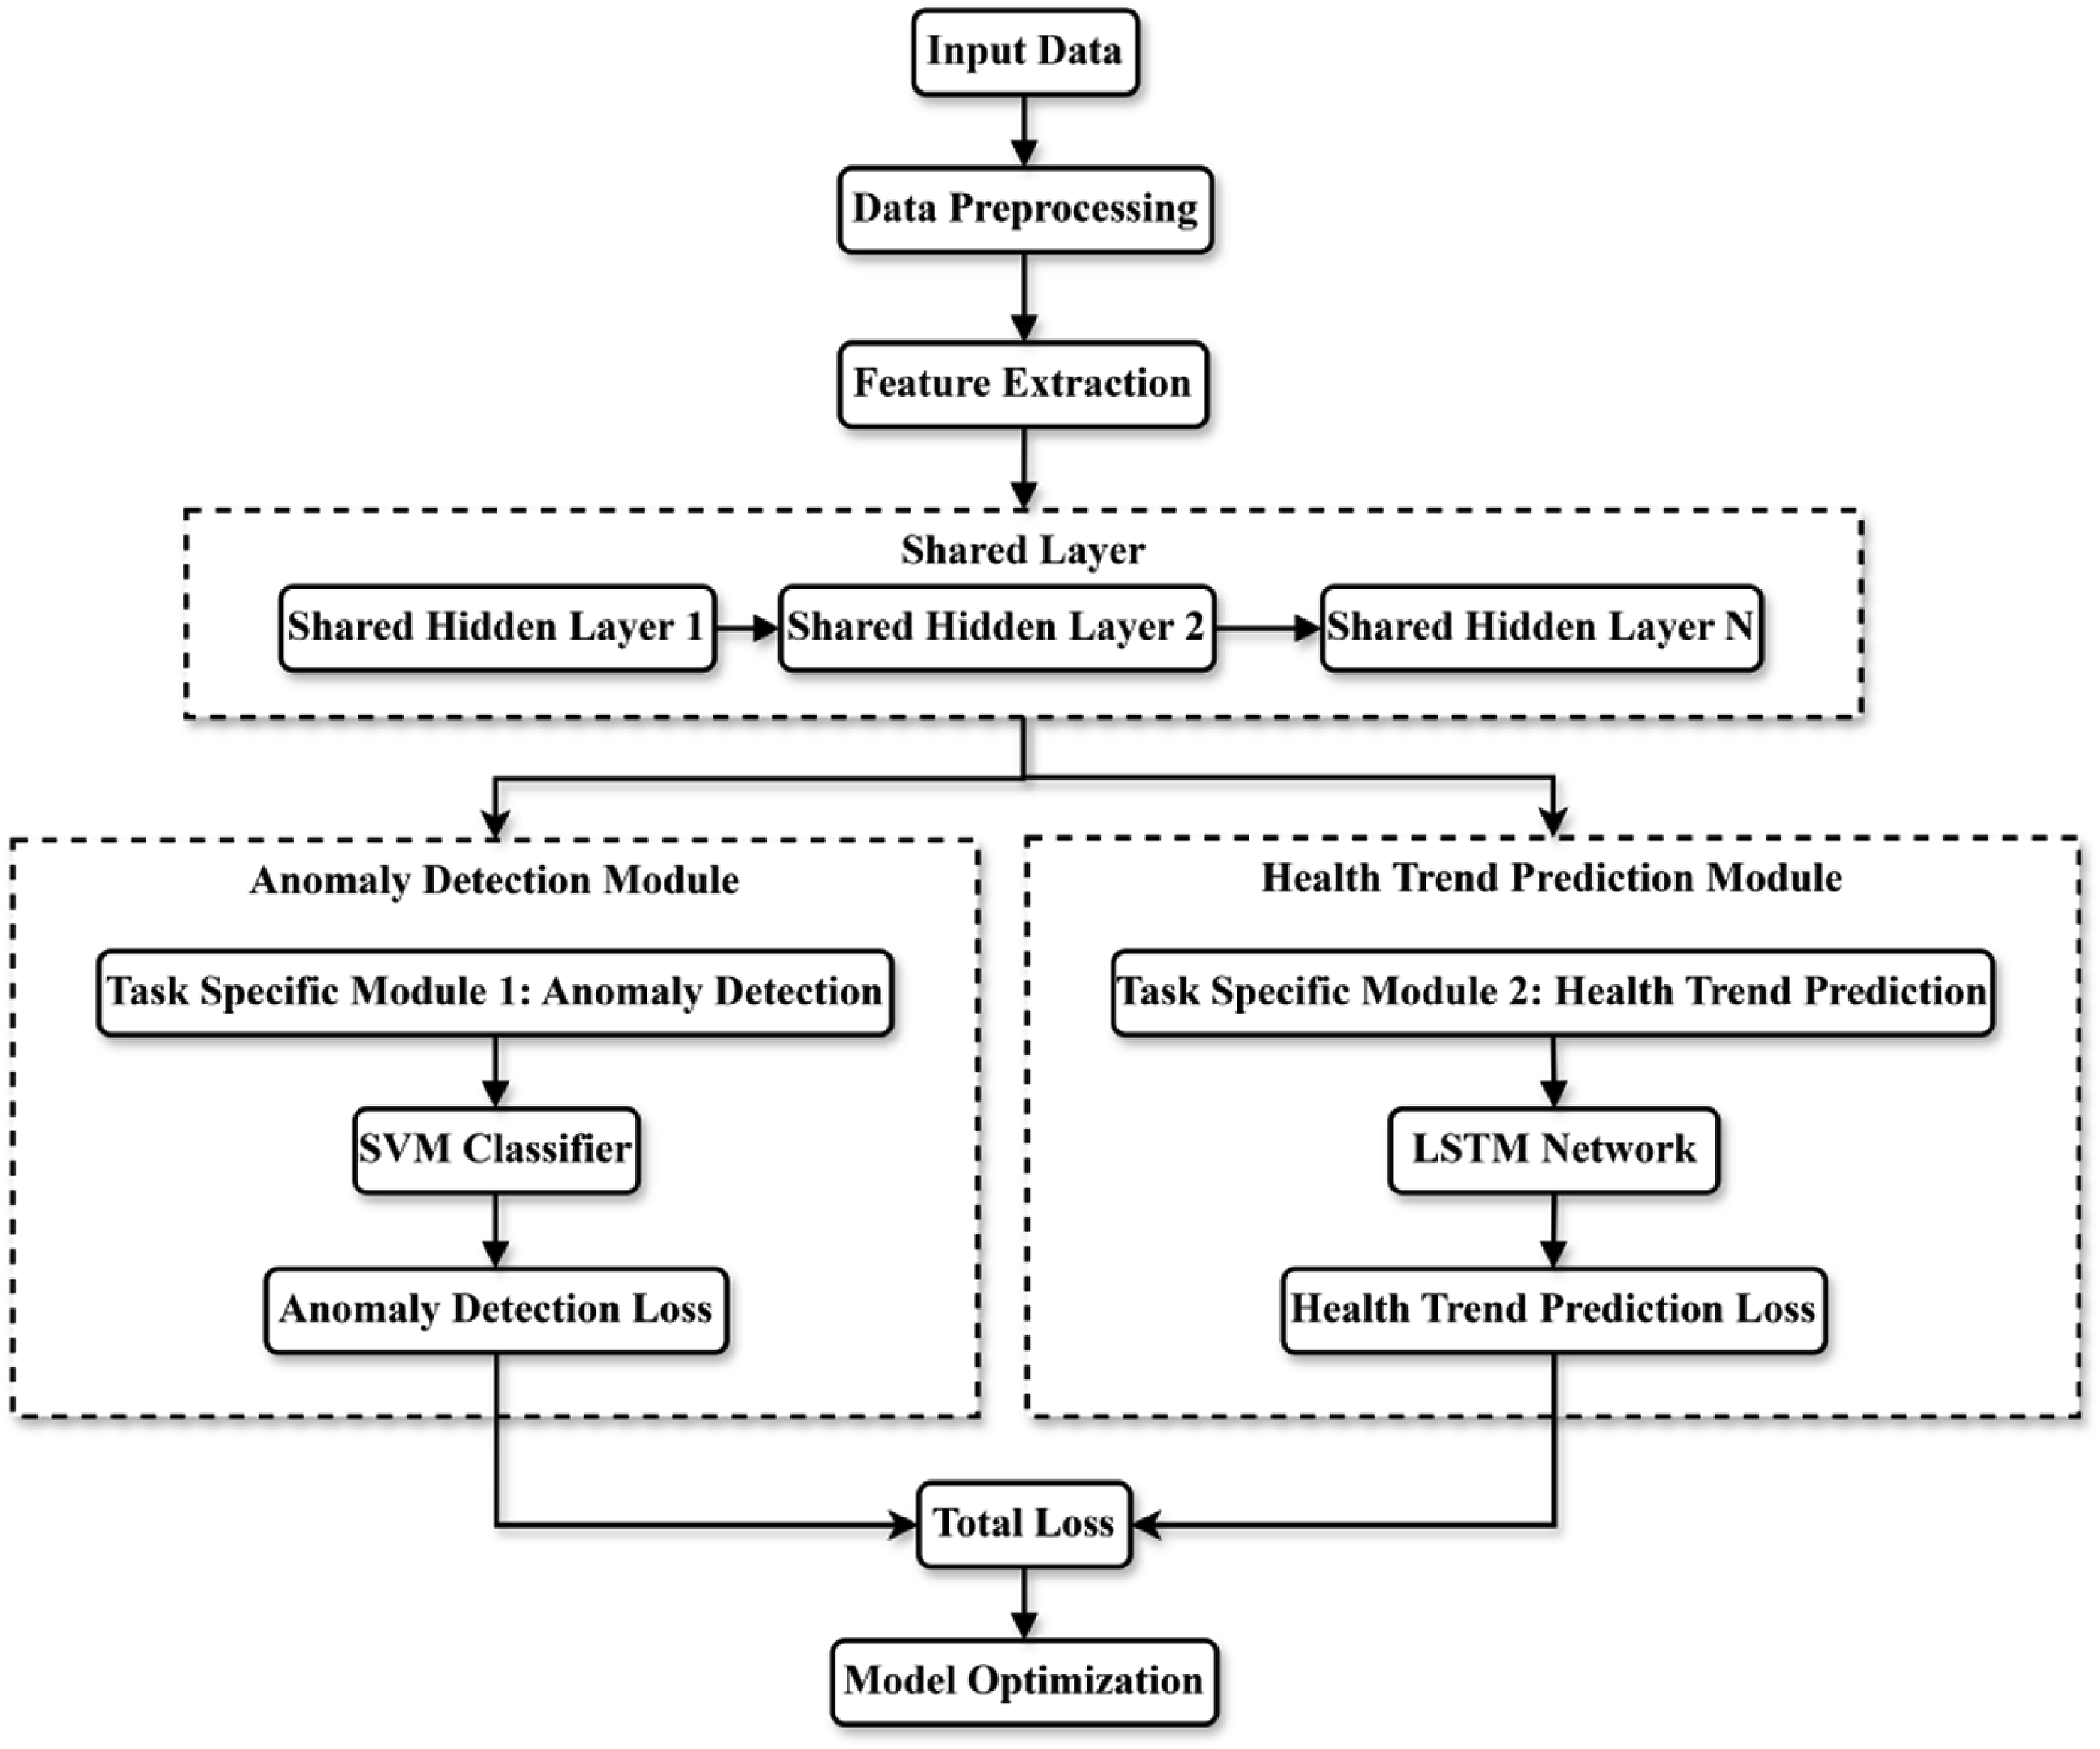
The shared feature representation module of the framework consists of multiple layers, mainly including the input layer, the shared hidden layer, and the task-specific output layer. The shared hidden layer is located in the middle part of the network and is responsible for extracting common features from the raw data, which are passed to the output layer of different tasks for further processing. In this module, all tasks rely on the same shared hidden layer instead of learning independent features directly from the raw data. In this way, the anomaly detection task and the health trend prediction task can not only utilize their respective task-specific features, but also benefit from the cross-task information contained in the shared features. In the specific implementation of the shared feature representation module, the raw data is passed to the shared hidden layer through the input layer. This shared hidden layer adopts a multi-layer perceptron (MLP) structure, in which each layer is a fully connected layer, with the purpose of mapping the input features to a lower-dimensional space for effective processing by subsequent task modules. The output of the shared hidden layer provides the same feature representation for the anomaly detection and health trend prediction tasks, so that the two tasks can be optimized based on the shared features.
In the anomaly detection task, SVMs are applied to the shared feature representations. By mapping these features into a high-dimensional space using a RBF kernel, SVM effectively constructs a classification boundary that distinguishes normal data from anomalies. Owing to its robust capability in handling high-dimensional data, the RBF kernel significantly enhances the accuracy of outlier detection. The incorporation of shared features enables the anomaly detection module to leverage latent information from the health trend prediction task, thereby improving its sensitivity to subtle data anomalies. For the health trend prediction task, a Long Short-Term Memory (LSTM) network is employed, which is particularly well-suited for capturing the temporal dependencies inherent in health-related time series data. The LSTM model receives feature inputs from the shared hidden layer and integrates historical health data to dynamically model future trends. Through the use of shared features, the LSTM not only captures long-term sequential dependencies but also leverages cross-task patterns, thus enhancing both the predictive accuracy and the stability of trend estimation.
To ensure that multiple tasks can effectively utilize shared features, a joint optimization mechanism is applied in the loss function design. The loss of the anomaly detection task uses the classification loss of SVM, while the loss of the health trend prediction task uses the mean square error (MSE). The losses of these two tasks are combined into a total loss by weighted addition:


Among them,

The shared feature representation module enables the two tasks to obtain optimization results from the same feature space and improve the health data modeling capabilities through cross-influence. The anomaly detection task obtains more precise classification boundaries, and the health trend prediction task improves prediction accuracy. This mechanism effectively handles multi-source heterogeneous data and improves the MTL framework performance.
Design of anomaly detection model
Anomaly detection is crucial in the analysis of smart elderly care health data. Considering the high-dimensional characteristics and complexity of the data, this study uses SVM as the main anomaly detection model, and combines RBF to precisely identify outliers by mapping the data to a high-dimensional feature space. SVM separates normal data from abnormal data by finding the optimal hyperplane. The advantage of using the RBF kernel function is its nonlinear mapping ability, which can effectively enhance the anomaly detection accuracy, especially when the data is highly complex and nonlinear. In SVM, the goal is to find a classification hyperplane by maximizing the data interval. The optimization process of SVM is based on the following objective function:

Among them,

The above optimization problem is solved to obtain the optimal hyperplane, maximize the data interval, and perform anomaly detection on this basis.
In SVM, if the data distribution has nonlinear characteristics, the kernel function is used to map the data from low-dimensional space to high-dimensional space. The RBF kernel function can effectively improve the performance of SVM. The form of the RBF kernel function is:

Among them,
The training process of the SVM model optimizes the model performance by selecting appropriate C and
Health trend prediction method
Health trend prediction aims to predict future changes in health status based on the individual’s historical health data. In this paper, LSTM is used for health trend prediction under the MTL framework to capture long-term dependencies in the data. The LSTM network effectively processes time series data through its gating mechanism, can learn the laws of health changes from historical health data, and make predictions on this basis. In terms of model structure, LSTM receives processed time series data through the input layer and controls the flow of information through its internal forget gate, input gate, and output gate. Through these gating mechanisms, LSTM updates its internal state at each time step according to the current input data and the previous memory state, thereby forming a dynamic prediction of health trends. The output of the network is a continuous value, representing the health index at the future moment. The health trend prediction

Among them,
In this paper, the training process of LSTM is optimized by minimizing the MSE loss function, which measures the difference between the predicted value and the true health value. Under the MTL framework, anomaly detection and health trend prediction tasks share the same feature representation layer, which effectively fuses the relevant features of the two together, thereby improving the accuracy of health trend prediction. The application of shared features helps the LSTM model to simultaneously focus on the key information identified in anomaly detection. The trained LSTM model predicts the individual’s health change trend based on historical health data, and the prediction results are evaluated by MSE.
Experimental design and implementation
Experimental environment and parameter setting
Experimental environment configuration.
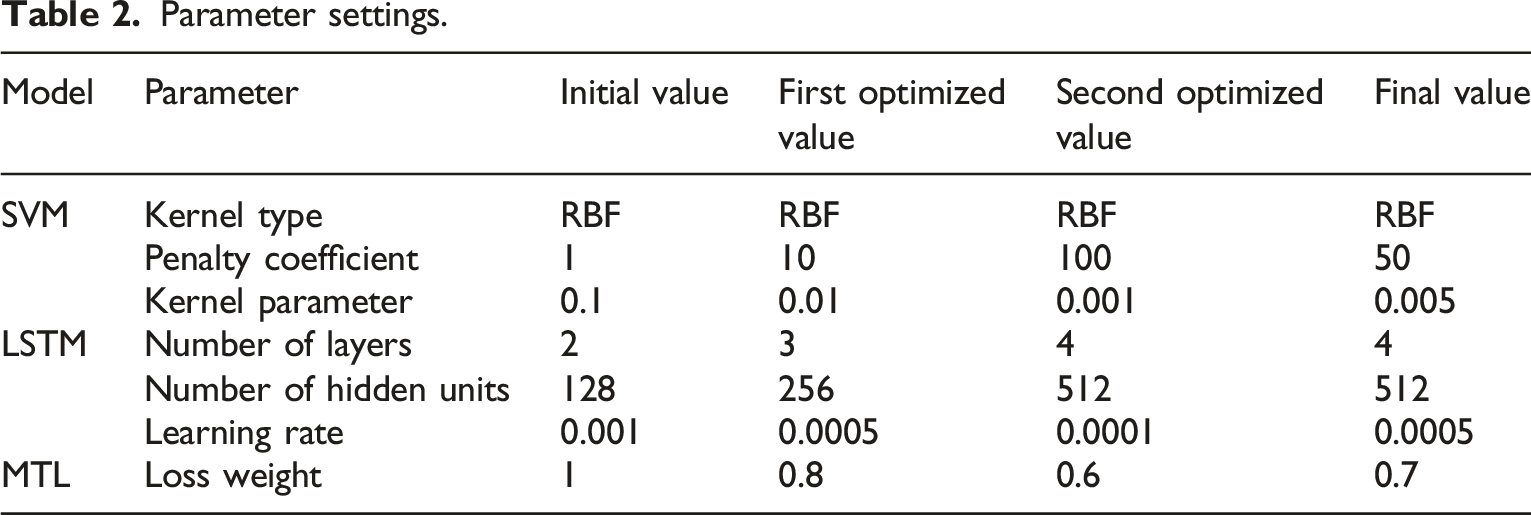
Parameter settings.
Performance evaluation indicators
The evaluation indicators in this paper mainly cover the performance of the two tasks of anomaly detection and health trend prediction. The effect of anomaly detection is evaluated by accuracy (Acc), precision (P), recall (R), and F1 score, while the effect of health trend prediction is quantified by MSE.
The Acc of anomaly detection refers to the proportion of samples correctly classified by the model to the total number of samples, which is used to measure the overall classification effect of the model. Its calculation formula is:
Among them, a represents the number of true positive examples; b is the number of true negative examples; c is the number of false positive examples; d is the number of false negative examples.
P is used to measure the proportion of samples that are actually abnormal among the samples identified as abnormal by the model:
R is used to measure how much the model identifies among all the real abnormal data, emphasizing the sensitivity of the model to abnormal data:
F1 score is the harmonic mean of P and R, which is used to comprehensively evaluate the performance of the model in the anomaly detection task:
The evaluation of these indicators at different stages effectively reveals the actual effect and potential of the anomaly detection and prediction method for smart elderly care health data that integrates MTL and SVM.
Results
Anomaly detection performance
In response to the actual needs of anomaly detection in smart elderly care health data, the anomaly detection module of this framework uses SVM combined with RBF for anomaly detection. To evaluate the performance of this method under different anomaly ratios, the experiment adjusts the anomaly ratio in the dataset and observes the changes in P, R, and F1 scores of the model when facing different abnormal data distributions. Figure 3 illustrates the performance analysis results of the model under different anomaly ratios, which helps to evaluate the adaptability and effectiveness of this method in practical applications. Detection performance under different anomaly ratios.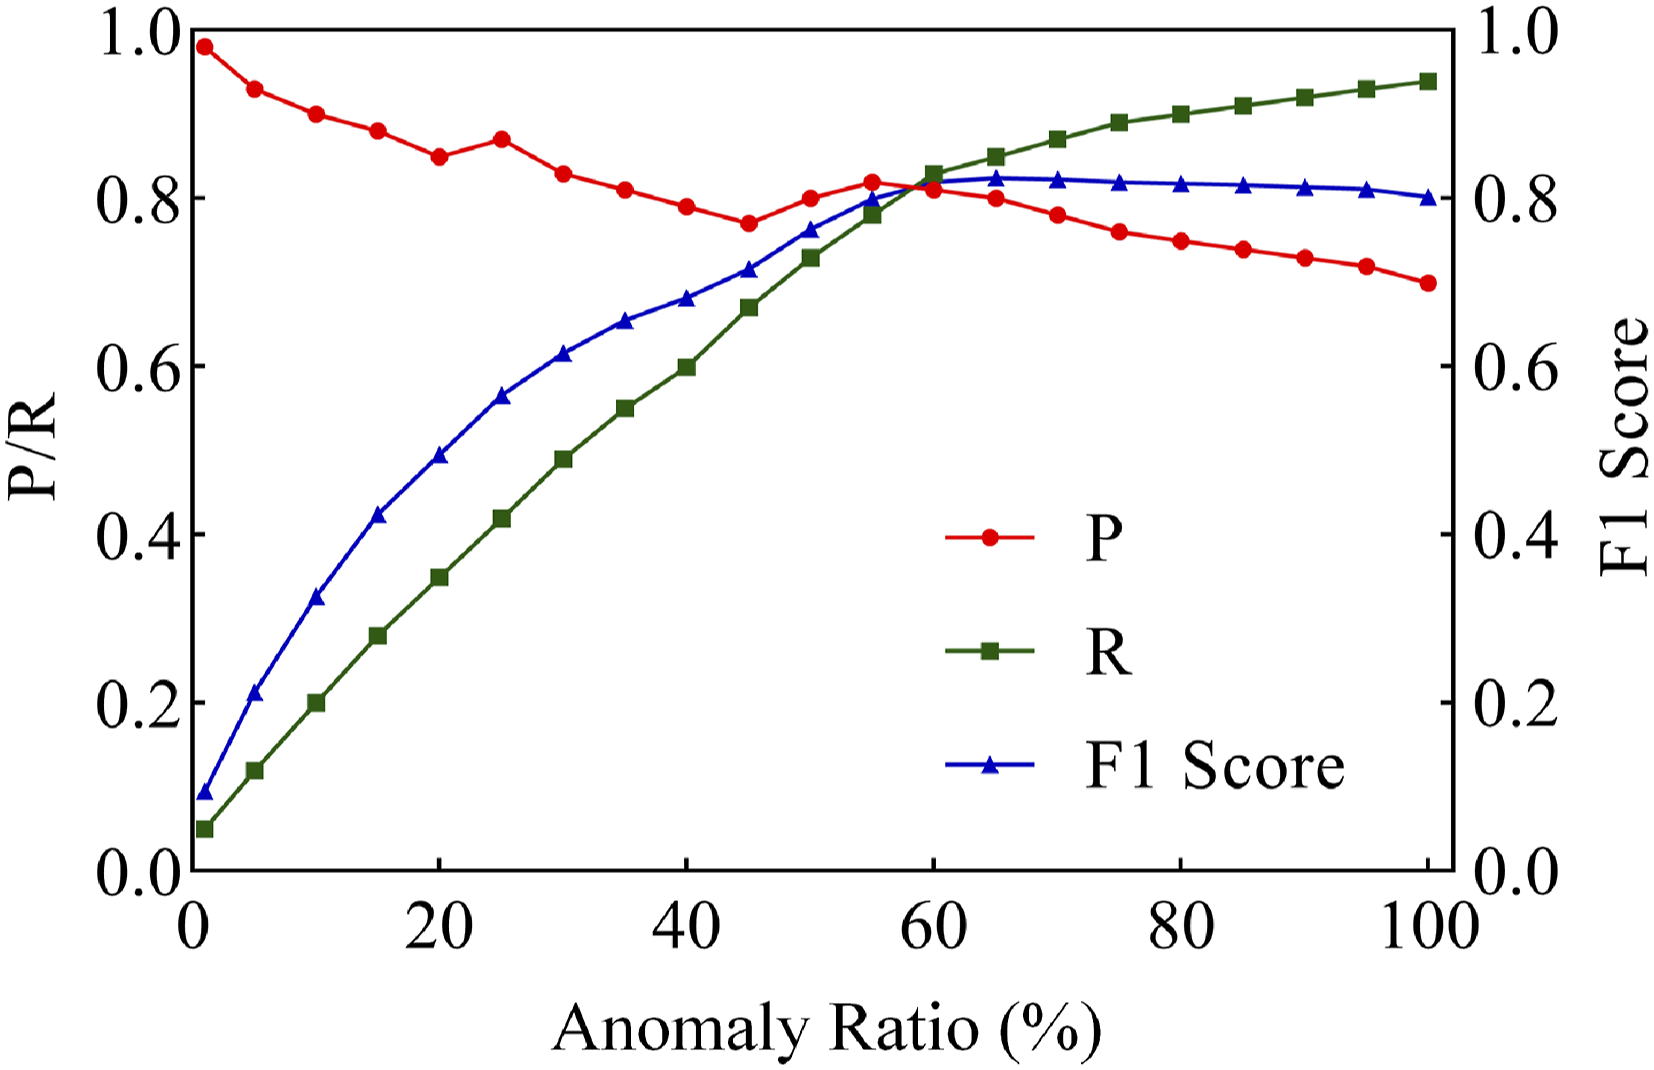
Figure 3 shows that when the anomaly ratio is low, the model has a higher precision, up to 0.98, but R is only 0.05, which indicates that at low anomaly ratios, it is difficult for the model to identify all outliers, resulting in a low R. As the anomaly ratio increases, R gradually increases, reaching a maximum of 0.94, while the precision shows a downward trend, with a minimum of 0.7. This phenomenon reflects that at a higher anomaly ratio, the model tends to predict more outliers as positive, thereby improving R, but also reducing the precision. As the anomaly ratio increases, the F1 score increases significantly and eventually stabilizes above 0.8, indicating that the method has better balanced performance at a higher anomaly ratio and can effectively cope with anomaly detection tasks under different data conditions.
Performance comparison of different anomaly detection methods.
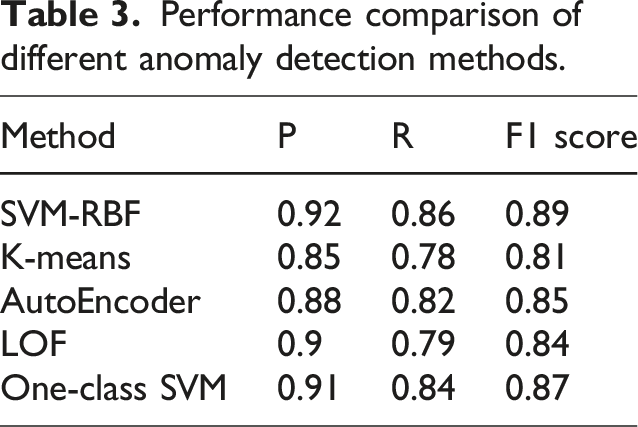
The performance of the proposed method SVM-RBF is better than other detection algorithms, especially in P, R, and F1 scores. Compared with K-means, which has the lowest performance, SVM-RBF’s P is improved by 0.07; R is improved by 0.08; F1 score is improved by 0.08, showing that it can better balance precision and recall when detecting abnormal data. The reason for this improvement is that SVM-RBF can effectively handle nonlinear relationships in the data and map the data to a high-dimensional space through the radial basis function, thereby improving the discrimination of abnormal points. The clustering method based on the distance metric of the K-means algorithm is easily disturbed by noise and abnormal points when processing complex and high-dimensional data, resulting in unstable performance. The performance of AutoEncoder, LOF, and one-class SVM is between SVM-RBF and K-means, which shows the advantages of nonlinear methods over traditional distance-based algorithms in anomaly detection. In general, SVM-RBF achieves a good balance between precision and R, proving that it is more adaptable to complex datasets.
Health trend prediction performance
The experiment evaluates the performance of the MTL method for smart elderly care health data, focusing on the health trend prediction task. By analyzing the prediction effects of key health indicators such as heart rate, blood pressure, number of steps, and exercise volume, the adaptability and accuracy of the model integrating MTL and SVM under multiple data sources are evaluated. By comparing the difference between the predicted results and the actual values, the application effect of the method in different tasks is studied, and the impact of different health data characteristics on the model performance is explored. Figure 4 illustrates the comparison between the predicted results and the true values of the four health indicators, which intuitively reflects the effect of this model in health data prediction. Health data prediction results.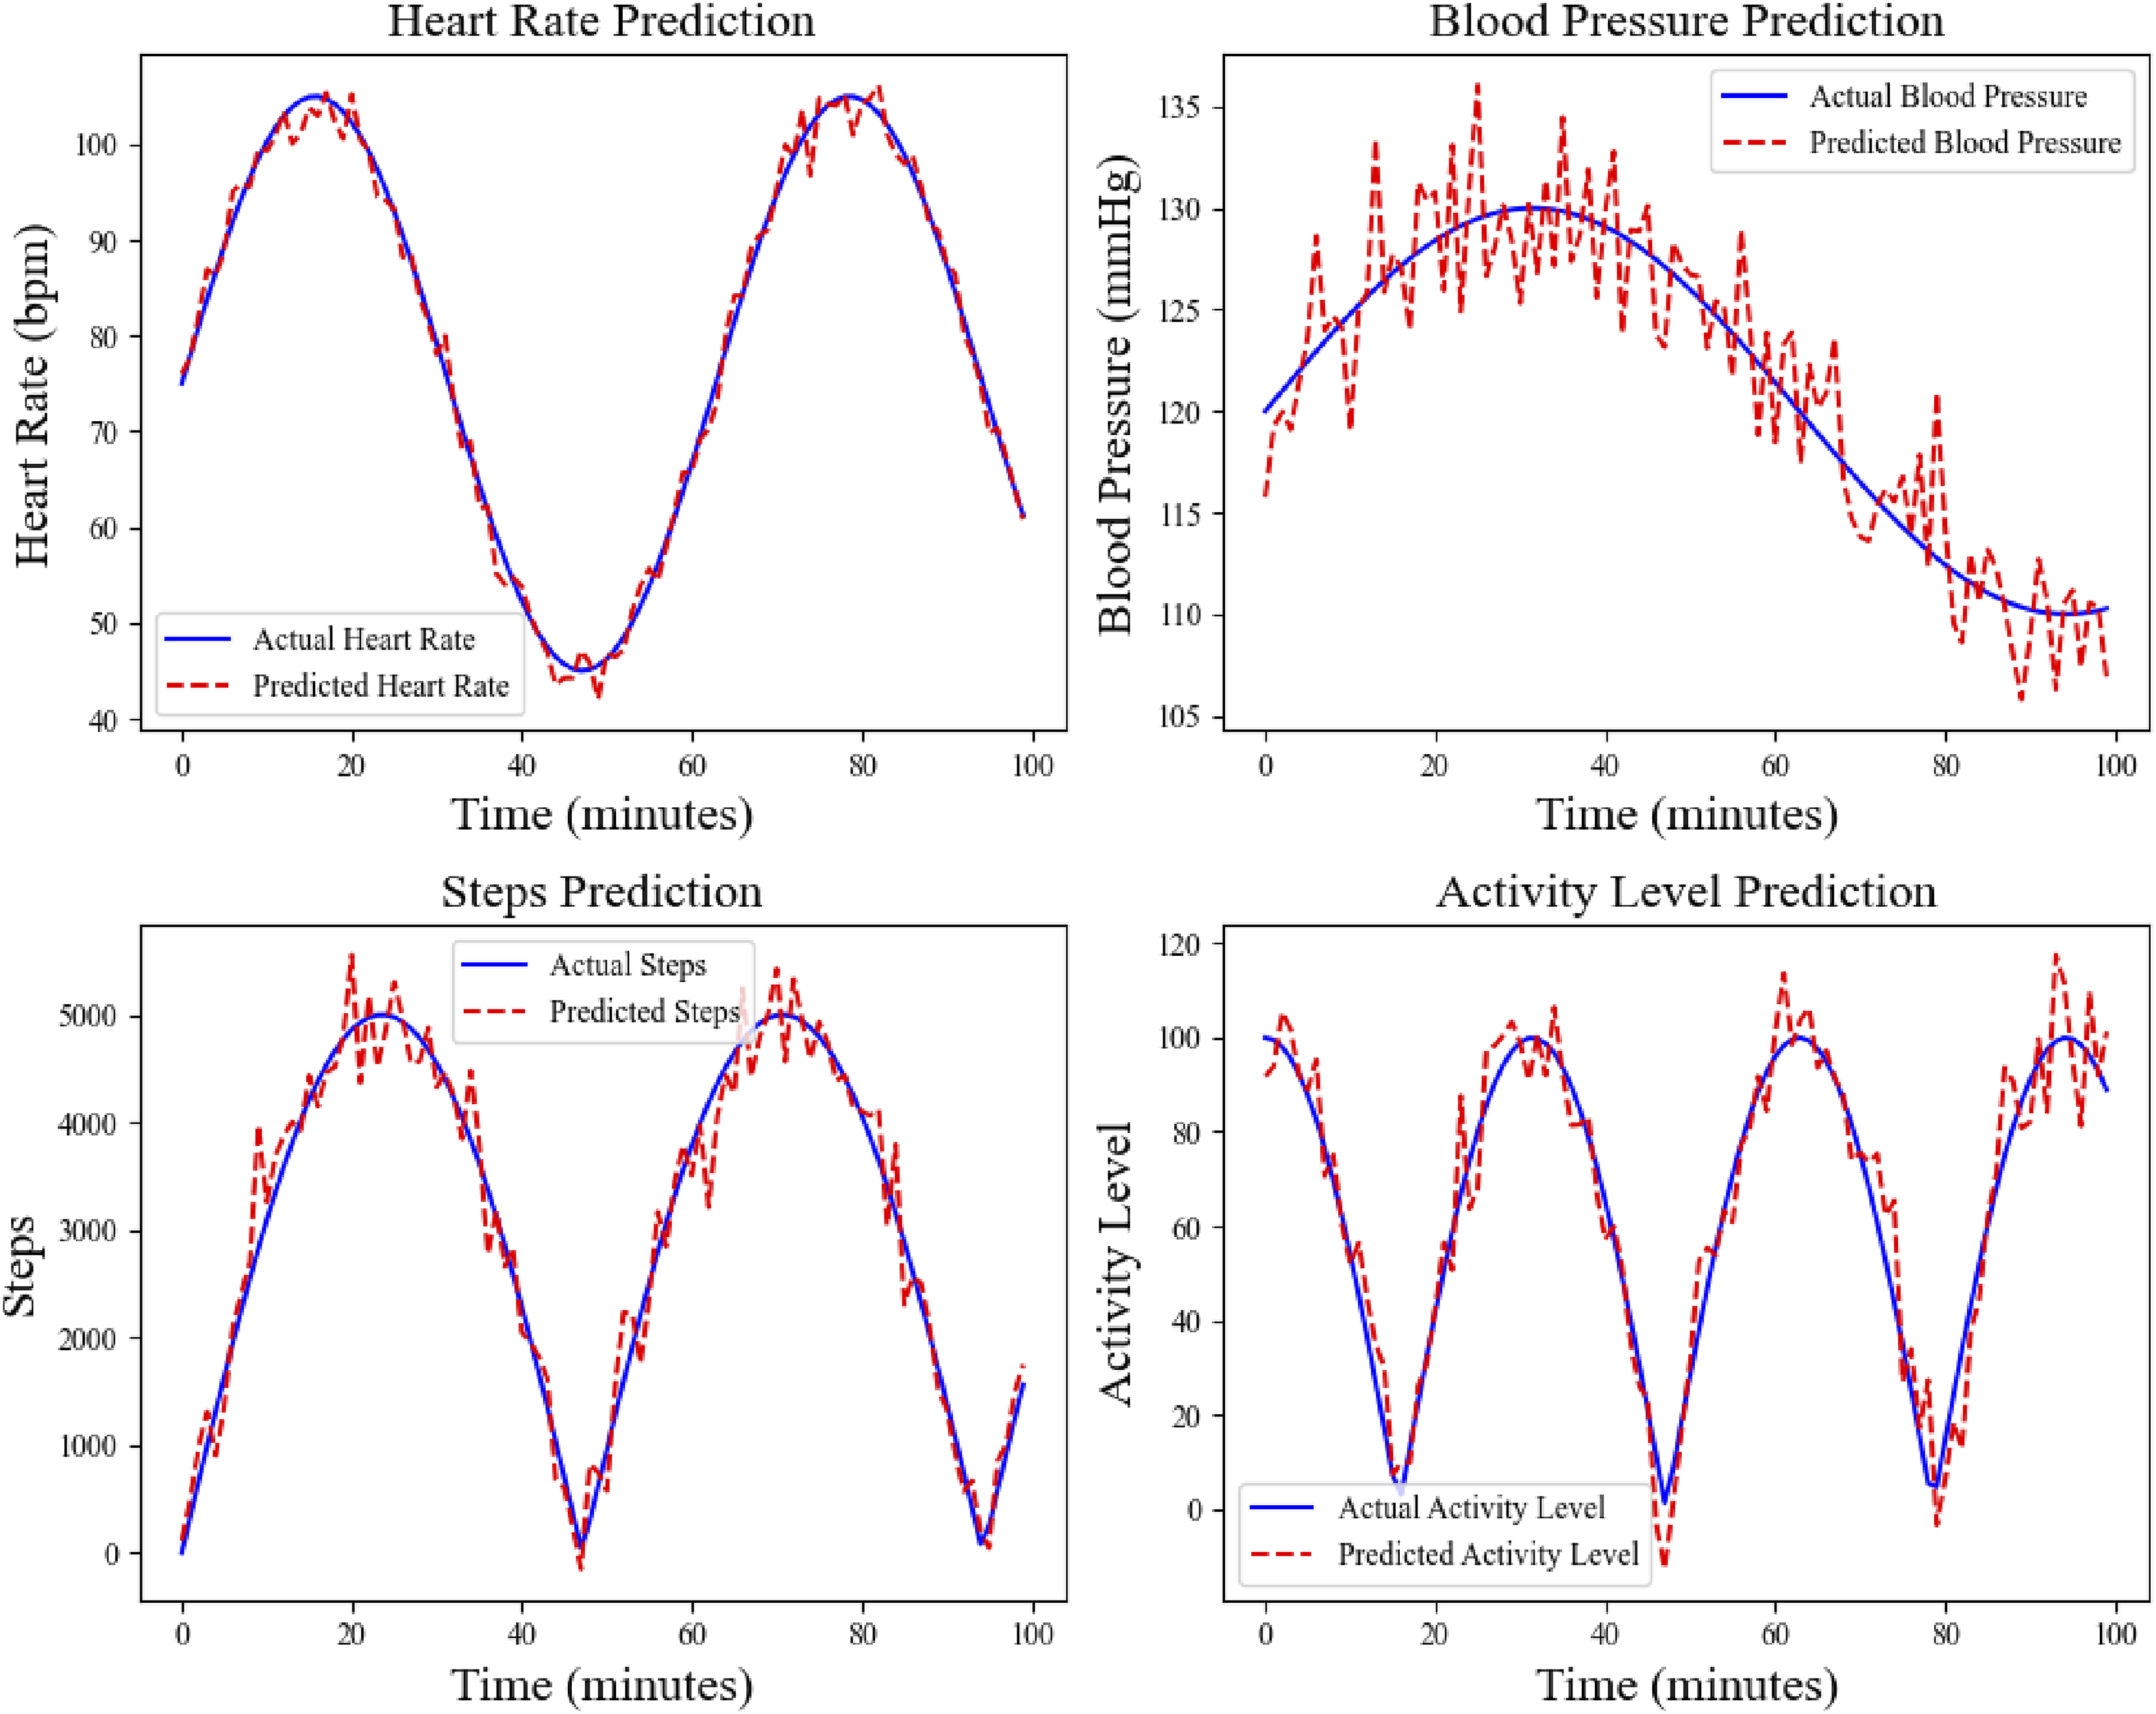
From Figure 4, in the heart rate prediction task, the fluctuation trend of the predicted value output by the model is relatively consistent with the actual value, and the change range of the predicted value and the actual value basically coincide, indicating that the model has a strong ability to capture dynamic trends. The blood pressure prediction task also shows a small deviation fluctuation. Although the predicted value is closer to the actual value, the volatility of blood pressure data is slightly larger than that of heart rate, which is related to the volatility of blood pressure data under individual differences and changes in the external environment. The trend of step count prediction is relatively consistent, but the prediction results are slightly inaccurate in the changes of peak and trough values, which is affected by the high-frequency fluctuation characteristics of step count data. The overall results of exercise volume prediction are relatively stable, and the predicted values and actual values are highly overlapped in most time periods, showing the stability of the model in long-term health trend prediction. These results show that the model has relatively accurate prediction performance in different health data types, especially in health indicators with relatively stable long-term trends, showing strong prediction capabilities.
To evaluate the effectiveness of this method in practical applications, this paper conducts error curve experiments on four health monitoring indicators to analyze the impact of different tasks on the accuracy of health data processing. Figure 5 shows the trend of MSE changes over time for different health indicators. MSE curves of various health indicators.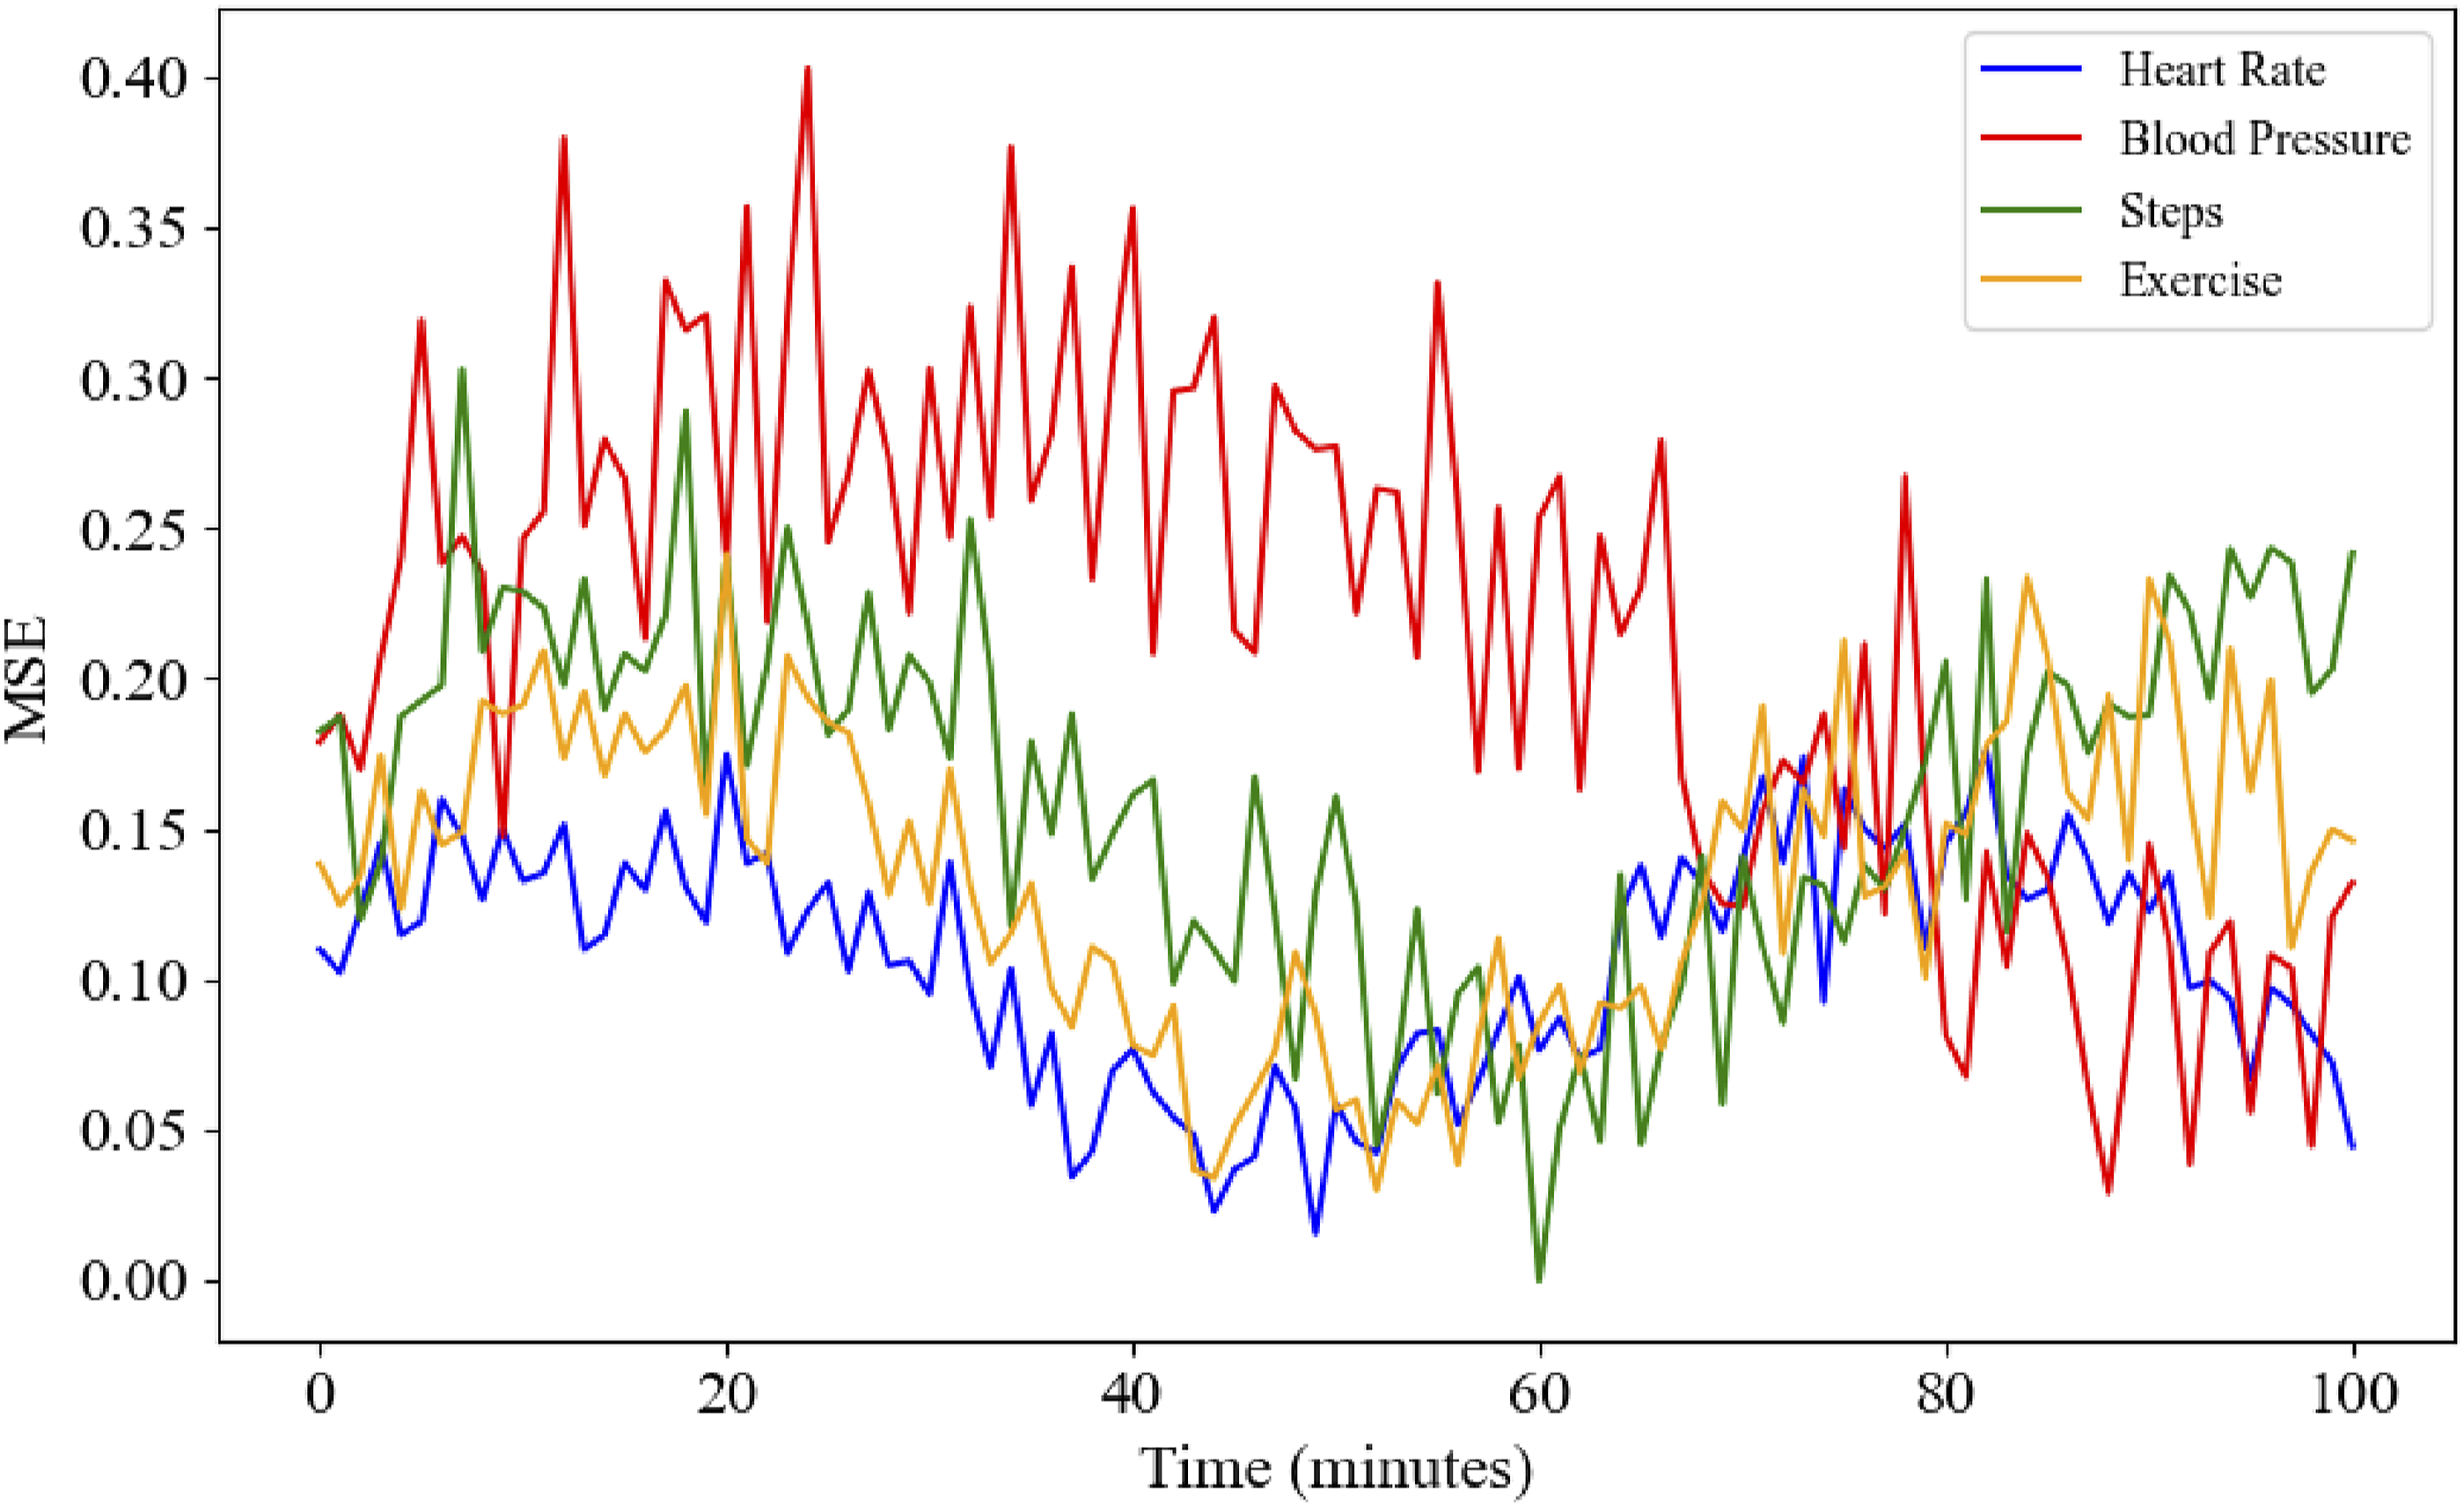
The curves in Figure 5 show the trend of the mean square error of different health characteristics over time. The MSE curve of heart rate shows relatively small fluctuations, and its maximum error value is about 0.18, indicating that the abnormal detection and trend prediction of heart rate are relatively accurate and the error is low. The MSE curve of blood pressure is significantly higher than the other three, with the maximum error reaching 0.4, which is related to the fact that blood pressure is greatly affected by a variety of external environmental factors and the data volatility is strong. Therefore, it is difficult to precisely fit the model during the prediction process. The error values of steps and exercise volume are in the middle, with the highest MSE value of steps being 0.3 and the MSE of exercise volume being 0.24, indicating that these two indicators are relatively stable, but there are still certain prediction errors. Overall, the abnormal detection of heart rate is the most precise; the error of blood pressure is the largest; the errors of other features are at a medium level.
Effectiveness of MTL
In the comparative study of MTL and single-task learning, to evaluate the performance difference between the two in health data anomaly detection and trend prediction, the experiment sets up several key performance indicators. Among them, Acc, P, R, and F1 scores are used to evaluate the performance of anomaly detection, and MSE is used to evaluate the performance of trend prediction. By training and testing on the standardized smart elderly health dataset, it is revealed how the MTL framework improves the prediction accuracy and anomaly detection ability of multiple tasks by sharing features. Figure 6 shows the performance difference of these comparison indicators under the single-task learning and MTL frameworks. Performance comparison of single-task learning and MTL.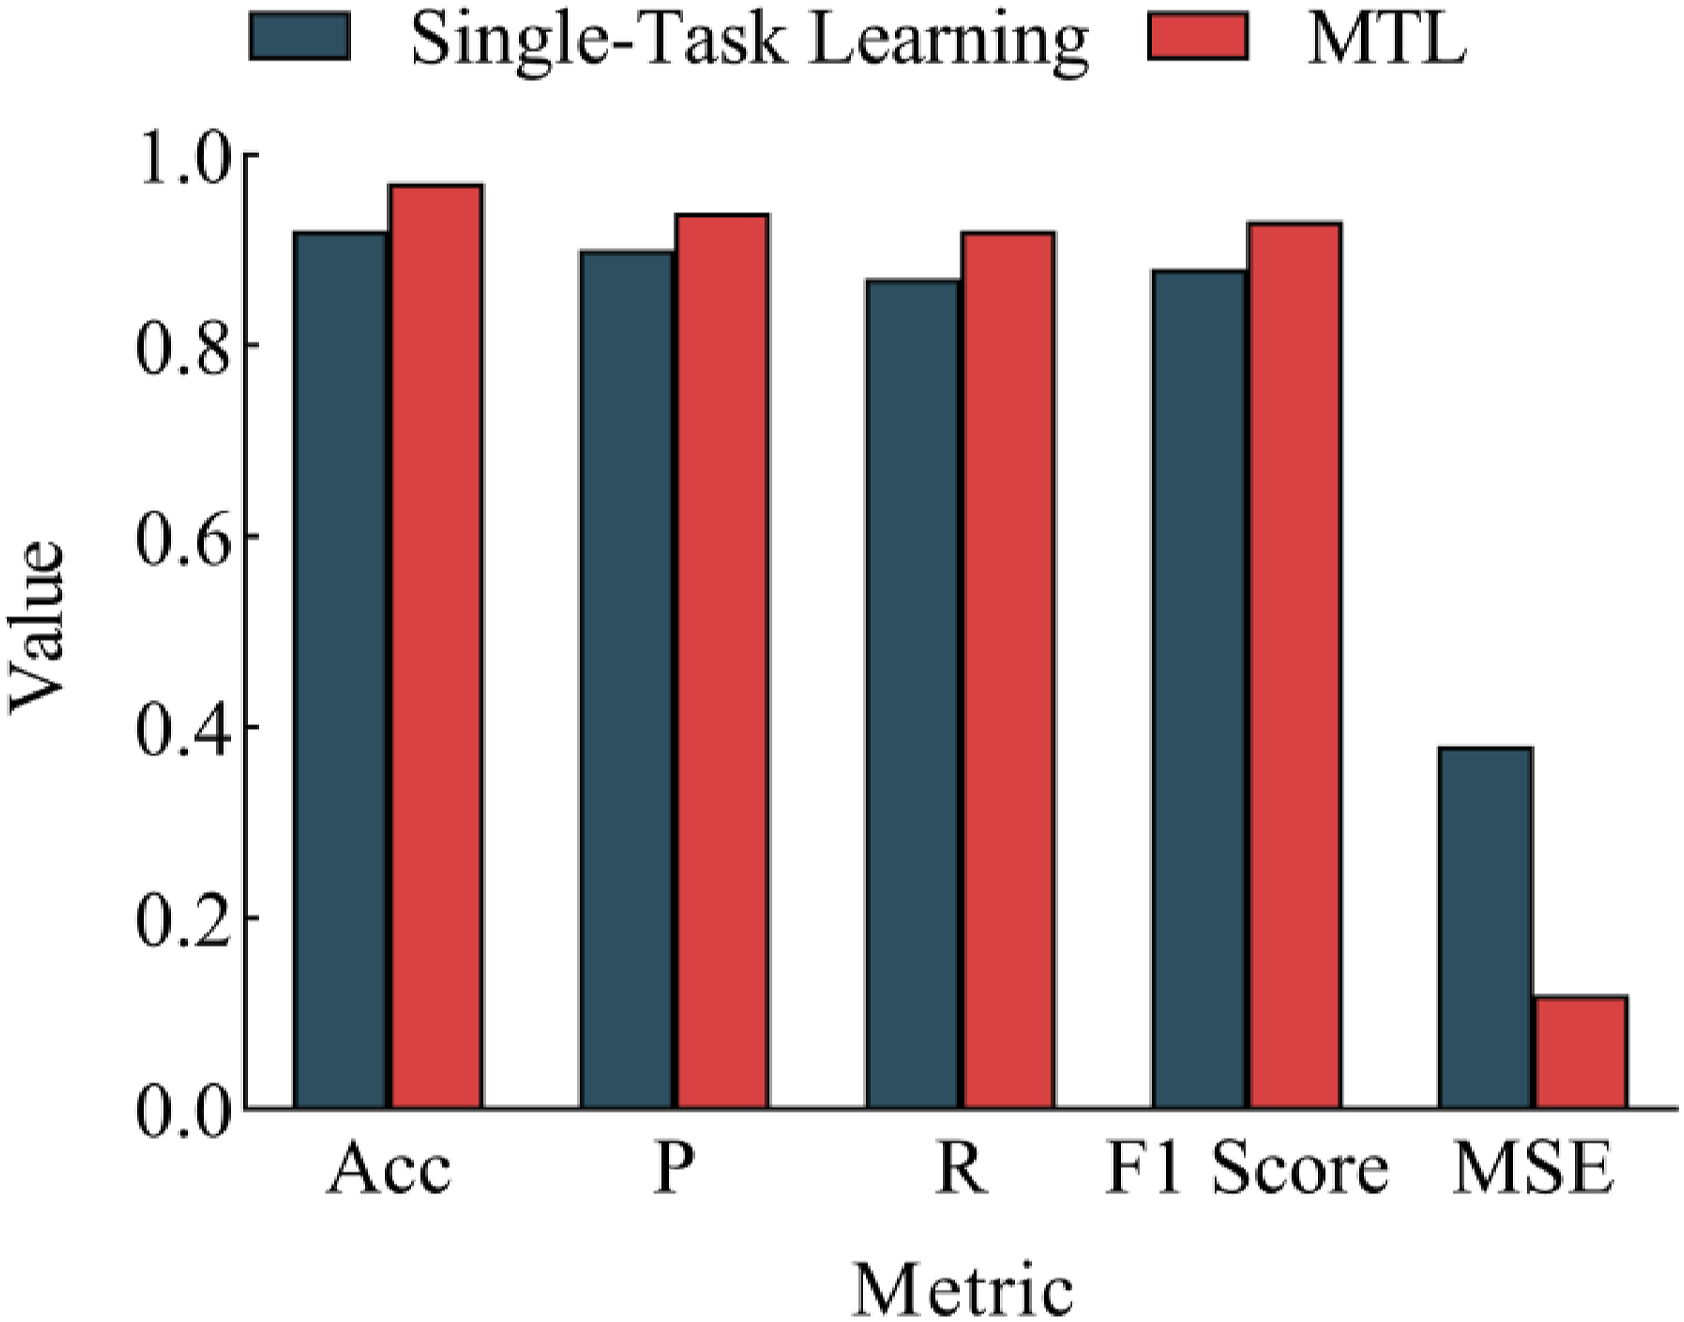
From the data in Figure 6, the MTL framework is better than single-task learning in all indicators. In terms of Acc, MTL’s 0.97 is higher than single-task learning’s 0.92, indicating that MTL has stronger ability in recognition and classification precision. P and R increase from 0.90 to 0.87 of single-task learning to 0.94 and 0.92 of MTL, respectively, showing that MTL more effectively reduces the number of false positives and false negatives by sharing features, and improves the overall detection ability of the model. The F1 score increases from 0.88 in single-task learning to 0.93, verifying the balanced optimization of P and R. In terms of MSE, MTL shows a significant advantage, which drops to 0.12. MTL improves various key performance indicators and also demonstrates stronger robustness and generalization capabilities in anomaly detection and health trend prediction tasks.
Model robustness
With the increasing diversity and complexity of smart elderly care health data, how to effectively evaluate the impact of different data scales and feature dimensions on model performance has become a key issue in research in this field. The experiment analyzes the health data of 5000 samples and explores the accuracy of the model in anomaly detection tasks under different data scales and feature dimensions. The experimental findings are illustrated in Figure 7. The impact of different data scales and feature dimensions on model performance.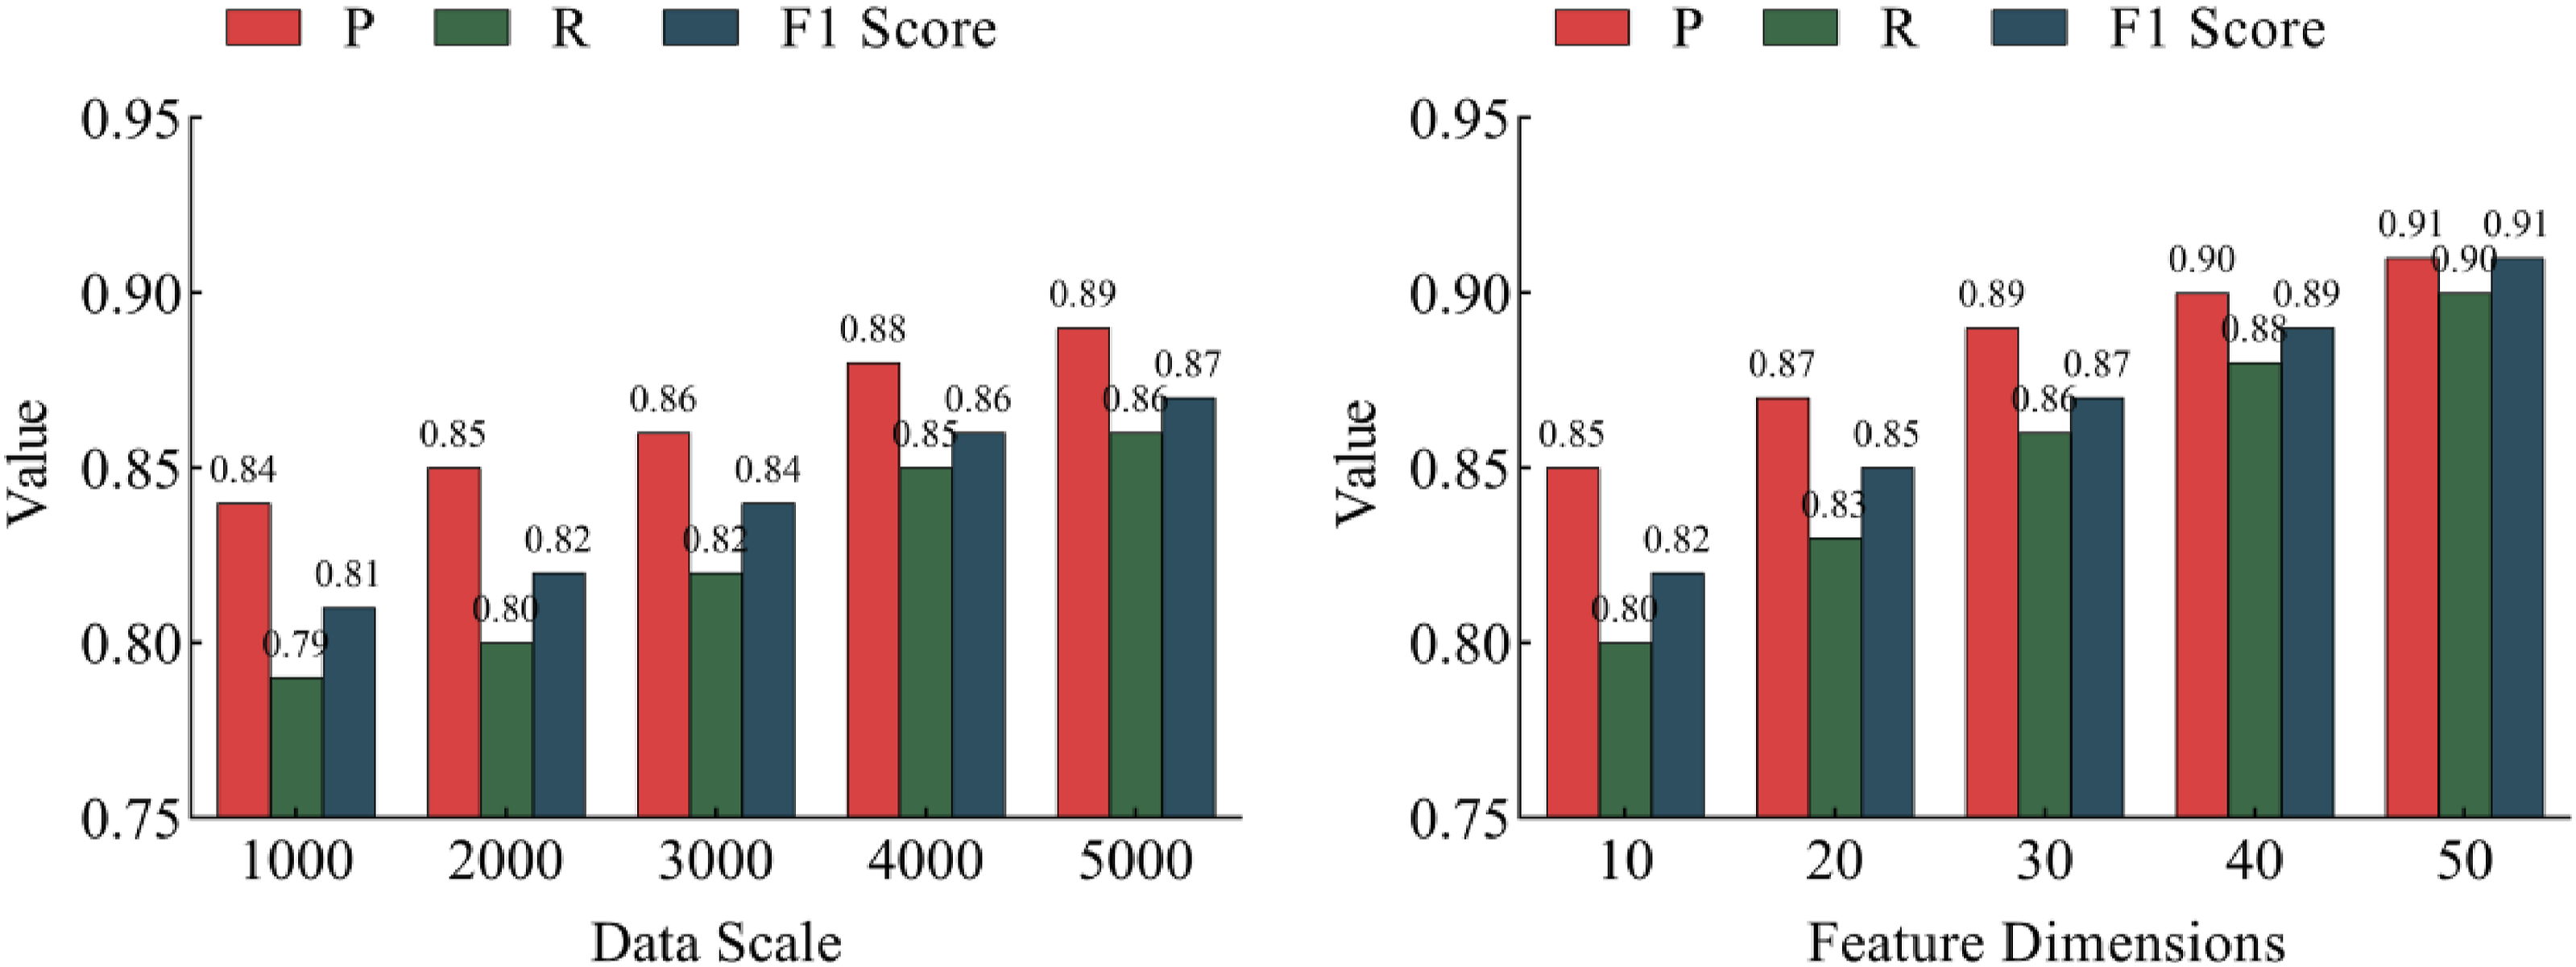
Figure 7 shows that with the increase of data scale, P, R, and F1 scores all show significant improvement. From 1000 samples to 5000 samples, P increases from 0.84 to 0.89; R increases from 0.79 to 0.86; F1 score increases from 0.81 to 0.87. The increase in data size means more training samples, which can better capture the laws in the data, thereby improving the accuracy and stability of the model. In terms of feature dimensions, as the number of dimensions increases, the performance is gradually optimized. The P of 50-dimensional features reaches 0.91; R is 0.90; F1 score is 0.91. This phenomenon shows that increasing feature dimensions helps to provide more information, improve the discriminative ability of the model, and achieve higher detection accuracy. Overall, the increase in data scale and feature dimensions has a significant effect on improving model performance, proving that with larger scale and richer features, the model can better handle complex data and improve detection accuracy.
Conclusions
This paper presents an anomaly detection and health trend prediction method for smart elderly care data by integrating multi-task learning (MTL) and support vector machines (SVMs). A shared feature representation module is constructed within the MTL framework to jointly optimize the tasks of anomaly detection and health trend prediction. Experimental results demonstrate that, in the anomaly detection task, the SVM model with a RBF kernel achieves an F1 score of 0.89, outperforming other baseline methods such as K-means. For the health trend prediction task, the model achieves mean squared errors (MSE) of 0.18 for heart rate, 0.40 for blood pressure, 0.30 for step count, and 0.24 for exercise volume, showcasing its predictive capability across various health indicators. Furthermore, compared to single-task learning approaches, the proposed MTL framework exhibits superior performance in terms of accuracy (Acc = 0.97), precision (p = 0.94), and recall (R = 0.92). Despite these promising results, the method still exhibits limitations when processing highly volatile data and remains sensitive to the scale and dimensionality of the input data. Future research will focus on enhancing the model’s robustness under high-dimensional conditions, exploring the interdependencies among additional tasks, and improving its generalization ability and predictive performance in complex health data scenarios.
ORCID iD
Yong Yang https://orcid.org/0009-0007-2723-4308
Footnotes
Funding
The authors disclosed receipt of the following financial support for the research, authorship, and/or publication of this article: (1) This work was supported by the Supported by the Science and Technology Research Program of Chongqing Municipal Education Commission (Grant No. KJZD-K202302901); project name: Optimization of key technology of visual object detection based on complex moving image and its application in teaching and training. (2) This work was supported by the Chongqing Preschool Education College Scientific Research Platform in 2024. Project name: Digital Elderly Care Service Big Data Application Research Center (Grant Number: 2024KYPT-01).
Declaration of conflicting interests
The authors declared no potential conflicts of interest with respect to the research, authorship, and/or publication of this article.