
Abstract
In power distribution networks, the correct identification of network topology and parameters is critical in maintaining efficient operating conditions. Operative efficiency and reliability are major goals in such networks. Satisfying these conditions necessitates a clear understanding of network parameters and topology, particularly in low-voltage power distribution networks, which are typically characterized by complicated patterns and fluctuating load demands. This research presents a novel approach utilizing the Voltage Regulator Weighted Topology Recurrent Neural Network (VR-WT-RNN) for joint identification of parameters and topology in low-voltage distribution networks. The Low-Voltage Network Dataset is used to capture time-series data from five nodes in a low-voltage electrical distribution network, and Z-score normalization was used for data preprocessing. The VR-WT-RNN approach combines weighted topology considerations within a recurrent neural network structure, enhancing its ability to accurately model and predict sophisticated network behaviors. Using records of voltage regulator settings, load profiles, and network configurations, the model can predict both network parameters and topology. The performance of the VR-WT-RNN model shows an effectiveness of up to 5% accuracy improvement for Transformer 2, accompanied by significant gains in NMI and ARI over traditional methods. Further, the responsiveness of the model towards dynamic variations of network conditions marks its usability within changing operating conditions.
Keywords
Introduction
Low-voltage distribution network (LVDN) is the final tier of the electrical power distribution system, which connects housing areas, small businesses, and local installations such as medium voltage substations and consumers. 1 It is usually utilized at voltages lower than 1 kV and consists of service cables, transformers, feeders, and consumer meters. LVDN power system is the largest grid segment, an advanced and scattered tool. 2 Compared to high-voltage networks, it is more difficult to monitor and control their asymmetries for LVDN, especially when the penetration level of distributed energy resources (DER) such as solar panels and battery storage increases. 3 To guarantee power quality, operating efficiency, and network reliability, information about the physical network topology and electrical characteristics (parameters) is required.
LVDNs are extensively used in urban and rural distribution networks, microgrids, industrial parks, and smart city networks. 4 In urban areas, load density is high with the increasing use of DER, and LVDNs must react quickly to varying conditions and diversified sources of generation. In rural or remote areas, precise network modeling is necessary to reduce energy losses and efficiently manage long feeder lines. 5 These networks also play an important role in community-scale integration of renewables, grid decentralization, and working towards energy equality. As governments strive to decarbonize and achieve net-zero, LVDNs are central in facilitating local energy trading, demand response, and electrifying transport and heating infrastructure. 6
The advantages of effective LVDN administration are enormous. These networks are the lifeline for providing energy to consumers, and their operation has a direct effect on power quality and reliability. 7 Precise detection of network structure and features allows the utilities to minimize losses, detect faults at initial stages, optimize voltage levels, and plan maintenance at optimum levels. With the widespread adoption of electric vehicles, smart appliances, and distributed renewable resources at the consumer level, load behavior and energy flow in LVDNs are getting more dynamic and sophisticated. 8 Simultaneous identification methods offer utilities a clear and up-to-date view of the network conditions so that they can carry out predictive maintenance, load balancing, and automated control systems, which is more economical and sustainable. 9
To meet these evolving requirements, joint estimation methods have come to the forefront to estimate topology and network parameters from the data sensed by smart meters, sensors, and other equipment. 10 They learn from noisy, incomplete, or indirect measurements using optimization, statistical, or machine learning-based methods. They fill the gap across problems like code-blind network modifications, hidden nodes, and sparse observability. 11 The above solutions accommodate real-time modeling with accuracy, improved grid planning, reconfiguration dynamics, and the integration of digital control systems. Joint discovery enables utilities to plan LVDNs as intelligent, dynamic networks which can be programmed to suit the needs of future power systems and future energy conditions. 12
LVDNs face various limitations, including high uncertainty, changing load dynamics, voltage instability, and missing topology or parameter information, which makes modeling and control challenging. These challenges complicate system optimization and real-time voltage regulation. VR-WT-RNN is used to alleviate these challenges due to its utilization of both real-time and historical data with its recurrent nature, enabling it to learn temporal patterns and hidden behaviors in network operation. Its topology-sensitive architecture ensures better fit to structural variations, enabling accurate voltage forecasting and robust control even with incomplete or uncertain network parameters.
Related works
The problem of identifying the electrical properties of distributed energy resources and flexible loads was addressed by Liao et al. 13 using a hierarchical topology detection technique developed for Active Low-Voltage Distribution Networks (LVDNs). Their approach deduced “transformer-phase-line-user” hierarchical topologies through a knowledge-based reasoning methodology incorporating logical knowledge extraction, a user attribution model, and regression analysis for active power estimation.
Wang et al. 14 proposed a method to simultaneously estimate distribution network topology and line parameters using a Power Flow Graph Convolutional Network (PFGCN). This method generated candidate topologies for estimation via a minimal distance iteration approach and node correlation concepts. Experimental simulations on modified IEEE-69 and IEEE-33 distribution systems demonstrated the technique’s robustness, precision, and transferability. The proposed system outperformed Adaptive Ridge Regression (ARR).
Jiao et al. 15 addressed LVDN topology identification with a novel data-driven approach designed to overcome challenges arising from low data collection rates and the absence of customer data. Their method compressed high-dimension time-series voltage data using a linear fitting strategy to represent noisy data, followed by clustering the compressed data for topology identification. The effectiveness and feasibility of the method were demonstrated using both real and simulated low-voltage distribution network data.
Li et al. 16 introduced a Deep-Shallow Neural Network (DSN) for power system state estimation. This approach employed a Deep Neural Network (DNN) to estimate missing values and create virtual nodes to substitute for nodes without sensors. The DSN achieved physical consistency in power flow equation estimation. Reduced grids were integrated into a single interconnected system using a reinforcement learning-based search method. Large-scale tests demonstrated the DSN’s adherence to physical behavior and its advantages over other methods in distribution networks.
Chen et al. 17 introduced a novel approach to enhance distribution network resilience using simplicial neural networks (SNNs) and persistent homology. They utilized Hodge–Laplacian analytics to characterize complex relations between higher-order graph substructures involving multiple nodes. Validation on three test distribution networks confirmed the contingency classification ability of their Higher-Order Topological Neural Networks (HOT-Nets) model. Tests in system resilience categorization demonstrated that HOT-Nets achieved improvements of up to 14.04%, outperforming nine advanced approaches.
García et al. 18 presented a Bayesian inference-based data-driven phase identification technique that utilizes load consumption characteristics as inputs. This approach improved the identification of challenging customers by providing confidence measures regarding customer phase linkages. The method effectively handled pre-labeled data, even with labeling errors, and surpassed existing state-of-the-art techniques. It serves as a valuable tool for Distribution System Operators (DSOs), performing well in actual low-voltage distribution networks and resolving incorrect prior labeling.
Sun et al. 19 presented a graph-theoretic technique for analyzing low-voltage power lines through focused topology identification. Their algorithm deduced line topology within a designated zone using IEC 61850 SCL topology configuration information. User data, geographic associations, and configuration files were utilized to partition the area into recognized and unrecognized regional topologies.
Zhang and Xu 20 solved topology identification (TI) issues in active LVDNs using a data-driven approach. Their algorithm employed active power, frequency domain filtering, and correlation factors for up-down and parallel branch detection, leveraging observations of nodal voltage magnitude and active power without requiring prior network information. Field tests on a high-constraint LVDN yielded excellent results, demonstrating superior performance under diverse conditions.
Zhang et al. 21 introduced a layer-by-layer stepwise regression-based low-voltage topology identification (LVTI) detection approach. This approach employed multi-linear regression, iterative updates, and a critical factor to refine the final identification result. Simulations demonstrated that, except for latent defects, the approach achieved over 90% accuracy, meeting the coordinated operating requirements for source-load-storage in low-voltage distribution networks.
Cui et al. 22 presented a four-level graph theory and constrained least squares-based automatic topology recognition method for LVDNs. This method utilized energy measurements provided by smart circuit breakers, eliminating the need for extra hardware. Random simulation data and actual application conditions validated the technique’s accuracy and efficiency, demonstrating its capability to ensure safe operation in LV distribution networks.
Liu et al. 23 proposed a hybrid data-driven approach to estimate distribution network topology and line parameters with limited datasets. It applied the Newtonian approach, linear regression, a decoupled linear power flow model, and a partial correlation analysis neighbor node selection process. The approach offered faster computation times without sacrificing accuracy, exhibited versatility by adapting to networks of any size, and achieved accurate estimation of both parameters and topology.
Methodology
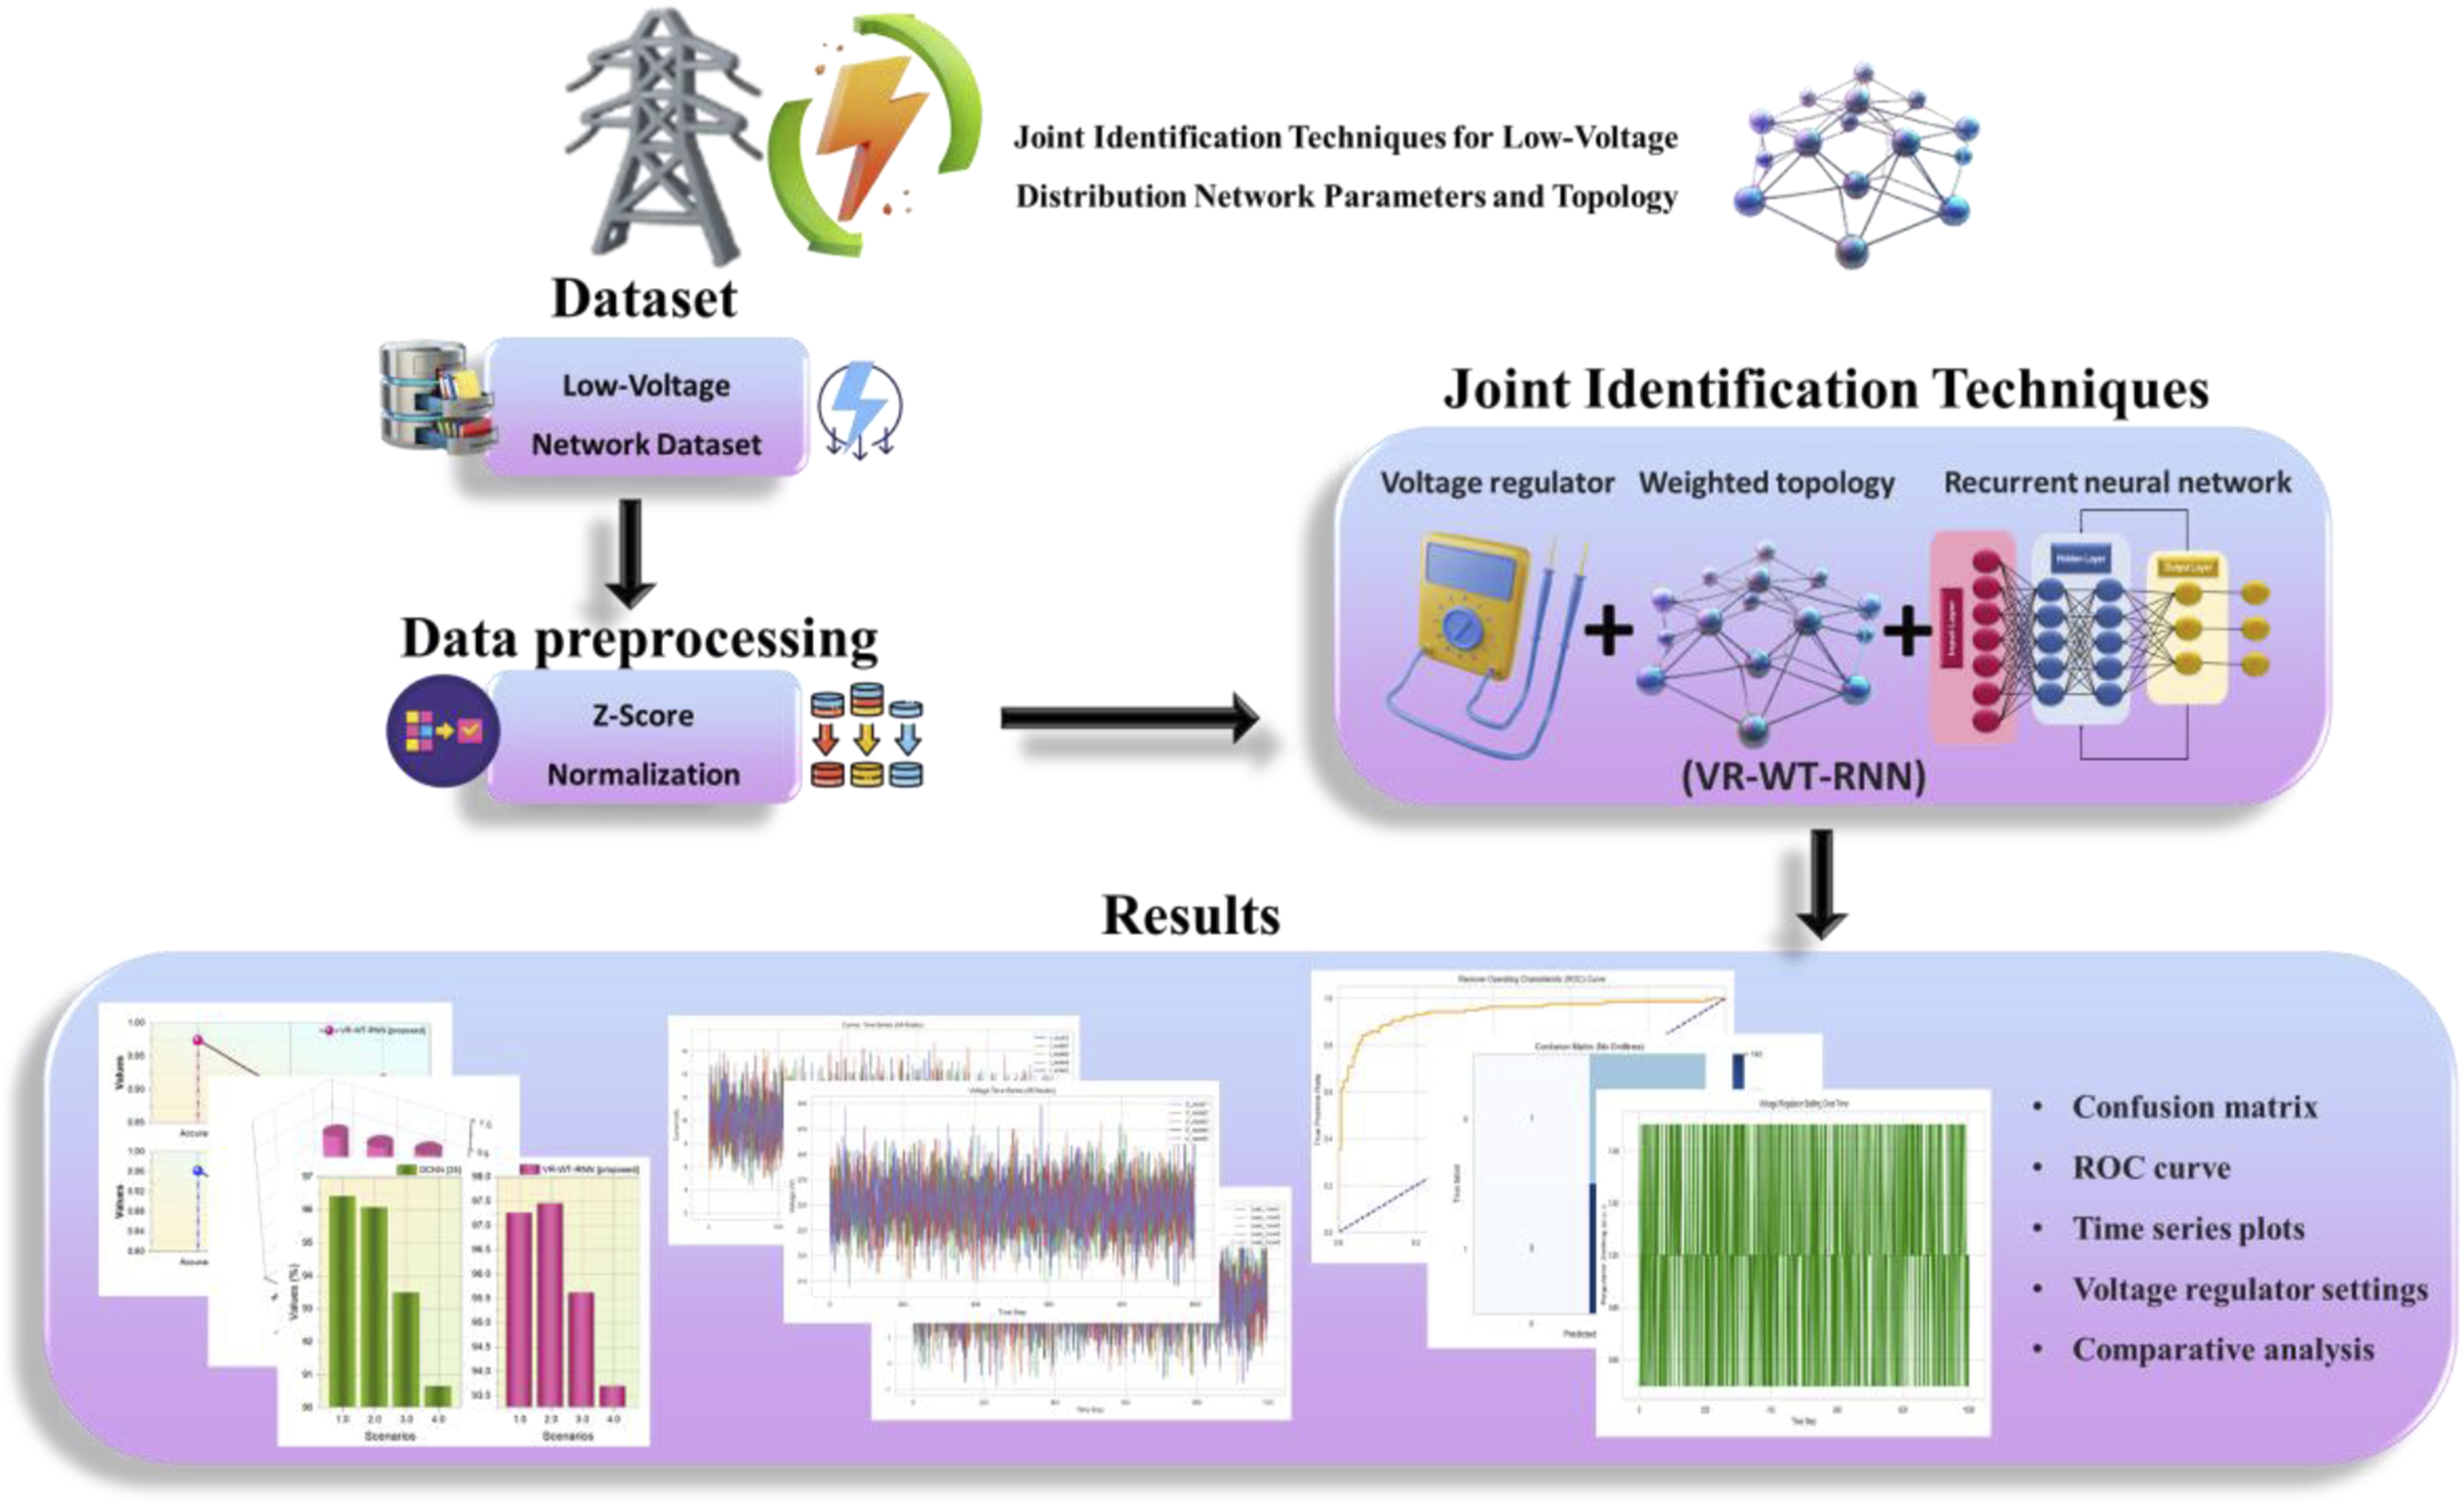
An LVDN is the final part of an electrical distribution system that supplies power to end consumers at low voltages. These networks often distribute power from substations to residences and businesses. In this case, historical data such as voltage regulator settings, load profiles, and network configurations are employed, with Z-score normalization employed for preprocessing to enable effective model training. The proposed VR-WT-RNN model uses this data to jointly identify parameters and topology, which improves predicted accuracy and flexibility under real-time system settings. Figure 1 shows the overall proposed flow for the LVDN. Overall proposed flow for the joint identification of LVDN parameter and topology.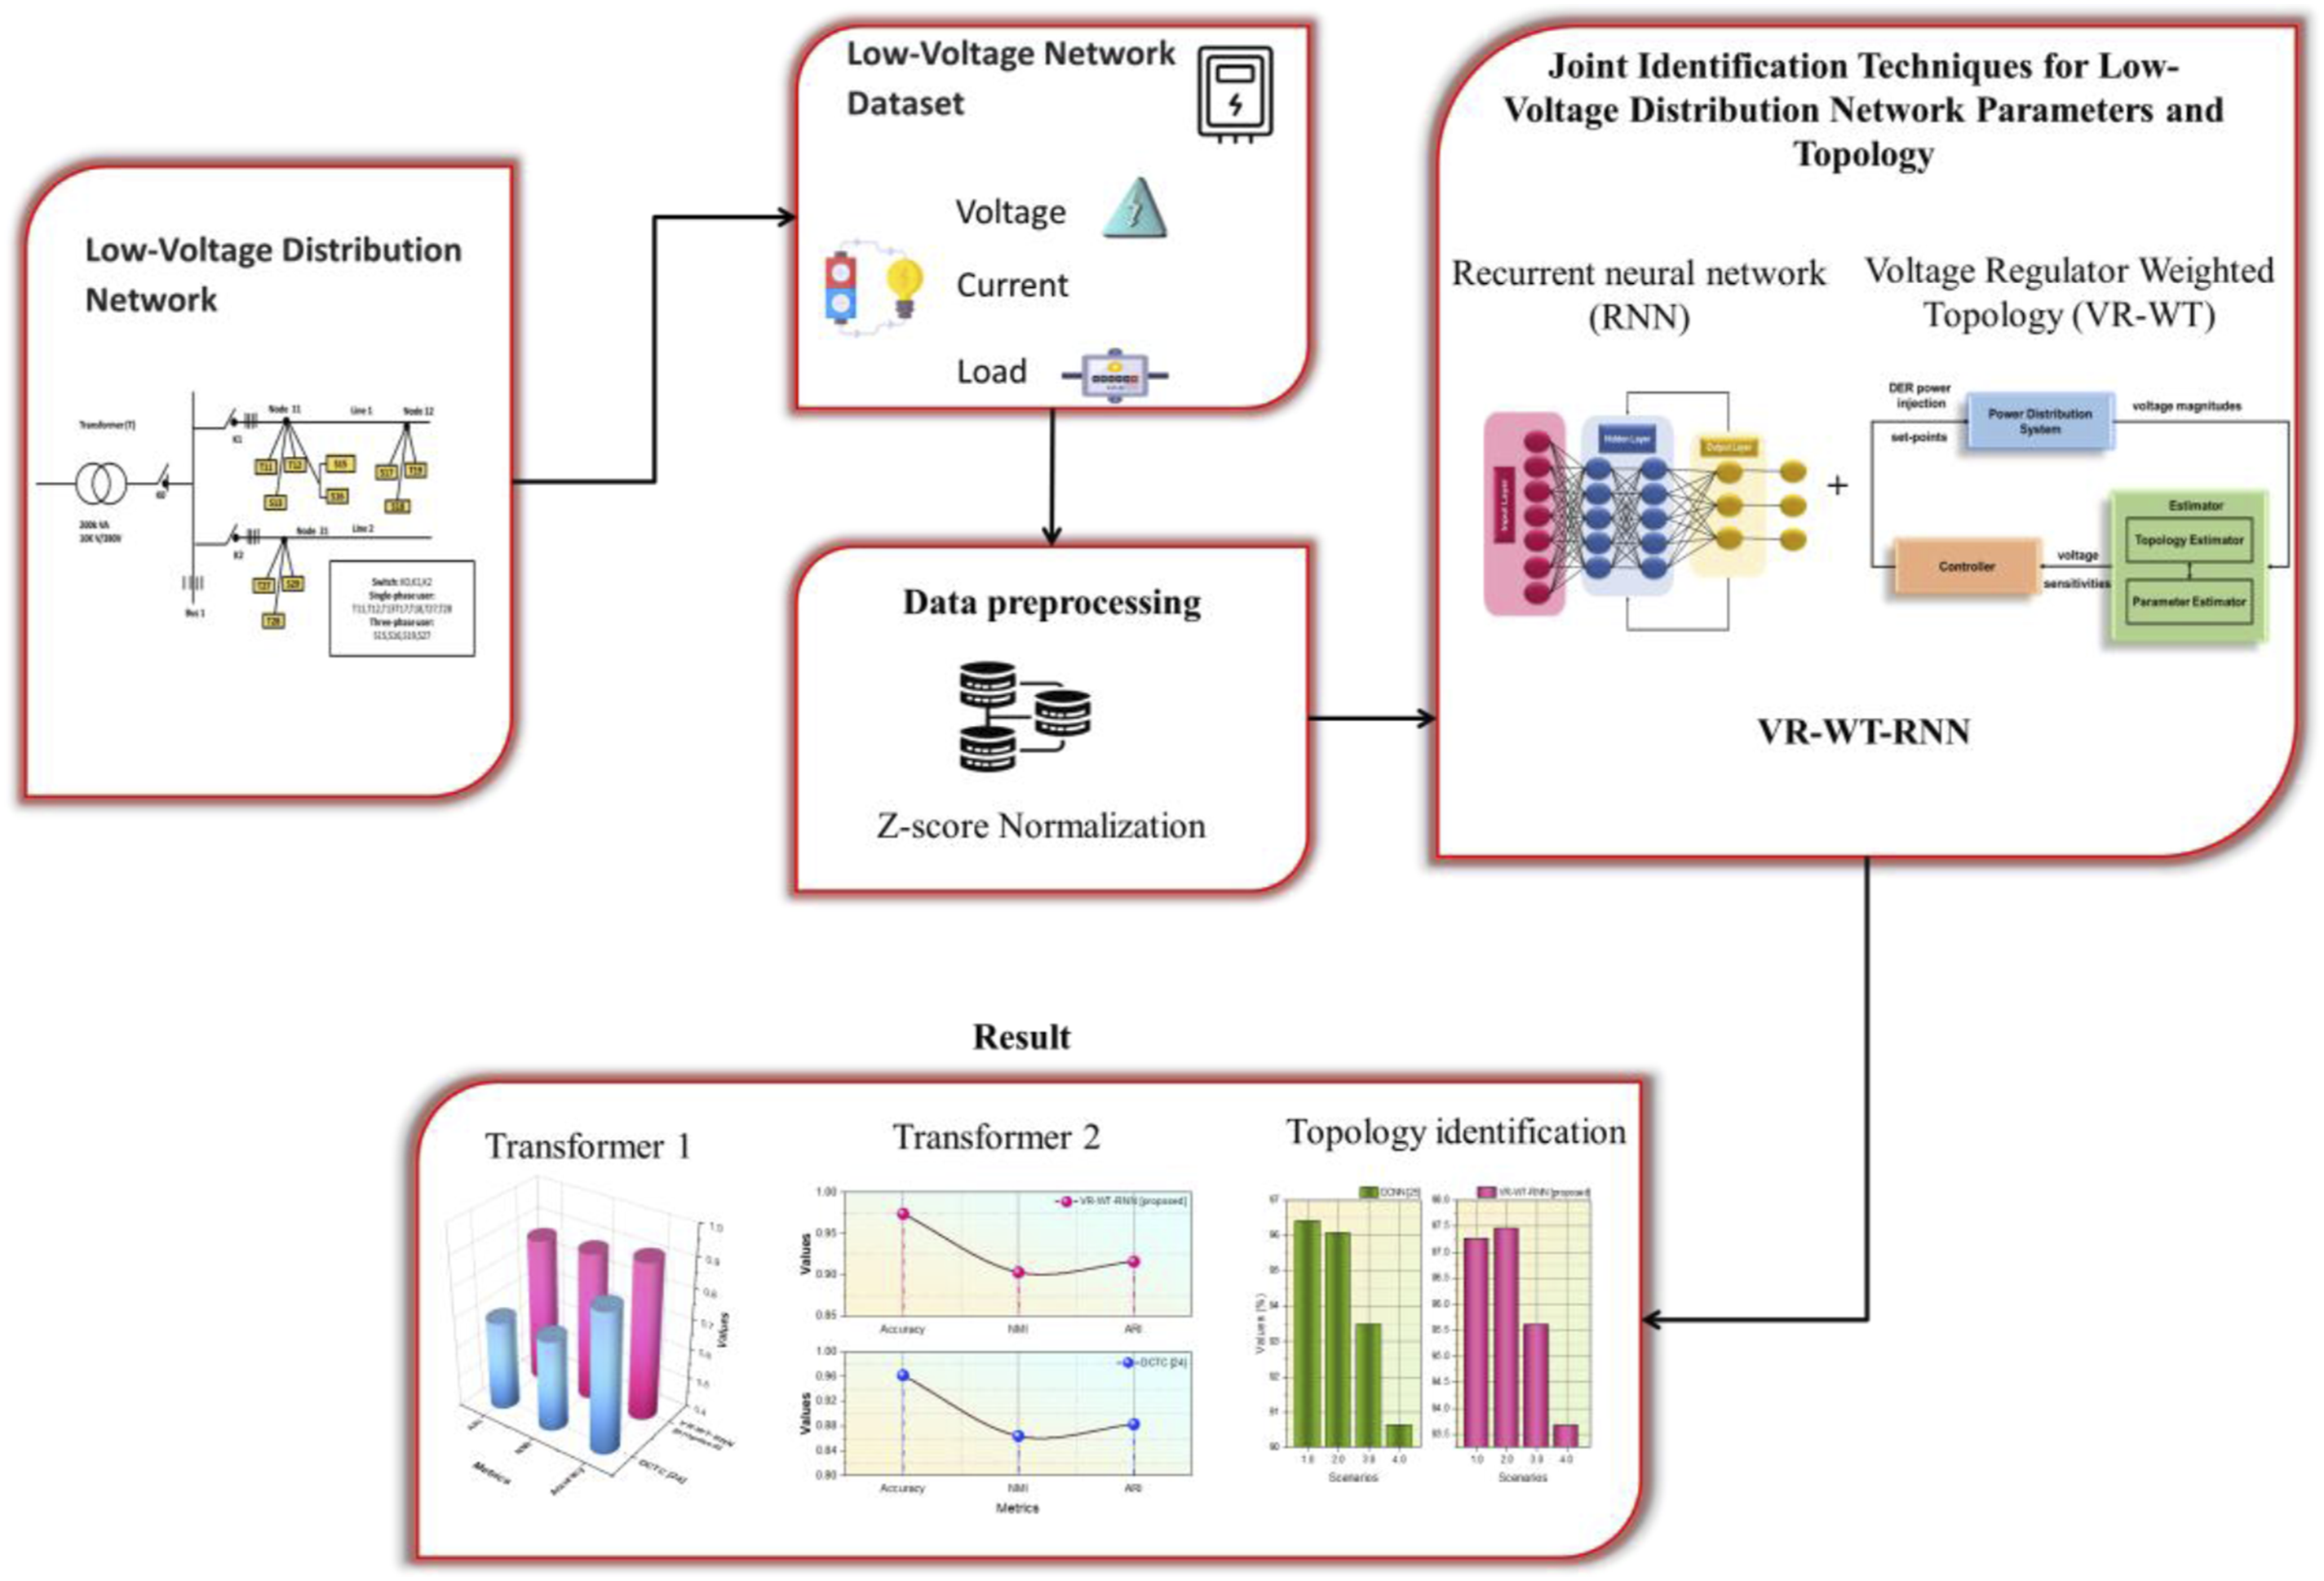
LVDN relationship identification
In this section, LVDN data and preprocessing are performed using Z-score normalization, and evaluation criteria are applied to analyze the performance of the Transformer in the LVDN.
Dataset and data preprocessing
The Low-Voltage Network Dataset is a time-series dataset designed to assist with training and evaluating machine learning models for detecting network characteristics and topology in low-voltage distribution systems. This dataset is made up of 1000 time samples, each of which contains data from five nodes in the network. The information for each time step comprises voltage values (V_node1 to V_node5) ranging from 220V to 240V, current values (I_node1 to I_node5) ranging from 8A to 12A, and load demand (Load_node1 to Load_node5) ranging from 1 kW to 3.5 kW per node. Additionally, the regulator settings (Regulator_Setting) are shown as per-unit values of 0.95, 1.0, and 1.05. The target column (Target) is a binary classification label, with 1 indicating proper identification of network characteristics and topology and 0 indicating wrong configuration. This dataset was created primarily for training to jointly identify network topologies and parameters, as well as for applications such as anomaly detection and load forecasting in smart grids.
Source: https://www.kaggle.com/datasets/ziya07/low-voltage-network-dataset/data.
After data collection from the Low-Voltage Distribution Network, Z-score normalization is employed during preprocessing to normalize parameters and topology-related information. This strategy alters the data by dividing by the standard deviation (SD) and removing the mean, producing a dataset with a zero mean and a SD. A vector containing all input data features gets normalized through the application of every characteristic’s mean and standard deviation value detected within the learning data collections. A calculation of mean and standard deviation occurs for every characteristic within the data. Equation (1) demonstrates a normalized data relation with

LVDN architecture
LVDN is powered by RNN architecture.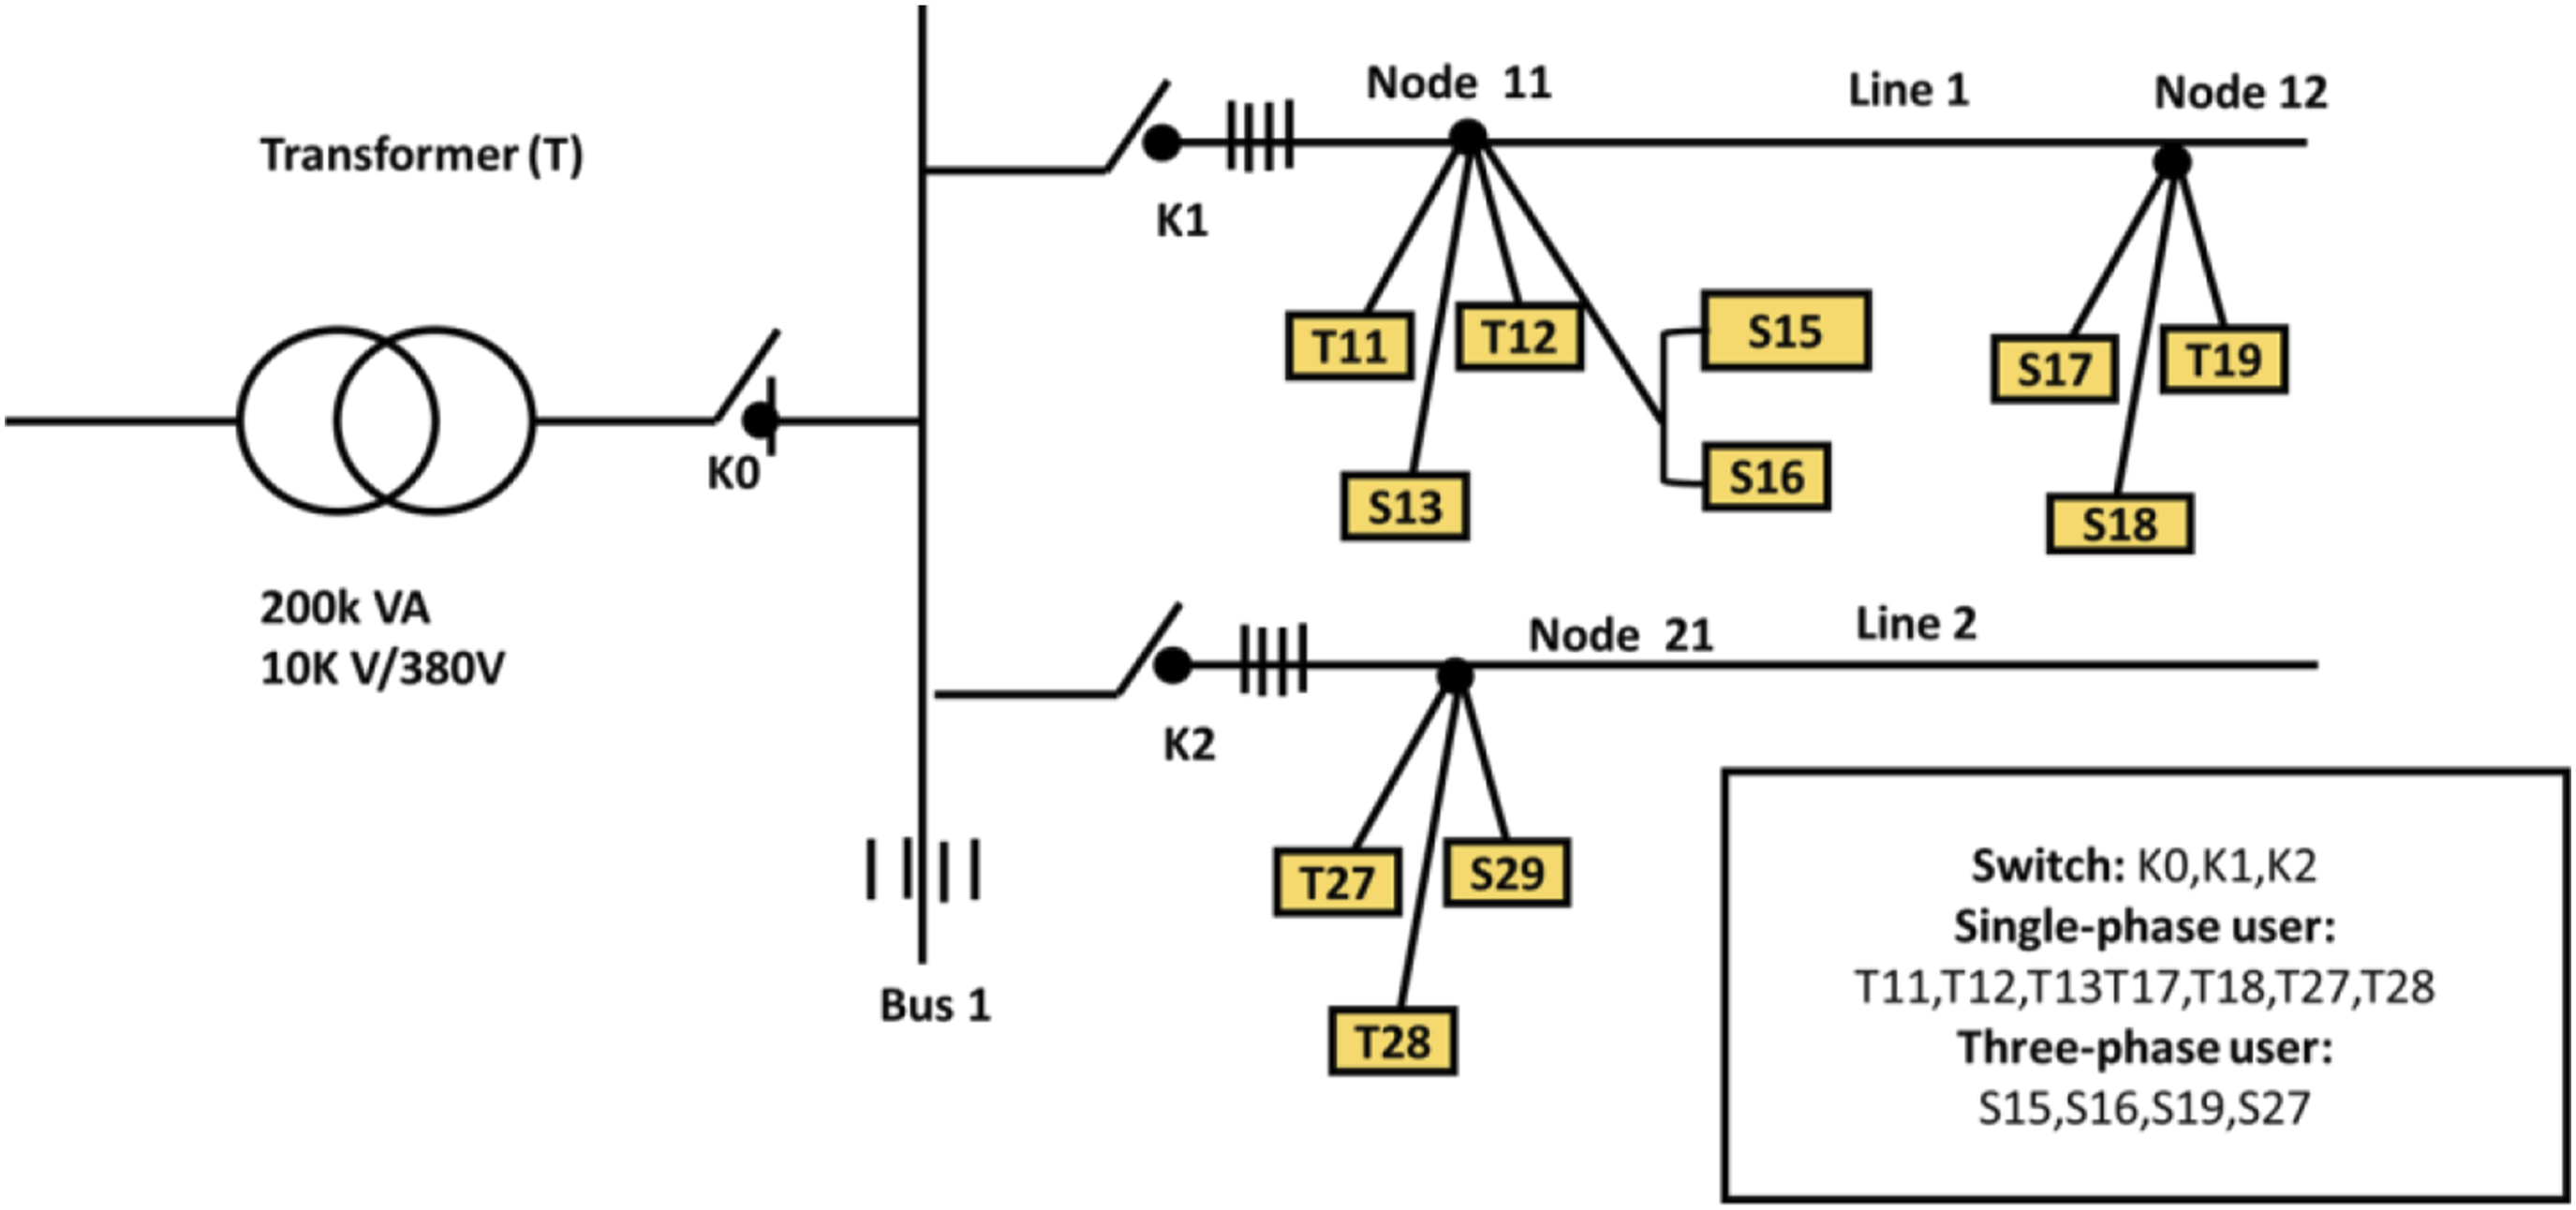
An LVDN provides electricity by region, with an availability range that cannot be greater than the overhead medium-voltage line’s segment switches. Electricity is typically supplied to the grid by a single distribution transformer, positioning the user load at the terminal end of the distribution network. In counties, prefecture-level cities, and economically developed core towns, distribution points are typically spaced 400 meters or less apart, large cities usually have a power supply radius of less than 150 meters. Chain distribution is suitable for low-capacity electrical devices located far from the power supply source and close together. The main distribution box in a multi-story building can be connected to the distribution boxes on each level using trunk distribution or zoned trunk distribution. Electricity is usually supplied to distribution points on each floor of high-rise buildings via zonal trunk distribution. The user distribution box is usually connected to shafts or the distribution box in the floor distribution room via radial distribution.
Problem formulation
In low-voltage electrical distribution networks, accurately identifying network parameters (impedance) and topology (network connectivity) is crucial for efficient operation and maintenance. This task is challenging due to power flow equations, dynamic load variations, and frequent reconstruction of the network. A low-voltage network dataset includes voltage, current, load profiles, and voltage regulatory applications, objective of estimating both network parameters and topology. This challenge is designed as a supervised learning task, in which a neural network is used to predict an imminent matrix representing impedance values and network architecture for each network branch. Objective function
The objective is to minimize the overall loss, which is made up of two components: parameter estimation error and topology identification error as in equation (2) Parameter estimation

The initial part of the loss, Topology identification

The second loss component,


This simultaneous optimization technique enables the VR-WT-RNN to learn the network physical parameters as well as network structural configuration using low-voltage network data. With the integration of voltage regulator settings as weighted inputs, the model can easily capture regulatory influences on voltage profiles, enhancing reliability in parameter estimation and topology identification.
VR-WT-RNN
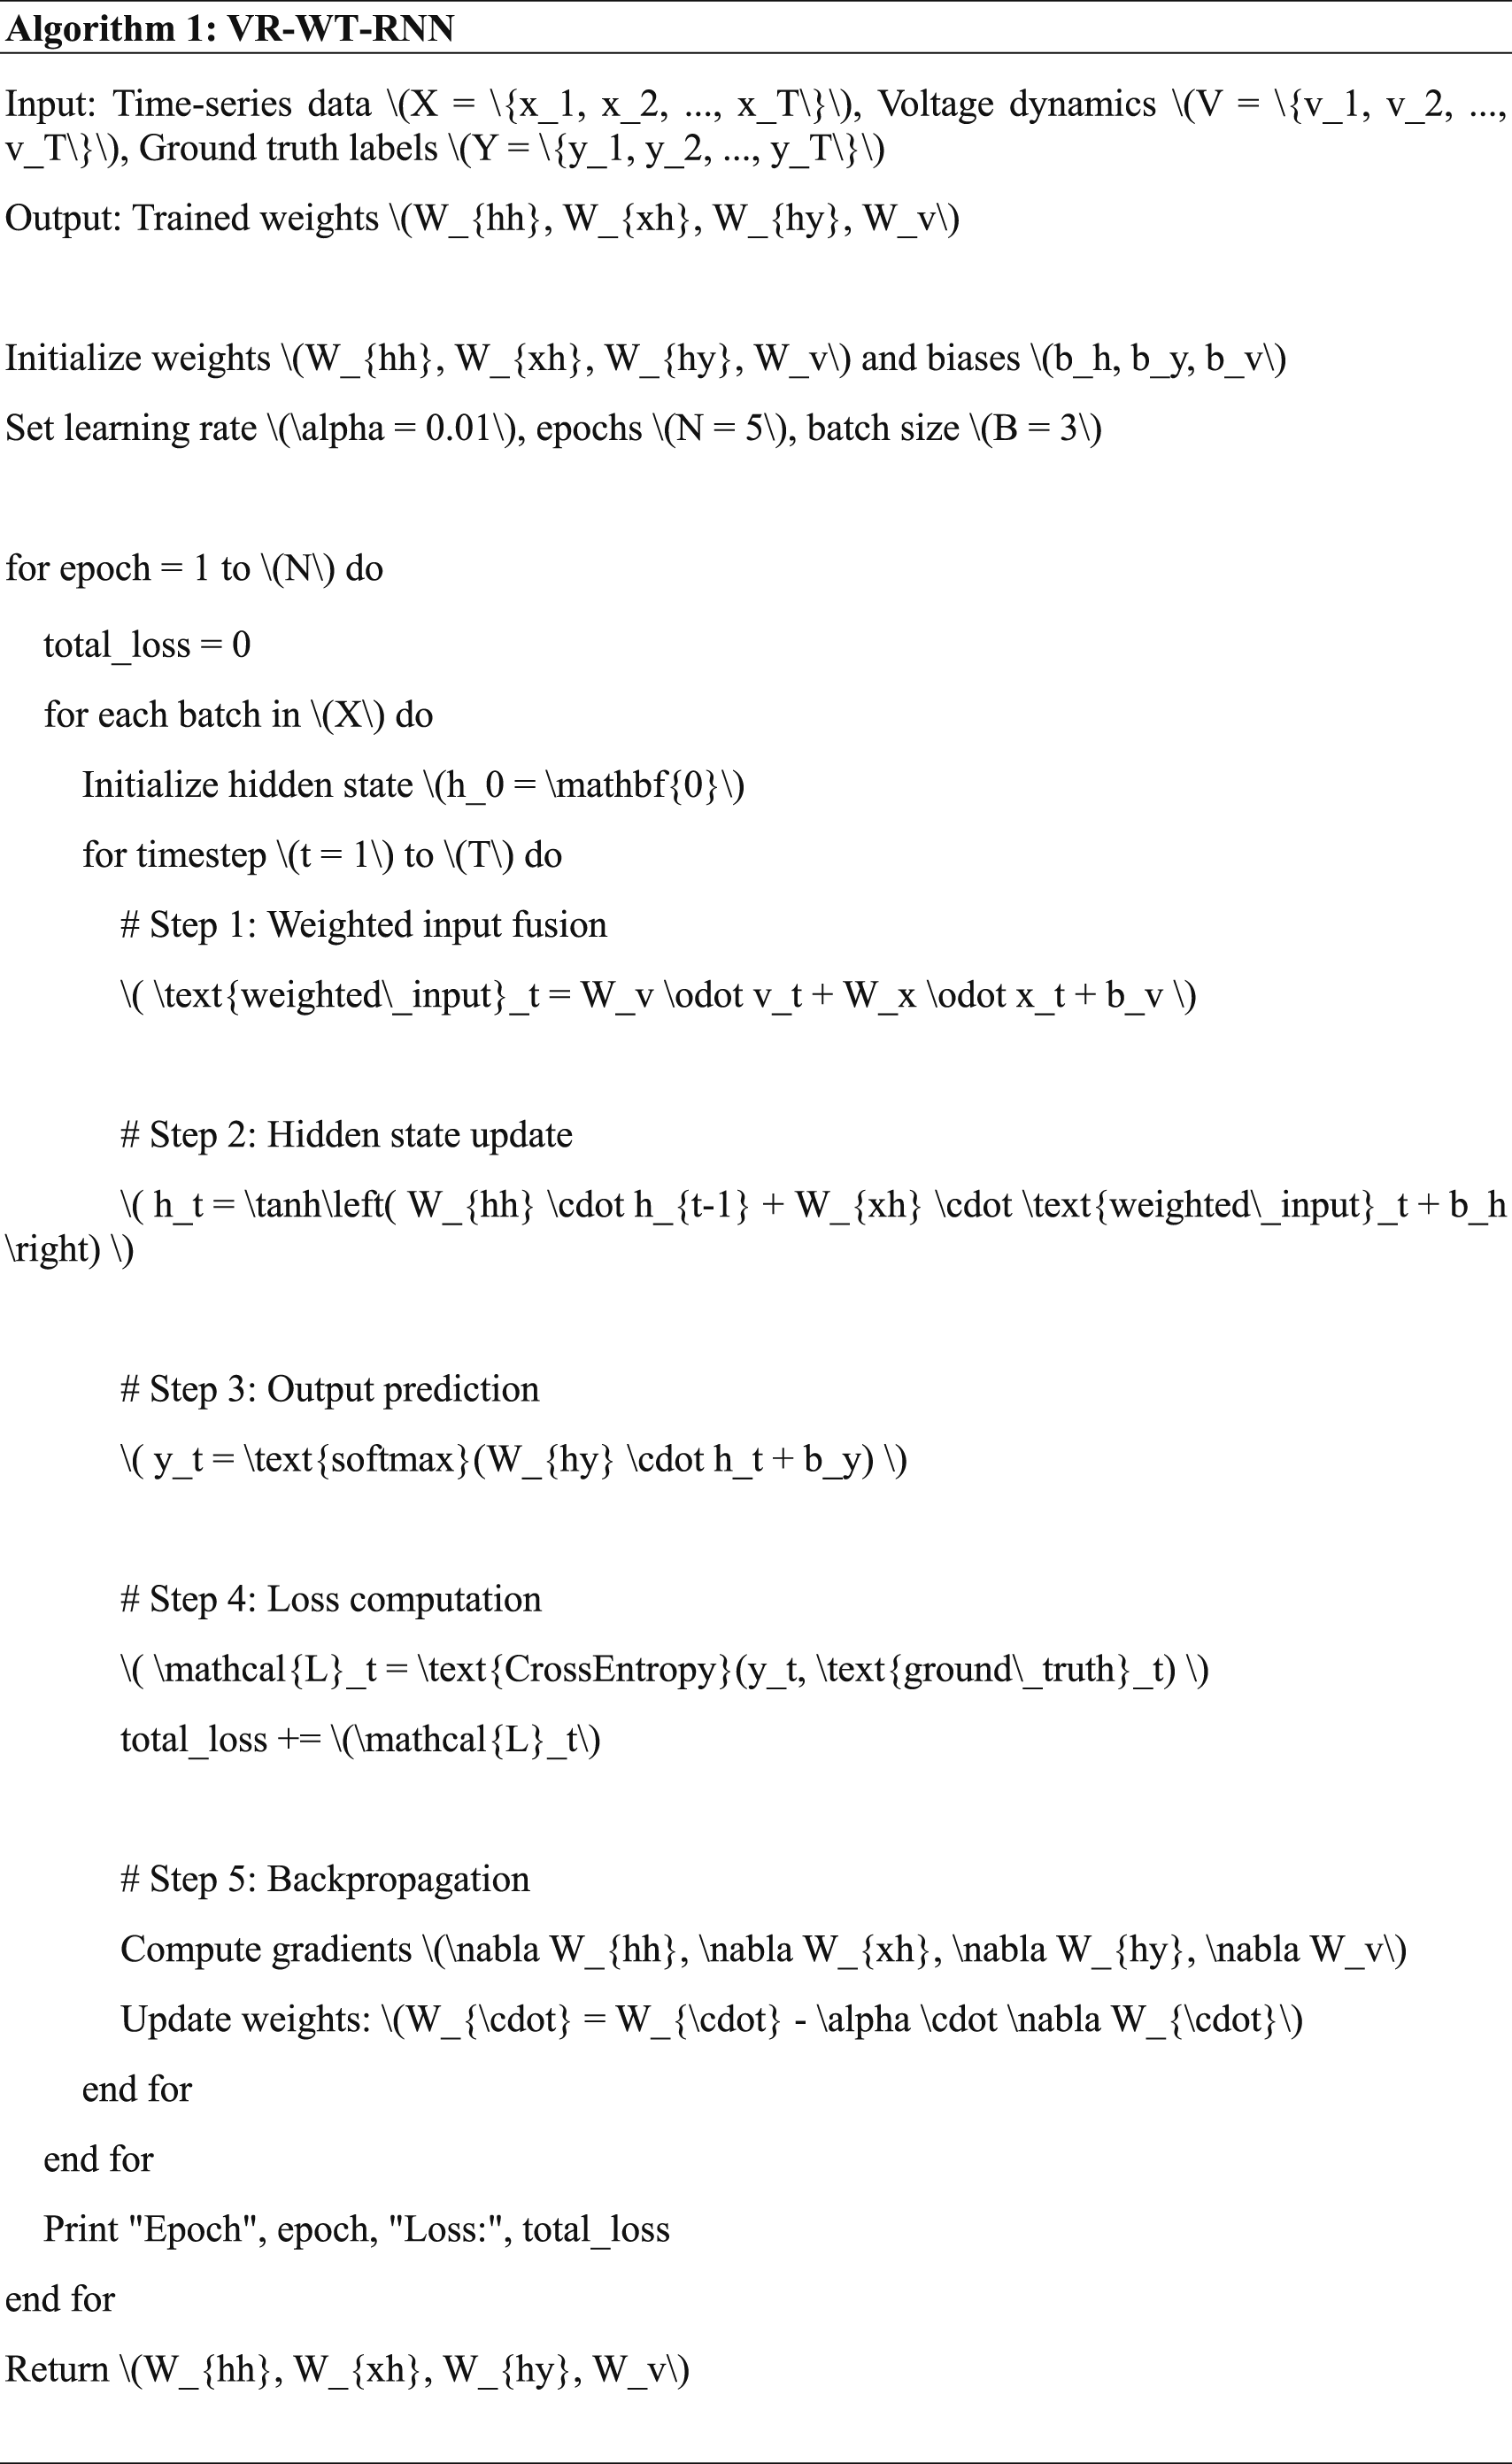
The VR-WT-RNN is a new deep learning architecture that aims to address the challenging task of both network topology detection and electrical parameters detection simultaneously in LVDN. The majority of conventional methods would address topology detection and parameter estimation as separate tasks, and this could result in errors, especially in dynamic voltage regulation and load variance systems. VR-WT-RNN addresses this by including the effects of voltage regulators and connections into the structure of its learning network. The model uses an RNN architecture to detect temporal correlations and dynamic patterns in voltage and current data streams across time. The “weighted topology” method assigns higher priorities to different network connections based on how much regulatory and structural impact they have, better equipping the model to be more representative of actual electrical characteristics. VR-WT-RNN provides improved prediction accuracy and stability in grid states through simultaneous learning of topology and parameters, thus enabling more reliable decision-making processes in power flow analysis, fault detection, and automated grid operation. Its value in low-voltage distribution networks, which are often sparsely metered and more flexible, positions it as a valuable asset in the evolution of smart grids, allowing utilities to optimize performance, reliability, and integration of distributed energy resources. Algorithm 1 illustrates the pseudocode of VR-WT-RNN.
RNN
The RNN employs time-series data from LVDN to predict parameters like voltage and current and identify topology changes. Their ability to capture temporal patterns helps in real-time monitoring, fault detection, and adaptive control to enhance network reliability, efficiency, and responsiveness to varying load conditions. RNN has three components: input layer, output layer, and hidden layer of neural units, as shown in Figure 3. The architecture is similar to the usual neural network design. The RNN architecture distinguishes itself through interconnections between neuron nodes via hidden layers. The hidden layer gets both input values LVDN structure.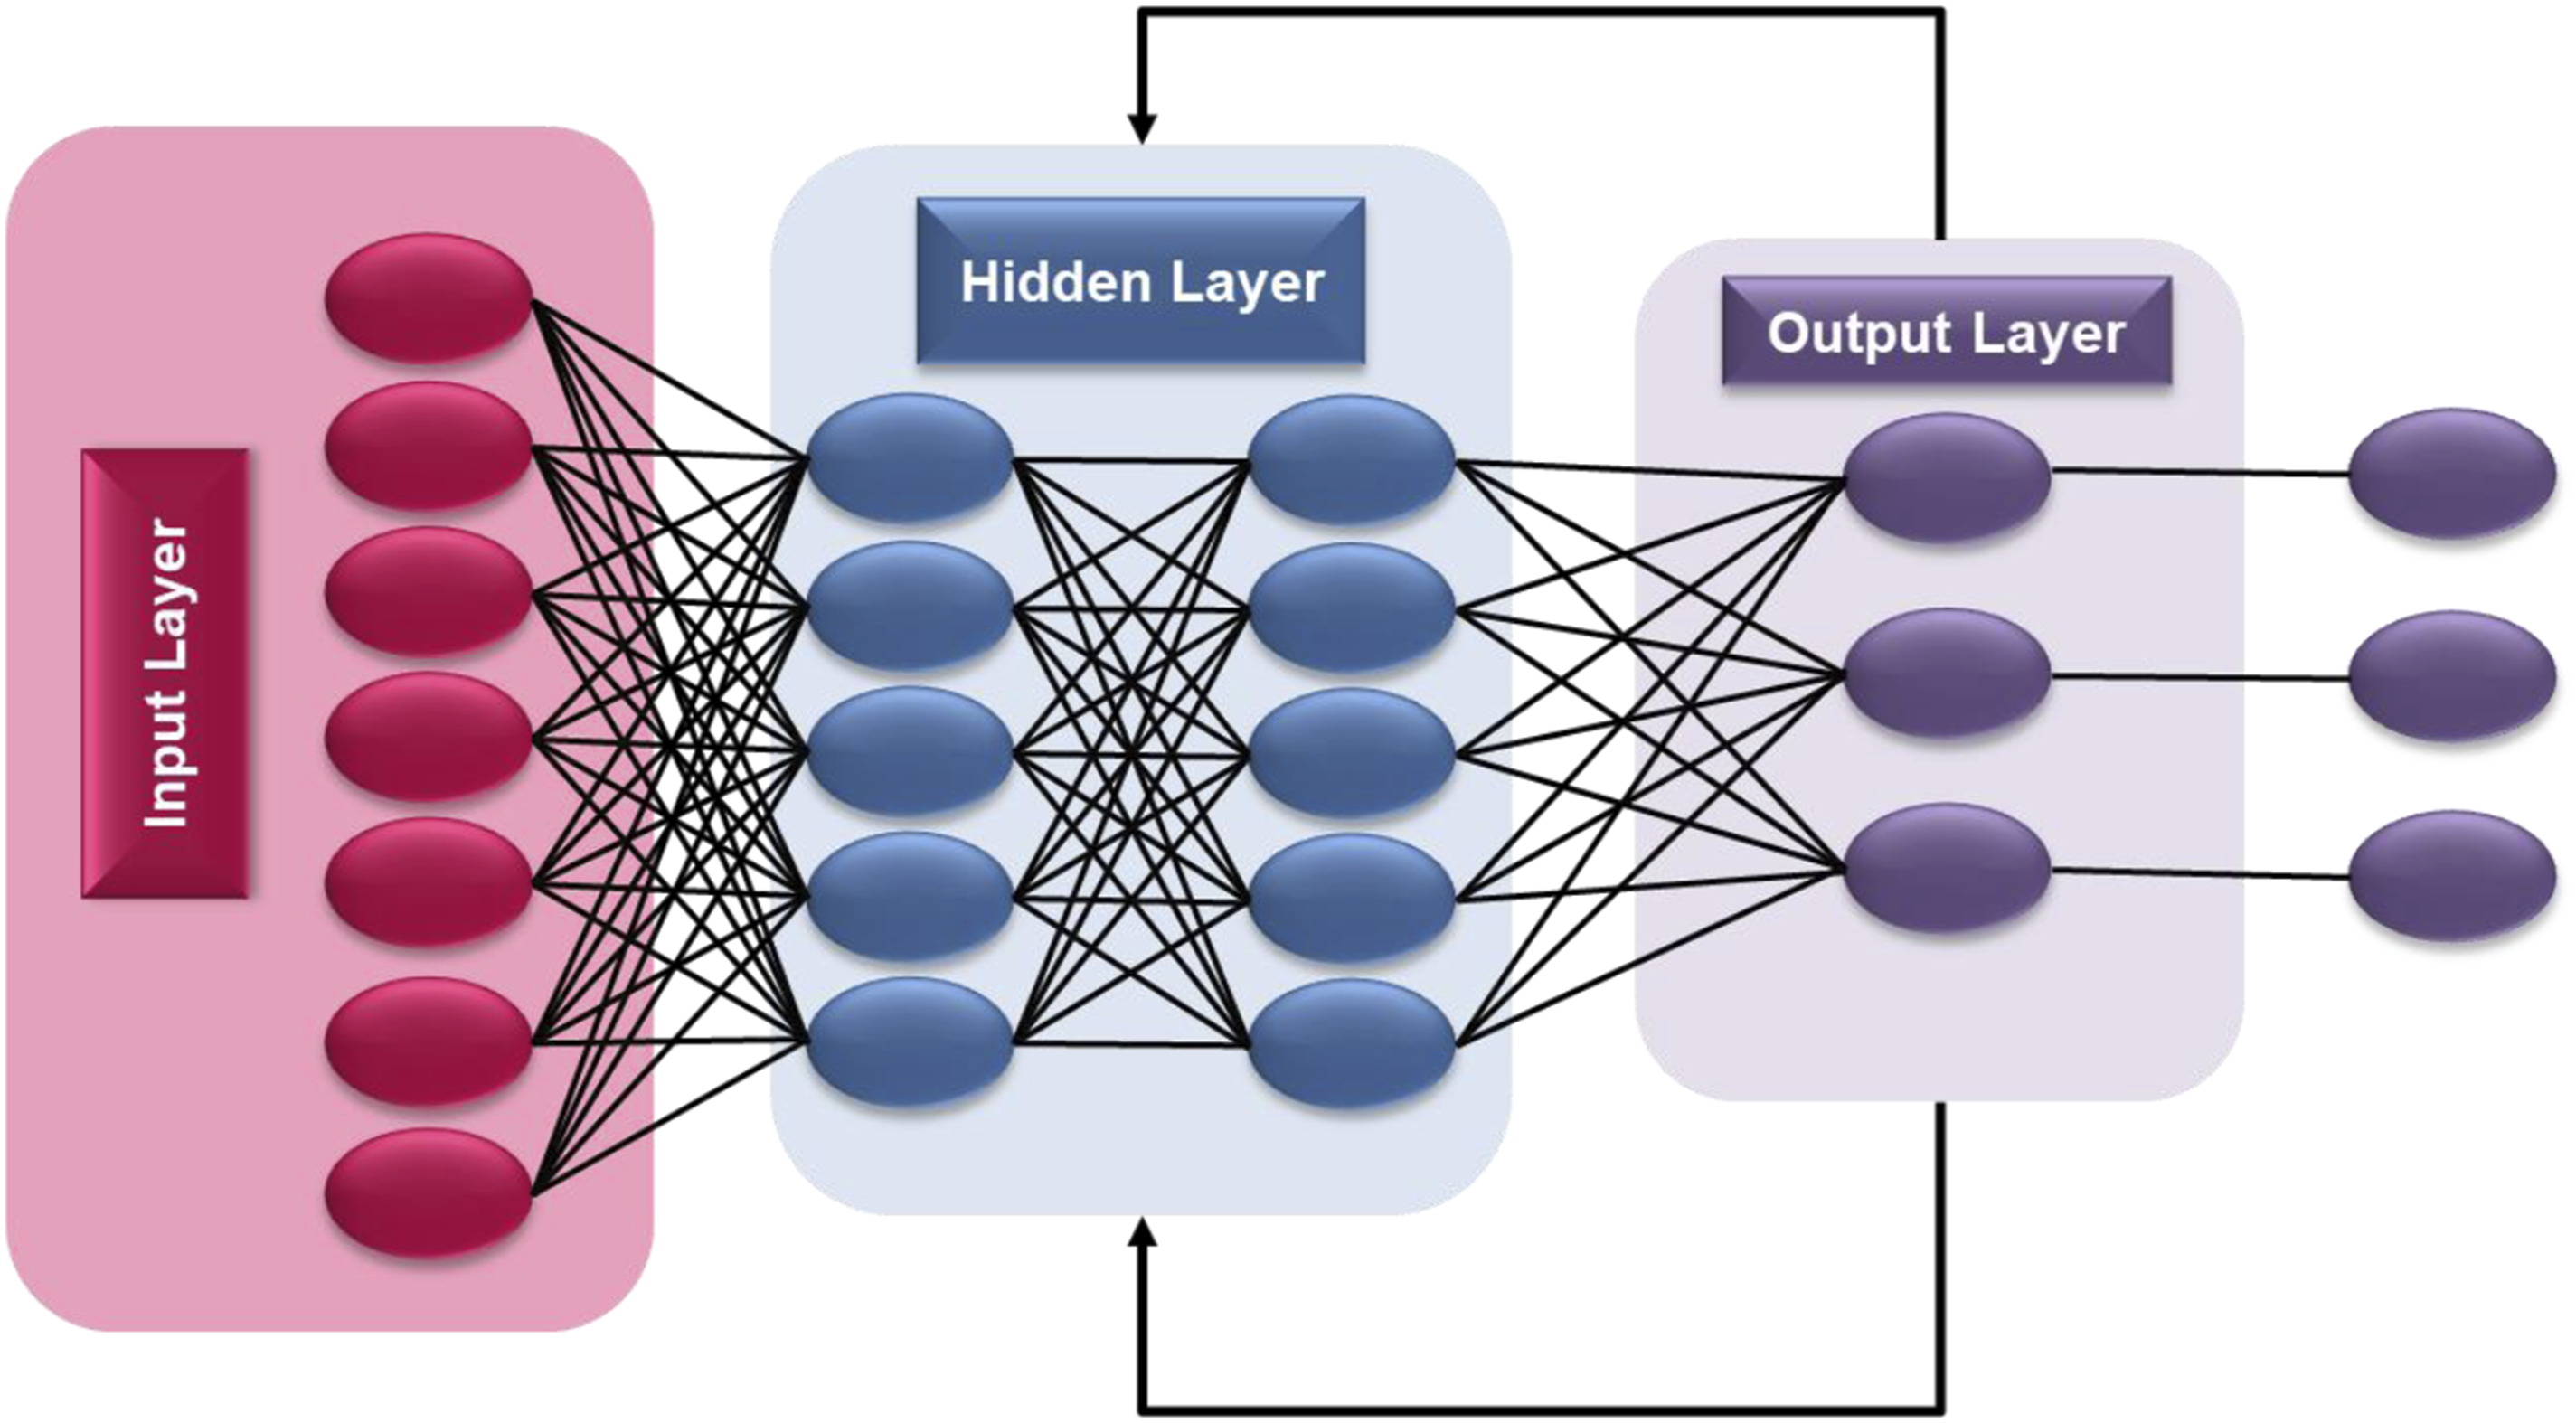

The RNN neural network’s hidden layer neurons include a feedback mechanism that transmits context information, resulting in accurate processing and prediction of sequence data samples.
During signal forward propagation, every neuron in the network exhibits a nonlinear

Error back propagation involves repeatedly modifying the weight and threshold of each neuron in the network using the gradient descent technique to attain the least error function value. The cost function could be defined as follows in equation (8)

Voltage regulator
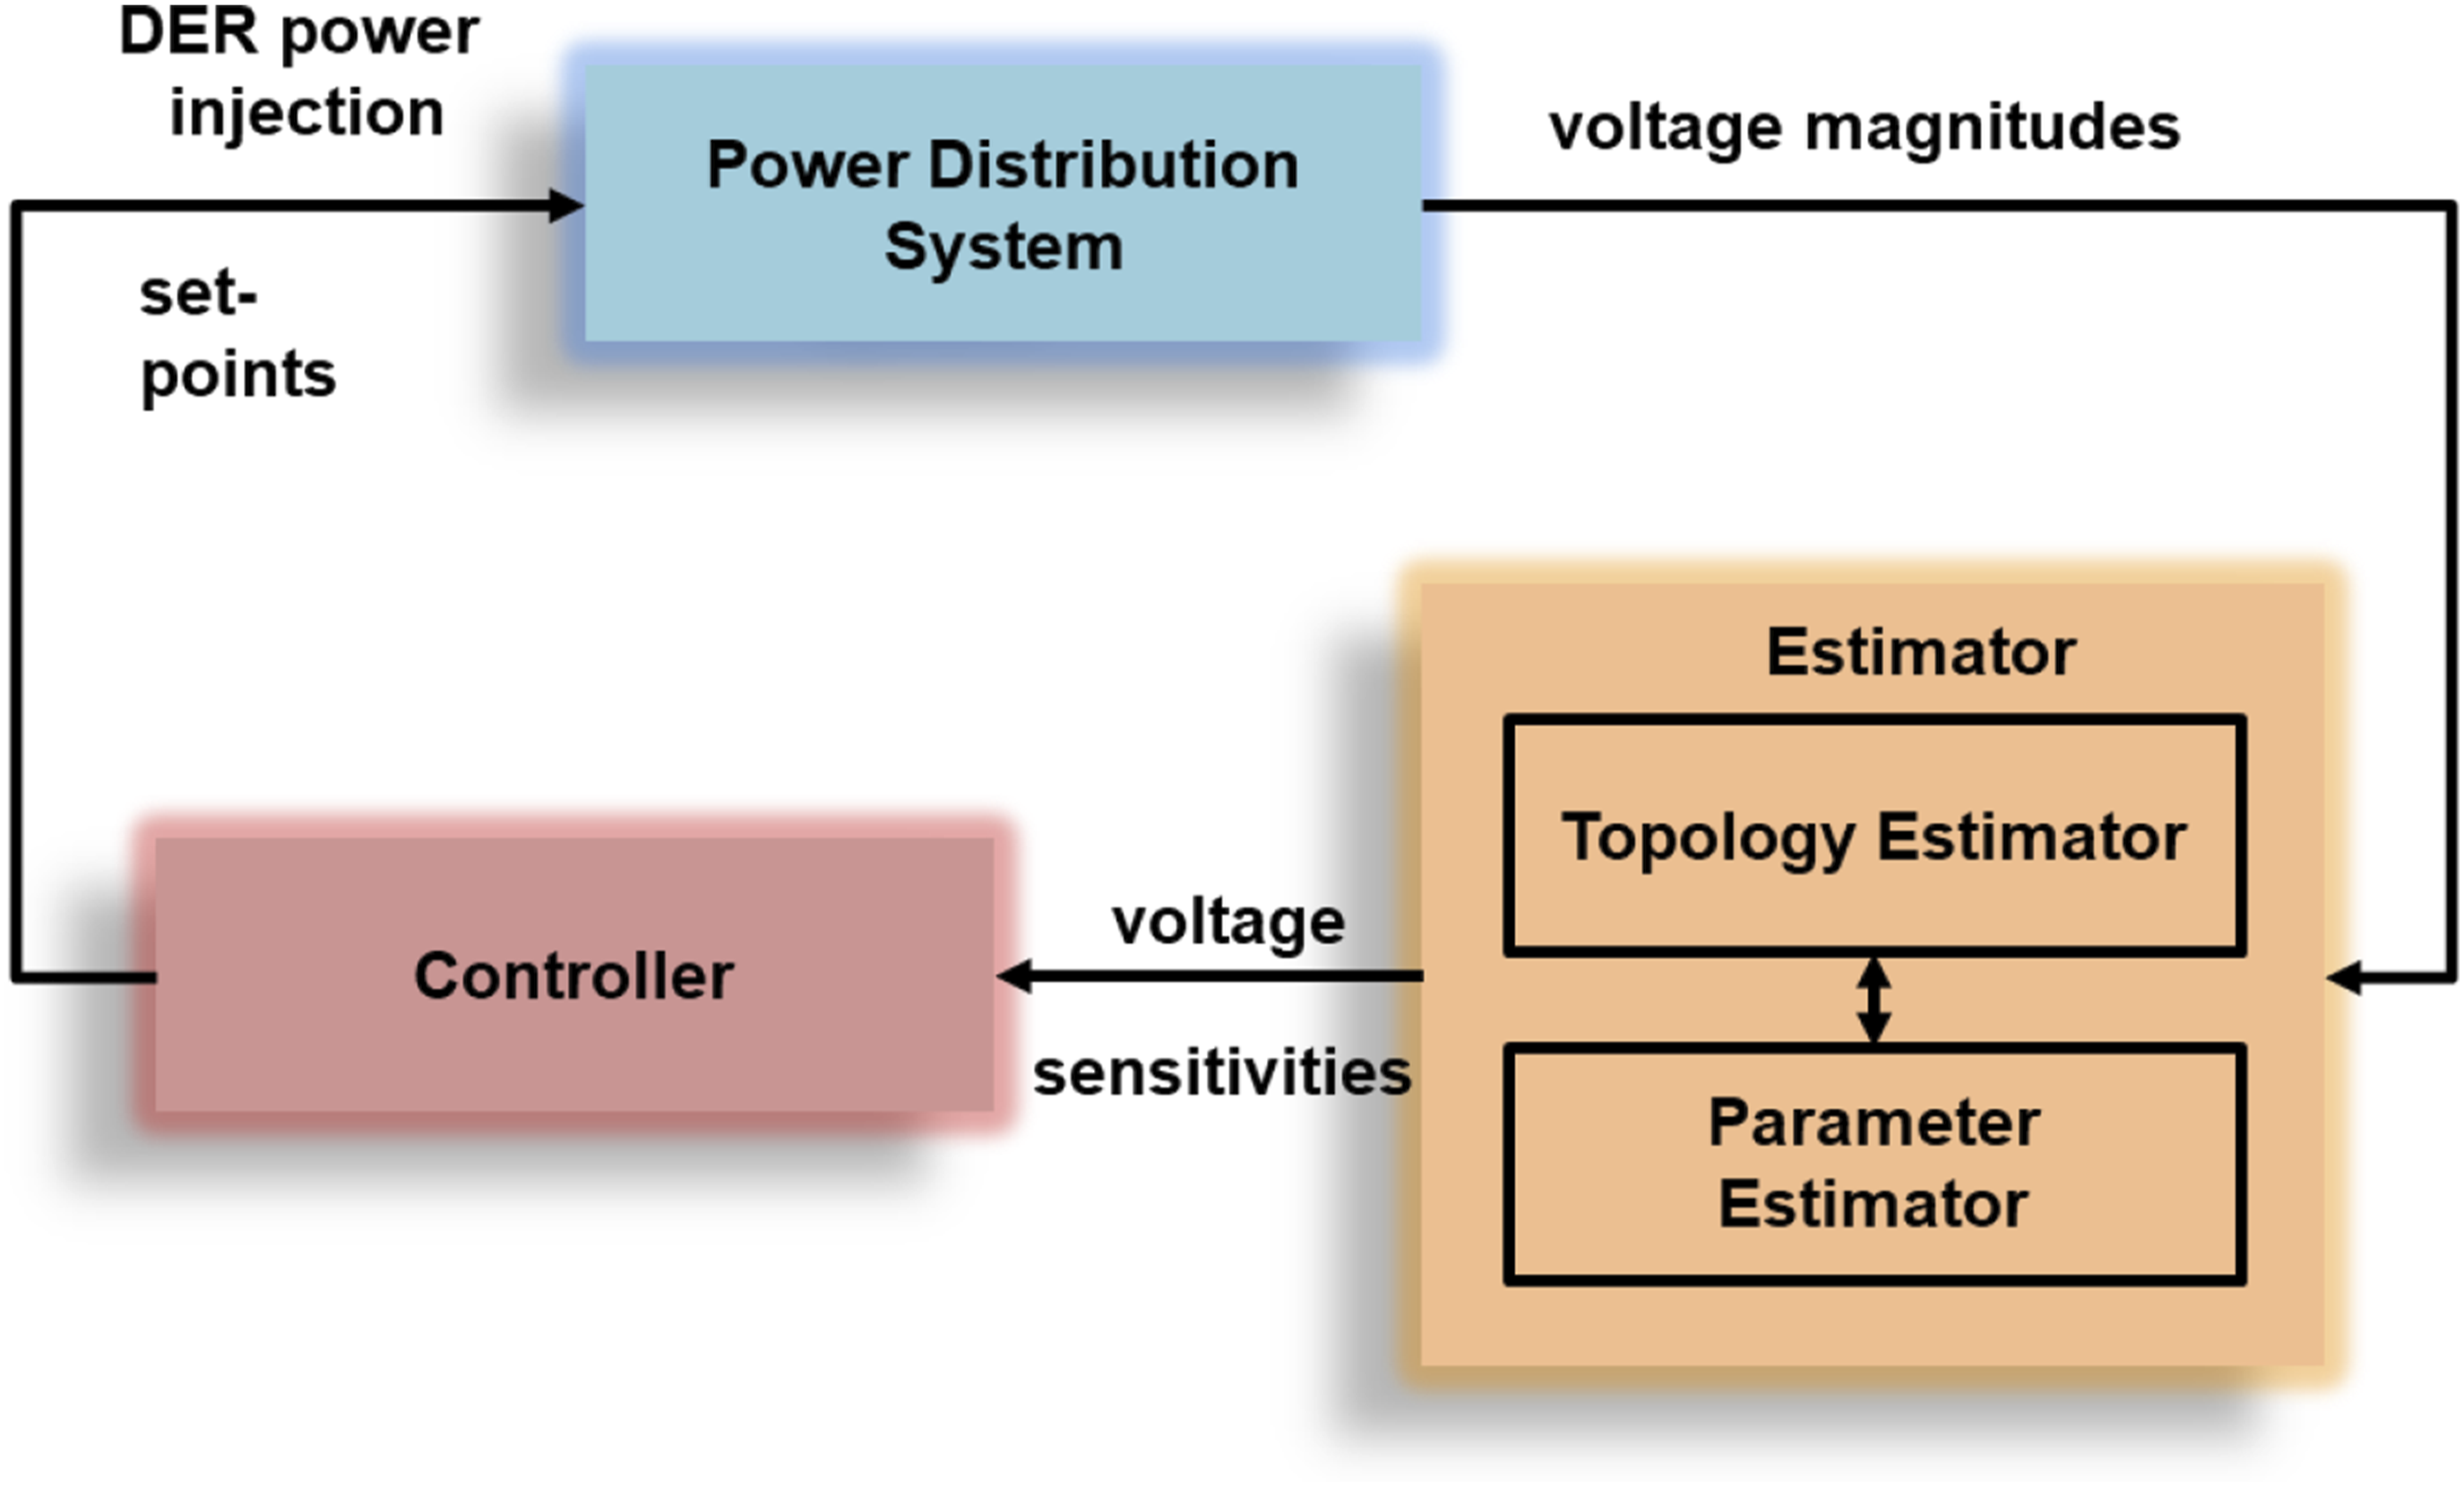
A voltage regulator in an LVDN maintains voltage levels at a steady state in the face of load or supply fluctuations. The key parameters are input/output voltage, regulation precision, and reaction time. The LVDN generally has a radial or ring topology, comprising components such as transformers, feeders, and loads. Voltage regulators are used in this system to provide efficient and dependable power transmission. This section suggests a data-driven, adaptive paradigm for distributed energy resources (DER) based voltage control. After providing a general overview of the framework, proceed to give details on its essential components. Framework
A voltage controller and a voltage sensitivity estimator constitute the two halves of the suggested voltage regulation architecture. Figure 4’s block diagram illustrates how the different parts work together. It is calculated using Voltage sensitivity estimator Voltage regulator framework.
Assume that measurements Parameter estimator
To estimate


Afterward, demonstrate that equation (11) has a closed-form resolution. First, observe that the following equation (10) is a breakdown of the matrix


It should be noted that


The pseudo-inverse of Weighted topology


The topology estimator strives to determine


The topology estimator basically chooses the topology with the least amount of residual error, whereas the parameter indicator estimates the line parameters. The assumption here is that various topology configurations will affect the residual error by imposing distinct structural restrictions on voltage sensitivity matrices. It is anticipated that the actual topology arrangement will provide the least amount of residual error.
Evaluation criteria
Normalized Mutual Information (NMI), Accuracy, and Adjusted Rand Index (ARI) are used to assess LVDN characteristics and topology. Accuracy indicates the overall correctness of predictions, NMI examines the similarity between expected and actual groups, and ARI evaluates clustering accuracy while accounting for chance. Together, each provides a valid performance evaluation. Accuracy
Clustered labels are compared to the actual labels in the data using accuracy. This provides a graphic depiction of the percentage of accurately assigned samples within the entire sample. The following equation (24) is its definition

All the possible one-to-one correspondences between the true and clustered labels are captured in the mapping function NMI
NMI is a metric that measures the sum of data confined in one cluster result to another. It has a value range of [0,1] and is described as follows in equation (25) ARI

The Rand index (RI) has been improved by the ARI. The proportion of users with overall cluster labels that match the actual labels is shown by RI. The ARI is described as follows in equation (26)

The mathematical expectations of RI are denoted by
Results and discussion
Python is often used for predicting LVDN parameters and topology because of its extensive libraries and support for deep learning and time-series analysis. Existing approaches, such as Deep Convolutional Time-Series Clustering (DCTC), 24 1D Convolutional Neural Networks (1DCNN), 25 target the evaluation of time-series data and grouping characteristics to improve network predictions. However, the proposed VR-WT-RNN method offers improved capability in capturing time-frequency properties, while volatility regularization enhances the model.
Experimental results
The confusion matrix depicts the classification performance of a model used to identify LVDN parameters or topologies in Figure 5. It demonstrates that, out of 200 total occurrences, the model correctly identified 140 true positives (e.g., accurate topology or parameter matches) and one true negative, but misclassified 56 false positives and three false negatives. This shows strong sensitivity (recall) for recognizing the positive class, but low specificity due to a high number of false alarms. Such an imbalance implies that the model is biased toward identifying active conditions or common parameter states, which may be acceptable in scenarios focusing on fault detection or configuration monitoring, but need further modification for balanced decision-making. Confusion matrix to identify LVDN parameters and topologies.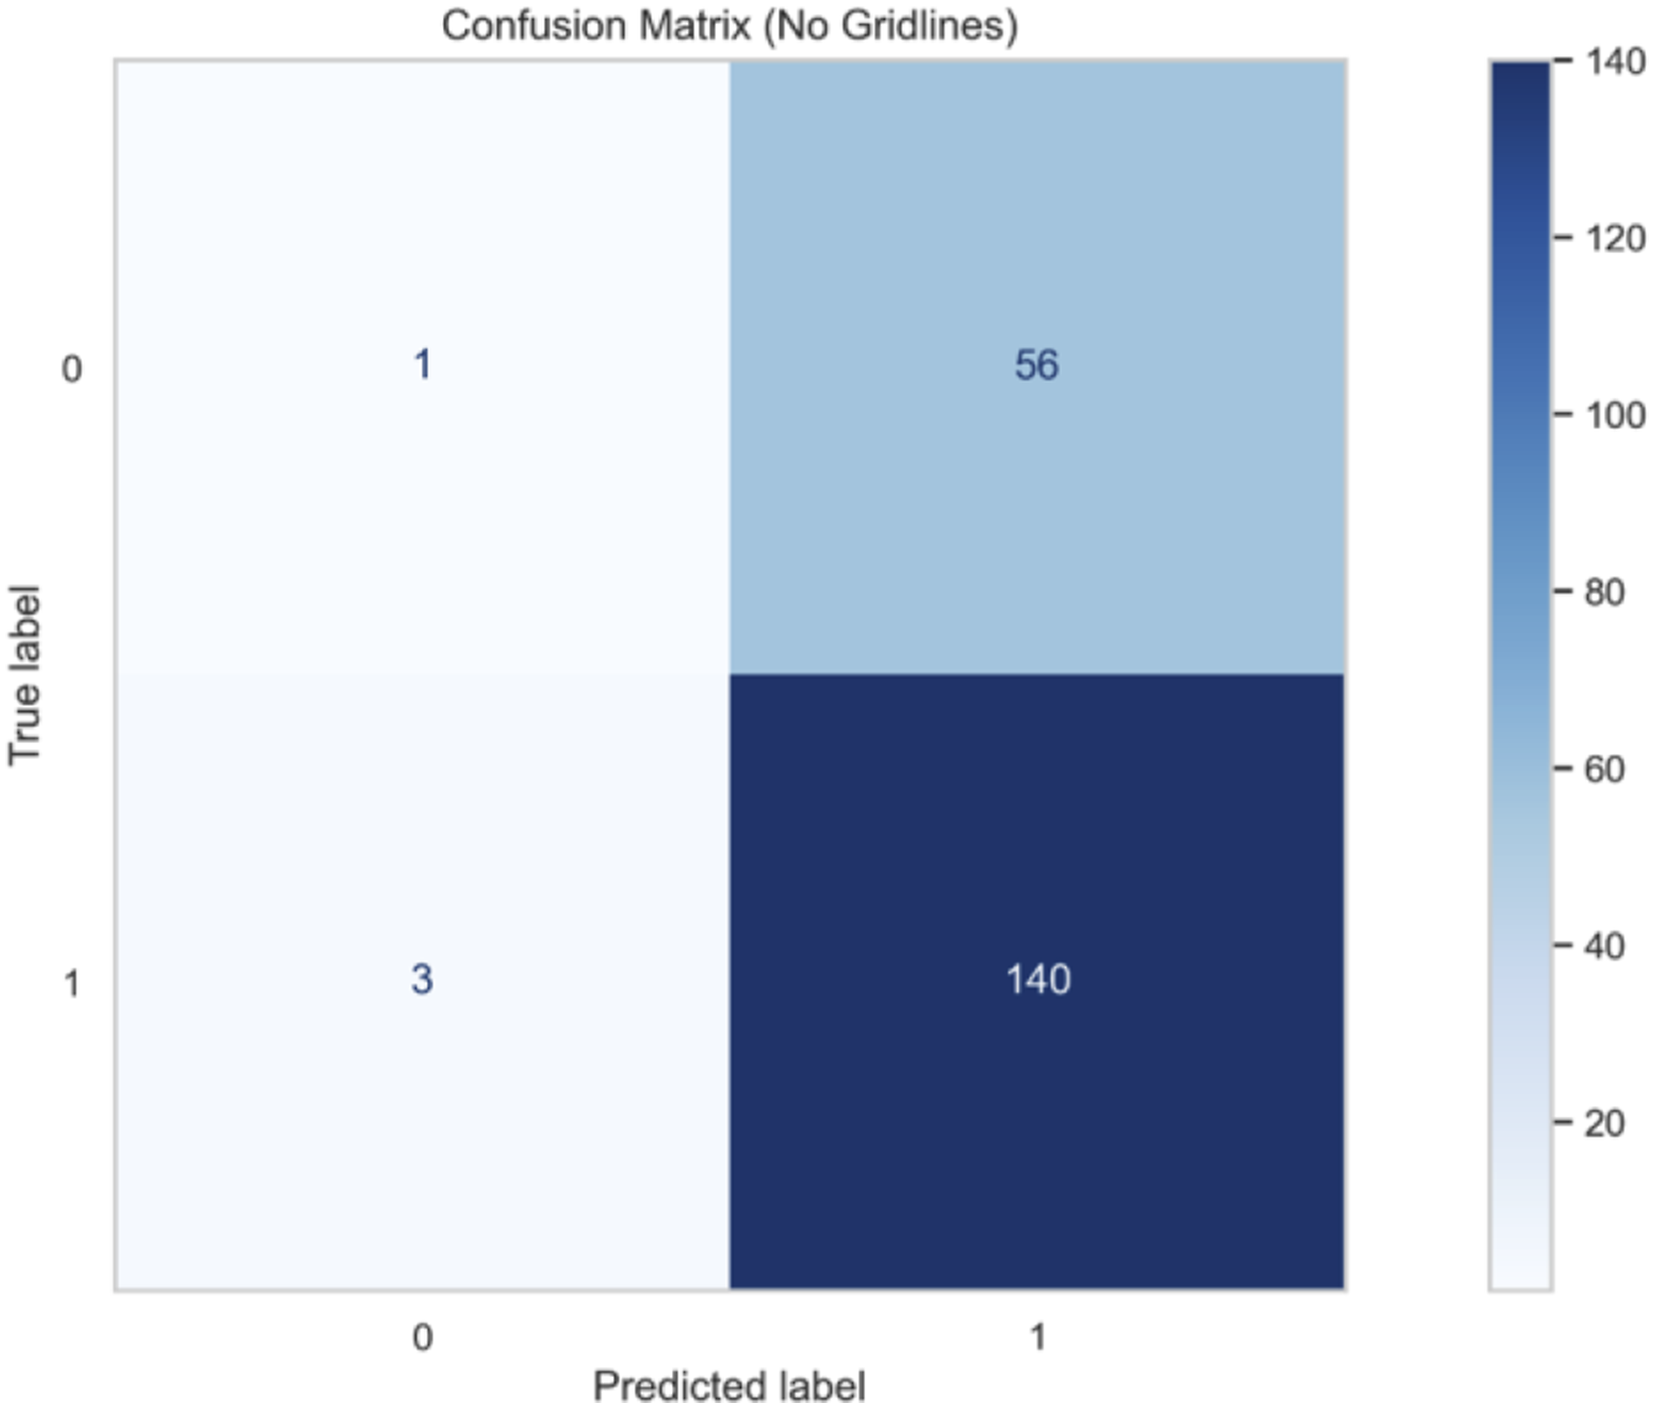
The ROC curve depicts the classification performance of a model used to identify parameters or topologies in an LVDN, as demonstrated in Figure 6. The curve compares the true positive rate (sensitivity) to the false positive rate, and has an Area Under the Curve (AUC) of 0.94, suggesting strong discriminatory power. This high AUC indicates that the model can effectively distinguish between various network conditions or topological configurations, which is critical for monitoring, fault detection, and adaptive control in smart grid environments where accurate modeling of electrical parameters and network layout is required. ROC curve for LVDN parameters and topologies.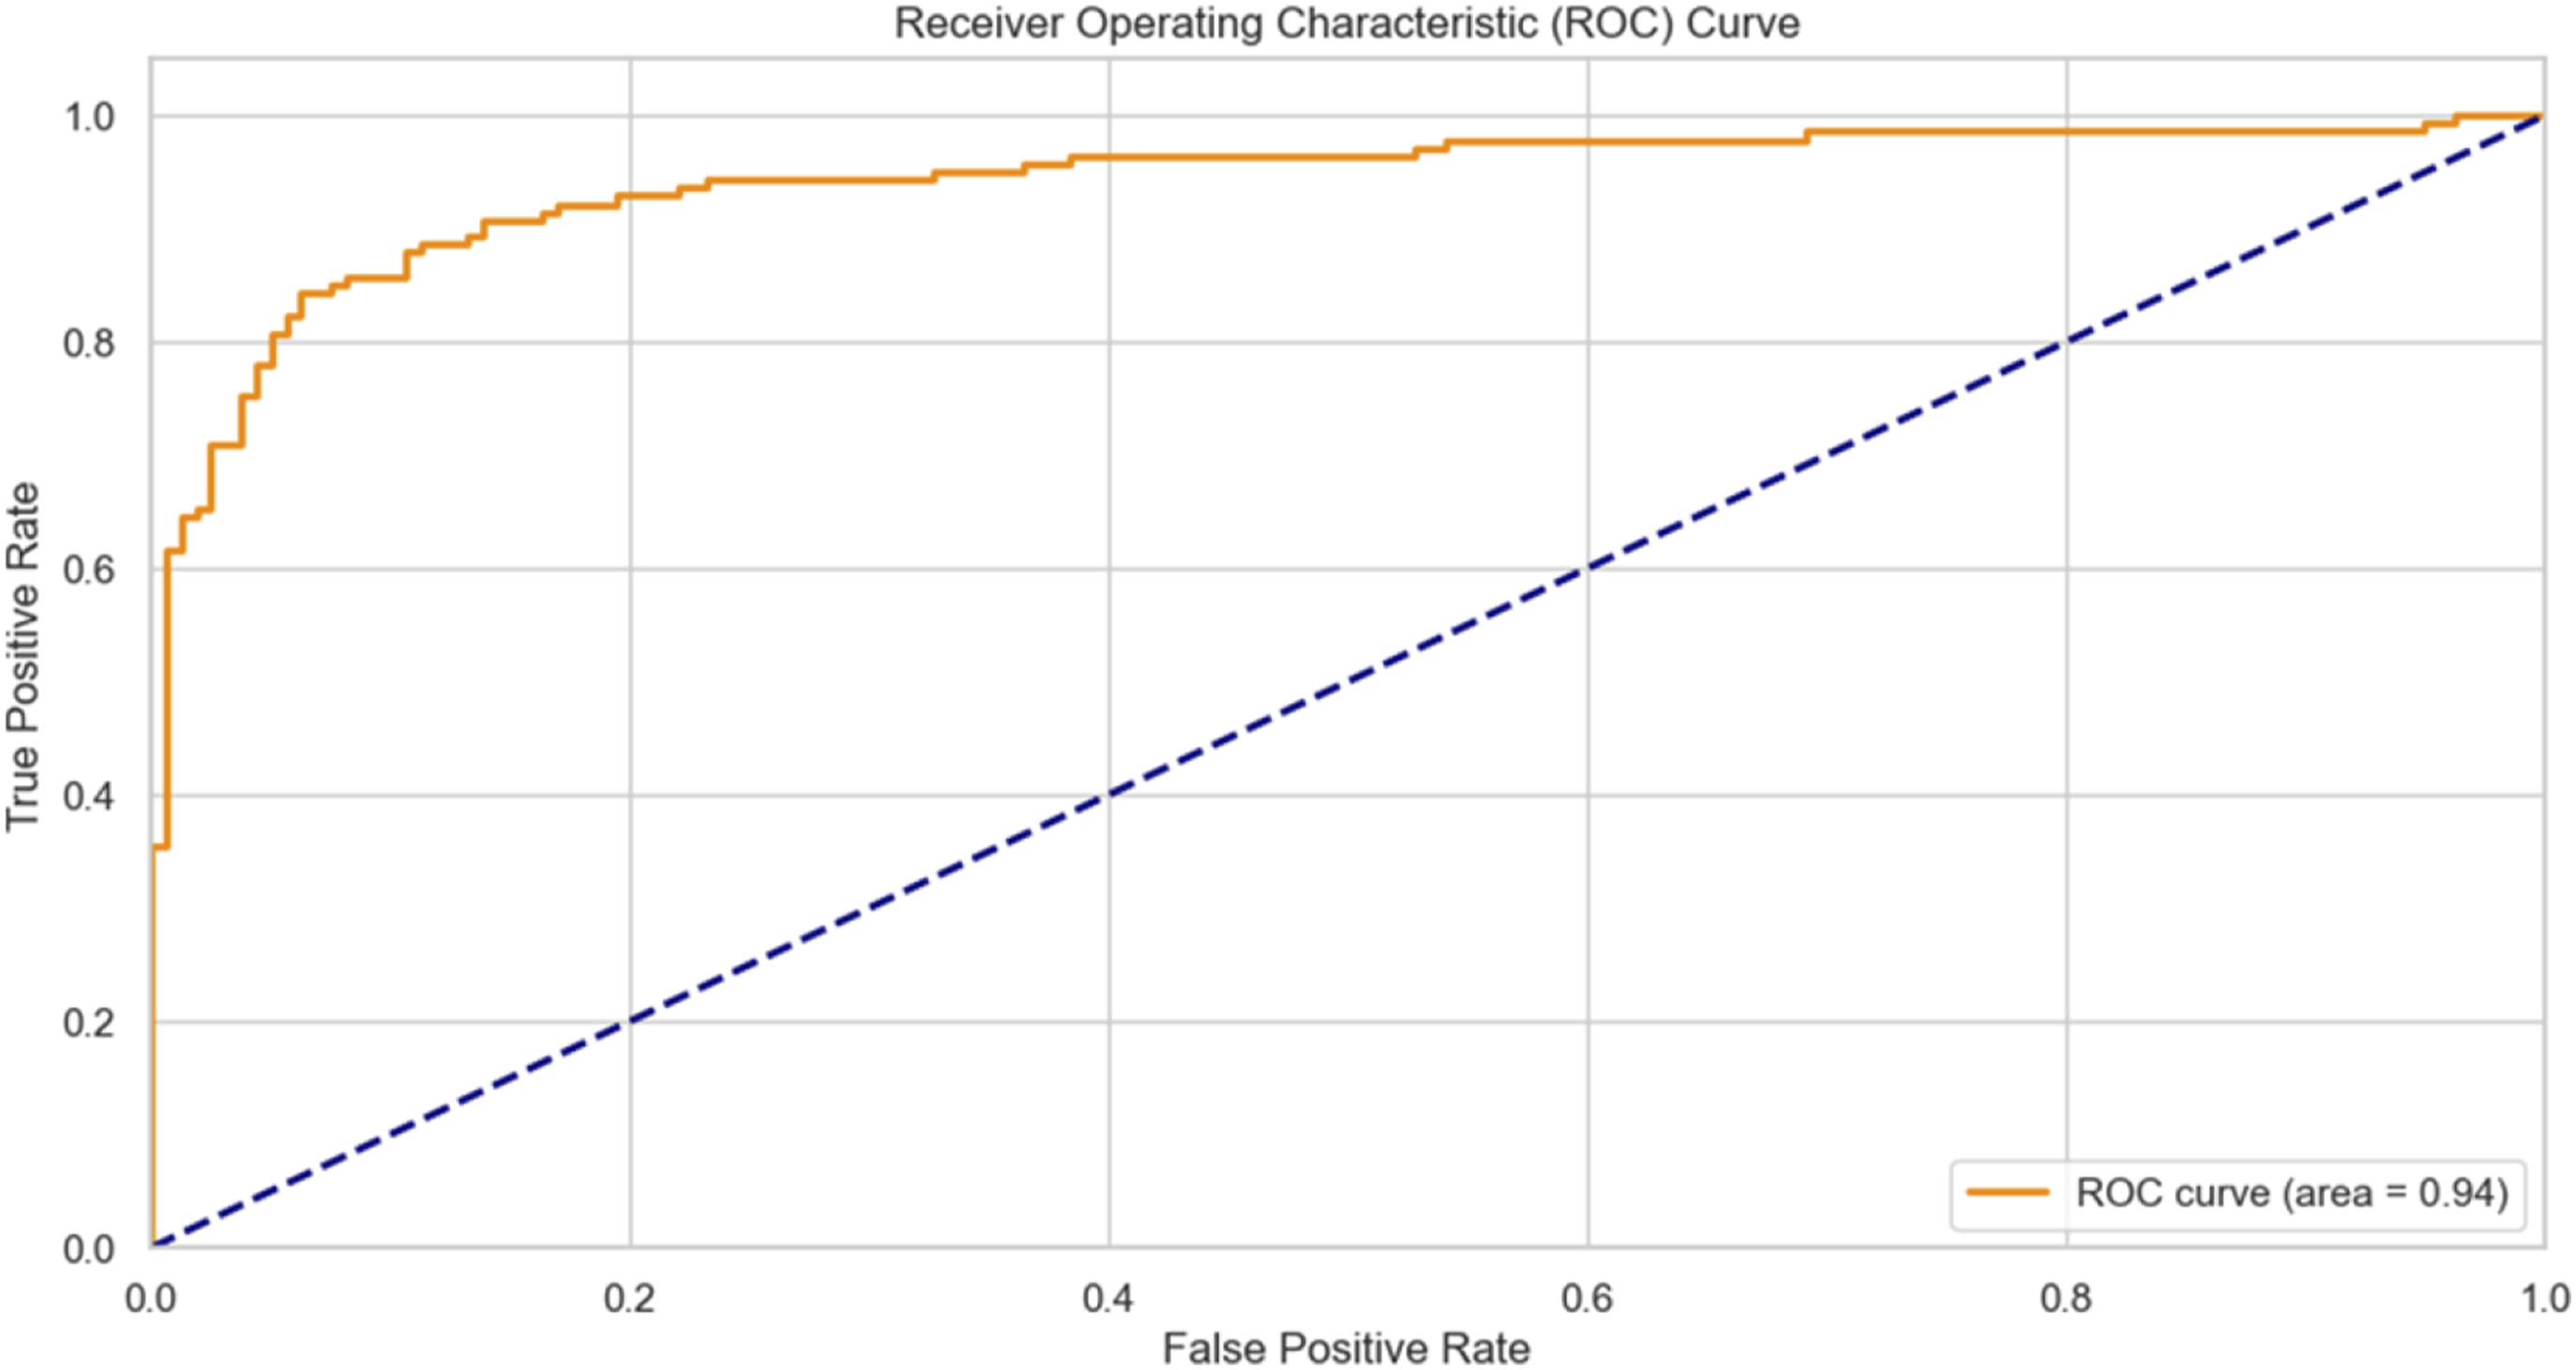
The time series plots across multiple nodes in LVDN as shown in Figure 7. Figure 7(a) depicts the fluctuation in electric current (in amperes) over time for five nodes in the LVDN. The values range between 2 and 16 A, indicating dynamic load behavior or variations in network circumstances. The similarity of patterns across nodes suggests potential synchronization due to shared load characteristics or topological connections in the network. Figure 7(b) shows the power usage (in kilowatts) of five distinct nodes over time. The load values range between 0 and 6 kW, with small negative spikes likely caused by measuring noise or reverse power flow. These changes illustrate the non-stationary nature of electricity demand, which must be considered when evaluating network performance or developing demand response systems. Figure 7(c) shows voltage variations (in volts) over time at the same five nodes. Voltage levels are largely steady between 215 V and 250 V, suggesting that the system is well-regulated; small dips and peaks could suggest transient events or local load changes. Monitoring voltage profiles is critical for ensuring power quality and finding irregularities in the distribution topology. Time series plots across multiple nodes in LVDN (a) current, (b) load, (c) voltage.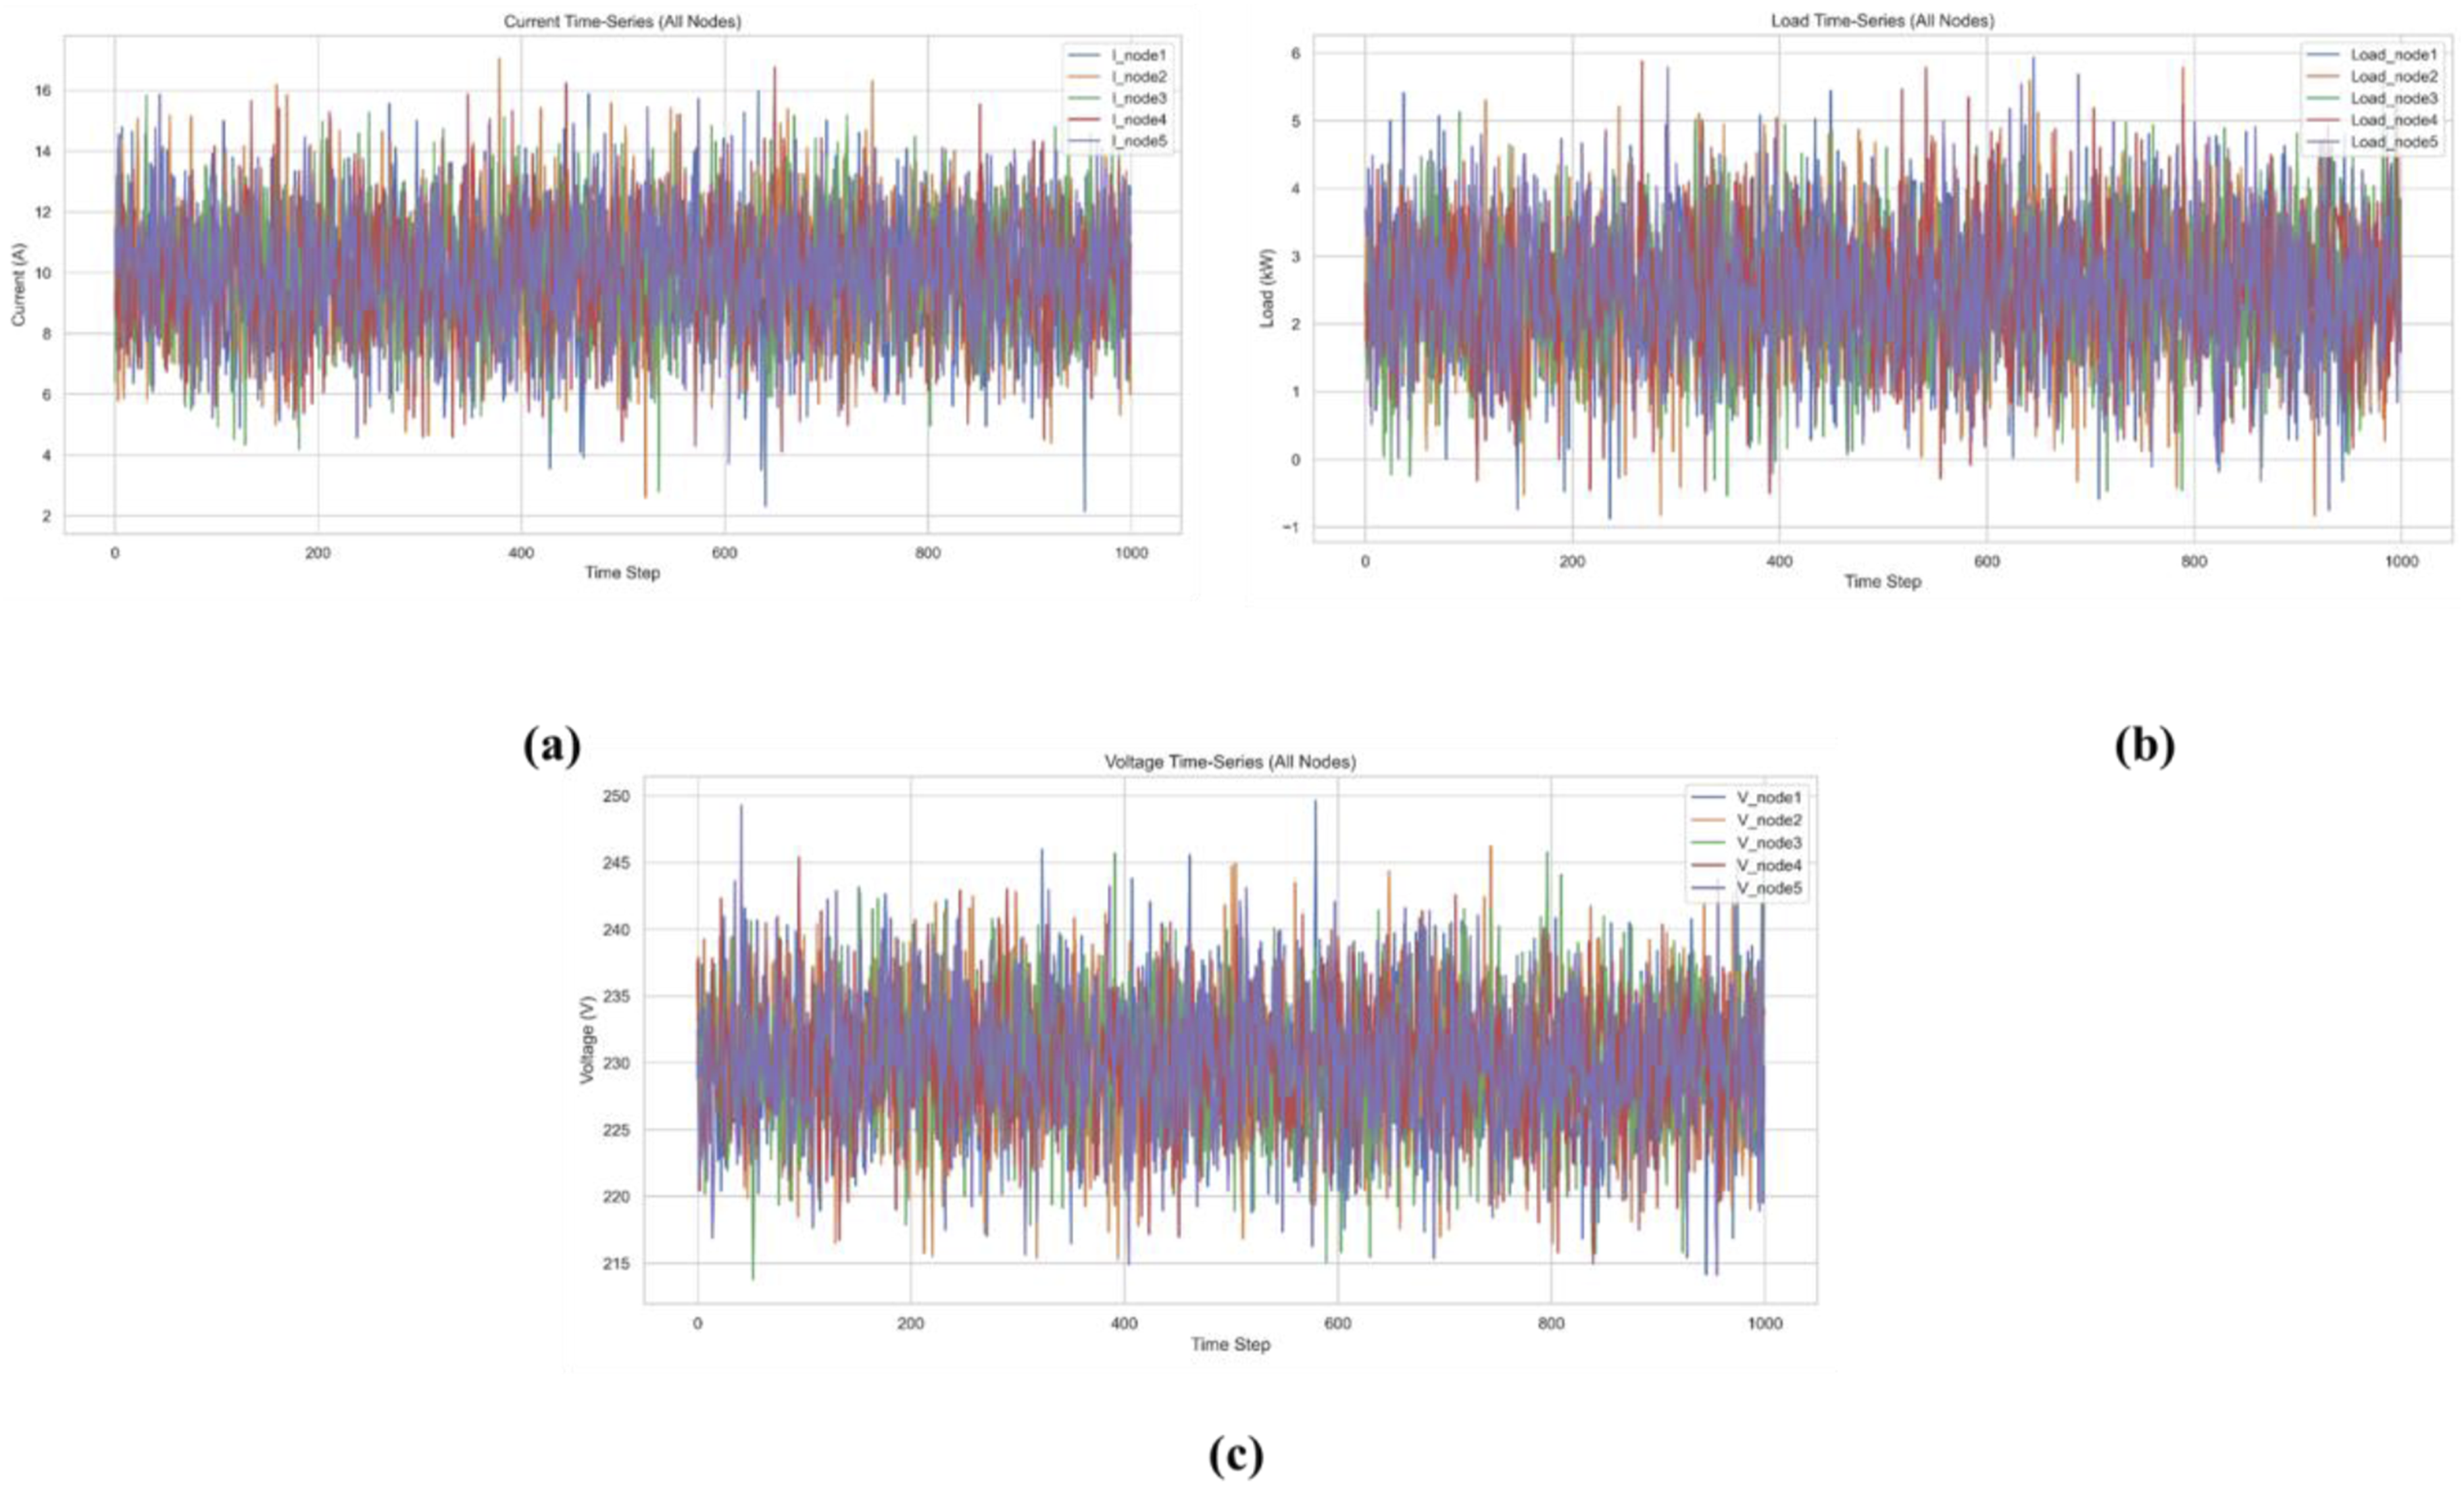
Figure 8 presents the voltage regulator settings over time in an LVDN, where the regulator adjusts dynamically within a range of 0.95–1.05 Voltage regulator settings variations over time in an LVDN.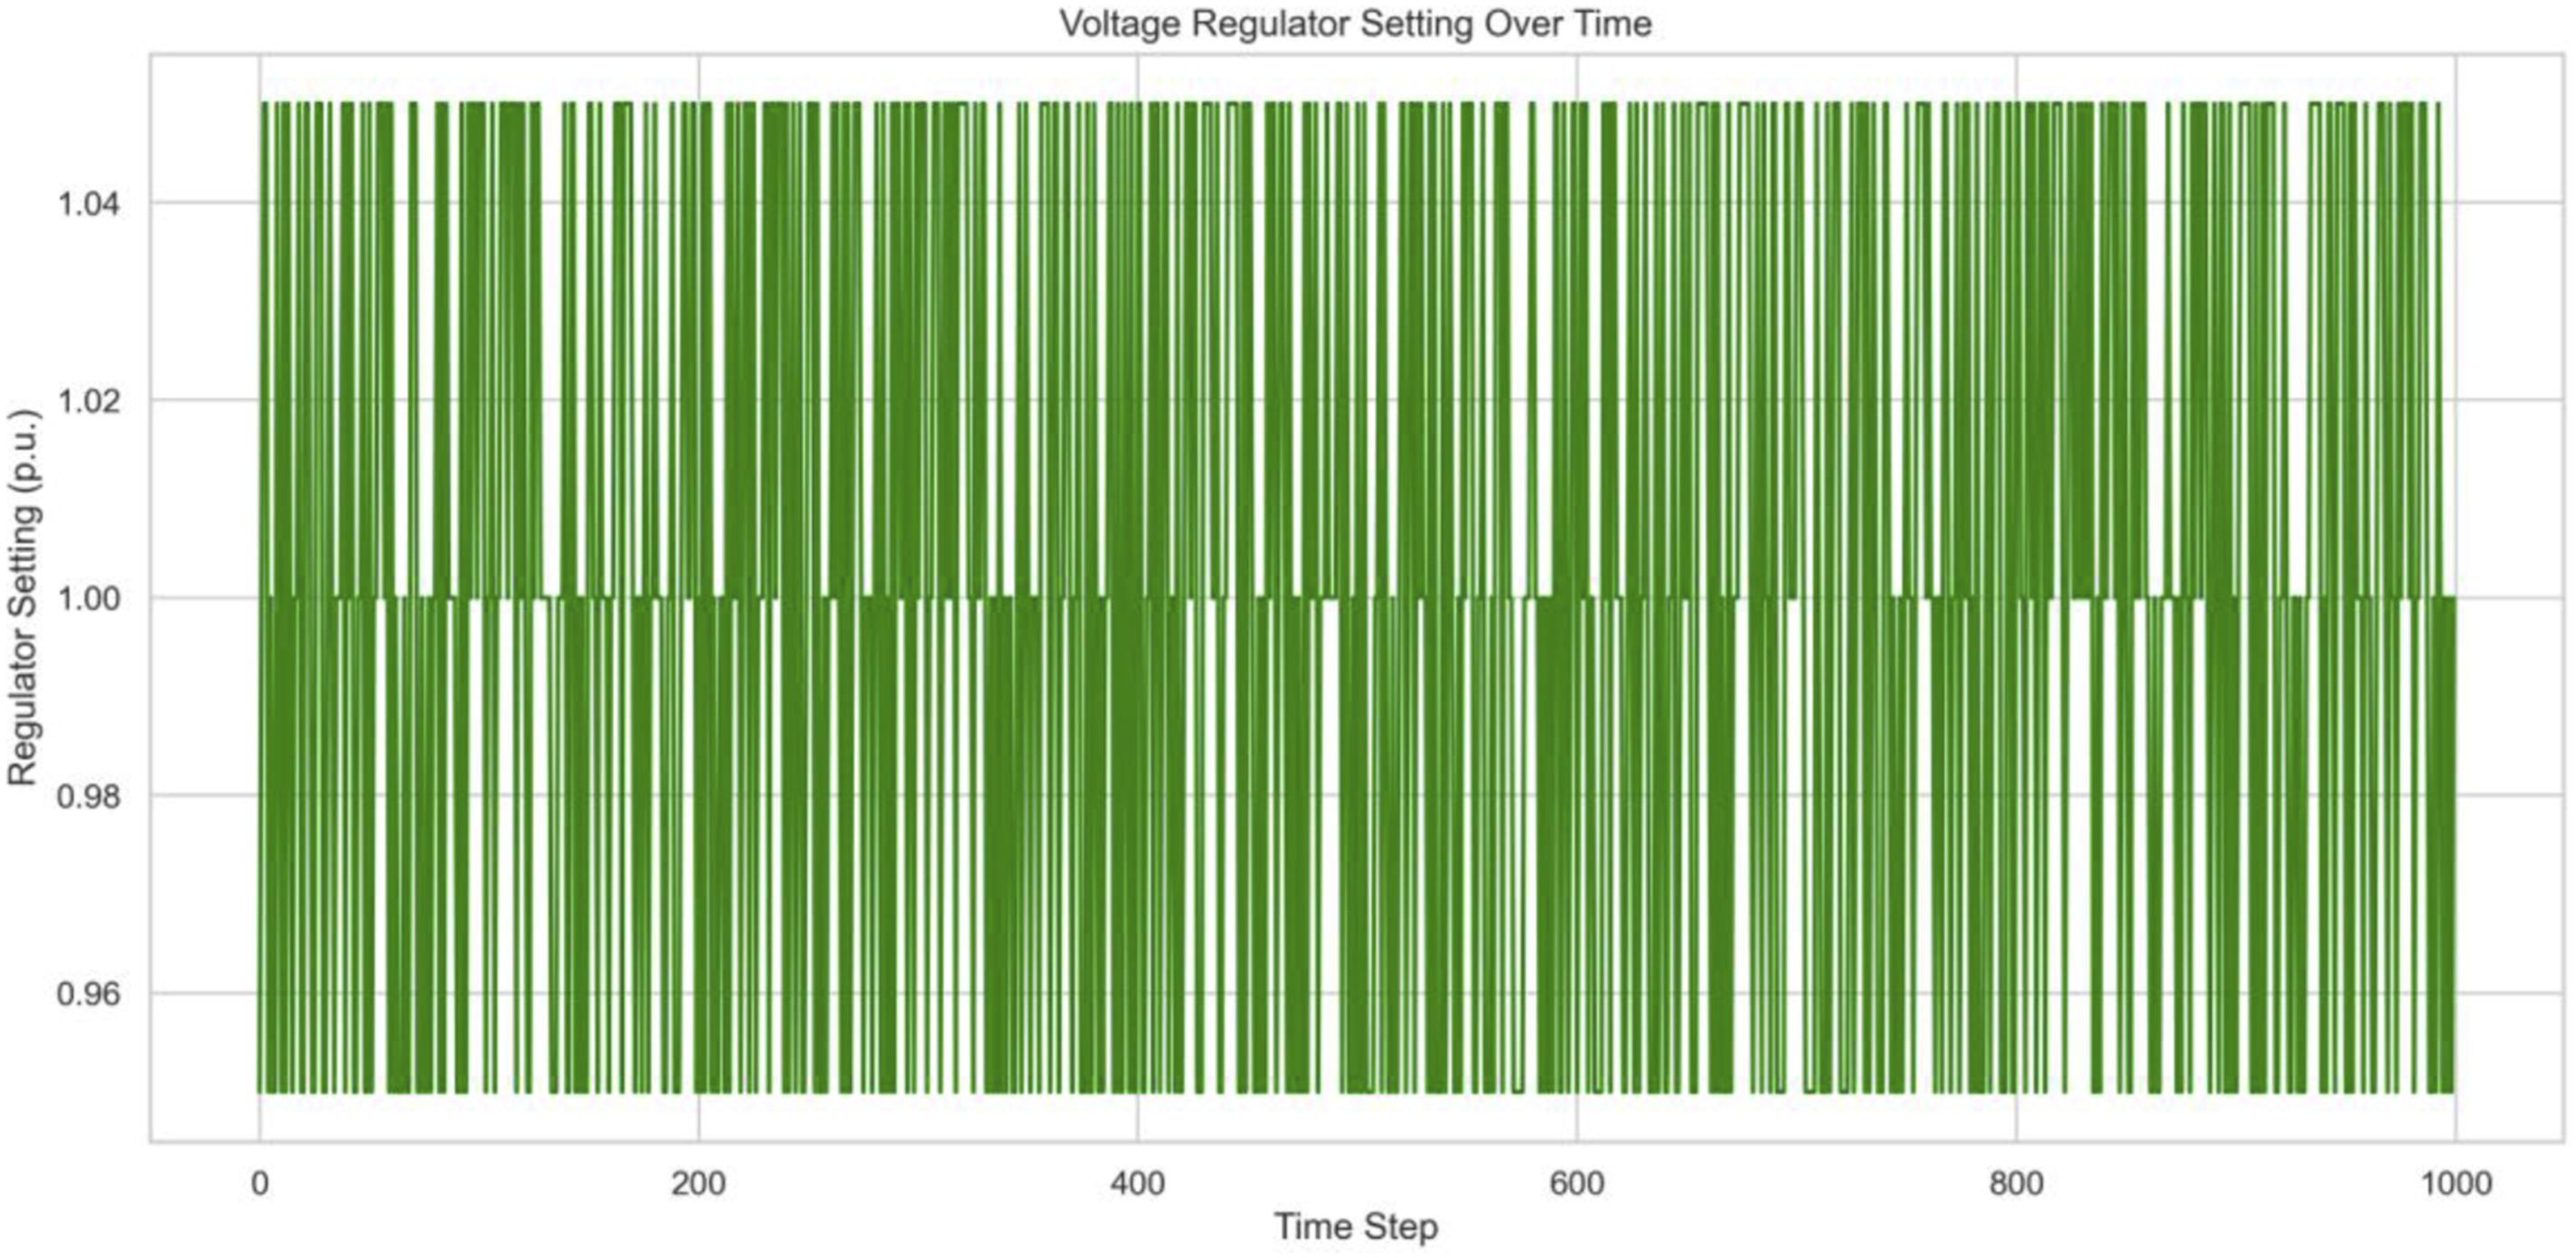
Comparative analysis
LVDN is the final step of the power delivery system, transporting energy from substations to end customers such as households and small businesses. DCTC for LVDN is constrained by high processing needs, susceptibility to noisy or missing data, and the requirement for large labeled datasets. It also lacks interpretability, making it difficult to comprehend physical linkages in network parameters and topology, which could delay practical implementation and reduce dependability on its results. 24 1DCNN has limitations in assessing LVDN characteristics and topology because it analyzes data linearly and cannot adequately capture the complex spatial and structural interactions between nodes. This could lead to the mistaken concept of network dynamics, especially in systems with intricate connections and varying loads. 25 VR-WT-RNN improves LVDN analysis by incorporating voltage regulator weights and network topology within a recurrent architecture. This allows it to learn spatial correlations and time-based patterns more effectively, leading to better topology identification, parameter estimation, and defect detection. Its ability to process sequential data renders it appropriate for real-time monitoring and dynamic load conditions.
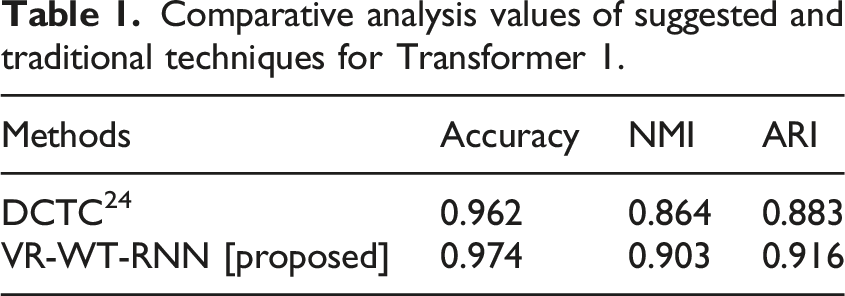
The findings for Transformer 1 illustrate the performance of two models based on three metrics: Accuracy, NMI, and ARI in Figure 9 and Table 1. The DCTC model has an Accuracy of 0.962, NMI of 0.864, and ARI of 0.883, showing excellent classification performance. The suggested VR-WT-RNN model outperforms the DCTC model with an Accuracy of 0.974, NMI of 0.903, and ARI of 0.916, indicating improved accuracy, better alignment between true and predicted labels, and more accurate data clustering or classification. Comparative analysis of the proposed and the existing DCTC method for transformer 1 in LVDN. Comparative analysis values of suggested and traditional techniques for Transformer 1.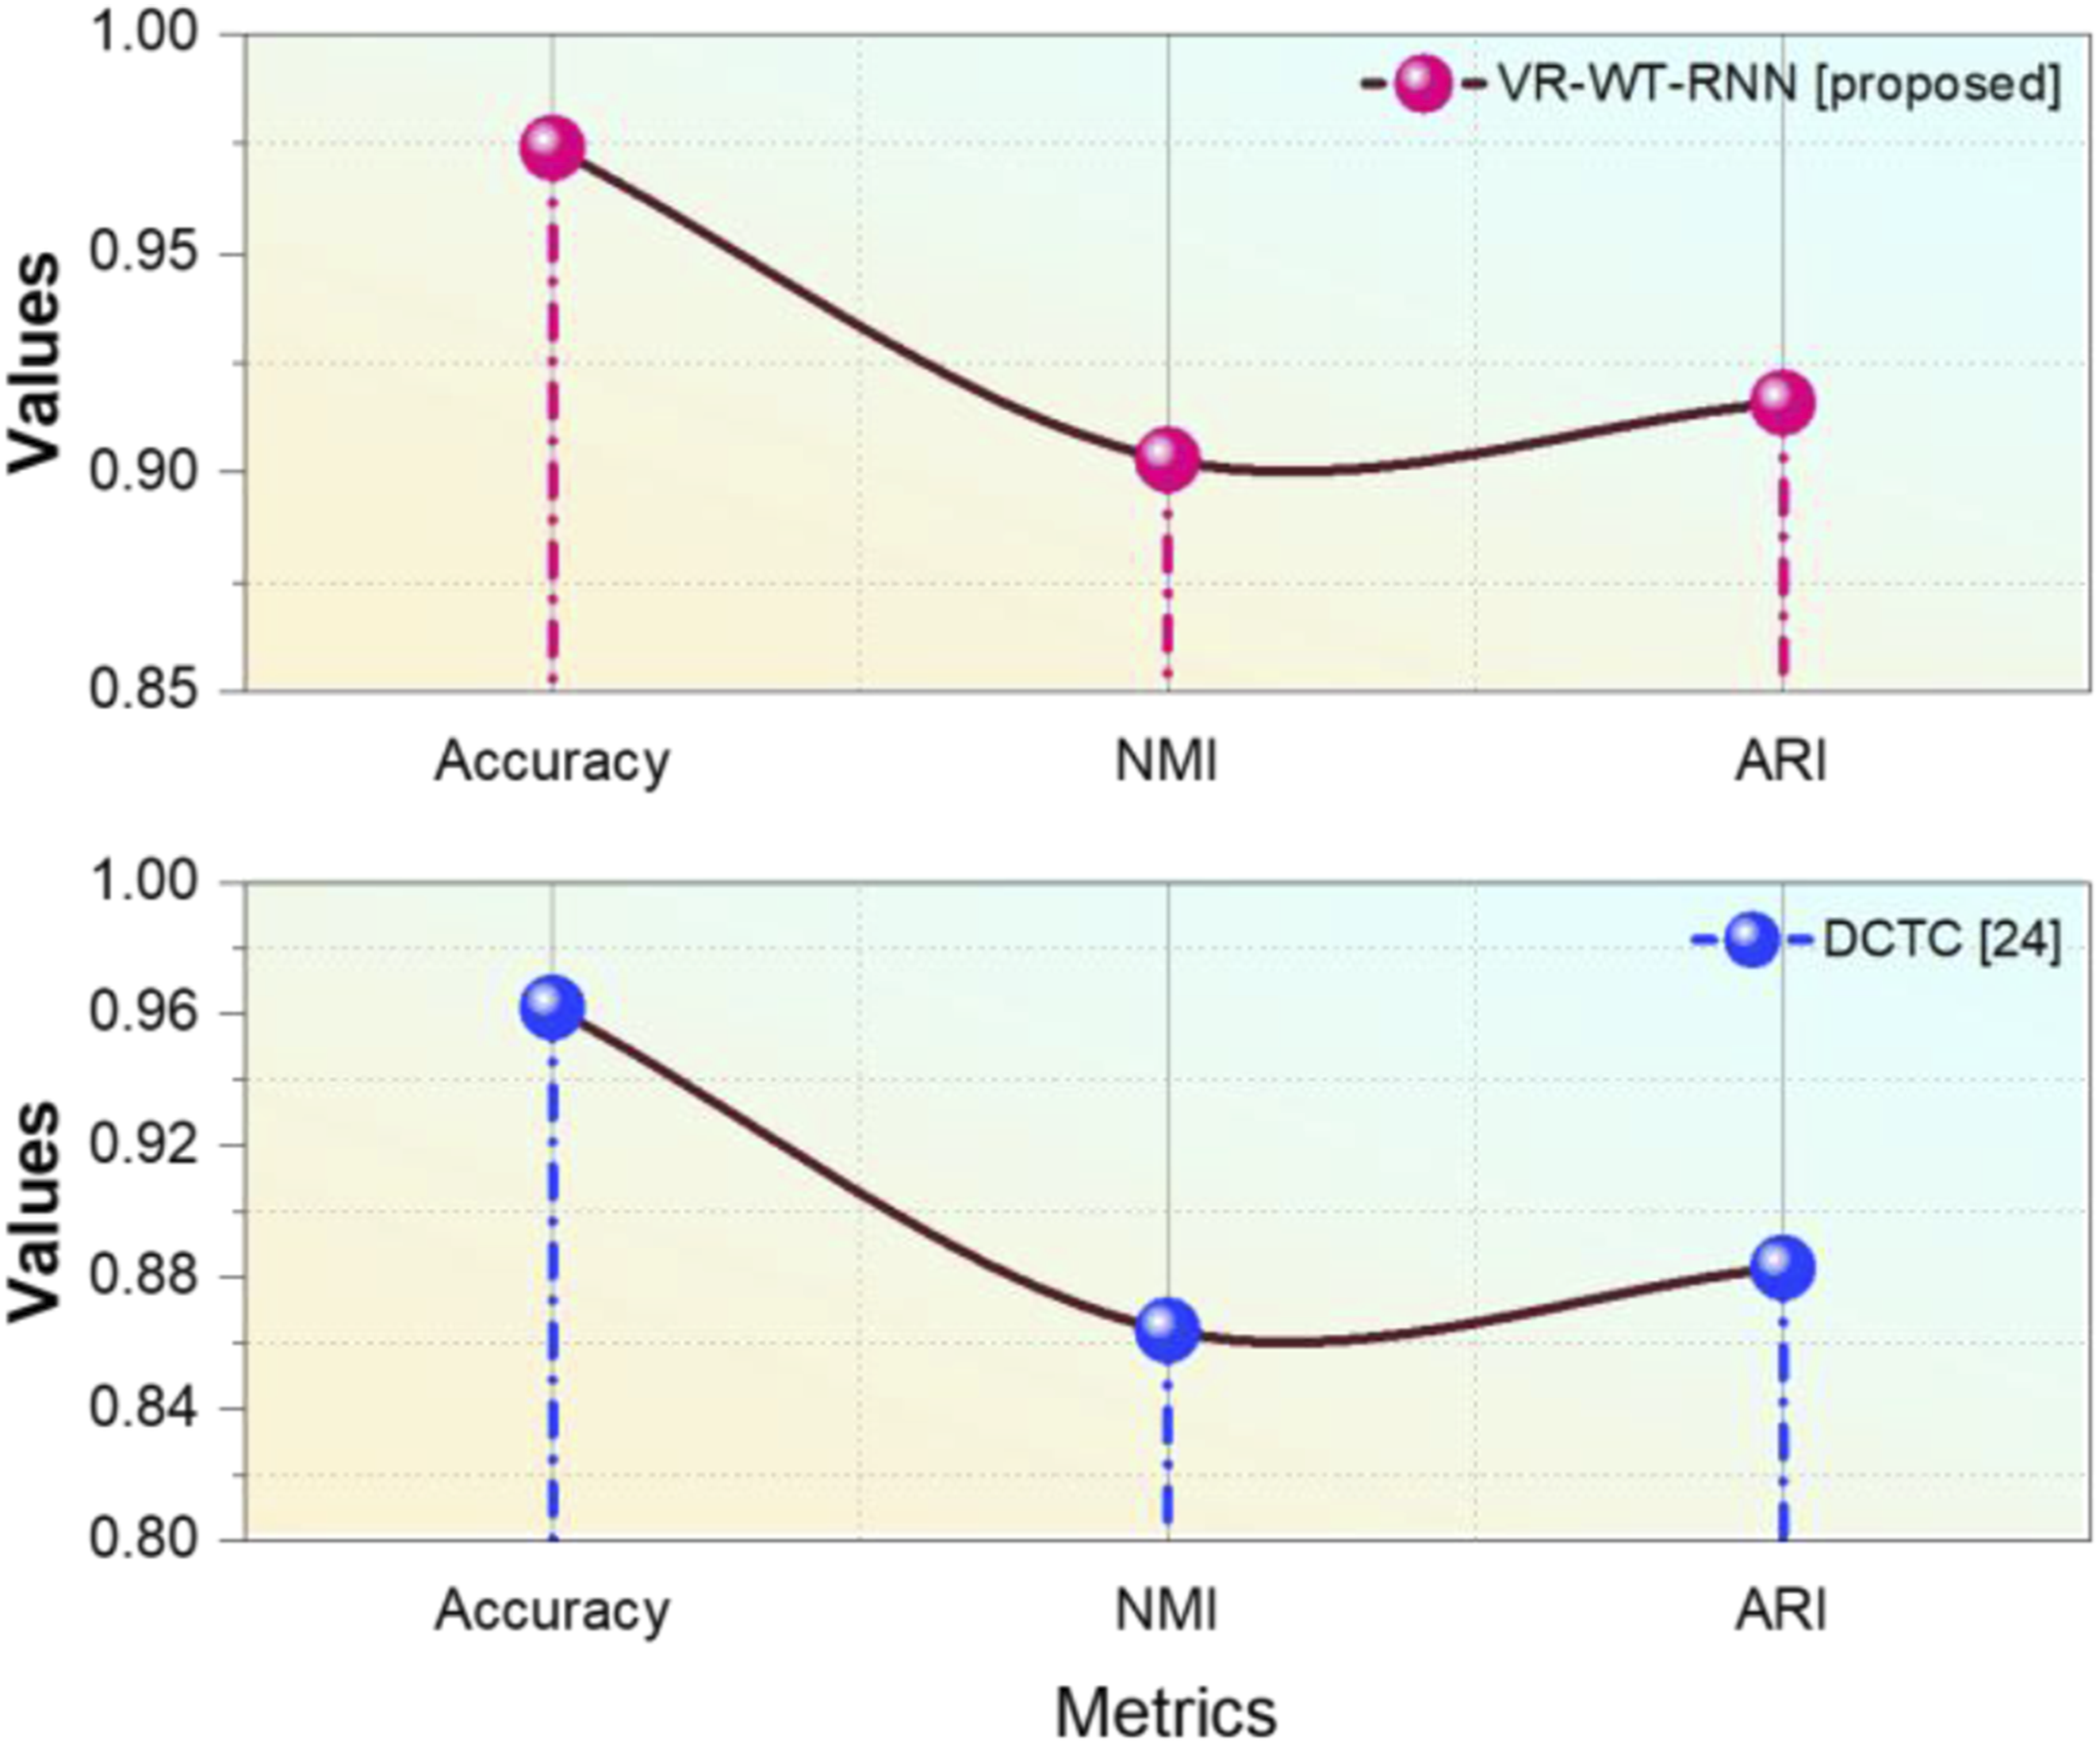
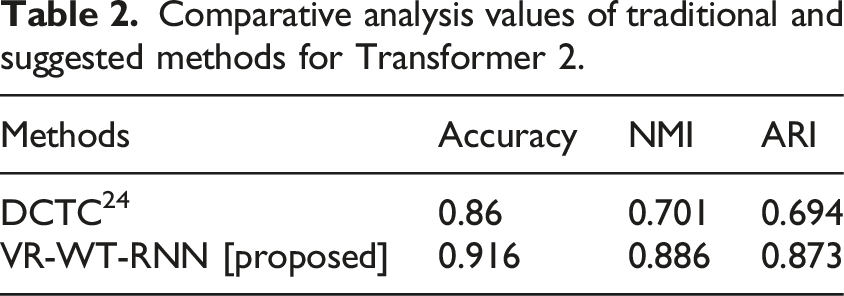
Transformer 2 results provide a performance comparison of two models utilizing three assessment metrics: Accuracy, NMI, and ARI in Figure 10 and Table 2. The DCTC model has an Accuracy of 0.86, NMI of 0.701, and ARI of 0.694, indicating good classification capability. In comparison, the proposed VR-WT-RNN model exceeds DCTC with an Accuracy of 0.916, NMI of 0.886, and ARI of 0.873, showing higher accuracy, better alignment between true and predicted labels, and improved data clustering or classification performance. A comparison between the suggested and existing DCTC methods for transformer 2 in LVDN. Comparative analysis values of traditional and suggested methods for Transformer 2.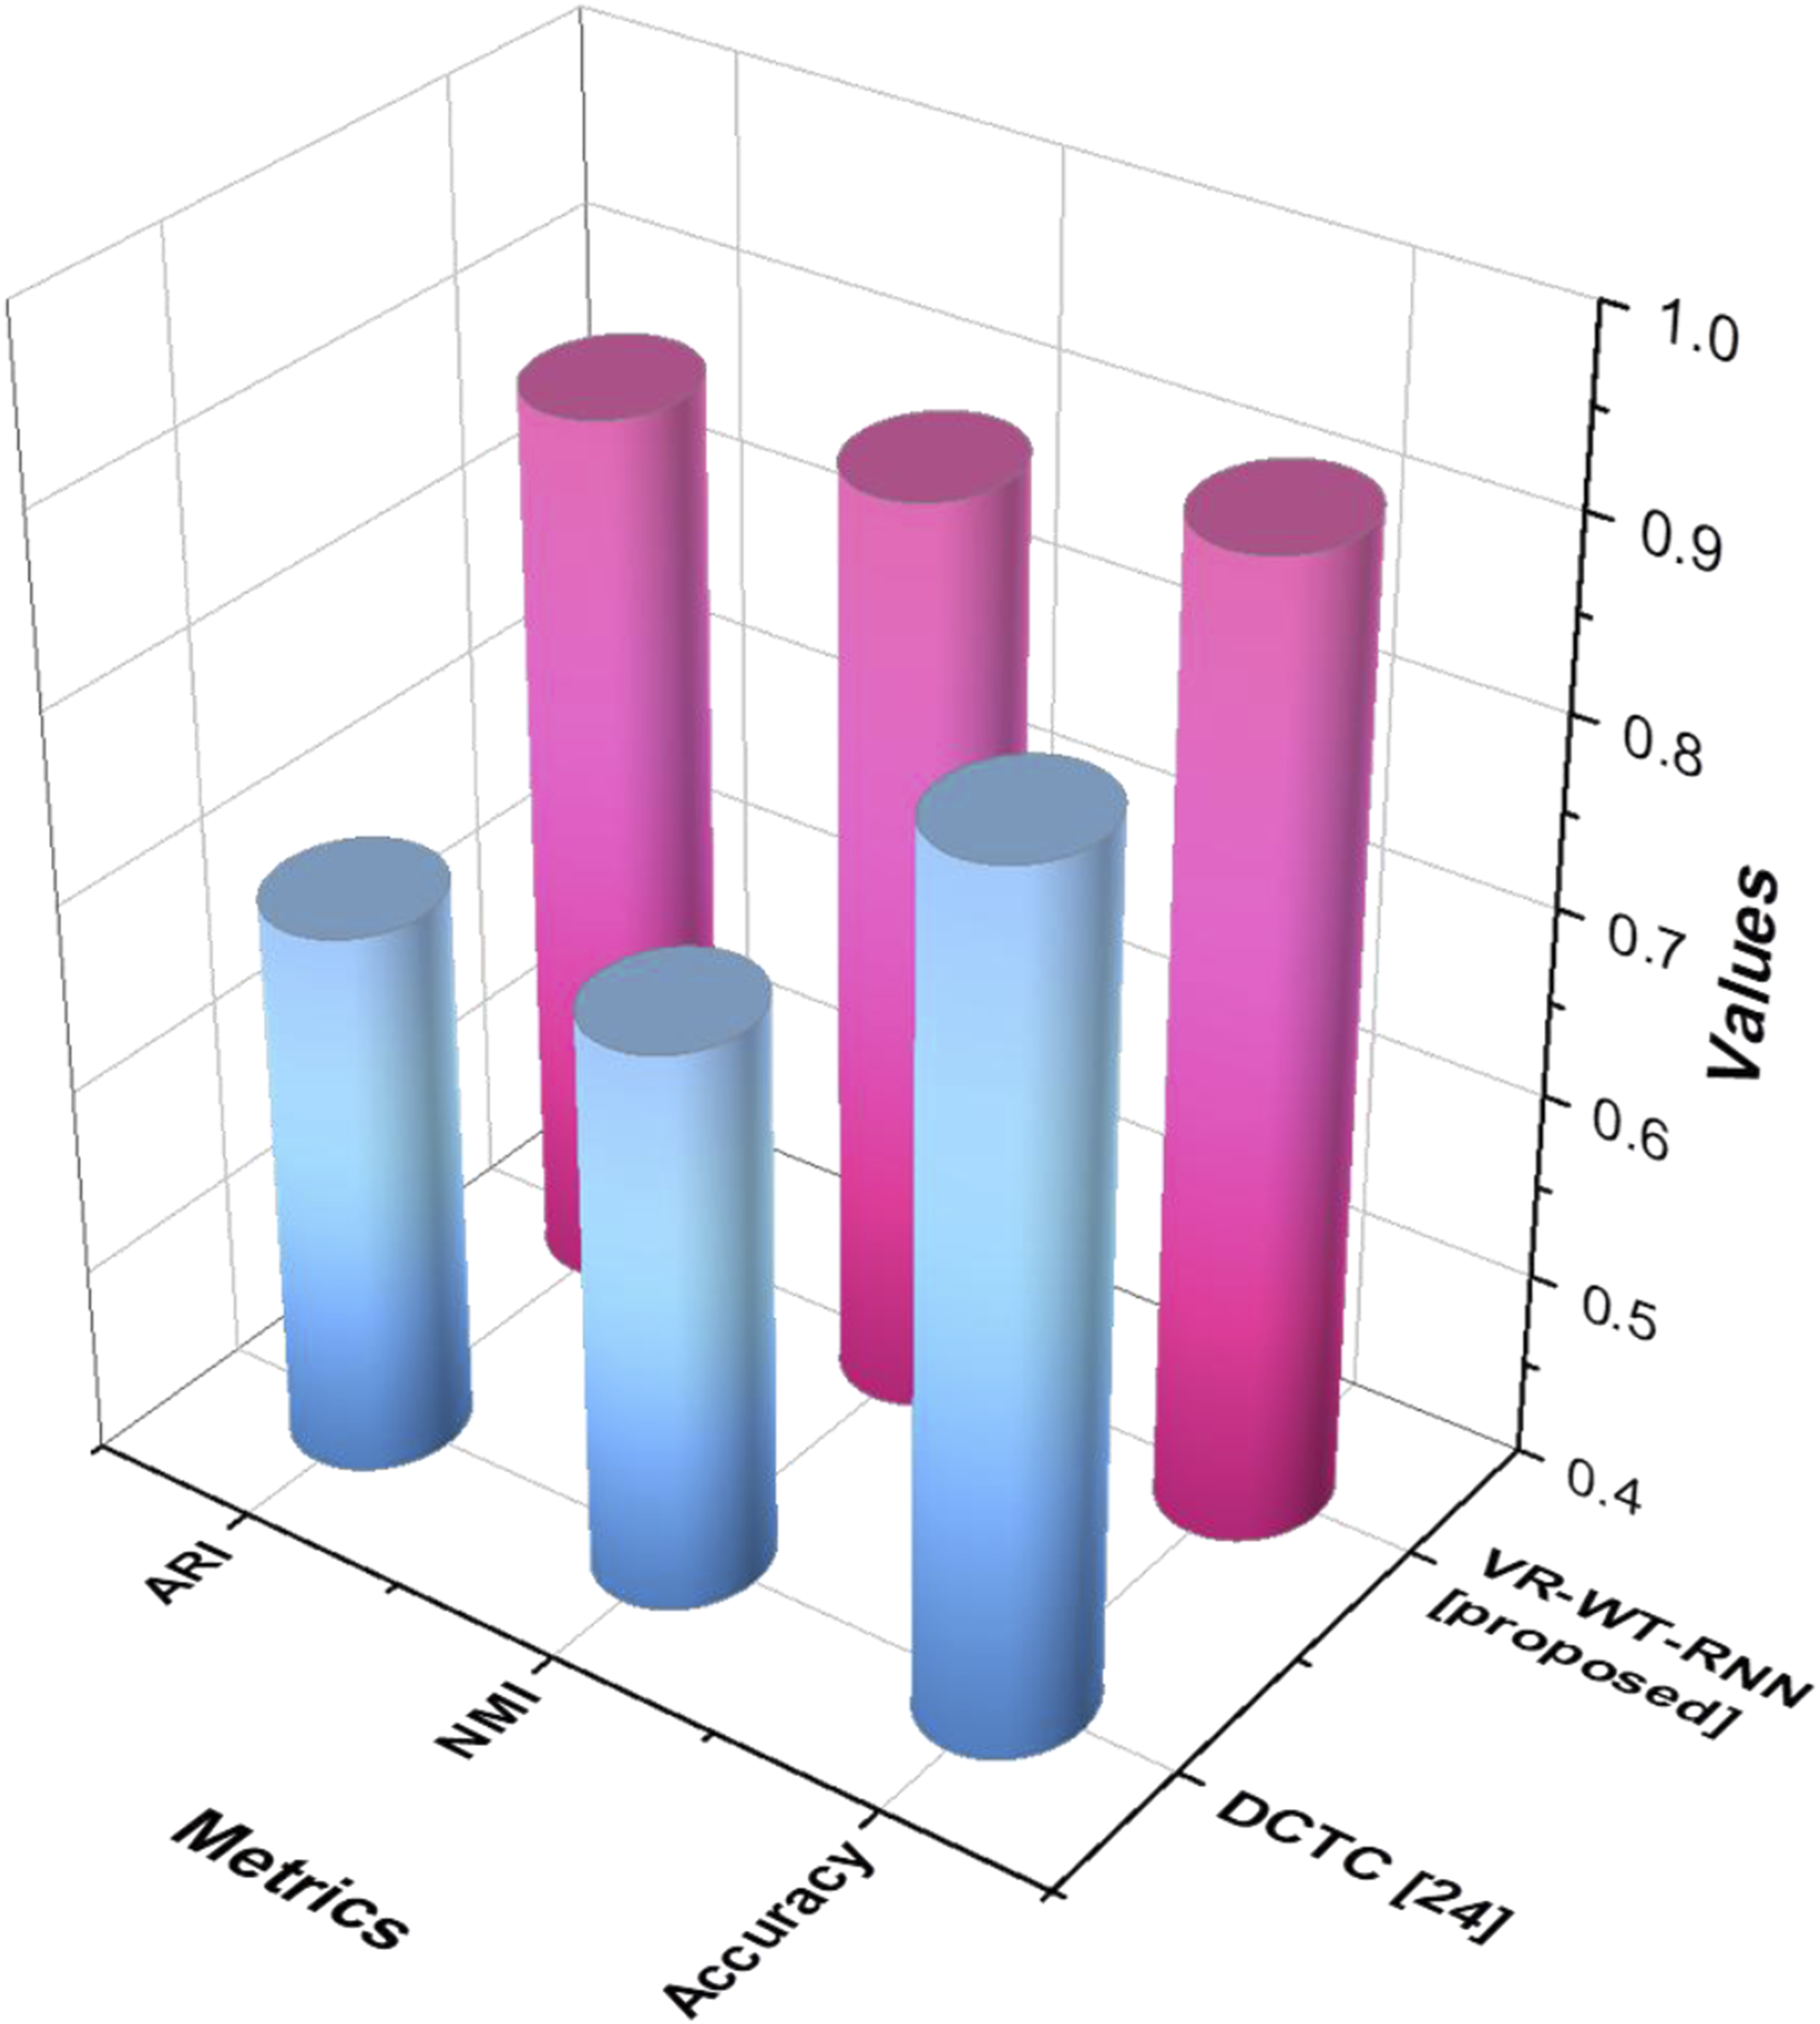
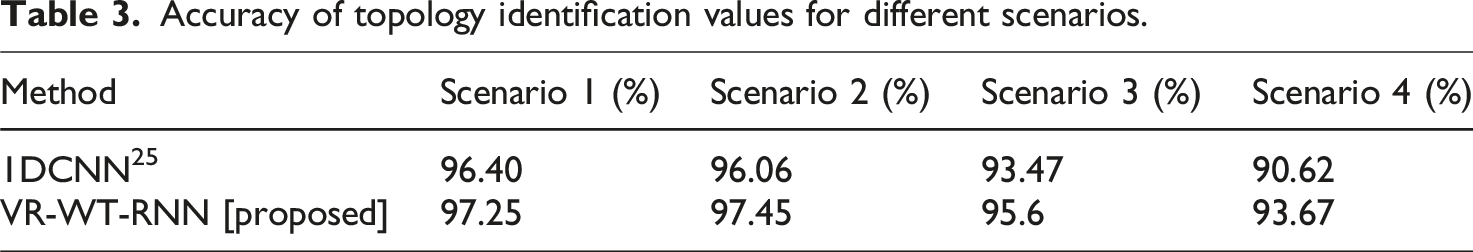
The suggested VR-WT-RNN algorithm outperforms the 1DCNN in all circumstances, as shown in Figure 11 and Table 3. In Scenario 1 (data measurement error), the VR-WT-RNN achieves 97.25% accuracy versus 96.40% for the 1DCNN. In Scenario 2 (voltage measurement error), it reaches 97.45%, whereas the 1DCNN achieves 96.06%. VR-WT-RNN outperforms the 1DCNN (93.47%) in Scenario 3 (voltage measurement inaccuracy) by 95.6%. Finally, in Scenario 4 (voltage measurement error), the VR-WT-RNN achieves 93.67%, compared with 90.62% for the 1DCNN. Comparative analysis of topology identification accuracy across different scenarios in LVDN. Accuracy of topology identification values for different scenarios.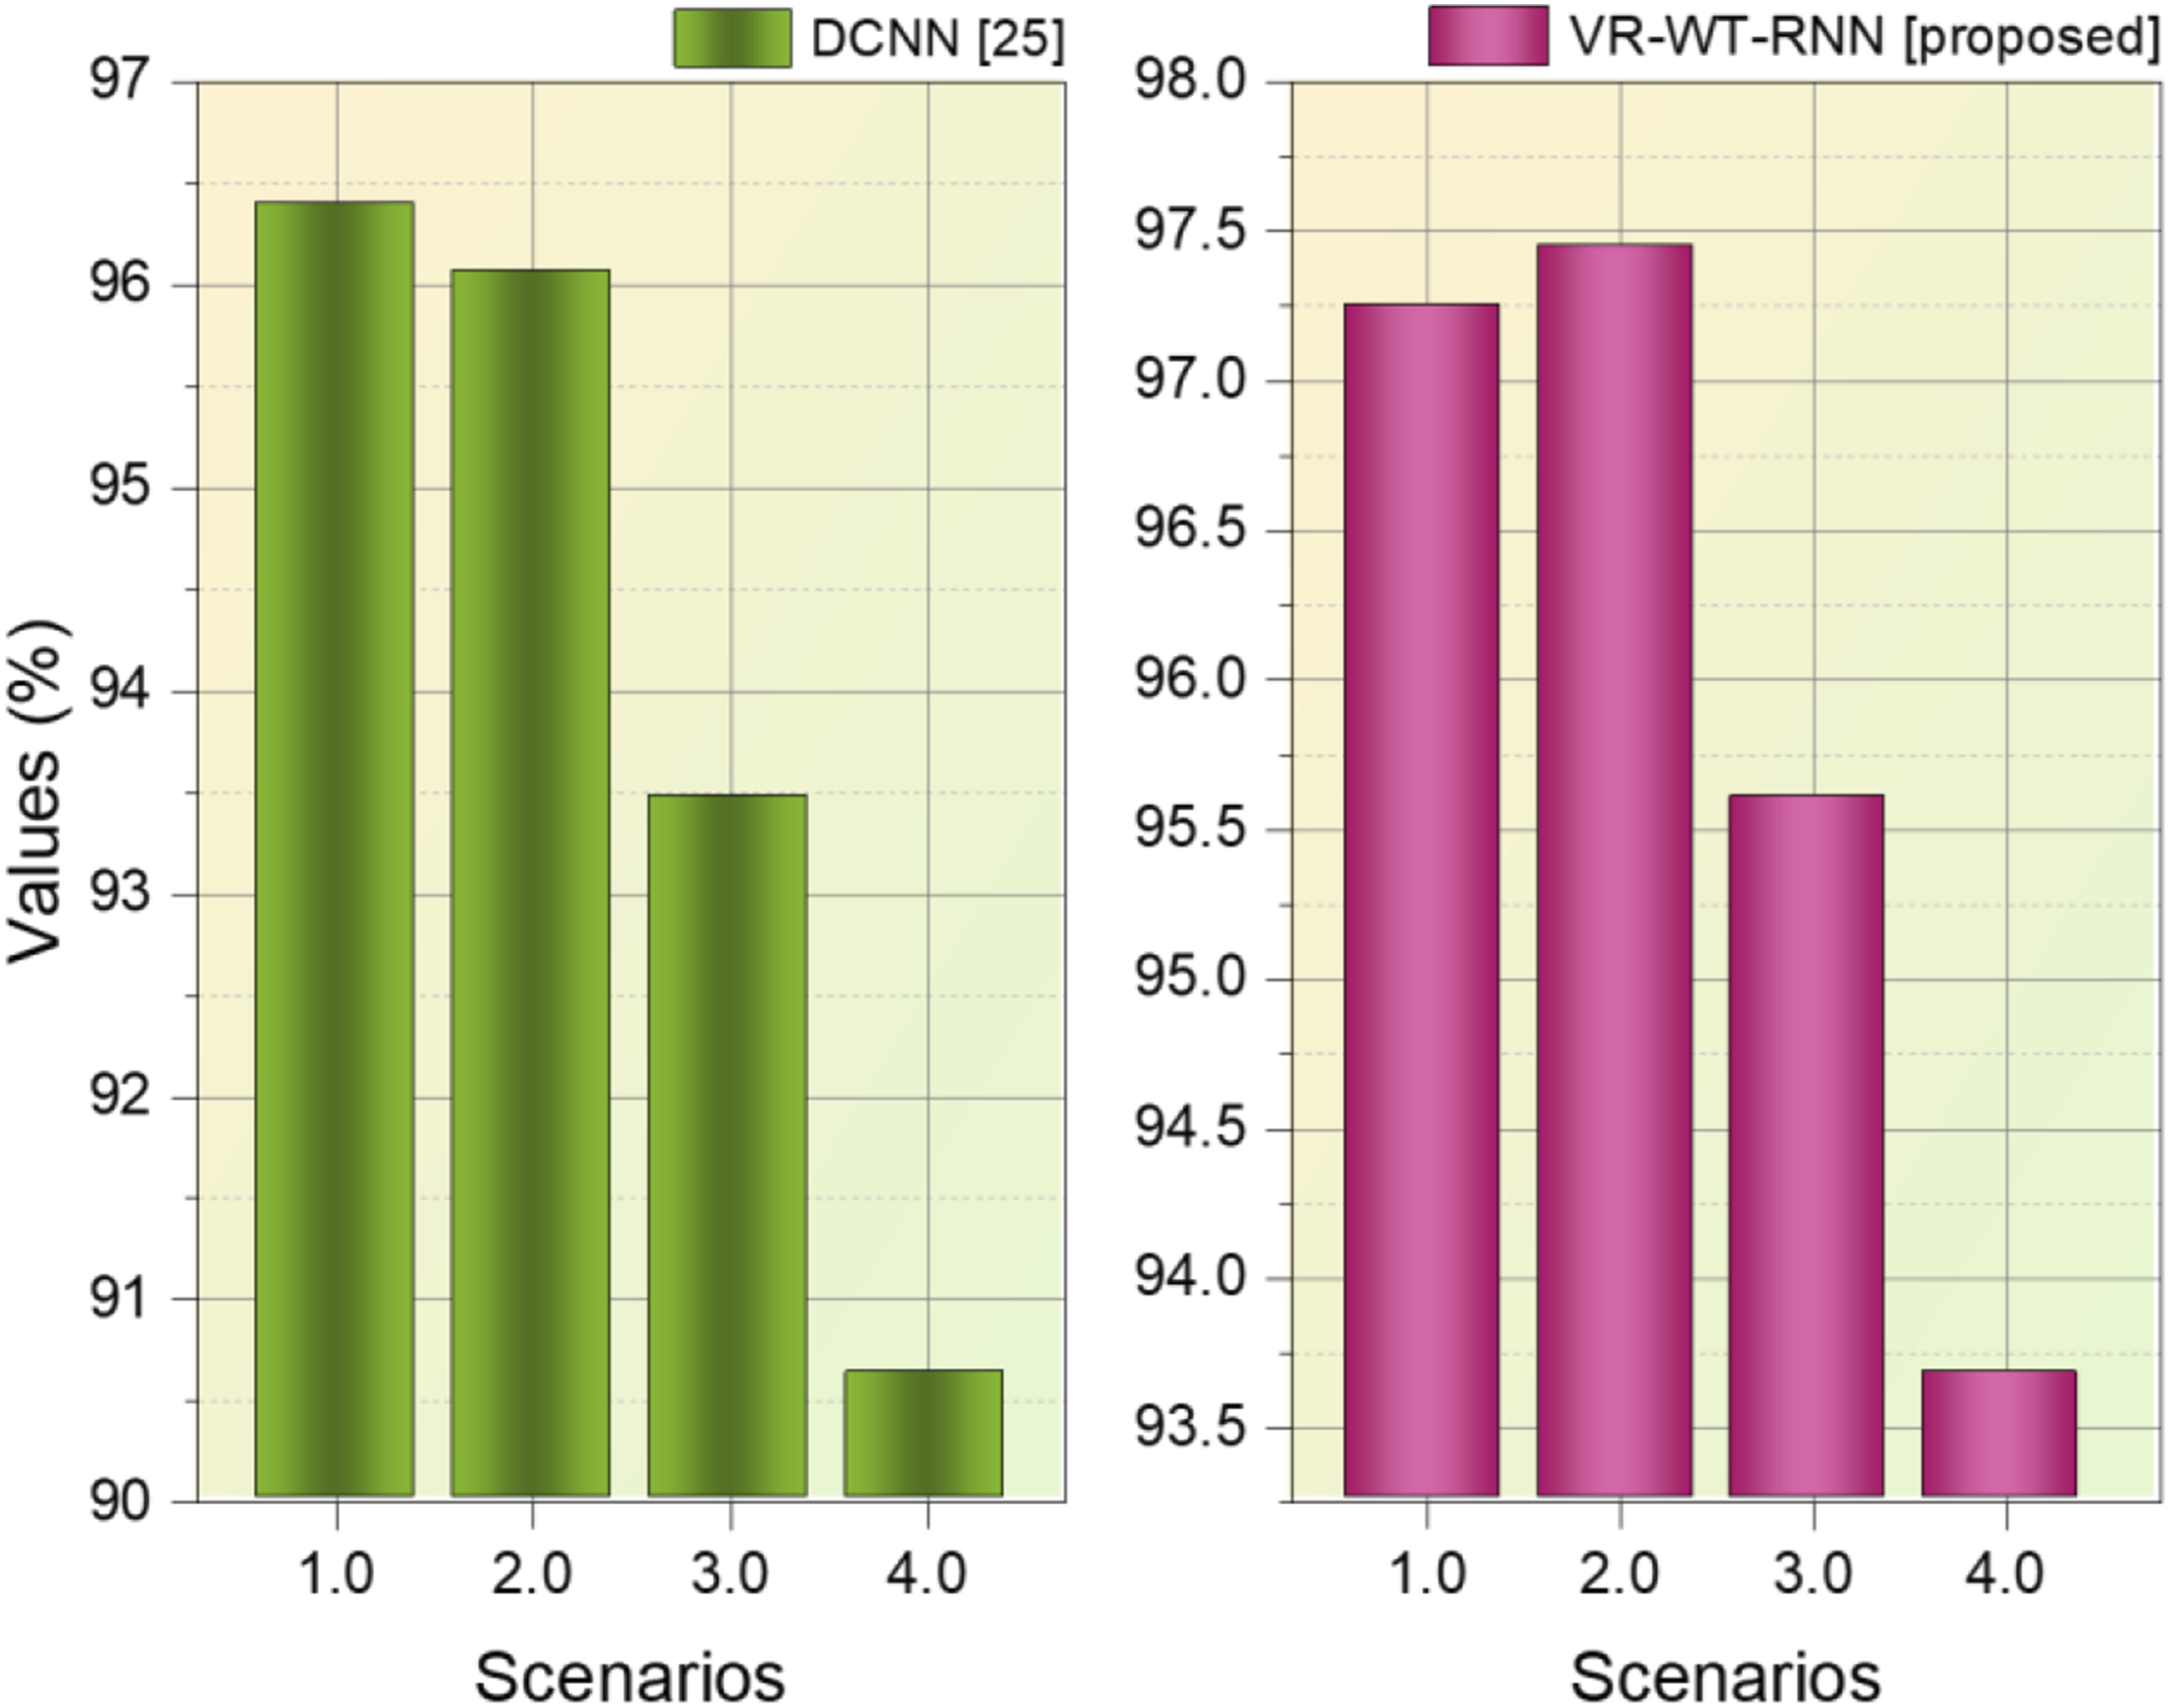
Conclusion
An accurate identification of network characteristics and topology in electrical distribution systems is critical for effective operation and maintenance. The primary objectives of electrical distribution systems are to maximize operating efficiency and ensure dependability. The Low-Voltage Network Dataset was developed through simulation by recording time-series data from five nodes in a low-voltage electrical distribution network, and it was preprocessed using Z-score normalization. This research proposes a novel approach for jointly identifying parameters and topology in low-voltage distribution networks that use the Voltage Regulator Weighted Topology Recurrent Neural Network (VR-WT-RNN). The suggested method achieved better performance compared to the baseline methods in terms of Accuracy (0.974), NMI (0.903), and ARI (0.916) for Transformer 1, and Accuracy (0.916), NMI (0.886), and ARI (0.873) for Transformer 2. Additionally, it outperformed in topology identification accuracy across Scenarios 1 (97.25%), Scenario 2 (97.45%), Scenario 3 (95.6%), and Scenario 4 (93.67%). These improvements underscore the robustness and adaptability of the proposed approach under diverse conditions and data complexities. While the use of RNNs for identifying low-voltage distribution network characteristics and topology shows promising results, challenges such as noise sensitivity and reliance on limited labeled data remain. Future research could explore hybrid models—such as RNNs combined with attention mechanisms or graph neural networks (GNNs)—to enhance robustness. Incorporating adaptive learning strategies may further improve real-time performance and facilitate better management of dynamic network topology changes.
Footnotes
Funding
The authors received no financial support for the research, authorship, and/or publication of this article.
Declaration of conflicting interests
The authors declared no potential conflicts of interest with respect to the research, authorship, and/or publication of this article.
Data availability statement
The authors declare that the data supporting the findings of this study are available within the article. The raw/derived data supporting the findings of this study are available from the corresponding author at request.