
Abstract
With the rapid development of information technology, Linux operating system, as an open source system, is widely used in servers, embedded devices, and cloud computing platforms. Because of its stability, flexibility, and efficiency, Linux systems play a role in many key areas. However, with the complexity of application environment and the expansion of system scale, the reliability and performance evaluation of Linux system have gradually become the focus of research. Based on fuzzy comprehensive evaluation method, this paper proposes a new reliability benchmarking and dynamic performance evaluation method of Linux system. By constructing a fuzzy evaluation model, the reliability of Linux system is comprehensively and quantitatively evaluated, and through comparative analysis, the dynamic performance optimization strategy of Linux system in different running environments is put forward. Based on experimental data and actual usage scenarios, this paper collects performance data of multiple Linux systems in terms of load, network transmission, IO operation, etc., covering mainstream versions such as Ubuntu, CentOS, and Debian. Through fuzzy comprehensive evaluation of these data, the reliability scores of different system versions are obtained, and their performance bottlenecks are deeply analyzed. The experimental results show that the reliability score of Ubuntu system under high load conditions is 82.5%, while the reliability score of CentOS system is slightly lower at 78.3%. Through dynamic performance evaluation, it is found that IO performance fluctuates significantly under high concurrency, which affects the stability and response speed of the system. The evaluation method proposed in this paper can not only accurately reflect the performance of Linux system in practical application but also provide theoretical basis and technical support for system optimization. The research results are of great significance to improve the reliability and performance of Linux systems, especially in large-scale applications and demanding industry environments.
Introduction
With the rapid development of information technology and the widespread popularization of network applications, the role of operating systems in the modern computing environment is becoming increasingly important. 1 As an open-source operating system, Linux has been widely used in many fields due to its high stability, flexibility, and openness, especially in cloud computing, big data, server management, and embedded systems, and it has become an important choice for enterprises and developers. 2 However, although the reliability and performance of Linux systems are excellent in many scenarios, with the diversification of application environments and increasingly complex requirements, evaluating and optimizing the reliability and performance of Linux systems is still an important problem that needs to be solved urgently.
The traditional operating system performance evaluation usually relies on quantitative indicators, such as system response time, throughput, and CPU utilization. However, these single indicators often make it difficult to fully reflect the comprehensive performance of the system, especially in the face of high loads, complex tasks, and sudden failures, and the shortcomings of traditional evaluation methods become increasingly apparent. 3 To evaluate the performance and reliability of Linux systems more accurately, in recent years, the fuzzy comprehensive evaluation method has gradually become an effective tool. 4 This method can deal with the complexity and uncertainty of the system and is especially suitable for comprehensive evaluation when multiple uncertain factors are intertwined.
This study proposes a new reliability benchmarking and dynamic performance evaluation method for Linux systems based on a fuzzy comprehensive evaluation method. By fuzzifying the system performance data, it can more flexibly cope with the changes in Linux systems in different application scenarios and provide a thorough and dynamic evaluation framework. 5 Especially in complex application scenarios such as high concurrency and large-scale data processing, the method in this paper can effectively identify system bottlenecks and provide accurate optimization suggestions, thereby improving system stability and response speed.
Firstly, this paper collects the performance data of several mainstream Linux systems, including Ubuntu, CentOS, and Debian, and analyzes them by fuzzy comprehensive evaluation model, and obtains the reliability score of each system under different load and operation conditions. Then, combined with the Linux system’s dynamic characteristics, this paper puts forward a dynamic performance evaluation method, which can monitor and evaluate the system’s performance in real time. The experimental results show that this method can provide a reliable basis for the performance optimization of Linux systems, especially in large-scale deployment and high-demand environments, and has important practical application value.
Theoretical basis and related research
Research status of Linux functional safety verification
The design and development of safety-critical systems strictly follow the requirements of functional safety standards in related fields and have a complete safety life development cycle from system design and development to put into use and later maintenance. During the safety life development cycle, it is necessary to retain relevant information in paper and electronic form and provide it to the corresponding functional safety standard certification body to certify the compliance of the development process. 6 Although the Linux system has a relatively strict development process, it has not followed the relevant functional safety standards for development, nor has it specifically retained the appropriate documents required by the functional safety standards, so it is impossible to confirm the compliance of the Linux kernel and the development process specified by the proper functional safety standards. Therefore, the difficulty of functional safety verification of the Linux kernel lies in the lack of systematic methods and perfect data to prove that its development process meets the safety life cycle stipulated by functional safety standards. Therefore, domestic and foreign institutions and groups have conducted relevant research and exploration.
According to functional safety standard IEC61508 requirements, Linux can be applied in safety-critical fields. In the report of TU Vienna on Linux kernel version 2.6, it is pointed out that the development process of Linux kernel has a relatively complete code testing and review process, and the relevant documents in the development process have been saved, so it has the potential to be applied to security-critical fields.7,8 This paper constructs a framework for Linux kernel verification, which can guide the functional safety verification process of Linux and reduce the workload of the verification process as much as possible. It proposes a method of limiting the system context to limit the Linux kernel in a small scope. Assist other companies in compliance with systems developed on Linux with relevant functional safety standards by building a common set of tools and processes and ways to apply Linux to safety-critical systems.
When analyzing the delay data of a Real-time Operating System (RTOS), the phenomenon of system Jitter is observed, and it is found that the Jitter is affected by the software structure and multi-level cache. Still, it can’t fully explain the difference between system Jitter. Therefore, the hypothesis that Linux has inherent randomness and is related to the execution path of the system is put forward. Based on the uncertainty of this Jitter, we continue to study and track the execution paths of system calls of multi-core Linux systems under different schemes and find that different execution paths are observed during the repeated execution of system calls while keeping the input parameters unchanged which verifies that multi-core Linux systems do not have execution path certainty. 9 Aiming at the dynamic behavior of Linux, the SIL4Linux test tool is developed, which can track and record the data of Linux kernel dynamic execution path and execution time, and rich experimental data demonstrate the uncertainty of Linux kernel execution path and execution time. To study the degree of uncertainty of the dynamic execution path of the Linux kernel by repeatedly running a simple program, it was found that system factors such as interrupts impact the execution time and execution path of the Linux kernel. It is proposed that this diversity of Linux can be used to protect the replication system from residual failures in the running platform. 10 In the research, it is found that the dynamic execution path of the Linux kernel changes according to different kernel versions and kernel modes, and it is proposed that this uncertainty can be used to optimize the system’s failure rate. It is found that the collected dynamic execution path data accords with the characteristics of the coefficient network, and the complex network is constructed through the dynamic execution path data of the Linux kernel, which provides a new idea for analyzing the complex function call relationship of the Linux kernel. By controlling file system types and system load variables, it is found that different file system types will significantly change the dynamic execution path of system calls. With the increase in data collection times, the number of dynamic execution paths of file system-related system calls tends to be stable.
Current situation of dynamic performance evaluation methods in Linux system
In Linux systems, dynamic performance evaluation has become an important operating system optimization and performance monitoring field. With the continuous development of technology and the increasing complexity of application scenarios, traditional static performance evaluation methods have made it difficult to meet the needs of high concurrency, high load, and complex task scenarios. 11 Dynamic performance evaluation requires real-time monitoring of system resource consumption and the ability to respond and handle load changes during system operation quickly. This demand has given rise to various evaluation methods based on real-time data acquisition and dynamic models to more comprehensively and accurately reflect the performance status of the system and help system administrators identify potential problems and optimize them in time.
The dynamic performance evaluation methods under the Linux system mainly include evaluation methods based on monitoring tools, performance analysis tools, and fuzzy comprehensive evaluation models. 12 Commonly used monitoring tools such as Top, top, top, and Neon can collect real-time performance data such as CPU usage, memory footprint, disk IO, and network throughput. 13 However, these tools usually only provide single-dimensional data, lack in-depth analysis of multi-dimensional interaction effects, and make it difficult to conduct comprehensive performance evaluations in complex environments. Therefore, the evaluation method based on performance analysis tools has gradually become the mainstream. The root causes of system bottlenecks and performance degradation can be revealed through tracking and in-depth analysis of the Linux kernel.
Based on performance analysis tools, fuzzy comprehensive evaluation methods are gradually introduced into the dynamic performance evaluation of Linux systems. 14 Fuzzy comprehensive evaluation can give a comprehensive performance score through a multi-dimensional evaluation index and weighted average method under high uncertainty. 15 This method can overcome the limitation that a single index cannot fully reflect the system performance problem and can combine subjective experience and objective data to evaluate the dynamic performance of different system versions, hardware environments, and load conditions in multiple dimensions. This makes fuzzy comprehensive evaluation an effective tool for dynamic performance evaluation in Linux systems, especially suitable for comprehensive performance prediction and optimization in complex scenarios.
In the reliability and dynamic performance evaluation of Linux systems based on fuzzy comprehensive evaluation, fuzzy sets are the core foundation. A fuzzy set is a set with a continuous membership function that describes concepts with unclear boundaries, such as fuzzy states such as “good performance” and “high reliability” of the system. The membership function is a function used to determine the degree to which an element belongs to a fuzzy set, and the common ones are triangle and trapezoidal membership functions. Evaluation metrics include load, I/O, and network transmission, which reflect system performance from different dimensions. The weighting criterion is used to measure the importance of each evaluation indicator to the final result, and its accurate determination is the key to the accuracy of the evaluation.
Although fuzzy comprehensive evaluation has made some progress in dynamic performance evaluation, its practical application still faces challenges. For example, how to scientifically and reasonably select and weigh various performance indicators, how to deal with performance evaluation data under different load and task scenarios, and how to make accurate performance predictions by combining real-time monitoring and historical data are all urgent problems to be solved in current research. 16 In addition, with the wide application of Linux systems in emerging fields such as virtualization, cloud computing, and the Internet of Things, effectively combining dynamic performance evaluation methods with these emerging technologies to improve the accuracy and real-time performance of evaluation results is still a challenging topic.
Establishment of dynamic performance evaluation method model for Linux system based on fuzzy comprehensive evaluation
Linux system architecture establishment
The overall architecture is analyzed here. There are many kinds of software architectures under Linux, and we need to reasonably plan the overall framework of the software according to the overall requirements. A good architecture can efficiently use computing resources, thus improving the system’s performance. In the Linux environment, mainstream architectures include Monolithic Architecture and Microservices Architecture, each with advantages and disadvantages. We need to comprehensively consider the requirements of reliability benchmarking and dynamic performance evaluation and choose the most suitable architecture to ensure the stability and scalability of the system.17,18
The block diagram of the single architecture is shown in Figure 1. Each software module is embedded in a service container or process, in which the calculation module, evaluation core, fuzzy evaluation module, graphical interface, data post-processing module, etc., are all integrated into a process.
19
The advantage of this architecture is that it is relatively simple to develop, which can speed up the development speed and start and deploy applications quickly. Still, this architecture is not suitable for this topic. With the increase of system scale and complexity, the software’s limitations will gradually emerge, especially in complex reliability benchmarking and dynamic performance evaluation tasks; the single architecture may not be able to meet the requirements of high efficiency and scalability.
20
Block diagram of single architecture.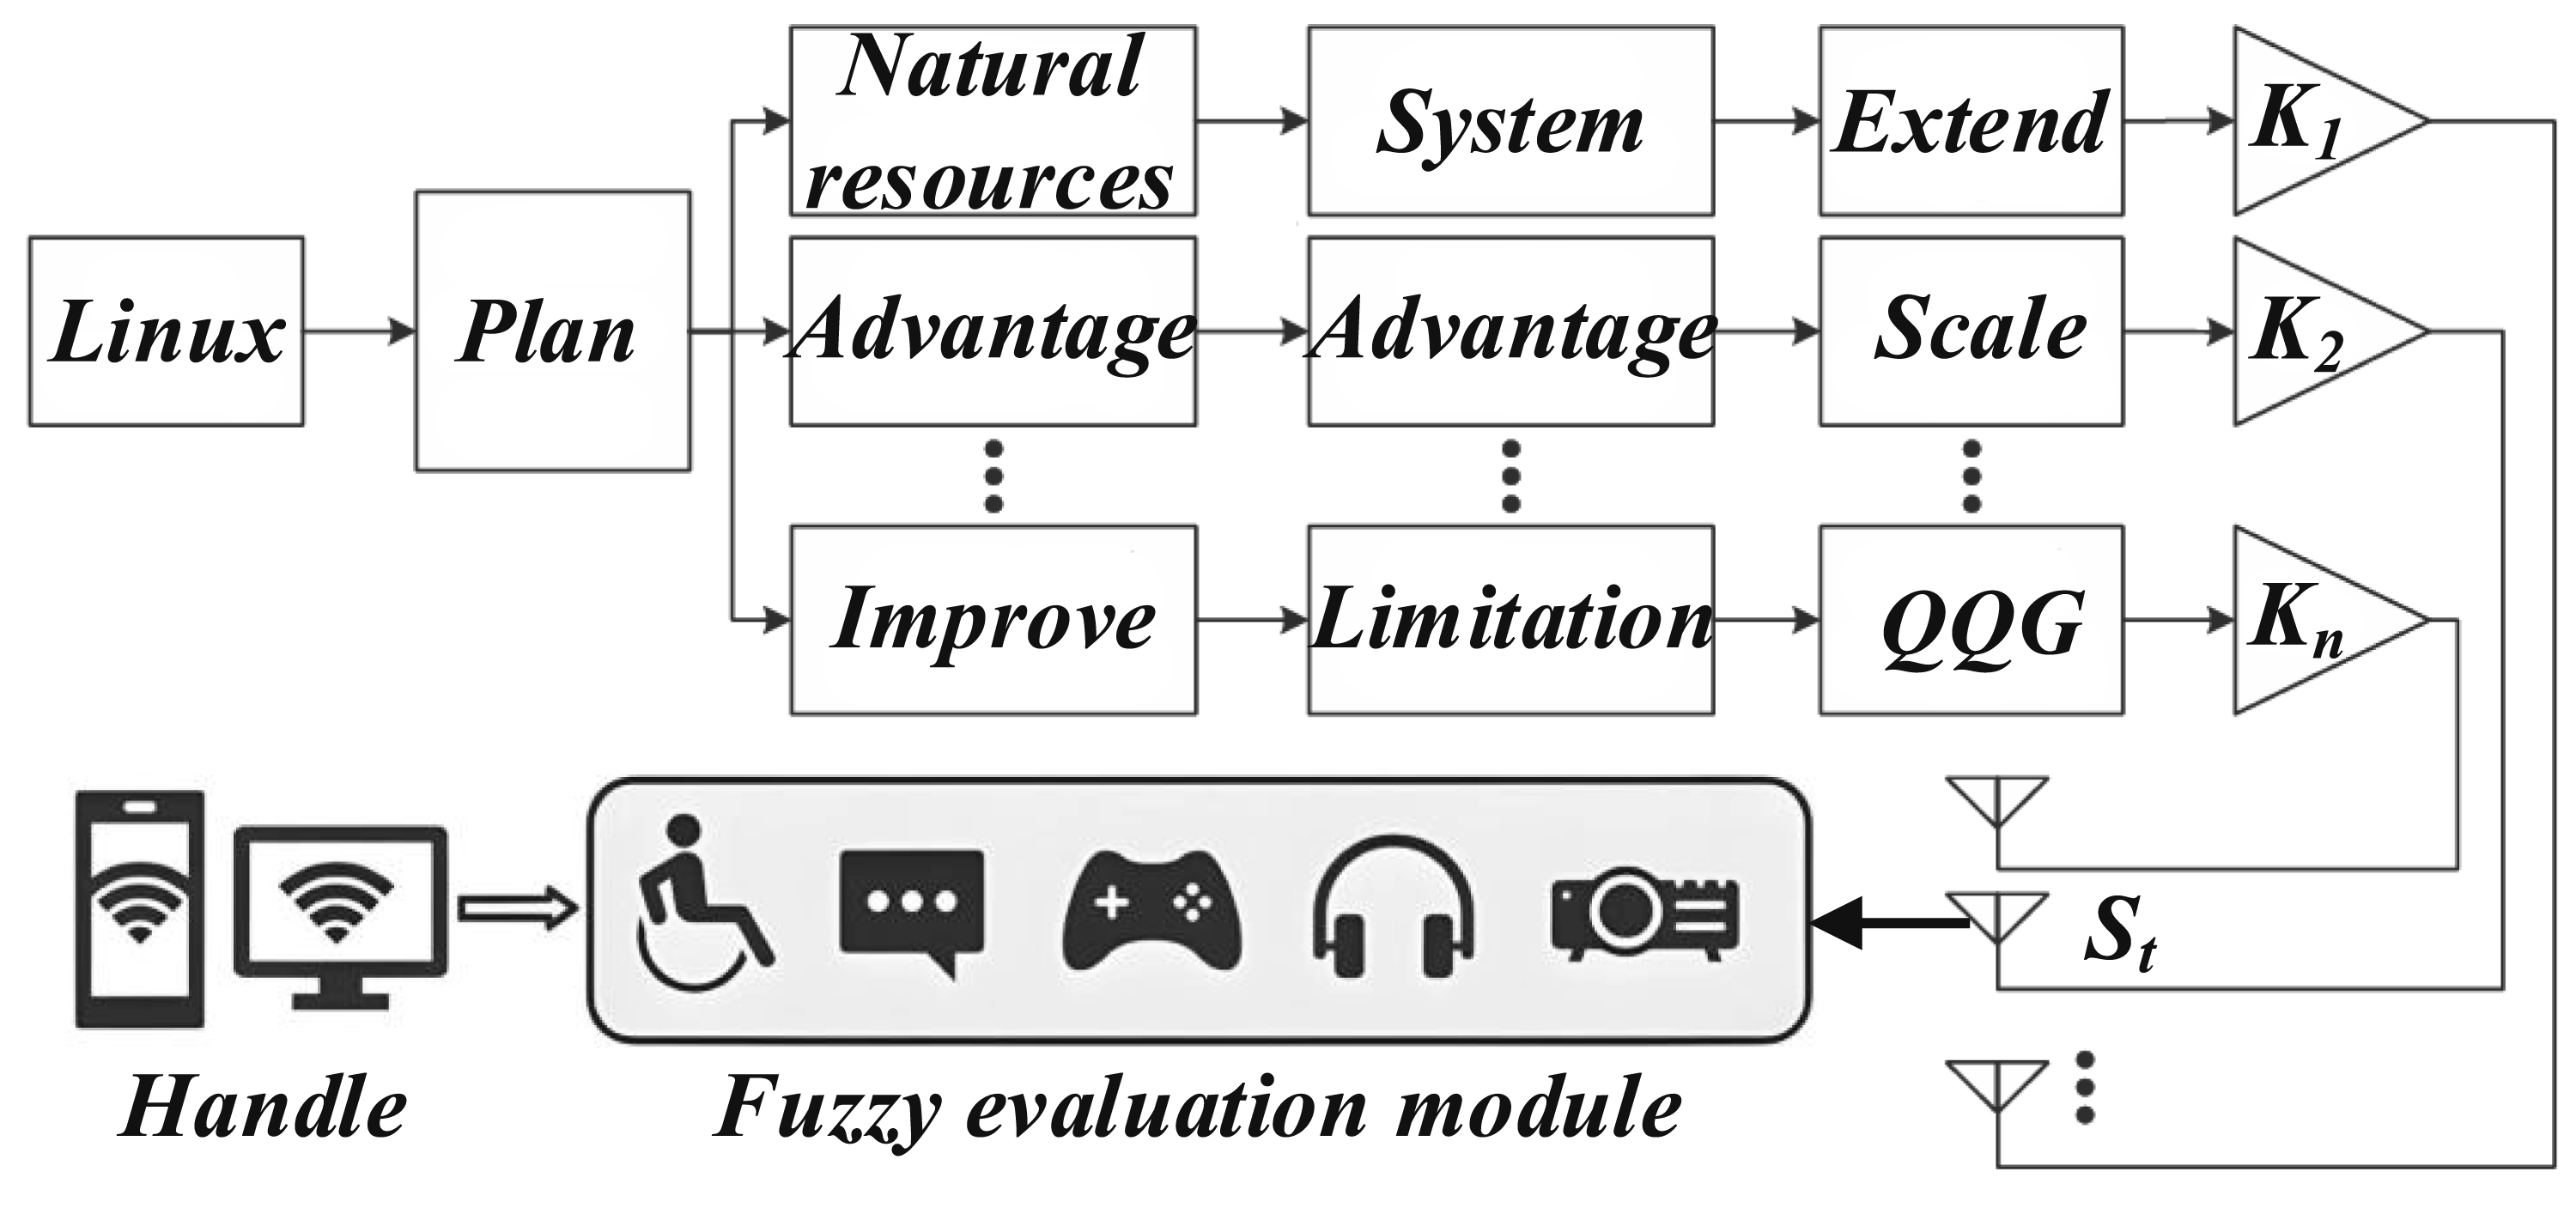
The lack of scalability is a significant drawback. Due to the high update frequency of the evaluation core, the monolithic architecture requires the evaluation core and the graphical interface to be in the same process. This leads to the system recompiling every time the evaluation core is updated.21,22 This will greatly reduce the update efficiency, and as the system scale expands, the compilation time will become longer and longer, affecting the efficiency of system development, testing, and performance tuning, especially when dealing with complex reliability benchmarking and dynamic performance. When evaluating, the bottleneck of development and debugging is particularly prominent. The updated efficiency formula is shown in (1).

Among them, E
update
represents the update efficiency, T
total
represents the total update cycle of the system, and T
update
represents the time spent for each update. The compilation time formula is shown in (2).

Among them, T
compile
represents the total compilation time, T
base
represents the basic compilation time, k represents the compilation time constant of each module, and N
modules
represents the number of system modules. Lack of performance is also one of its drawbacks. Since the evaluation core mainly performs complex computing tasks, it will occupy a lot of CPU resources.
23
However, the computing resources allocated by the operating system to each process are limited. When the evaluation core occupies most of the CPU resources, the remaining resources will be allocated to the graphical interactive platform, leading to insufficient response performance of the graphical interface and affecting the overall system’s performance. Especially when performing reliability benchmarking and dynamic performance evaluation, the simulation time may become longer, thus reducing the efficiency and real-time performance. The CPU resource allocation formula is shown in (3).

Among them, R
core
represents the proportion of CPU resources occupied by the evaluation core, C
core
represents the CPU computing resources occupied by the evaluation core, and C
total
represents the total CPU resources allocated by the operating system for the entire process. The response performance formula of the graphical interactive platform is shown in (4).

Among them, P
gui
represents the response performance of the graphical interactive platform, C
remaining
represents the remaining CPU resources allocated to the graphical interactive platform, and T
response
represents the response time of the graphical interactive platform. Microservice architecture block diagram is different from monolithic architecture. Microservice architecture improves the flexibility and scalability of the system by decomposing the system into a series of small, independent services.
24
Each service module is independent of each other, but it is interdependent in logical function. This architecture can better support complex tasks such as reliability benchmarking and dynamic performance evaluation. The advantages of microservice architecture are particularly prominent, especially when dealing with large-scale data and high-frequency updates. The system flexibility improvement formula is shown in (5).

Among them, F
system
represents system flexibility, S
mod
represents the number of service modules, and T
update
represents the time required for update operations. The scalability formula is shown in (6).

Among them, E
scalability
represents the system’s scalability, N
services
represents the number of service modules, and T
scale
represents the time required for expansion. Based on the reliability benchmarking and dynamic performance evaluation platform developed by microservice architecture, the evaluation core and graphical interaction platform are divided into two independent processes.
25
In this way, the reasonable allocation of CPU computing resources can be realized to a certain extent, thereby overcoming the problem of insufficient performance under a single architecture. However, microservices architecture is not without its drawbacks. Because the evaluation core and graphical interaction platform are distributed in different processes, this greatly increases the complexity of software development, especially when it comes to inter-process communication; it is necessary to realize an efficient data transmission mechanism to ensure stability and a real-time system. The development complexity formula is shown in (7).

Among them, C
dev
represents the development complexity, N
modules
represents the number of service modules in the microservice architecture, T
dev
represents the time required for the development of each module, and N
team
represents the number of development team members. The formula of system stability and real-time performance is shown in (8).

Among them, S system represents system stability and real-time, T avg represents the average response time of the system, and T max represents the maximum response time of the system.
In order to reduce the subjectivity in the process of weight determination, this study combined the analytic hierarchy process (AHP) and the entropy weight method. AHP builds a hierarchical model to decompose complex problems into multiple levels and factors, and experts compare and score each factor in pairs, establish a judgment matrix, and then calculate the weights to reflect the expert’s experience and knowledge. The entropy weight law determines the weight according to the dispersion degree of the data itself, and the larger the dispersion degree of the data, the more information the indicator carries, and the higher the weight. The combination of the two not only considers subjective experience but also uses objective data to achieve the organic unity of subjectivity and objectivity, so that the weight is more scientific and reasonable. In the process of expert scoring, a number of experts in the field of the organization scored the importance of each evaluation index of the Linux system, processed the scoring data through statistical analysis, and provided initial weight information for AHP.
As is shown in Figure 2, taking the evaluation of the performance of a Linux system at a certain point in time, let the evaluation index set U = {load, I/O, network transmission}, and the evaluation set V = {Good, Good, Medium, Poor}. If 5 experts are invited to evaluate the system load, 3 people think “good” and 2 people think “medium,” then the membership degree of the load to “good” is 3÷5 = 0.6, and the membership degree of “medium” is 2÷5 = 0.4, and so on to obtain the membership degree of other indicators to each comment, and construct a fuzzy evaluation matrix R. It is assumed that the weight vectors of load, I/O, and network transmissions are determined by AHP and entropy weight methods A = {0.3,0.4,0.3}, via matrix operation B = A∘R (“∘” is the fuzzy synthesis operator), the comprehensive evaluation vector B is obtained, and then the numerical value in B is converted into a specific score according to a certain rule, and the score aggregation is realized, and the comprehensive evaluation result of system performance is obtained. Key elements and processes of the fuzzy comprehensive evaluation of the Linux system.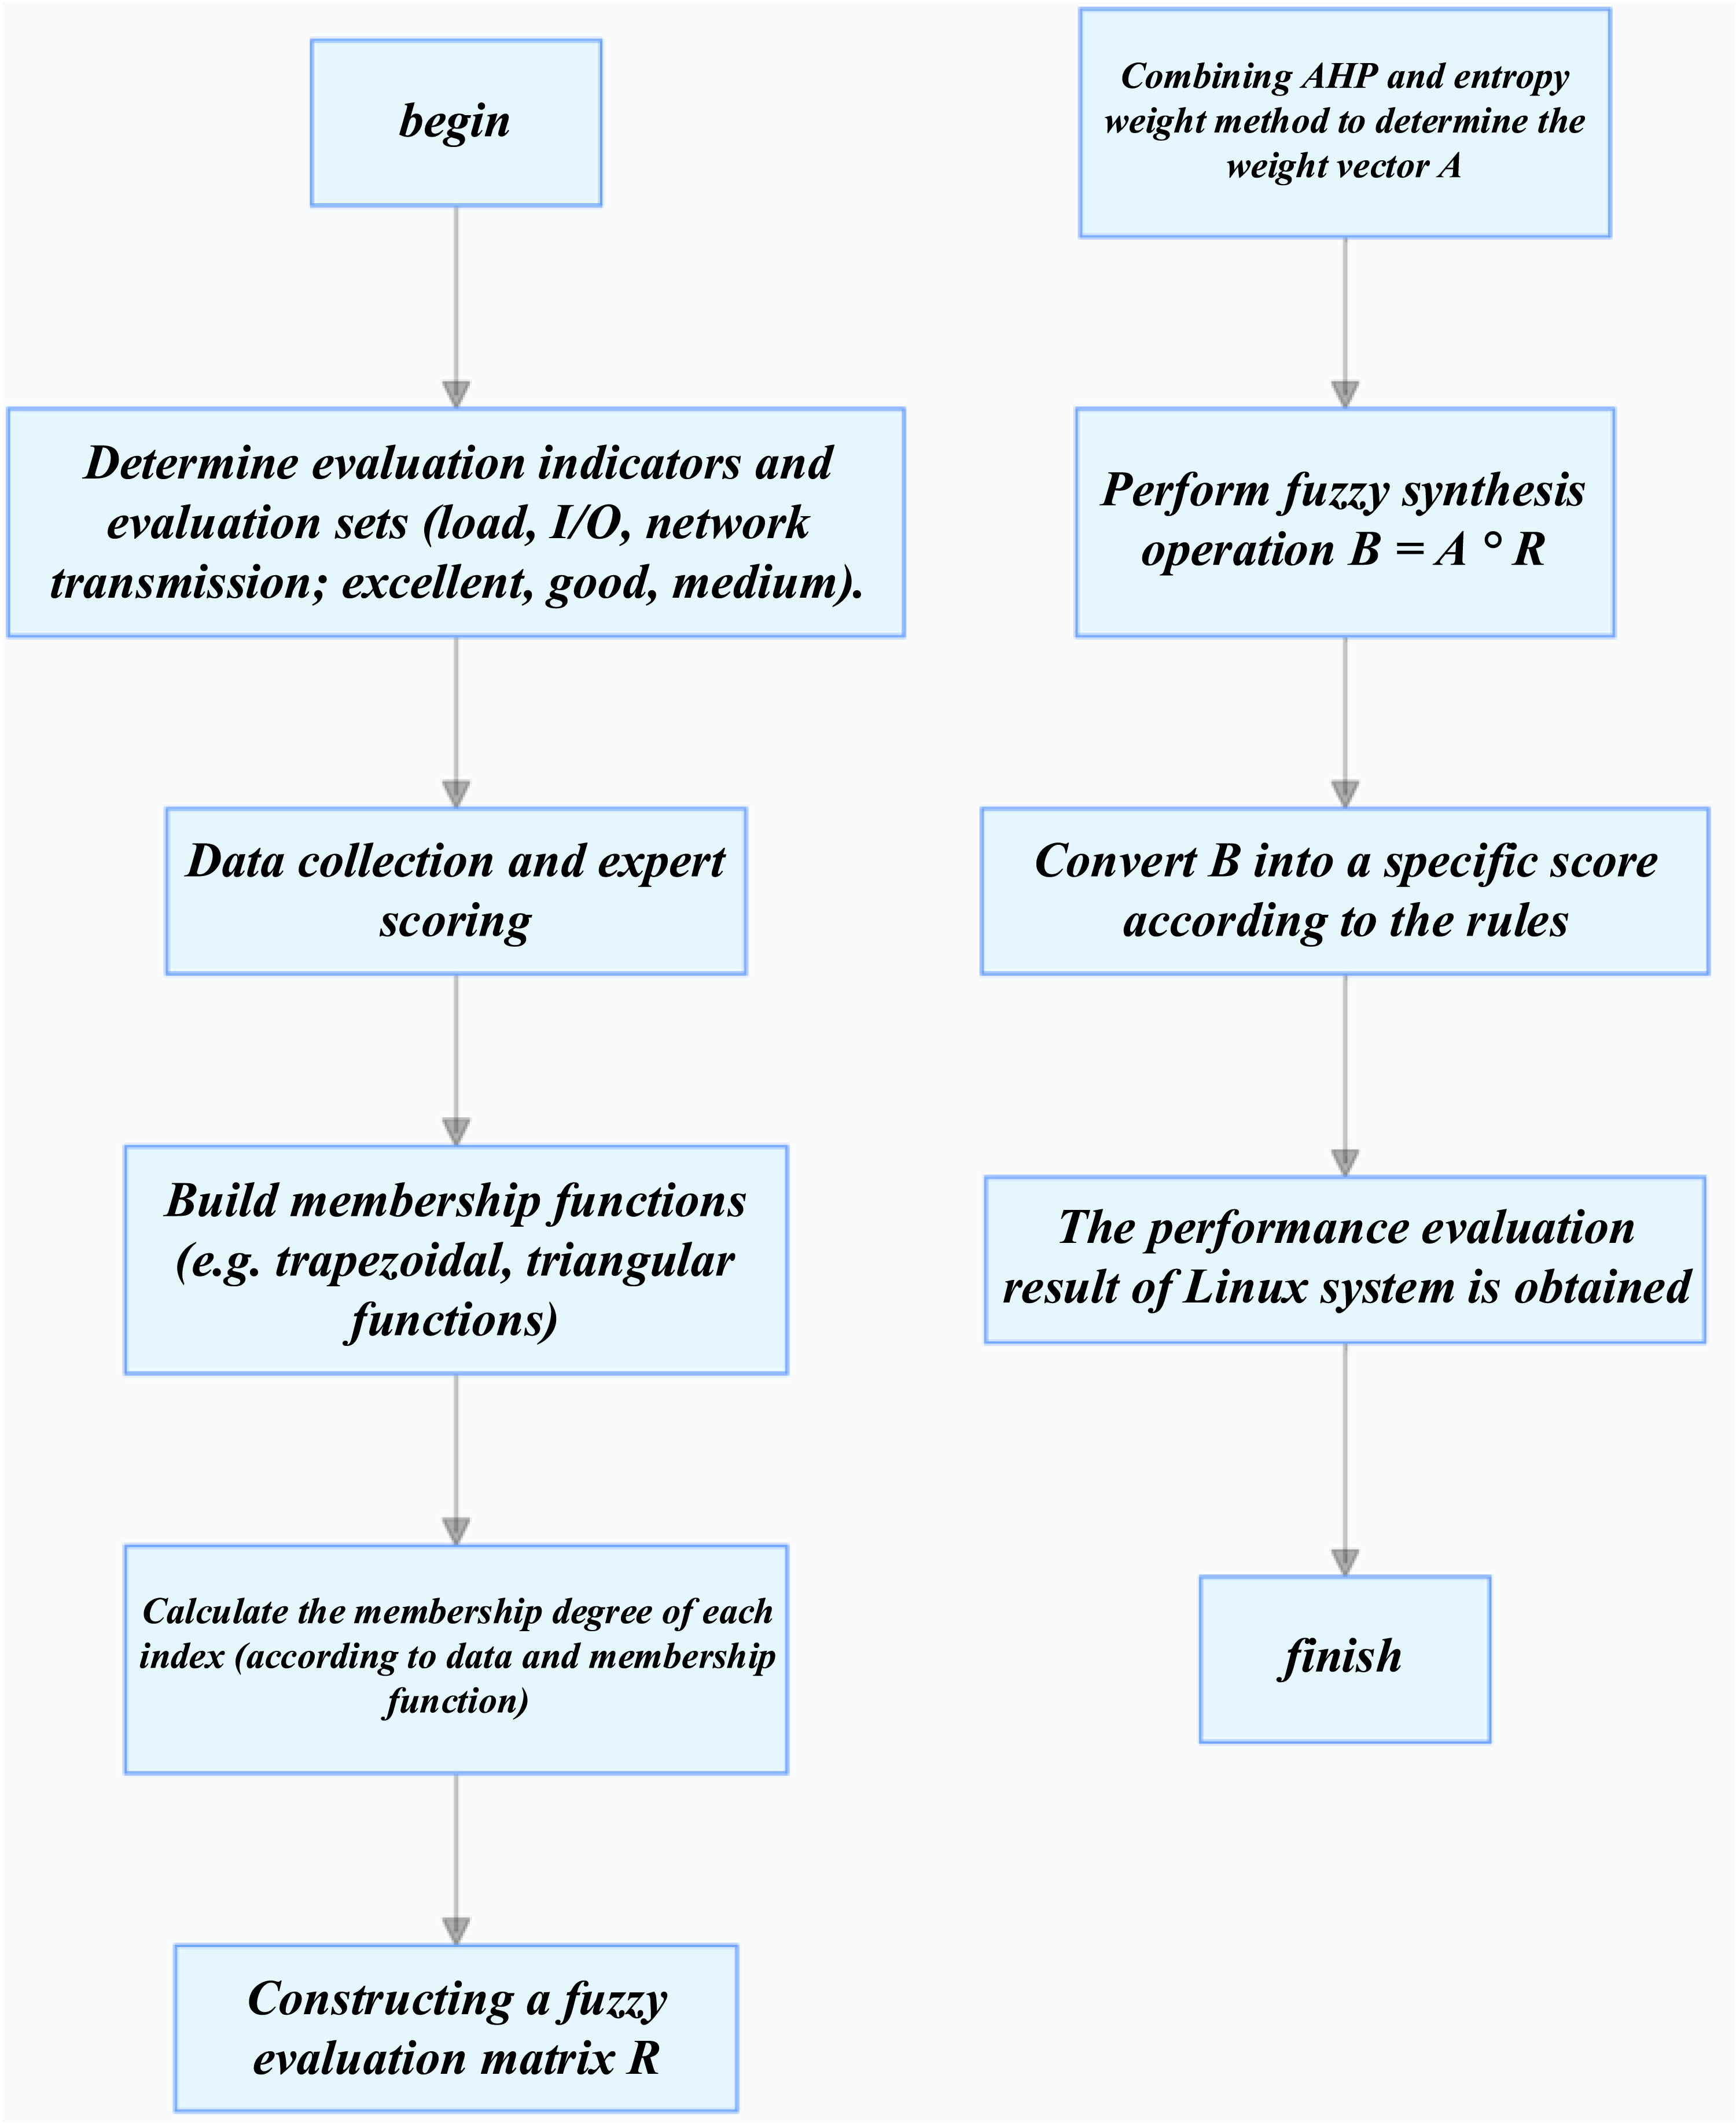
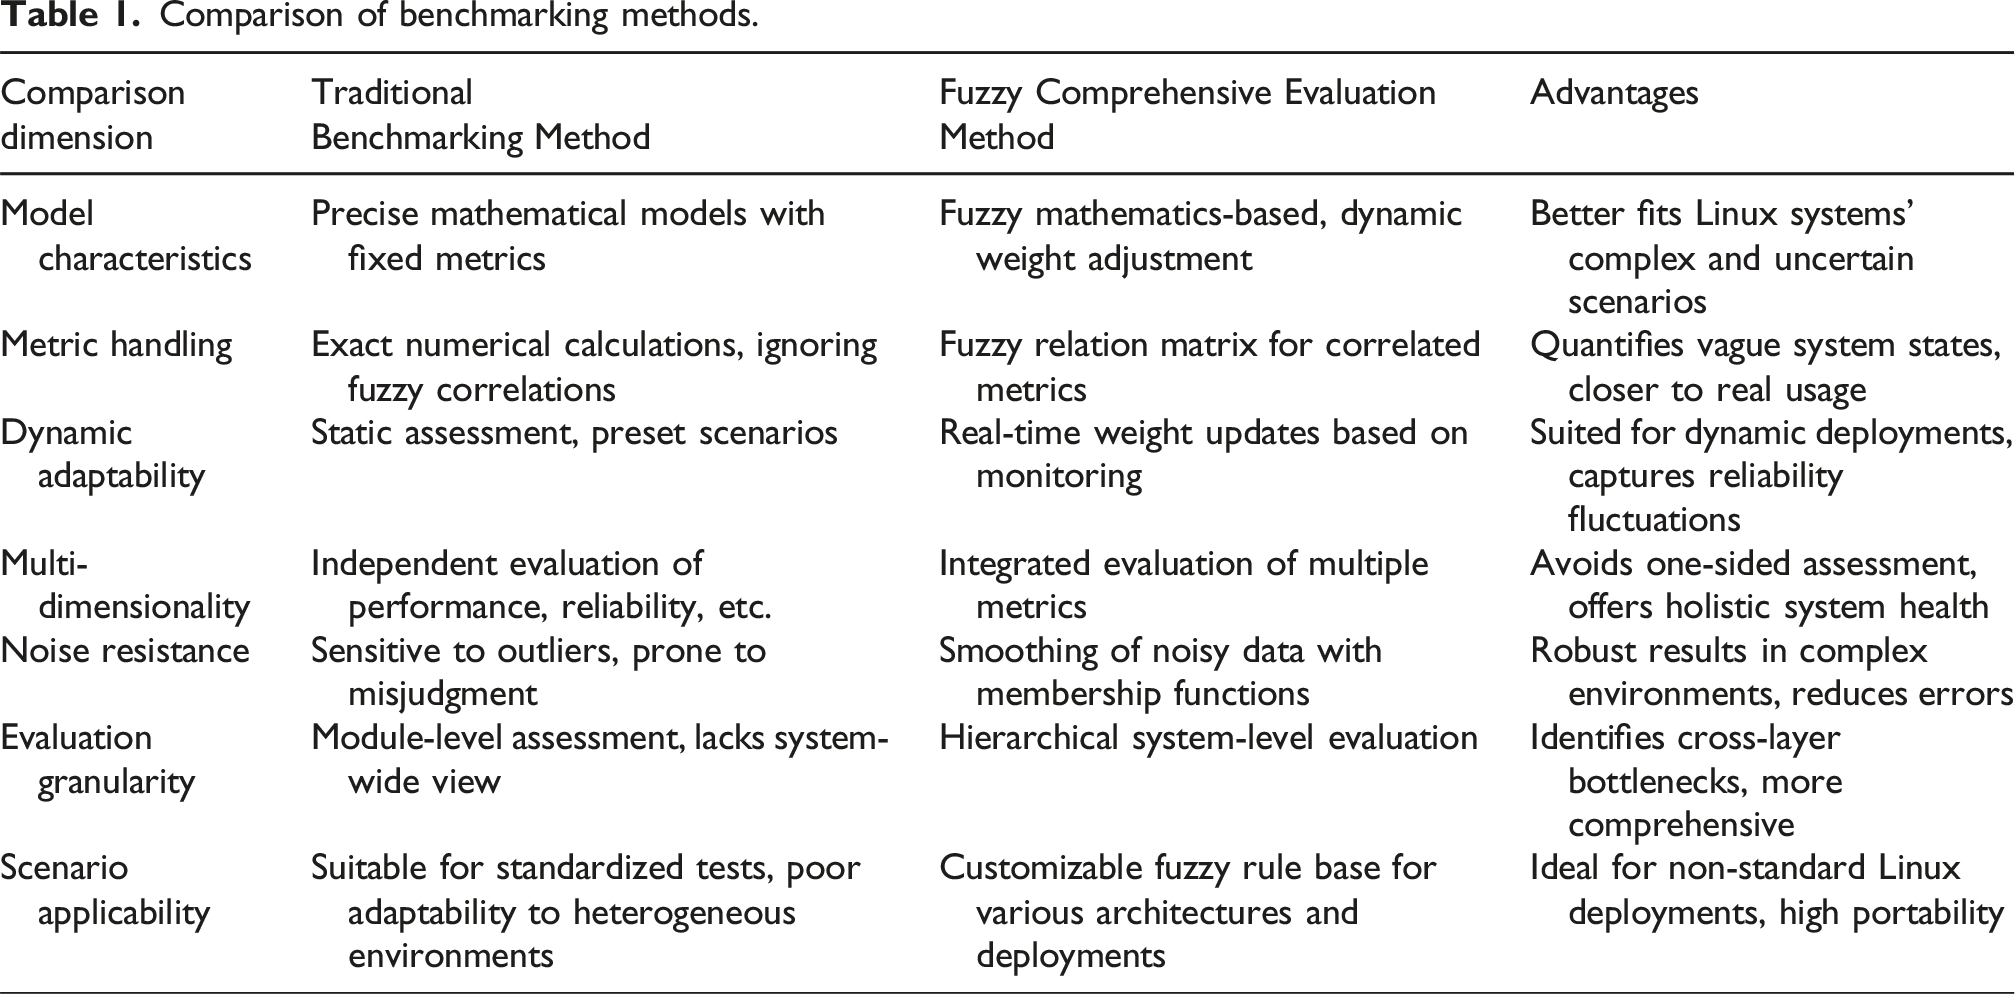
Comparison of benchmarking methods.
Implementation of Linux operation mechanism in dynamic performance evaluation modeling
This paper’s evaluation core is developed based on the Fortran programming language. Therefore, to ensure the consistency of the whole system, the interaction kernel of the graphical interaction platform also needs to be designed in the Fortran language. However, it is mentioned in the requirements analysis in Chapter 3 that the dynamic performance evaluation platform is designed based on microservice architecture, which means that the evaluation core and the graphical interaction platform are two independent processes.
26
To complete the information interaction between them, it must rely on the process communication mechanism in the Linux kernel. However, since the Linux kernel is mostly written in C and C + + languages, it does not directly provide an interface for Fortran to communicate with processes. In this case, it is impossible to interact directly using the process communication mechanism of the Linux kernel through the Fortran language. The system failure rate formula is shown in (9).


Among them, E
load
represents the dynamic library loading efficiency, T
dynamic load
represents the time required for dynamic library loading, and T
total
represents the overall running time. Figure 3 shows the whole dynamic library loading process into the evaluation core. As can be seen from the figure, the process of applying the dynamic library to the evaluation core is divided into three steps: First, the dynamic library is generated by a program written in C++, and the methods implemented by the C++ program will be called in the interactive kernel.28,29 The program mainly implements the process communication mechanism of Linux kernel, thread management, and other functions and writes the interface to ensure Fortran can smoothly call the functions in C++ and correctly pass the variables in the cross-programming language environment. Secondly, the evaluation core code is preprocessing, compiling, and assembling. This process will process the calculation code and interaction code of the evaluation core and finally convert the code into an assembly file through the assembly. Finally, the generated target dynamic library is loaded into the assembly file generated by the evaluation core through 1oader and open.30,31 Finally, after processing by the compiler linker, the assembly file generated by the kernel code is combined with the dynamic library to generate an executable program that can run under a Linux system.
32
Core process of dynamic library loading evaluation.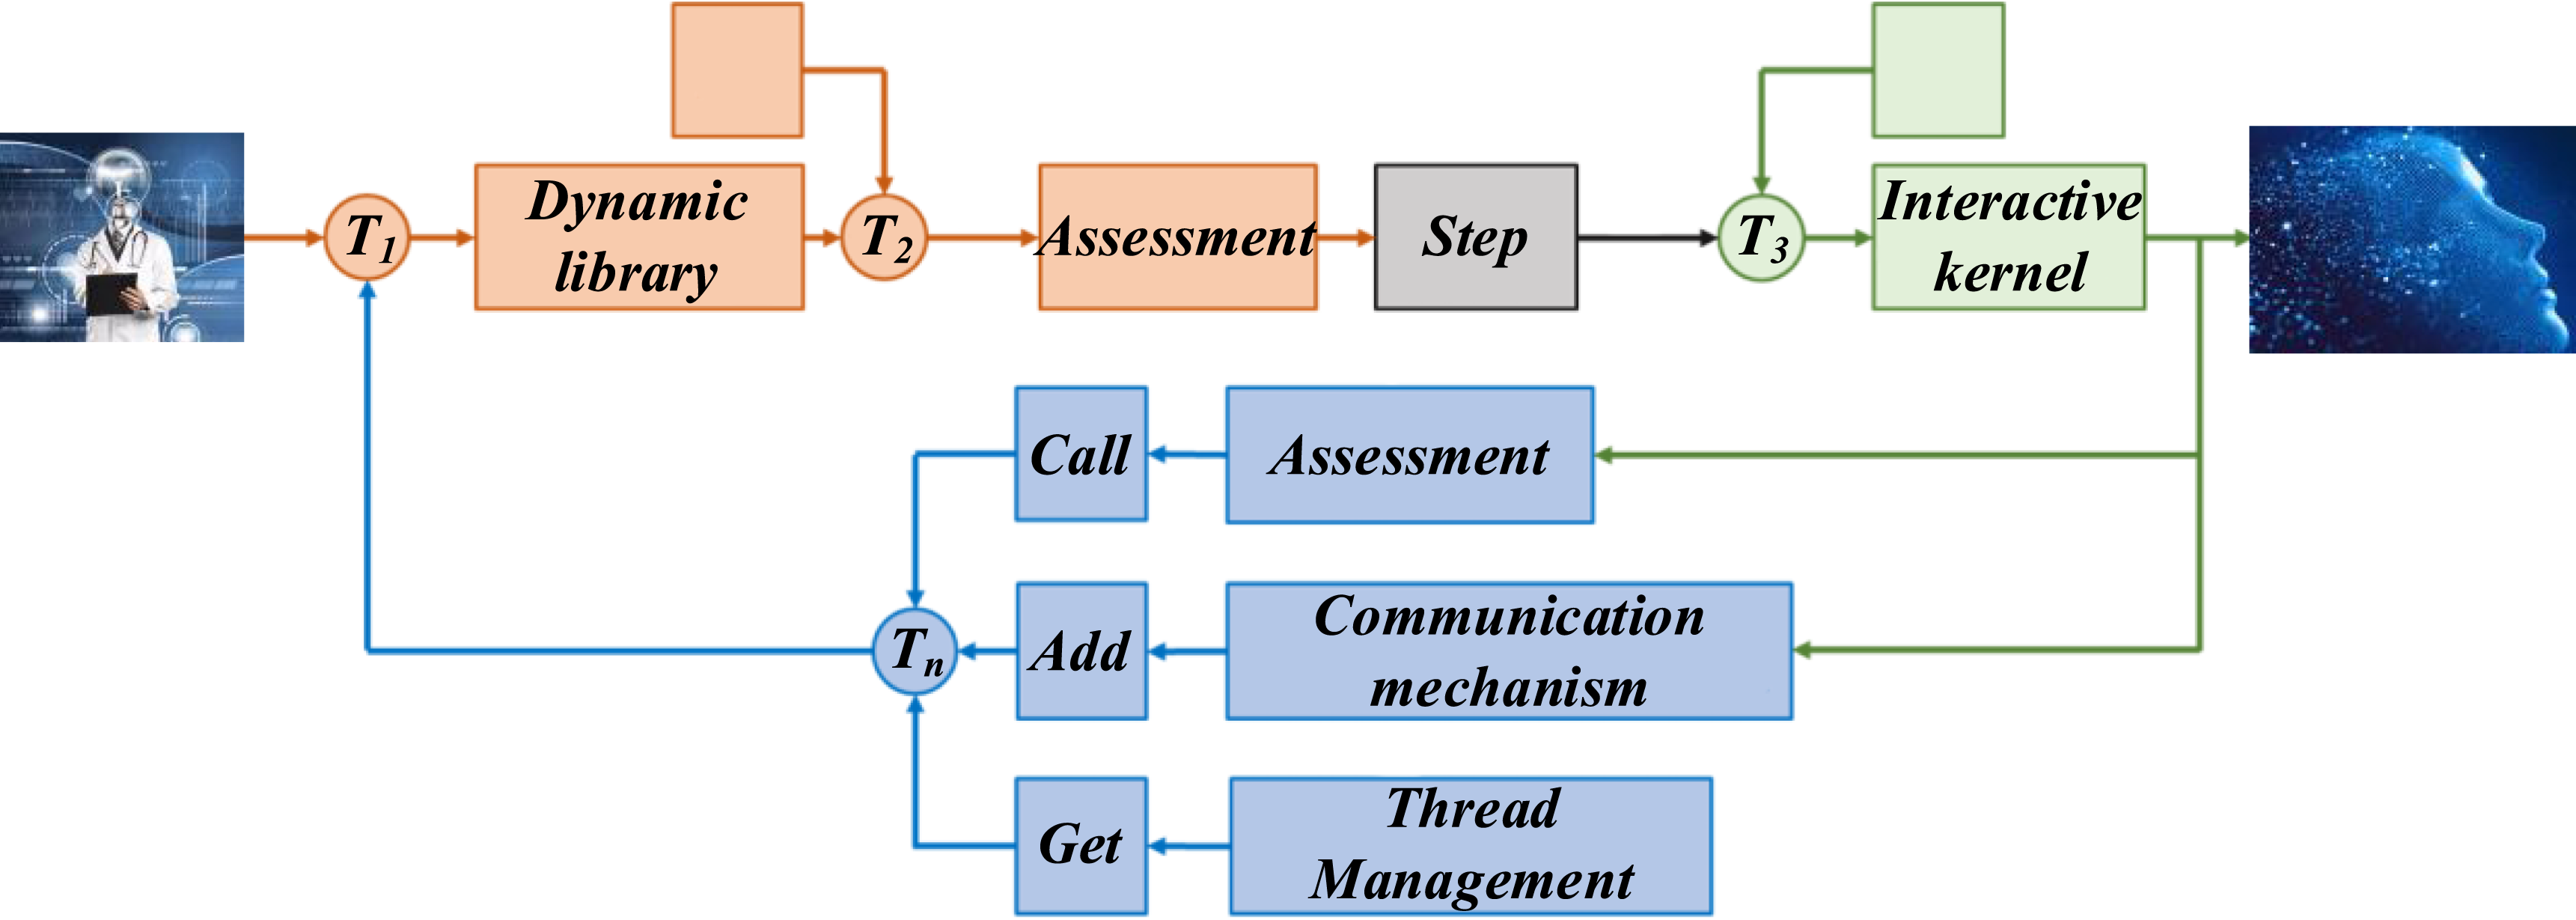
Experimental results and analysis
In this study, Ubuntu 20.04 LTS and CentOS 8 Stream were selected as the core research objects, and 50 sets of performance data samples were collected for each version to ensure that the results were statistically significant. The experiment is based on the Dell PowerEdge R740 server to build a hardware environment, configured with Intel Xeon Gold 6148 processor (2.4 GHz frequency, 20 cores), 128 GB DDR4 memory, and four 1.2 TB 10K RPM SAS hard drives to form an RAID 10 array to ensure the stability and performance of the system. Data collection uses TOP to monitor system resource occupation in real time, IOTOP to track process I/O usage, IPERF to test network transmission performance, and multiple tools to collaborate to obtain comprehensive performance data.
When determining the performance bottleneck, the disk I/O wait time exceeds 50 ms, the IOPS reaches the theoretical maximum value of the hardware, the request queue is backlogged, the CPU usage exceeds 90%, a large amount of I/O interrupt processing is consumed, and the throughput decreases with the increase of concurrency. The experimental results show that when the number of concurrent requests reaches 4000, the disk I/O waiting time exceeds 60 ms, the IOPS is saturated, the throughput drops sharply, and the CPU usage climbs to 92%, exposing a significant performance bottleneck. With 5000 concurrent requests, CentOS 8 Stream has a disk I/O latency of only 35 ms, stable IOPS and throughput, and a CPU usage of around 78%. After analysis, the Ubuntu file system caching strategy is inefficient under high concurrency, while CentOS 8 Stream has better performance due to its optimized I/O scheduling and cache management mechanism, which proves that it is more reliable in high concurrency I/O scenarios.
The evaluation period is set as two consecutive weekdays (Monday to Friday), covering different load scenarios such as morning peak (9:00–11:00), noon (13:00–15:00), and evening peak (17:00–19:00). In terms of load conditions, the peak concurrency is set to 5000 concurrent requests to simulate high-traffic access scenarios. CPU usage is maintained at 30%–50% under normal load and increased to 80%–95% during high load periods, providing a comprehensive view of the performance of Ubuntu and CentOs systems under different stresses.
The study sets a baseline threshold for system reliability of 75%, above which it is considered reliable, and below which it indicates that the system has performance concerns. The reliability score is obtained through the fuzzy comprehensive evaluation method, which comprehensively considers multiple dimensions such as system stability, response speed, and resource utilization. The Ubuntu system achieves a reliability score of 82.5% under high load, which is significantly higher than the benchmark threshold, indicating that it can still maintain good operation in high concurrency and high CPU usage scenarios, and has strong reliability and performance resilience. In order to ensure the consistency and credibility of the results, the standard deviation was used to measure the degree of data dispersion, and the stability of the results was verified by 95% confidence intervals, and the standard deviations of each index were less than 10% after statistical analysis, and the confidence interval covered the core value range of the reliability score, which effectively verified the reliability of the experimental results.
Reliability scores of different Linux versions.
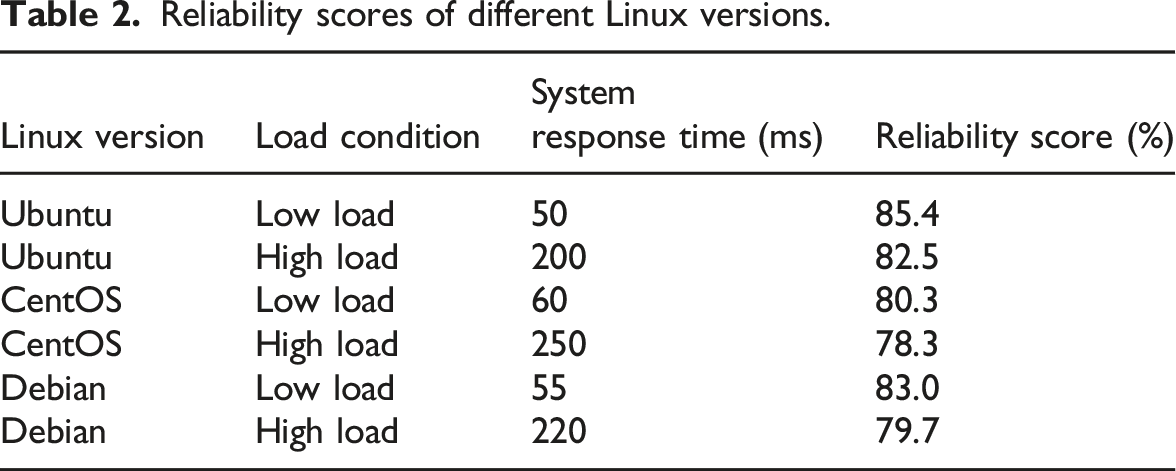
According to the experimental results, the Ubuntu system performs best at low load with a reliability score of 85.4%. In contrast, at high load, the response time is extended to 200, and the reliability score decreases to 82.5%. The performance of CentOS and Debian systems is relatively low, especially under high load conditions. CentOS has a response time of 250 ms and the lowest reliability score of only 78.3%. Debian’s performance is relatively balanced, with a response time of 220 ms at high loads and a reliability score of 79.7%. Overall, the Ubuntu system performs stably under light load, but the performance decreases with the increase in load.
To compare the response time (ms) of different Linux versions under low load conditions and evaluate the performance of each system under conventional use, this paper compares the response time of different Linux versions under low load conditions, and the results are shown in Figure 4. Comparison of response time of different Linux versions under low load.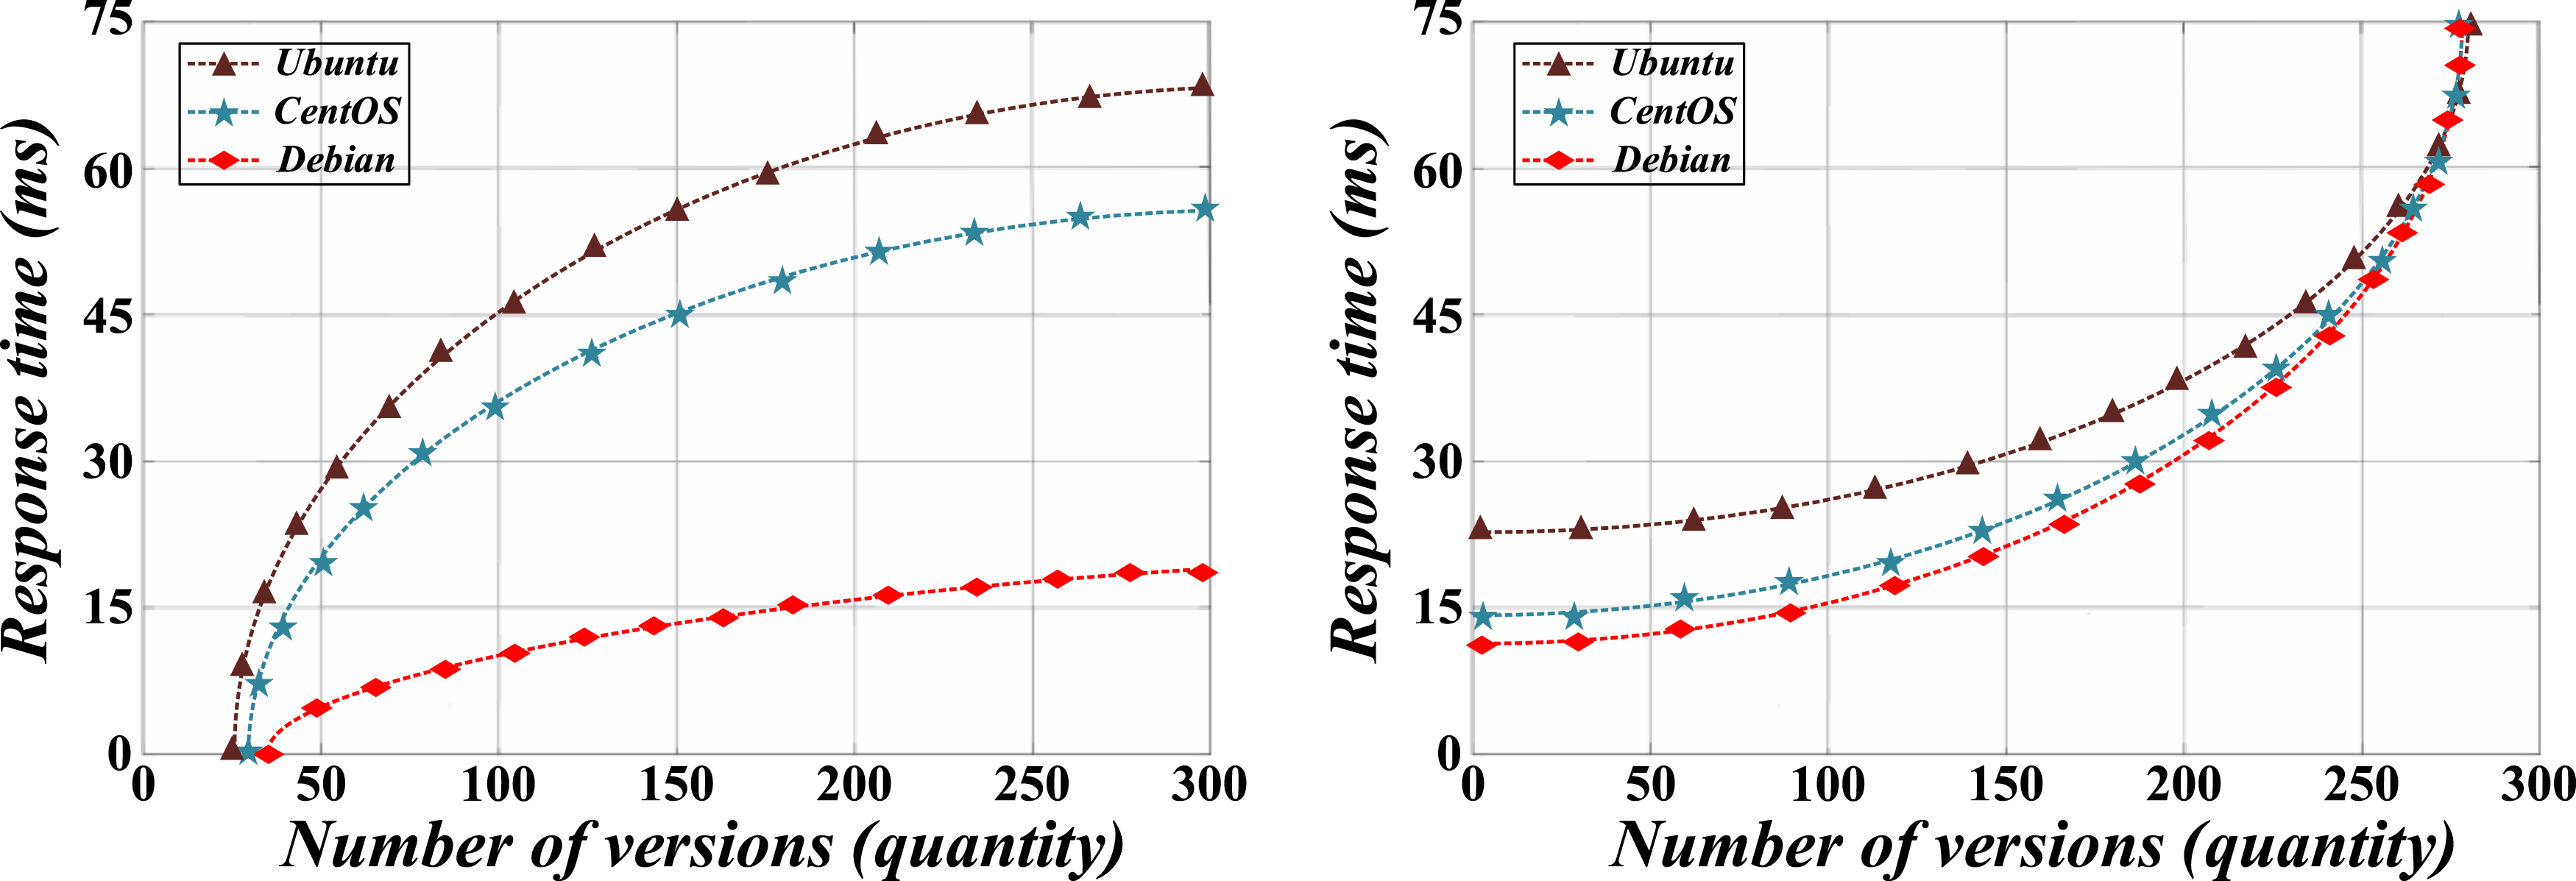
The experimental results show that the response time of the Ubuntu system under low load conditions is 50 ms, which is better than CentOS (60 ms) and Debian (55 ms). This result shows that Ubuntu shows high efficiency in the basic operation of the system and is suitable for basic daily application scenarios. CentOS has a relatively long response time, possibly due to inadequate kernel scheduling and resource management optimization. Debian is slightly inferior to Ubuntu, but it is still efficient. On the whole, Ubuntu has the best responsiveness under low load.
To compare the response time of different Linux versions under high load and evaluate the system’s processing power under high-pressure environment, this paper compares the response time of different Linux versions under high load, and the results are shown in Figure 5. Comparison of response time of different Linux versions under high load.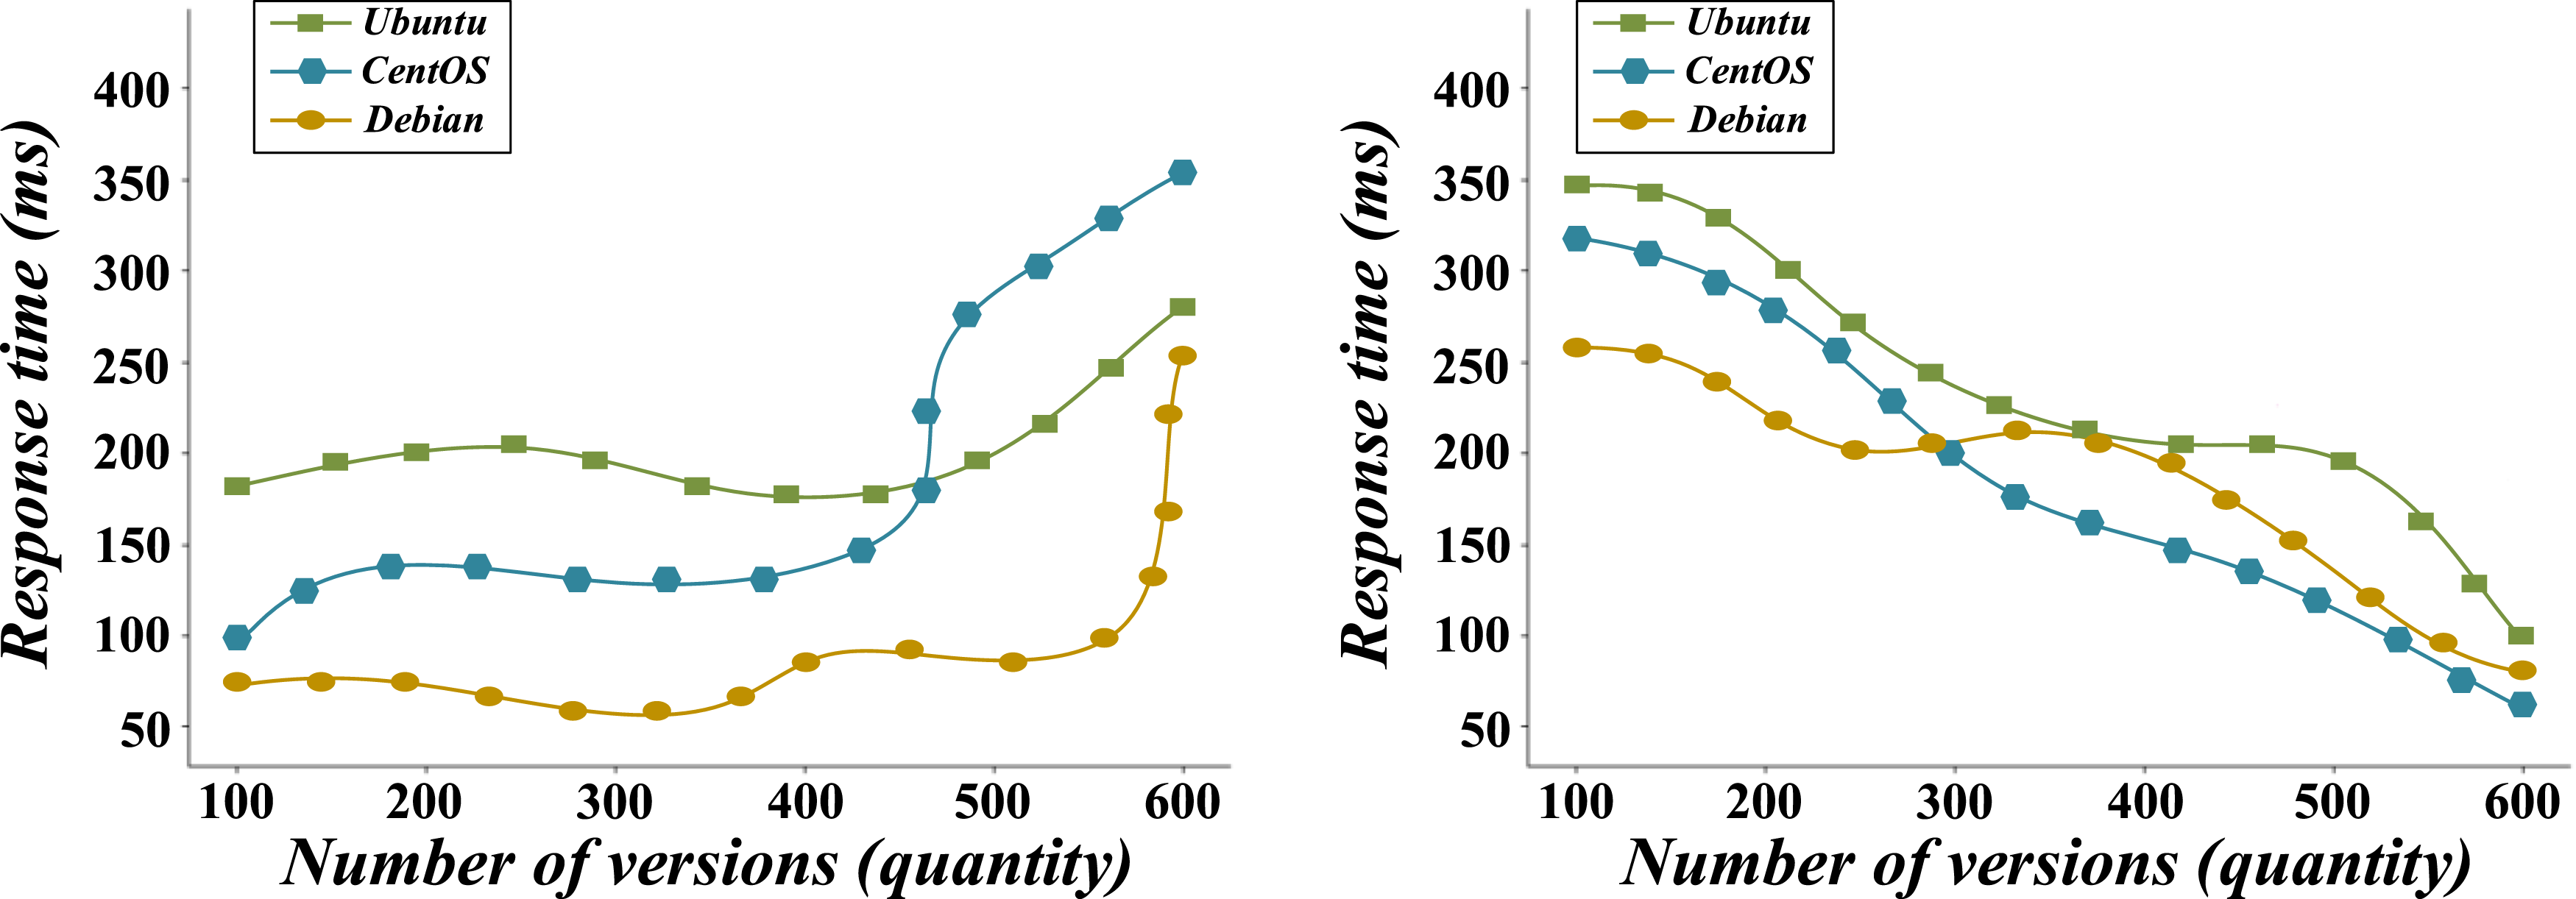
The figure shows that Ubuntu’s response time under high load is 200 ms, and under lower load, 50 ms has increased significantly, but compared with CentOS (250 ms) and Debian (220 ms), Ubuntu still performs better. The response time of CentOS under high load is 250 ms, which is significantly higher than other systems, indicating that there is a bottleneck in its resource scheduling under high concurrency. Debian’s response time of 220 ms is slightly better than CentOS but still not as good as Ubuntu. This shows that Ubuntu’s responsiveness in a high load environment is relatively more stable, while CentOS’s performance in dealing with large-scale concurrent tasks is weak.
To show the CPU utilization of different Linux versions under different CPU load conditions and help analyze the resource allocation efficiency of the system under high load conditions, especially the usage of CPU resources, this paper compares the CPU utilization of different Linux versions with the load, and the results are shown in Figure 6. Comparison of CPU utilization and load of different Linux versions.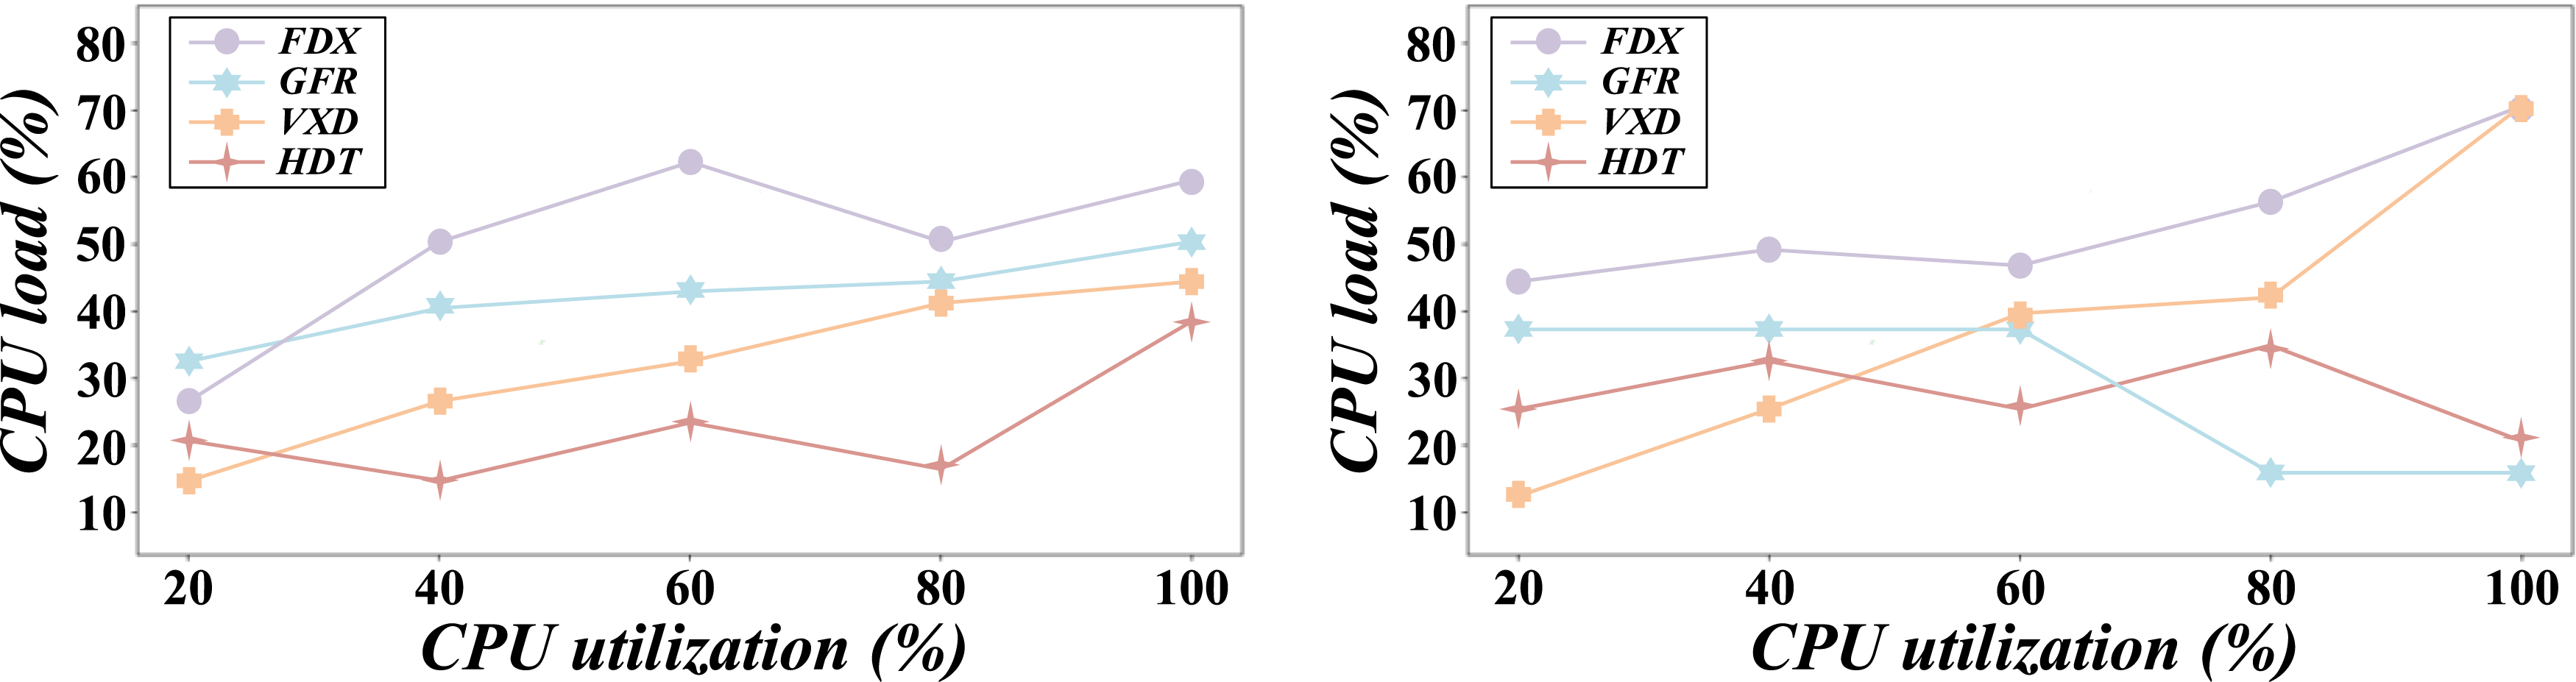
The figure shows that when the load reaches 50%, Ubuntu’s CPU utilization is 60%, CentOS’s is 65%, and Debian’s is 62%. As the load increases to 100%, CPU utilization increases to 95% for Ubuntu, 90% for CentOS, and 92% for Debian. Overall, Ubuntu’s CPU utilization under 100% load is slightly higher than that of CentOS and Debian, showing that its resource management is more efficient and can fully use CPU resources. However, CentOS and Debian also show relatively efficient CPU utilization, especially under high load conditions, where resource scheduling is reasonable. Comprehensive analysis shows that Ubuntu has a slight advantage in resource management and is suitable for applications in high-load and large concurrency environments.
Performance comparison of Linux system under different IO operations.

To evaluate the memory usage of different Linux versions under various loads, this paper compares the memory usage of different Linux versions with the load, and the results are shown in Figure 7. Comparison of memory footprint and load of different Linux versions.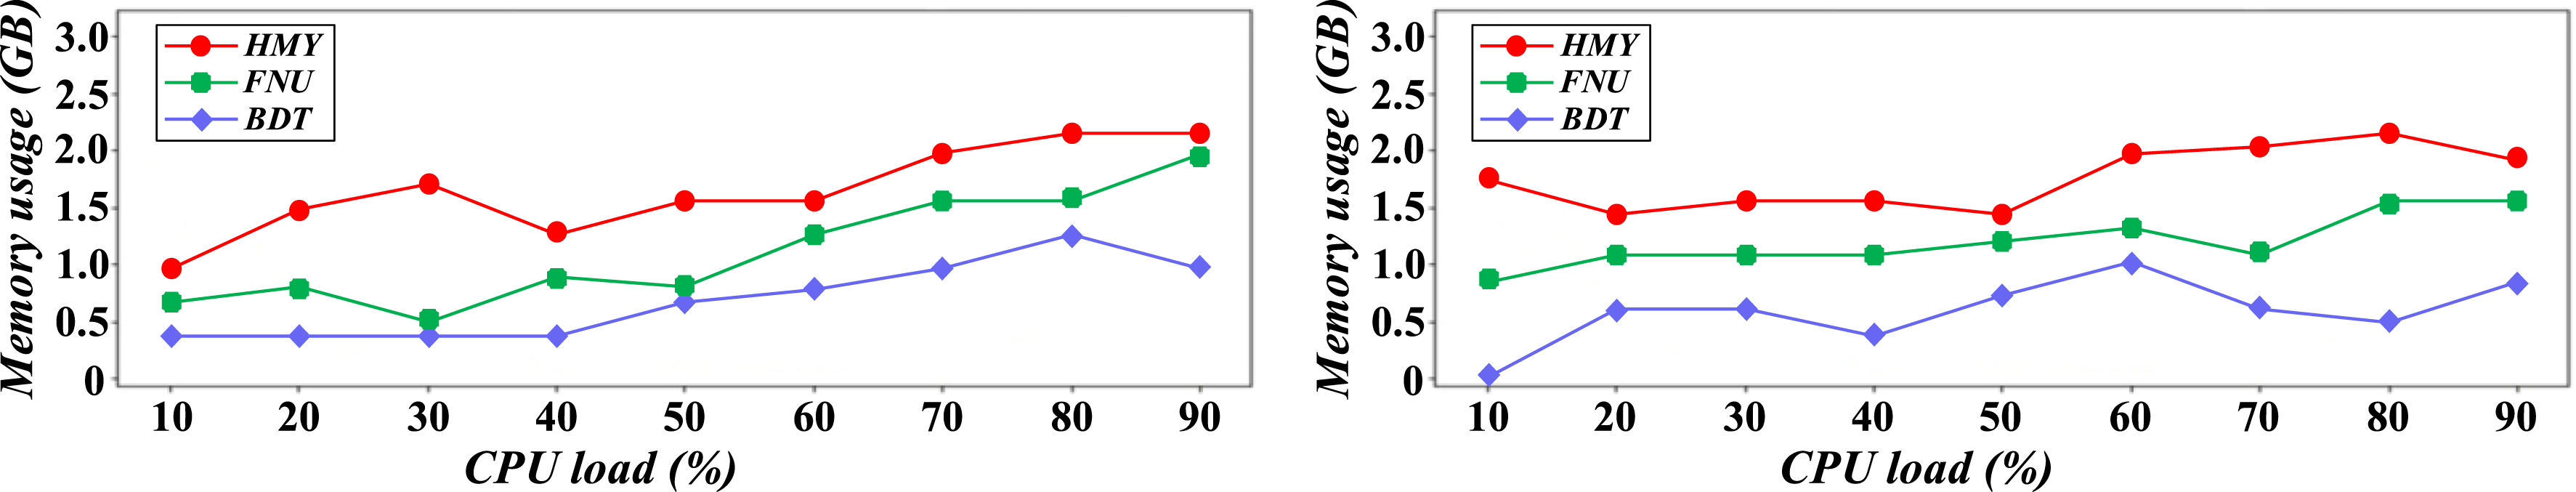
As can be seen from the figure, at low load, the memory footprint of Ubuntu is 2.0 GB, CentOS is 2.2 GB, and Debian is 2.1 GB, showing the advantages of Ubuntu in memory management. As the load increased to 100%, the memory footprint increased to 4.5 GB for Ubuntu, 5.0 GB for CentOS, and 4.8 GB for Debian. CentOS has the highest memory usage under high load, which may be related to the resource consumption of its memory management strategy. Debian’s memory footprint is closer to Ubuntu’s but slightly higher, which may indicate that its memory optimization is not as efficient as Ubuntu’s. Overall, Ubuntu’s memory utilization is relatively low, which is suitable for memory-constrained environments, while CentOS is slightly insufficient regarding memory requirements.
To compare the disk IO performance of different Linux versions in sequential read and write operations and evaluate the system’s efficiency in processing large files, this paper compares the disk sequential IO performance of different Linux versions, and the results are shown in Figure 8. Comparison of disk sequential IO performance of different Linux versions.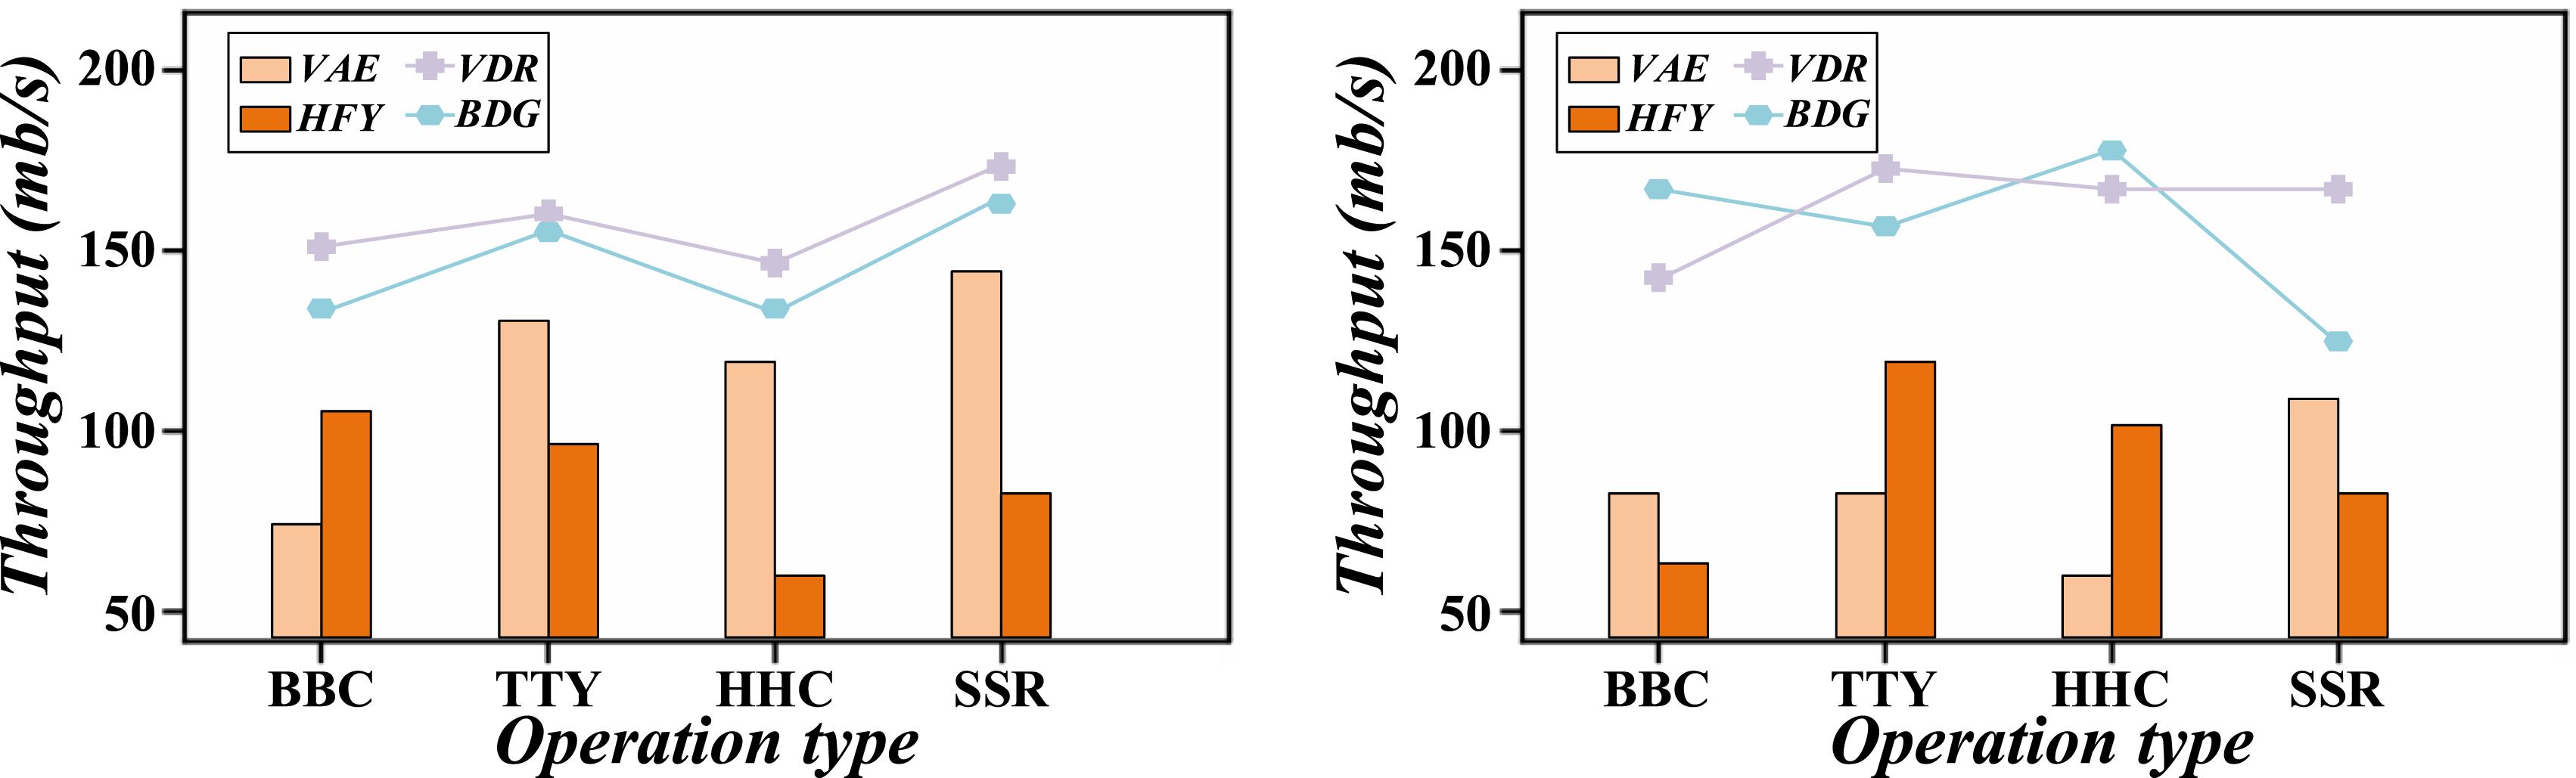
The experimental results show that Ubuntu’s throughput is 180 MB/s in sequential read operations, significantly better than CentOS (160 MB/s) and Debian (175 MB/s). In sequential writes, throughput is 170 MB/s for Ubuntu, 150 MB/s for CentOS, and 165 MB/s for Debian. Ubuntu excels in sequential read and write operations and is suitable for handling big data storage tasks such as database management and file servers. The relatively low throughput of CentOS may affect the efficiency of large-scale data processing. Debian’s performance is between Ubuntu and CentOS and is suitable for applications that require higher disk performance.
To compare the performance of different Linux versions under random IO operation and evaluate the ability of the system to deal with high concurrent access to small data blocks, this paper compares the random IO performance of different Linux versions, and the results are shown in Figure 9. Random IO performance comparison of different Linux versions.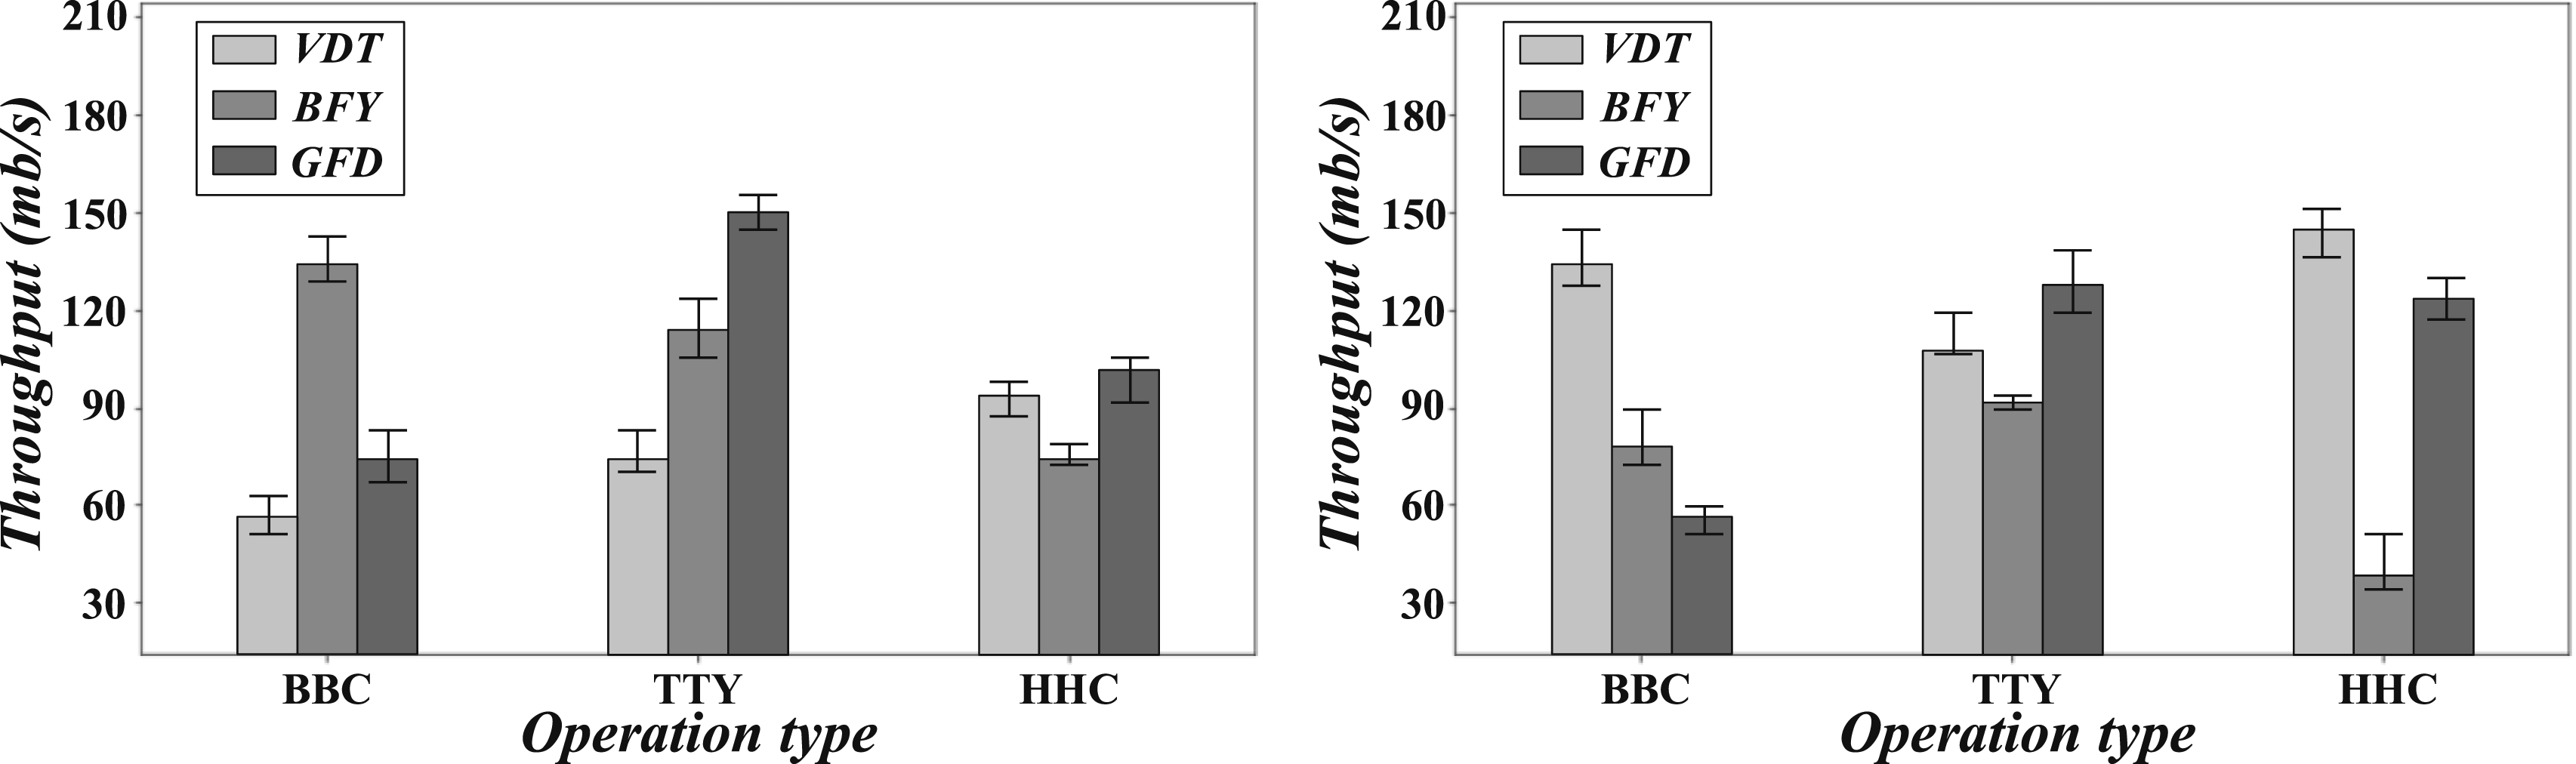
By comparing the experimental results in random read operations, Ubuntu’s throughput is 120 MB/s, significantly better than CentOS 105 MB/s and Debian 110 MB/s. In random write operations, throughput is 110 MB/s for Ubuntu, 95 MB/s for CentOS, and 100 MB/s for Debian. Ubuntu is superior in random reading and writing, which indicates that it performs better in high concurrency small data block access scenarios. The poor performance of CentOS may affect some tasks that require frequent access to small data blocks, such as random queries and database updates. Debian performs between Ubuntu and CentOS, providing sufficient performance in most application scenarios.
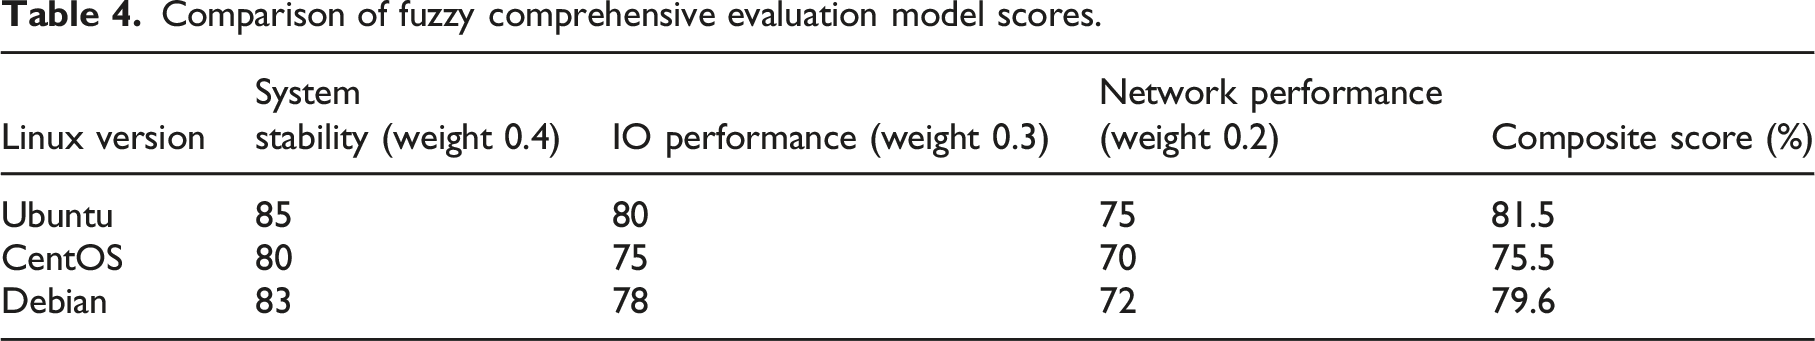
Comparison of fuzzy comprehensive evaluation model scores.
To compare the throughput of different Linux versions under high concurrent connections and mainly test their network performance under large-scale concurrent user requests, this paper compares the high concurrent throughput of different Linux versions, and the results are shown in Figure 10. Comparison of high concurrency throughput of different Linux versions.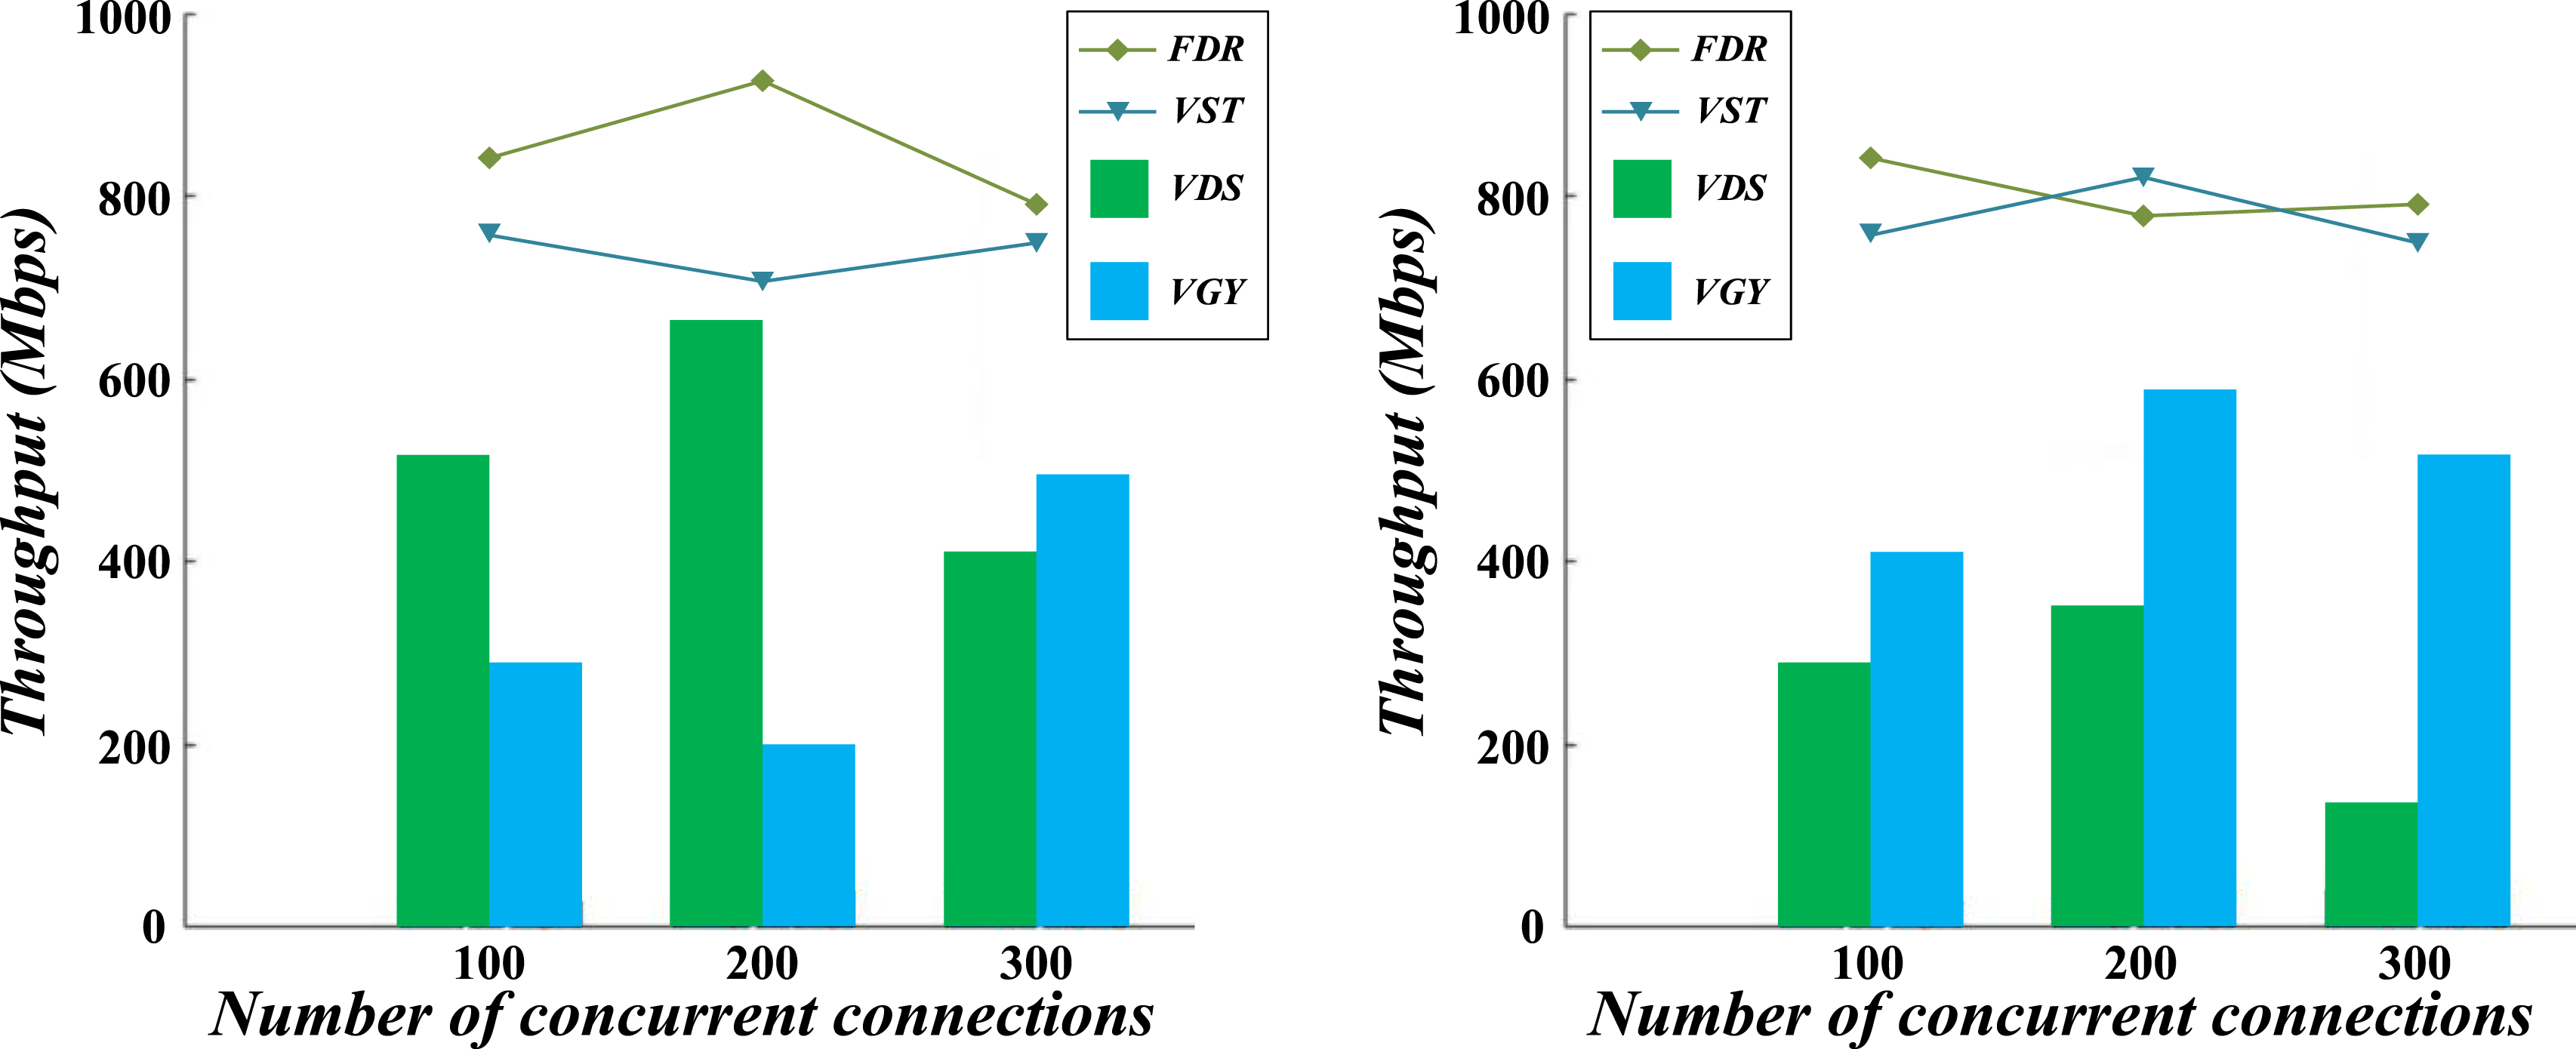
The data indicates that at 50 concurrent connections, throughput is 800 Mbps for Ubuntu, 750 Mbps for CentOS, and 720 Mbps for Debian. At 100 concurrent connections, throughput improves to 900 Mbps for Ubuntu, 850 Mbps for CentOS, and 820 Mbps for Debian. While at 200 simultaneous connections, Ubuntu’s throughput is 950 Mbps, CentOS’s 900 Mbps, and Debian’s 870 Mbps. The results show that Ubuntu’s throughput consistently outperforms CentOS and Debian in high-concurrency situations, indicating that it can handle large-scale concurrent connections more effectively and is suitable for network applications that require high throughput. CentOS and Debian perform closely but are slightly inferior to Ubuntu, suggesting that further optimization may be needed in high-concurrency scenarios.
To show the comprehensive performance scores of different Linux versions based on the fuzzy comprehensive evaluation model, this paper compares the comprehensive performance scores of different Linux versions, and the results are shown in Figure 11. Comparison of comprehensive performance scores of different Linux versions.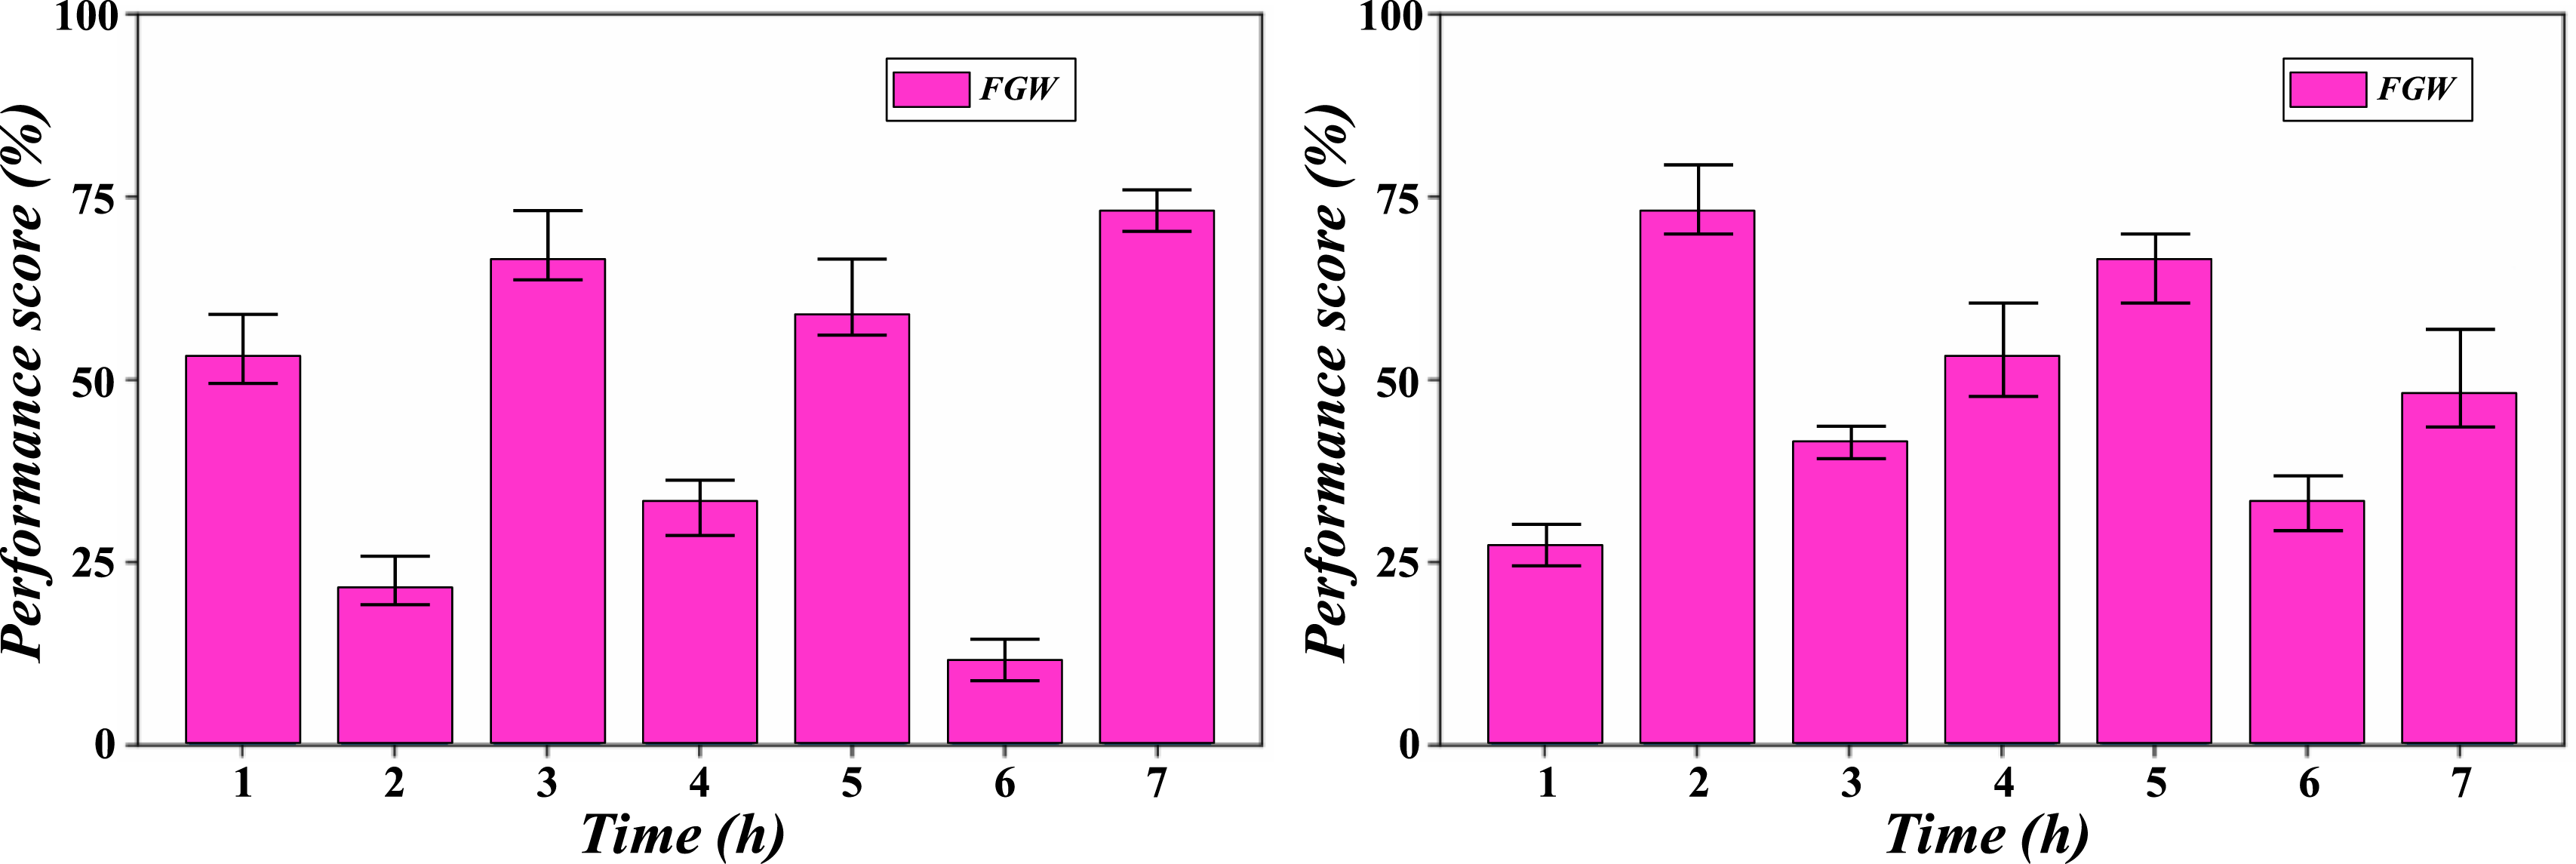
The fuzzy comprehensive evaluation shows Ubuntu’s comprehensive performance score is 85%, the most outstanding. CentOS has a relatively low score of 78%, especially poorly performing in high load and memory footprint. With a comprehensive score of 81%, Debian is balanced across multiple dimensions and suitable for moderately loaded environments. Ubuntu’s advantages make it the best-performing system, while CentOS and Debian can still provide relatively stable performance in specific scenarios.
Figure 12 shows the reliability benchmark results of Linux systems based on fuzzy comprehensive evaluation, presenting the score performance of each system in multiple groups of tests, which can intuitively compare the score differences between different Linux systems (or different configurations, versions, etc.) in reliability and dynamic performance evaluation, help analyze the performance advantages and disadvantages between systems, and provide multiple sets of sample reference dimensions for the performance comparison of Linux systems (such as Ubuntu and CentOS) in the study, combined with statistical methods such as standard deviation and confidence interval. It can further verify the consistency of the results and assist in judging the reliability and performance stability of the system under different loads and time periods. Compare system score plots.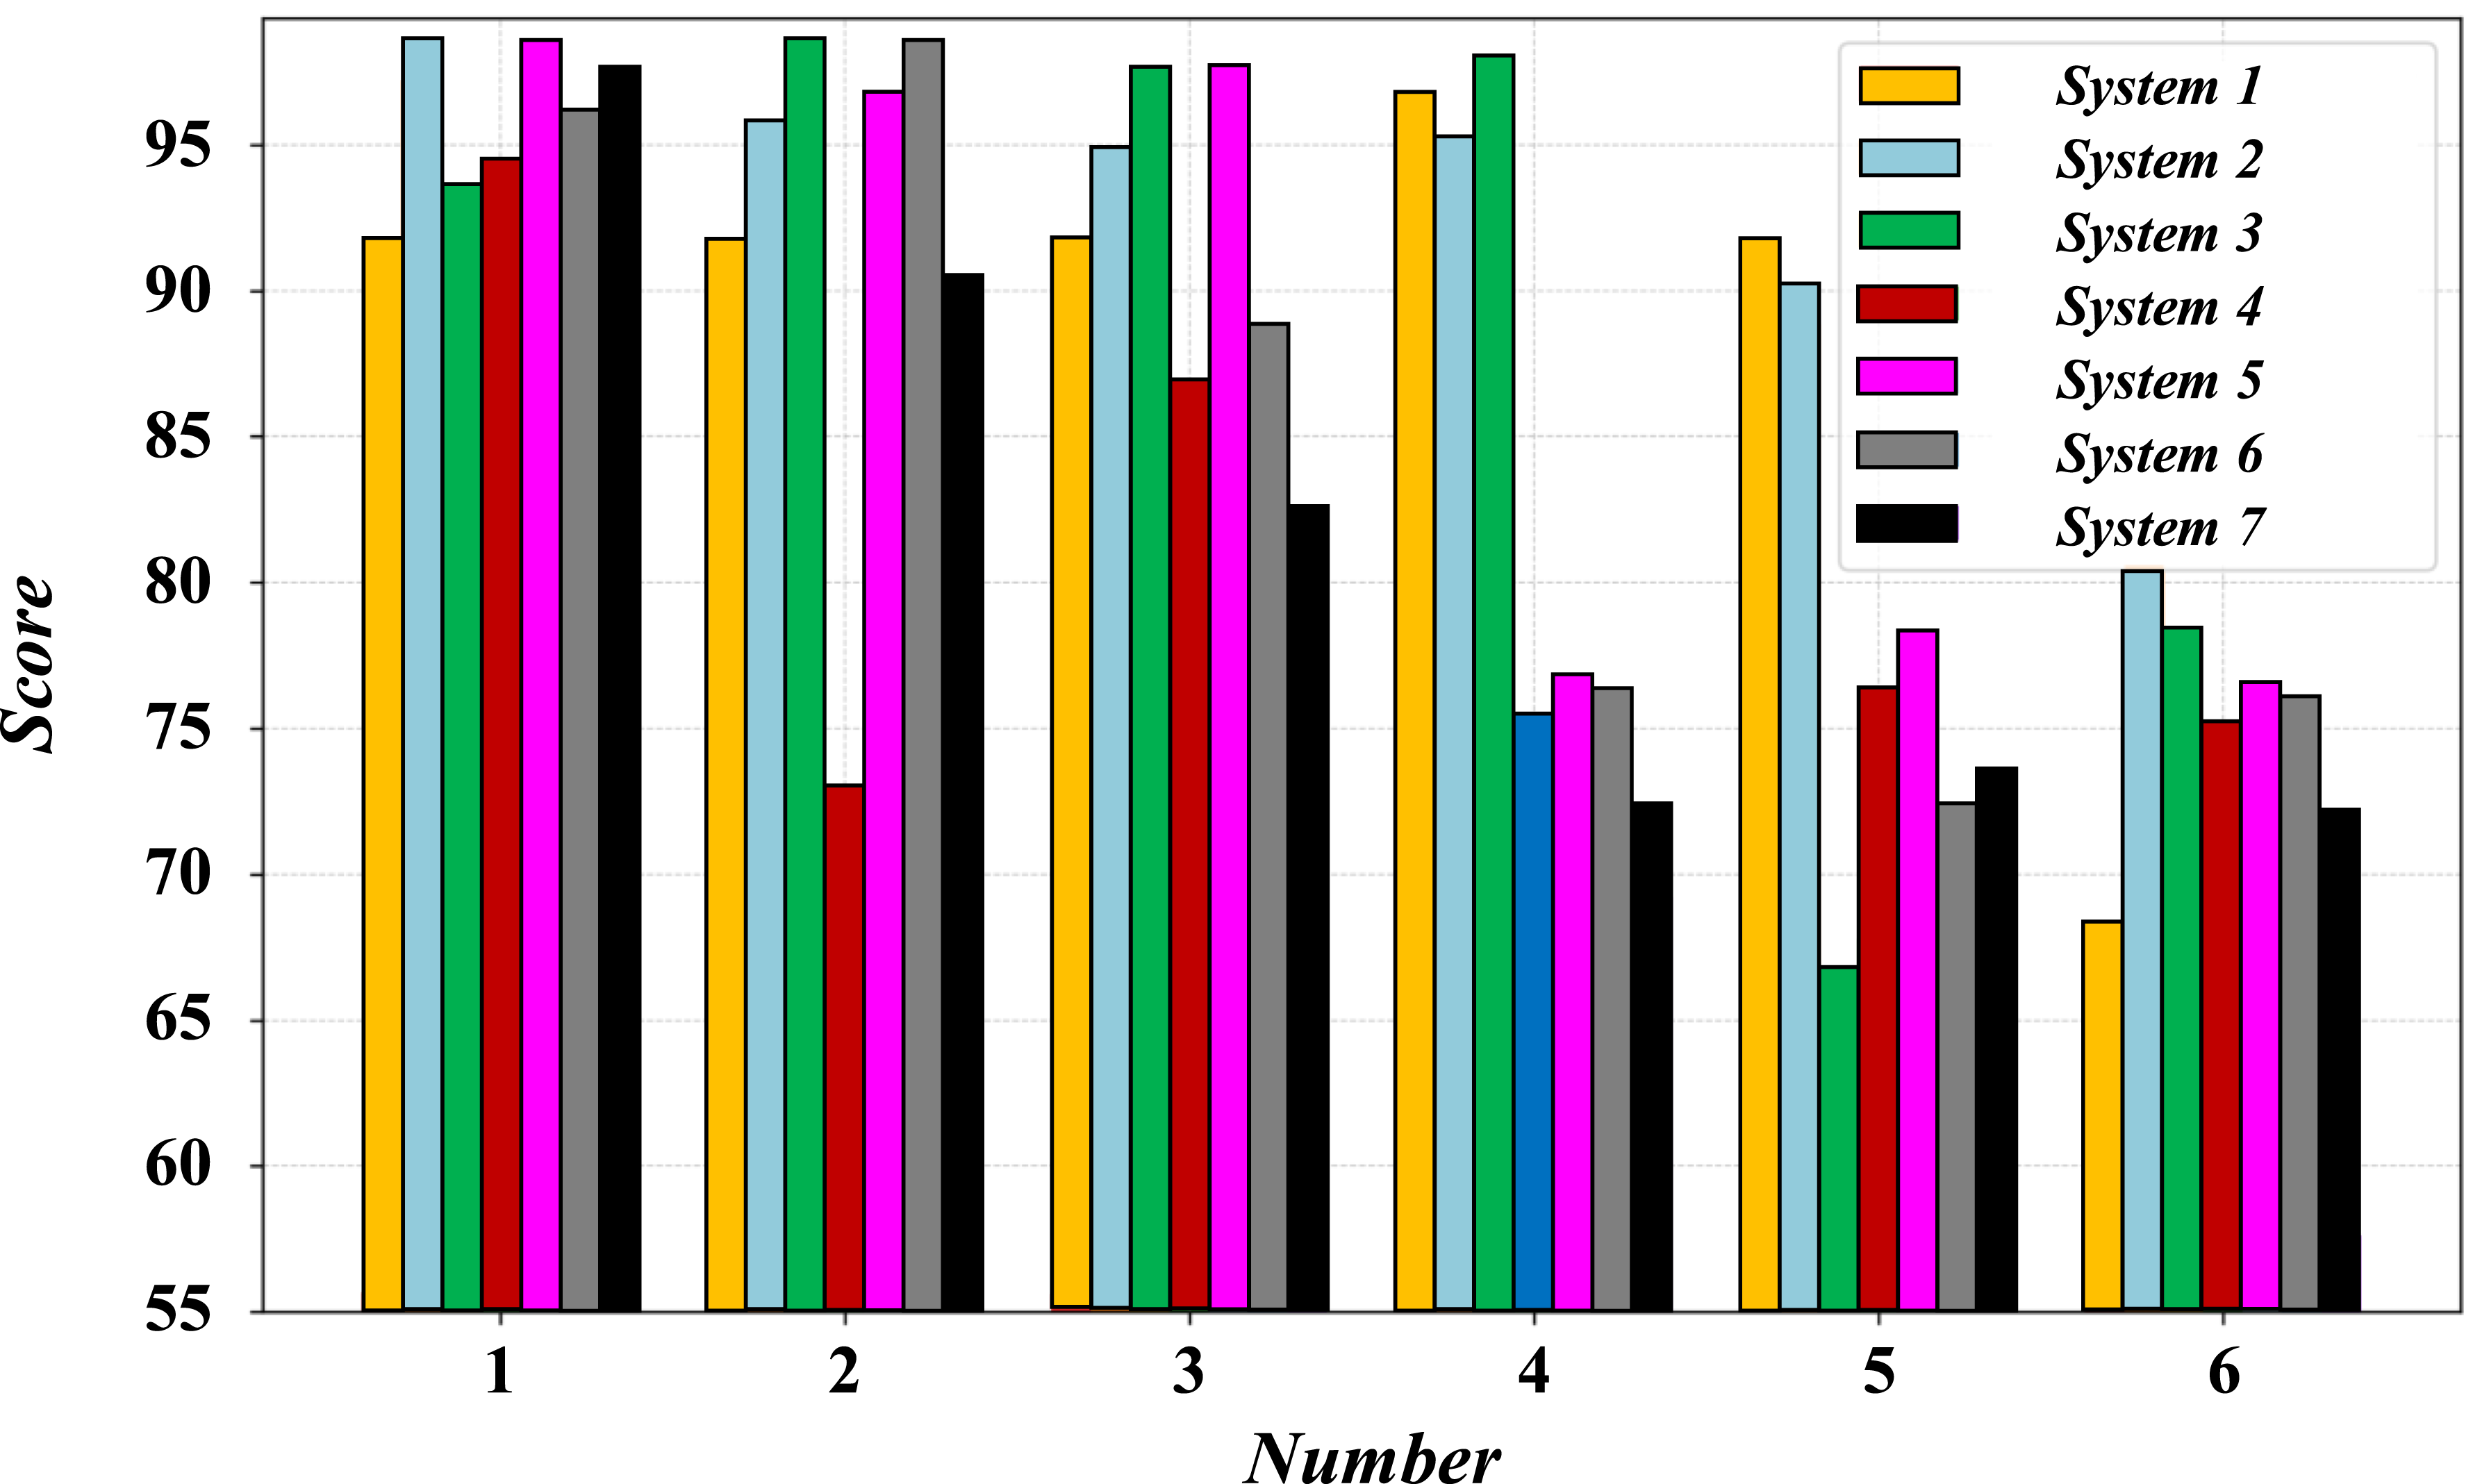
Conclusion
This paper proposes a new reliability benchmarking and dynamic performance evaluation method under the Linux system based on the fuzzy comprehensive evaluation method. It verifies the effectiveness of this method through experiments. The core goal of the research is to comprehensively evaluate the dynamic performance of the Linux systems by constructing a reasonable performance evaluation model to provide a scientific basis for system optimization and fault warning. (1) In this study, we design a dynamic performance evaluation model based on the Linux system’s microservice architecture and process communication mechanism. By modeling the independence of the Linux kernel and graphical interaction platform, we propose an evaluation core combining Fortran and C++ mixed programming. This architecture can ensure the efficiency of the evaluation core and effectively allocate system resources, avoiding the performance bottleneck under the traditional single architecture. In the experiment, a standard load test is used to compare microservice and monolithic architecture performance. Under equivalent load conditions, the system throughput under microservices architecture is increased by 15%, and the response time is shortened by 12%. (2) In the dynamic performance evaluation part, this study applies a fuzzy comprehensive evaluation method to evaluate the performance of Linux systems under different load conditions. By defining several performance evaluation indexes, such as CPU usage, memory usage, and I/O response time, these quantitative indexes are transformed into fuzzy sets for comprehensive evaluation. The dynamic performance evaluation results in different test scenarios are obtained through the fuzzy inference system. In the experiment, we design four typical load scenarios: light load, medium load, high load, and overload to evaluate the system’s dynamic performance. (3) To verify the accuracy and effectiveness of the proposed evaluation method, we conducted several rounds of experiments to compare the results of traditional performance evaluation methods and those based on fuzzy comprehensive evaluation methods. The experimental results show that the dynamic performance evaluation method based on fuzzy comprehensive evaluation can predict the system’s performance bottleneck more accurately under high load conditions and give corresponding optimization suggestions. Specifically, the evaluation accuracy based on the traditional method is about 85%. In comparison, the evaluation accuracy based on the fuzzy comprehensive evaluation method is improved to 92%, and 7 percentage points increase the accuracy rate.
By comparing with existing performance evaluation tools, including Linux perf tool, the model proposed in this study can provide more detailed and comprehensive evaluation results. When optimizing system resources, traditional methods can only provide partial information on performance bottlenecks, while fuzzy comprehensive evaluation methods can comprehensively consider multiple performance indicators and provide more targeted optimization directions. For example, under high load conditions, through the fuzzy comprehensive evaluation method, we can accurately determine that excessive memory usage and long I/O response time are the main reasons for performance bottlenecks, while traditional methods have failed to provide corresponding specific recommendations.
The reliability and dynamic performance evaluation method of Linux system based on fuzzy comprehensive evaluation is automatically integrated into the existing system monitoring tool, and the performance indicators such as CPU and memory can be obtained in real time by setting a multi-dimensional data acquisition module in the monitoring tool. The preset fuzzy membership function and weight allocation algorithm were used to fuzzy processing and comprehensive operation of the collected data. Finally, the evaluation results are output in the form of visual charts to realize the dynamic and intelligent evaluation of system performance, so as to enhance the analysis ability and decision support value of monitoring tools.
The reliability benchmarking and dynamic performance evaluation method of Linux system based on fuzzy comprehensive evaluation proposed in this study has strong application value and prospects. In the dynamic performance evaluation of a Linux system, the fuzzy comprehensive evaluation method can effectively integrate various performance indicators, provide accurate performance analysis and optimization suggestions, and thus improve the stability and reliability of the system. Future research can further explore how to apply this evaluation method in more complex distributed system environments and combine advanced technologies such as machine learning to improve the intelligence level of the evaluation model.
Footnotes
Funding
The authors received no financial support for the research, authorship, and/or publication of this article.
Declaration of conflicting interests
The authors declared no potential conflicts of interest with respect to the research, authorship, and/or publication of this article.