
Abstract
Information officers and network administrators require tools to help them achieve situation awareness about potential network threats. We describe a response to mini-challenge 1 of the 2012 IEEE Visual Analytics Science and Technology challenge in which we developed a visual analytic solution to a network-security situation awareness problem. To support conceptual design, we conducted a series of knowledge elicitation sessions with domain experts. These provided an understanding of the information they needed to make situation awareness judgements as well as a characterisation of those judgements in the form of production rules, which define a parameter we called the ‘concern level assessment’. The concern level assessment was used to provide heuristic guidance within a visual analytic system called Middlesex Spatial Interactive Visualisation Environment. An analysis of Visual Analytics Science and Technology challenge assessment sessions using Middlesex Spatial Interactive Visualisation Environment provides some evidence that intelligent heuristics like these can provide useful guidance without unduly dominating interaction and understanding.
Keywords
Introduction
As computer networks grow, so do the demands for managing them effectively. Information officers and network administrators need tools that can help them achieve situation awareness about states and events within large networks quickly and accurately in order that they might diagnose and respond in a timely manner. The 2012 IEEE Visual Analytics Science and Technology (VAST) competition issued a challenge of creating a visualisation to support situation awareness of the health of a large computer network run by a fictitious corporation called Bank of Money. Participants had to use their visualisation to generate an assessment of issues within the network. 1 With the challenge came a synthetic data set of parameter reports from nearly a million machines sampled four times an hour over a period of 48 h. Embedded within this computer- and human-generated data were a number of ‘ground-truths’ that contestants might find.
In this article, we describe the approach taken by a team at Middlesex University in London to the development of an entry for mini-challenge (MC) 1 of VAST 2012. The system is called Middlesex Spatial Interactive Visualisation Environment (M-SIEVE). The approach taken to the design of M-SIEVE was influenced by the idea that the creation of new technology to support experts in making better decisions must in some way embody the concepts, principles and procedures of the work domain. 2 We paid particular attention to understanding how experts might use the data parameters to draw conclusions about the network. To do this, we recruited a small group of cybersecurity experts and conducted a series of knowledge elicitation sessions. Our approach drew more from techniques common to knowledge engineering and the development of intelligent systems than techniques more typical of interaction design.
The knowledge elicitation influenced design by demonstrating that important distinctions can arise from apparently subtle differences in parameter combinations, which parameters were important to the experts and also by suggesting a number of additional parameters that could be derived from the data. One of these was an inferred parameter called the concern level assessment (CLA), which represents possible interpretations of network conditions. This was implemented within the final system with the aim of providing heuristic guidance to the user by ‘flagging up’ potential areas of concern.
In this article, we focus on the knowledge elicitation process and how this influenced our design, including the characterisation and implementation of the CLA. We also report an analysis of our VAST assessment sessions using M-SIEVE, which provides some evidence for how the CLA and its implementation supported situation awareness without overly dominating expert judgements through visual interaction with the raw data.
In the next section, we provide some research background, followed by a more detailed description of the VAST 2012 challenge. We then describe the knowledge elicitation sessions and their outcomes, followed by a description of the M-SIEVE system. We then report an analysis of the VAST assessment sessions that we ran using M-SIEVE. This provides some insights into the possible benefits of using inferred parameters such as the CLA within visual analytic systems.
Background
In this section, we look at three areas: the nature of situation awareness and abductive reasoning, intrusion detection systems (IDSs) and conceptual design approaches as applied to visualisation systems.
Situation awareness and abductive reasoning
Endsley defines situation awareness as ‘The perception of the elements in the environment within a volume of time and space, the comprehension of their meaning, and the projection of their status in the near future’. 3 As such, situation awareness is considered to progress according to three stages or levels: level 1 involves the perception and recognition of relevant cues in an environment, level 2 involves the synthesis of disjointed elements into an interpretation and level 3 involves near-term projection to predict future states.
The process of achieving situation awareness is similar in many ways to the process of sensemaking as presented by Klein et al.’s 4 data/frame model of sensemaking, and achieving situation awareness is arguably a kind of sensemaking. Both Endsley and Klein describe the processes of interpreting a state of affairs through available cues. Both are processes of interpretation in which hypotheses are generated to offer plausible explanations for how the cues may have come about.
Implicit in the process of achieving situation awareness and sensemaking is inference by abduction or ‘reasoning to the best possible explanation’. Abduction is a theory-forming inference in which hypotheses are generated to explain phenomena; 5 as such, it is particularly pertinent to any kind of diagnostic reasoning. Just as doctors generate hypotheses about conditions from observable symptoms, cybersecurity analysts generate hypotheses about activity within a network using data derived from the network. The symptoms (or data) provide clues (or cues) that give rise to an interpretation. The interpretation then has the role of explaining and giving meaning to the symptoms.
Notably, the logic of abduction depends not only on seeing the cues but also on recognising these as indicative of some state or event of interest. Abductive inference is fallible with its outcomes evaluated according to judgments of their plausibility; an abductive explanation can be more or less plausible and can be accepted or otherwise on that basis. Where multiple explanations are available and are in competition with each other, then it is usual to accept the one that might be considered the most plausible. But the interpretation of cues rests heavily on knowledge of a domain, different possible states of affairs and their likelihoods and the causal relationships between these and visible cues. Hence, a situation awareness system, human or otherwise, must necessarily embody a particular kind of domain knowledge.
Intrusion detection and visual analytics
IDSs are software applications or hardware devices that monitor, analyse and raise alerts about events within a computer system or network that are indicative of attacks or illegal access.6,7 There are three main categories of IDSs: host-based IDSs (HIDSs) that run on each machine in a network, checking stored data and monitoring the system state and analysing activities of the machine; network-based IDS (NIDS) that run on dedicated, stand-alone devices in the network monitoring and analysing traffic on a subnetwork to detect a variety of attacks (including denial-of-service and port scanning attacks) and network node IDS (NNIDS) that analyse traffic passed from the network to specific hosts.
Within such systems, a number of attack detection techniques may be used, including the following.
Anomaly detection. Deviations from a baseline of normal usage patterns are flagged as a potential intrusion. 7 This is quite effective but with the drawback of a high false alarm rate since new and previously unseen activities of a machine might be identified as an anomaly. 7
Misuse detection. Instances in the data set are labelled ‘normal’ or ‘intrusive’, and a learning algorithm is trained over the labelled data. Alarms are generated based on specific attack signatures. If constantly updated, this technique works very effectively and is less prone to false alarms than the anomaly detection.6,7
Target monitoring. A cryptographic algorithm such as crypto checksum searches for modifications to specific files. Modifications are reported.
Stealth Probes. These use a combination of anomaly and misuse detections to collect and correlate data and to try to detect attacks that run over a long period of time.
While IDSs place an emphasis on automated inferencing, visual analytics tends to emphasise the value of the user exploring and foraging within the data. Fink et al. 8 studied cybersecurity professionals using a large, high-resolution display and used their findings as the basis for a set of principles relating to the design of analytic workspaces and the analytic tasks they can support. The system VIAssist 9 was developed to provide cyber defenders with a better understanding of massive, multidimensional data sets in the context of protecting critical national infrastructure. VIAssist featured multiple views using a range of visualisation techniques to highlight relationships, including maps for geo-relations, parallel coordinate views for displaying network connection parameters and bar charts for representing network activity. 9 In other works, cybersecurity ‘storm maps’ have been developed, which leverage the metaphor of a meteorological weather map to quantify the impact of cyber incidences in an efficient way. 10
Automated detection and visual data exploration represent characteristically different approaches to situation awareness support. Initially, automated inferencing is used to analyse high volumes of data quickly and in ways that might be hidden from the user. Detecting and differentiating problems such as hardware and software failures or network attacks can be made all the harder by the size and complexity of large-scale networks in which the number of nodes can be counted in the millions. Given that the burden of interpretation is on the system, it needs to know what to look for and to find within reasonable performance constraints. In a visual analytic approach, the burden of interpretation is shifted to the user. Data are made available for visual exploration from which the user draws their own conclusions. This can have the benefit of accommodating local values and contextual knowledge, which may be unavailable to an automated system, into situation awareness assessments. It would be very unlikely for a system to capture all data, which might be useful for forming an understanding of a situation, or for a rule set to have all the rules necessary to deal with the most local and contextually bound situations.
Conceptual design
When considering the design of a visual analytic system, an important place to start is with its proposed users and their needs. According to good user-centred design practice, this understanding best emerges over time through repeated engagement between developers, users and design artefacts. Iterative user-centred design processes have been proposed, which are tailored to the problem of designing visualisation systems. For example, Wassink et al. 11 describe a spiral process of early envisioning, global specification and detailed specification. During early envisioning, data are gathered about users, their environments and tasks through questionnaires, interviews and observation, resulting in user profiles and requirements. During global specification, low-fidelity solutions are presented for feedback, and during detailed specification, interactive, high-fidelity prototypes are developed and evaluated through expert review and user testing.
Roberts 12 proposes a five design-sheet approach, with each sheet intended to support part of the designer’s journey from requirements gathering to evaluation of the implemented design. The approach has stages and structure through which the designer sketches design ideas and critically analyses the solutions with stakeholders. Sketching further allows the designer to consider unusual techniques not bounded by technology and iterations.
These approaches reflect principles of interaction design practice, which have come to be well accepted, such as expressing, evaluating and developing conceptual designs early in the design process. Conceptual designs may be represented using scenarios, sketches or storyboards.13,14 Depending on the medium and supported interactivity, prototypes may be evaluated through interviews or focus groups structured around envisioned or simulated user interaction.
While such approaches have proven history within the design process, they may also have limitations. Success depends upon the stakeholders’ ability to conduct mental simulations with sufficient depth such that they can make truly informed judgements about the distinction between good and bad designs, the scenarios may lack coverage of all situations that would be encountered and the feedback obtained may be subject to various biases such as the ‘halo’ effect. Consequently, there may be a risk that design decisions are not as well founded as would have been hoped.
For designing to situation awareness tasks at least, we explore the idea that knowledge elicitation techniques may offer more systematic and reliable ways of answering what is a key question for visualisation design: what information about situations to present at the interface?
Knowledge elicitation techniques have been used for explicating domain-specific knowledge that underpins human performance. 15 Its beginnings date back to the 1980s as part of knowledge engineering work for supporting the development of knowledge-based systems such as expert systems, intelligent tutoring systems, adaptive interfaces and intelligent agents. 15 Motivated by the studies of De Groot 16 and Chase and Simon, 17 it was felt that differences between experts and novices could be accounted for more in terms of memory and recognition of domain-specific patterns rather than any particular strategy or way of thinking. 18 Thus, knowledge engineering came to include methods for eliciting domain-specific rules and concepts as tools to support constructing models of expert knowledge to be used in system design of intelligent systems. 15
Knowledge engineering makes use of multiple elicitation methods with each tapping a different kind or range of knowledge. 19 Methods include the following. 15
Observation of task performance or performance of simulated or contrived tasks during which domain knowledge and related strategies are surfaced.
Interviews with differing degrees of structure, including ‘critical incident’ methods in which experts are asked to provide detailed accounts of important past events and ‘forward scenario simulation’ in which they are walked through contrived events and asked to respond.
Conceptual methods for eliciting the structure of domain-related concepts and relations, for example, card sorting and repertory grid analysis.
By conceptualising the situation awareness task as one based on the interpretation of cues by abductive reasoning, we suggest that there is potential for employing knowledge elicitation techniques to inform conceptual designs of visual analytic systems for situation awareness. These techniques may address some of the limitations we suggested of traditional interaction design methods. By asking experts to systematically articulate responses to a range of parameter scenarios, it may be possible to produce mental simulations, which are more evocative and deep, to cover more hypothetical scenarios, and to provide judgements that are more ‘objective’ and less subject to bias.
Although it is not our aim to address these questions directly in this article, we do describe the use of one expert elicitation method in the context of the design of a visual analytic system for situation awareness. We do this in order to explore how it might useful to inform the design of such a system and the benefits of such a design for assessments in the context of VAST 2012 MC 1.
VAST 2012 MC 1
In this section, we provide context by briefly outlining VAST 2012 MC 1. According to the challenge brief, Bank of Money operates coast to coast over the landmass of BankWorld. It has numerous facilities of various sizes (branches, regional headquarters (HQs), data centres and national HQs). It operates a network of 895,025 machines. Each machine has an associated class, function, sub-function, lat/long, business unit and facility.
A data set containing parameter reports indicative of machine health, which have been acquired from each machine (those that are switched on) sampled at 15-min intervals over a period of 48 h (192 time points), is provided. At each sample point, each machine reports its number of connections, policy status and activity flag (see Table 1).
Machine health table – periodic status reports from all machine equipment in the BoM enterprise for a 2-day span (15-min intervals).
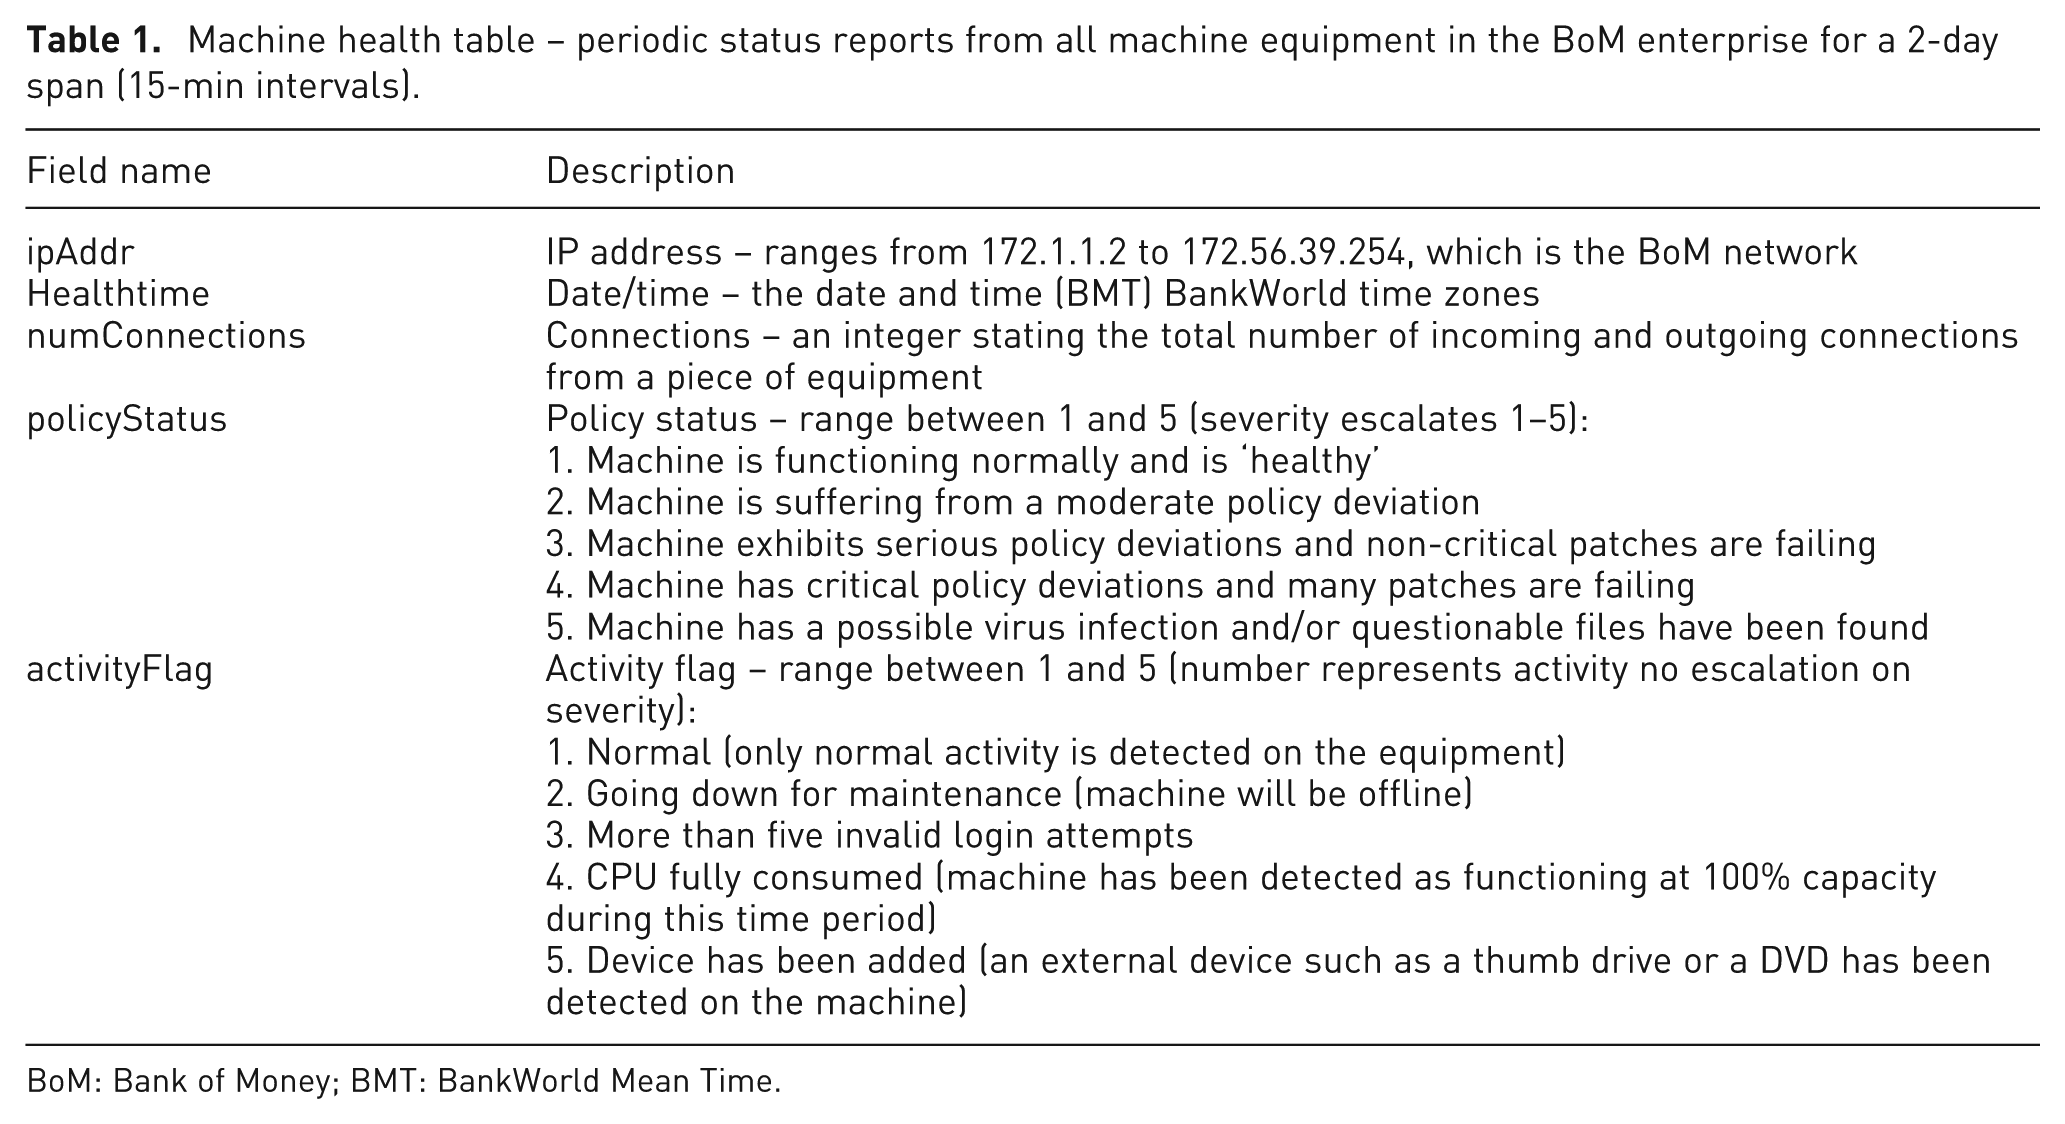
BoM: Bank of Money; BMT: BankWorld Mean Time.
Also included is a map of BankWorld and Bank of Money’s business rules. These are as follows: (1) business hours are Monday–Friday, 7 a.m.–6 p.m. (in each of a number of time zones); (2) staff are encouraged to turn off workstations at night; and (3) although Bank of Money engages in planned maintenance, it does not occur on a regular schedule.
MC 1 had the following two parts.
Create a visualisation of the health and policy status of the entire Bank of Money enterprise as of 2 p.m., BankWorld Mean Time (BMT), on 2 February. What areas of concern do you observe?
Use your visualisation tools to look at how the network’s status changes over time. Highlight up to five potential anomalies in the network and provide a visualisation of each. When did each anomaly begin and end? What might be an explanation of each anomaly?
Knowledge elicitation
We began with some cursory statistical analyses of the data and by generating some visualisations showing the geographical distribution of selected parameters. While this provided some familiarity with the data, it failed to deliver any deep insights about design. We conceptualised the design task as one of providing views onto the data that could support useful hypotheses inferences drawn by an expert user, typically by abduction. As outlined above, abduction presupposes domain expertise to mediate these inferences. Lacking this within the design team, we were unable to judge which views may or may not be useful.
We recruited four network-security experts into the design process to help us understand how the data could provide useful insights about issues within the network. The network-security team included a cybersecurity practitioner with 12 years of experience and three academic researchers with experience ranging from 10 to 25 years.
Given the nature of the task and to make full use of the experts’ time, we developed a knowledge elicitation procedure based on ‘forward scenario simulation’.20–22 During forward scenario simulation, an expert is presented with a description of a situation and asked to draw conclusions and/or discuss their likely response. Additional information is presented by the interviewer only on demand. This had value for the design process. Scenarios that were intentionally impoverished could be presented. Resulting equivocation and information requests then helped reveal just what information was required to make a judgement (given the constraints of the available data).
The technique also offered a way of engaging experts in a formative evaluation of aspects of conceptual design (i.e. what information to present) using mental simulations, which would be potentially more systematic, more focused and with greater depth of processing than traditional conceptual design review techniques. They would be more systematic by taking a step-by-step approach to interpretations of the parameter space, more focused by abstracting away from commitments to interface design, and would hopefully lead to deeper processing of scenarios on the part of the expert due to the fact that they were asked to actually draw conclusions and/or discuss a response.
Forward scenario simulation typically results in some if–then rules in which the antecedent corresponds to the interviewee’s complete description of the scenario and the consequent corresponds to the expert’s response. 15 A few days prior to the interviews, we emailed briefing materials to the experts describing the challenge. Each initial interview also began with a verbal briefing. We presented the parameter combinations on paper in the form of a matrix using two parameters initially: policy status and activity flag. While we could see how policy status had prima facie implications for assessment, we were interested in how activity flag might moderate these interpretations. The experts were asked to systematically review each cell within the matrix and give their view of what might be happening. The interviews were audio recorded and concurrent notes taken.
Expert practitioner interview 1
Beyond some expected unequivocal assessments (e.g. if both policy status and activity flag are normal, then all is well), the expert indicated some parameter combinations for which he would like more data. For example, machine class (e.g. automated teller machine (ATM), workstation or server) would be a significant additional parameter for assessing five or more consecutive login failures (activity flag 3). For a workstation, this number of login failures might not be unusual since people frequently forget their passwords. Servers, however, are usually accessed by system administrators who have written password lists. In this case, password ‘forgetting’ would be a less plausible explanation, and therefore, activity flag 3 might indicate something more sinister.
We also noted how, in describing a range of scenarios, the expert practitioner adopted a numerical scale to communicate his level of concern about different parameter combinations. The scale ranged from 0 to 5, with 0 representing no concern and 5 representing the highest concern. He used this numerical scale to articulate his response to different cells in the matrix, qualifying each with different interpretations for different machine classes.
Notably, the rating was not simply a measure of the negative utility associated with each parameter combination but also an assessment of the plausibility/probability of his contingency. This scale, which we referred to as the CLA, was adopted into subsequent interviews as shorthand for discussing the implications of parameter combinations.
Expert practitioner interview 2
After the first interview, we modified the matrix to include the additional parameter (machine class) and incorporated the numerical assessments that had been made by the expert (see Table 2). We then repeated the procedure with the same expert using this modified matrix, giving him an opportunity to review and embellish his earlier assessments.
Using the policy status, activity flag and machine class to represent concern level.
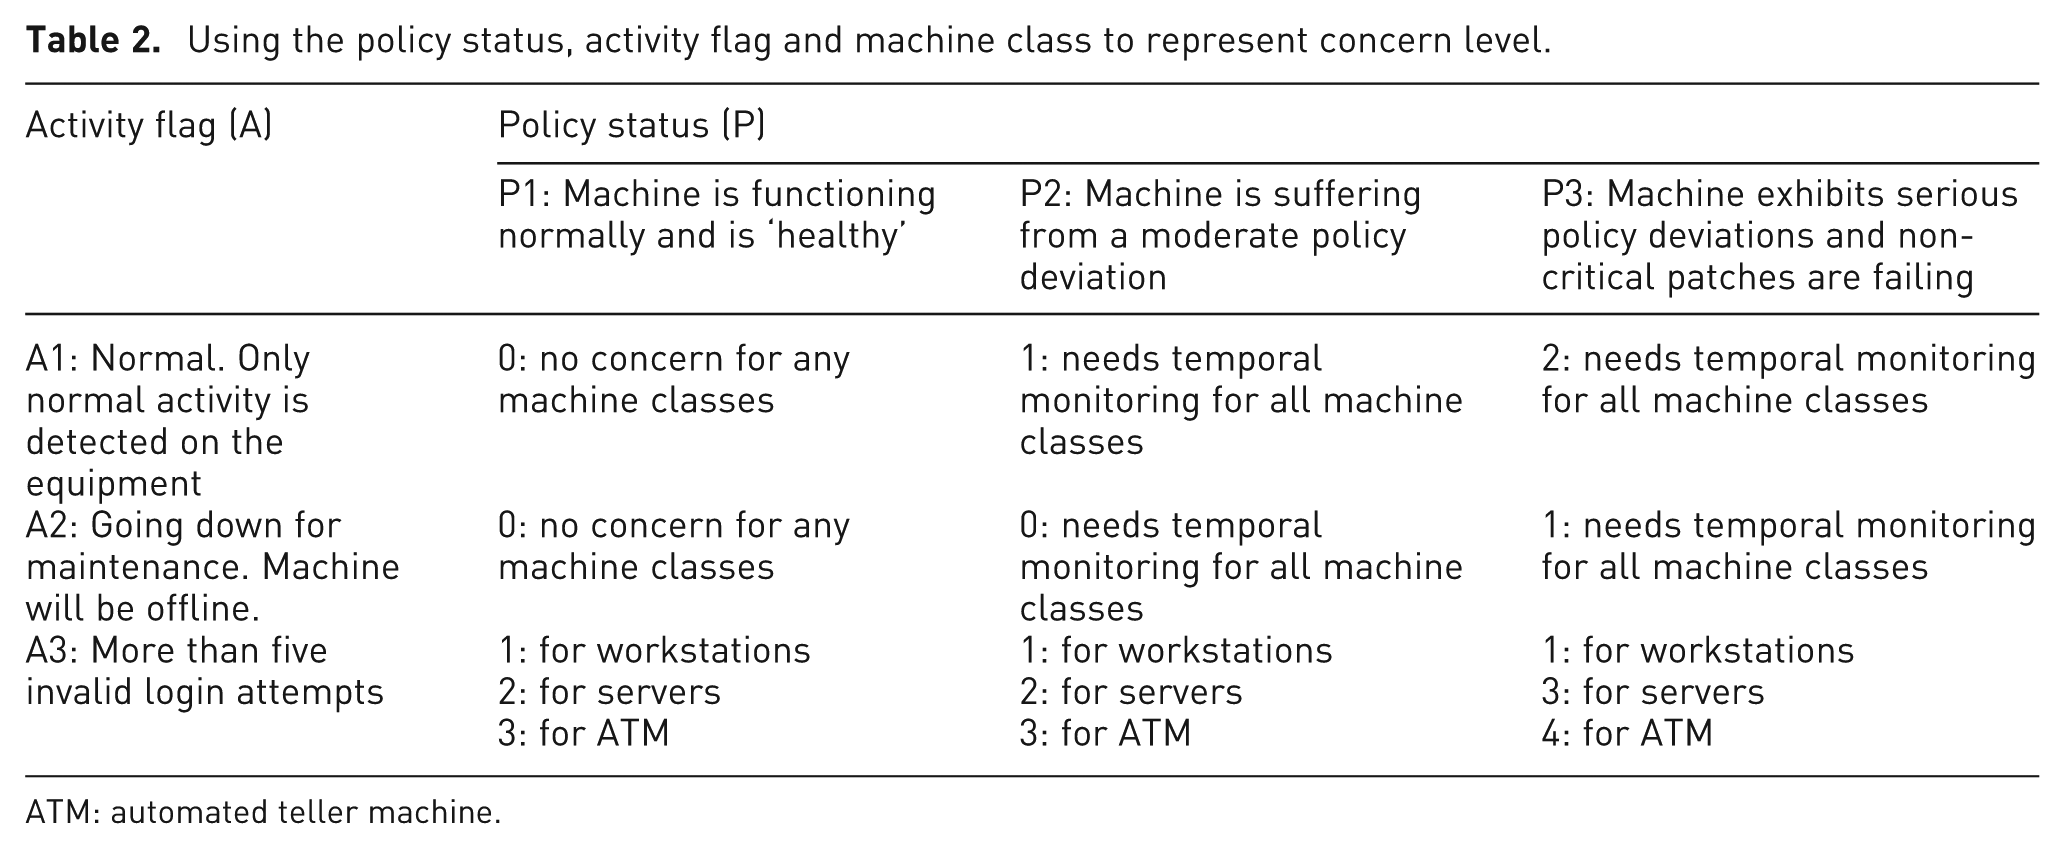
ATM: automated teller machine.
During this interview, the practitioner reviewed and elaborated on the CLA judgements with possible explanations and suggested responses. Further equivocation also indicated that four additional parameters need to be considered. These were machine function, time of day, number of connections and prior reports. Here, we give some of the following explanatory examples.
Machine function. This acted as a functional decomposition of machine class, and these sub-classifications could be significant. For example, a machine with a fully consumed central processing unit (CPU) (activity flag 4) would be more worrying if it were a web, email or file server compared to a compute or multiple-function server.
Time of day. A fully consumed CPU on a customer-facing teller’s machine or loan machine during rush hour might have a more negative effect on business than a workstation used in the back office would (the expert made an assumption that tellers are used by cashiers, that loan machines are likely to be used by mortgage advisors and that office workstations were used by back-office staff).
Number of connections. It would be unusual to take an ATM down for maintenance (activity flag 2) when it had been functioning normally (policy status 1) and had a high number of connections, and therefore, this would suggest a higher level of concern.
Prior reports. The concern he associated with some parameter combinations depended on prior reports. For example, if a machine with a minor policy deviation (policy status 2) was taken down for maintenance (activity flag 2), it would be a concern if its policy deviation persisted when it came back on line.
Expert practitioner interview 3
We restructured the elicitation matrix to include the results of the previous interview (for an extract, see Table 3). The horizontal axis was expanded to include all possible combinations of machine class and machine function. The vertical axis was expanded to include all possible combinations of policy status, activity flag and two derived variables normal/abnormal number of connections and office hours/after hours (these derived variables were not provided in the original data set but could be calculated from the data and the business rules). Each cell was then coded with the relevant CLA value and associated plausible explanations for the parameter combination and/or a suggested action/response.
Representing expert domain knowledge via concern level assessment (heuristics).
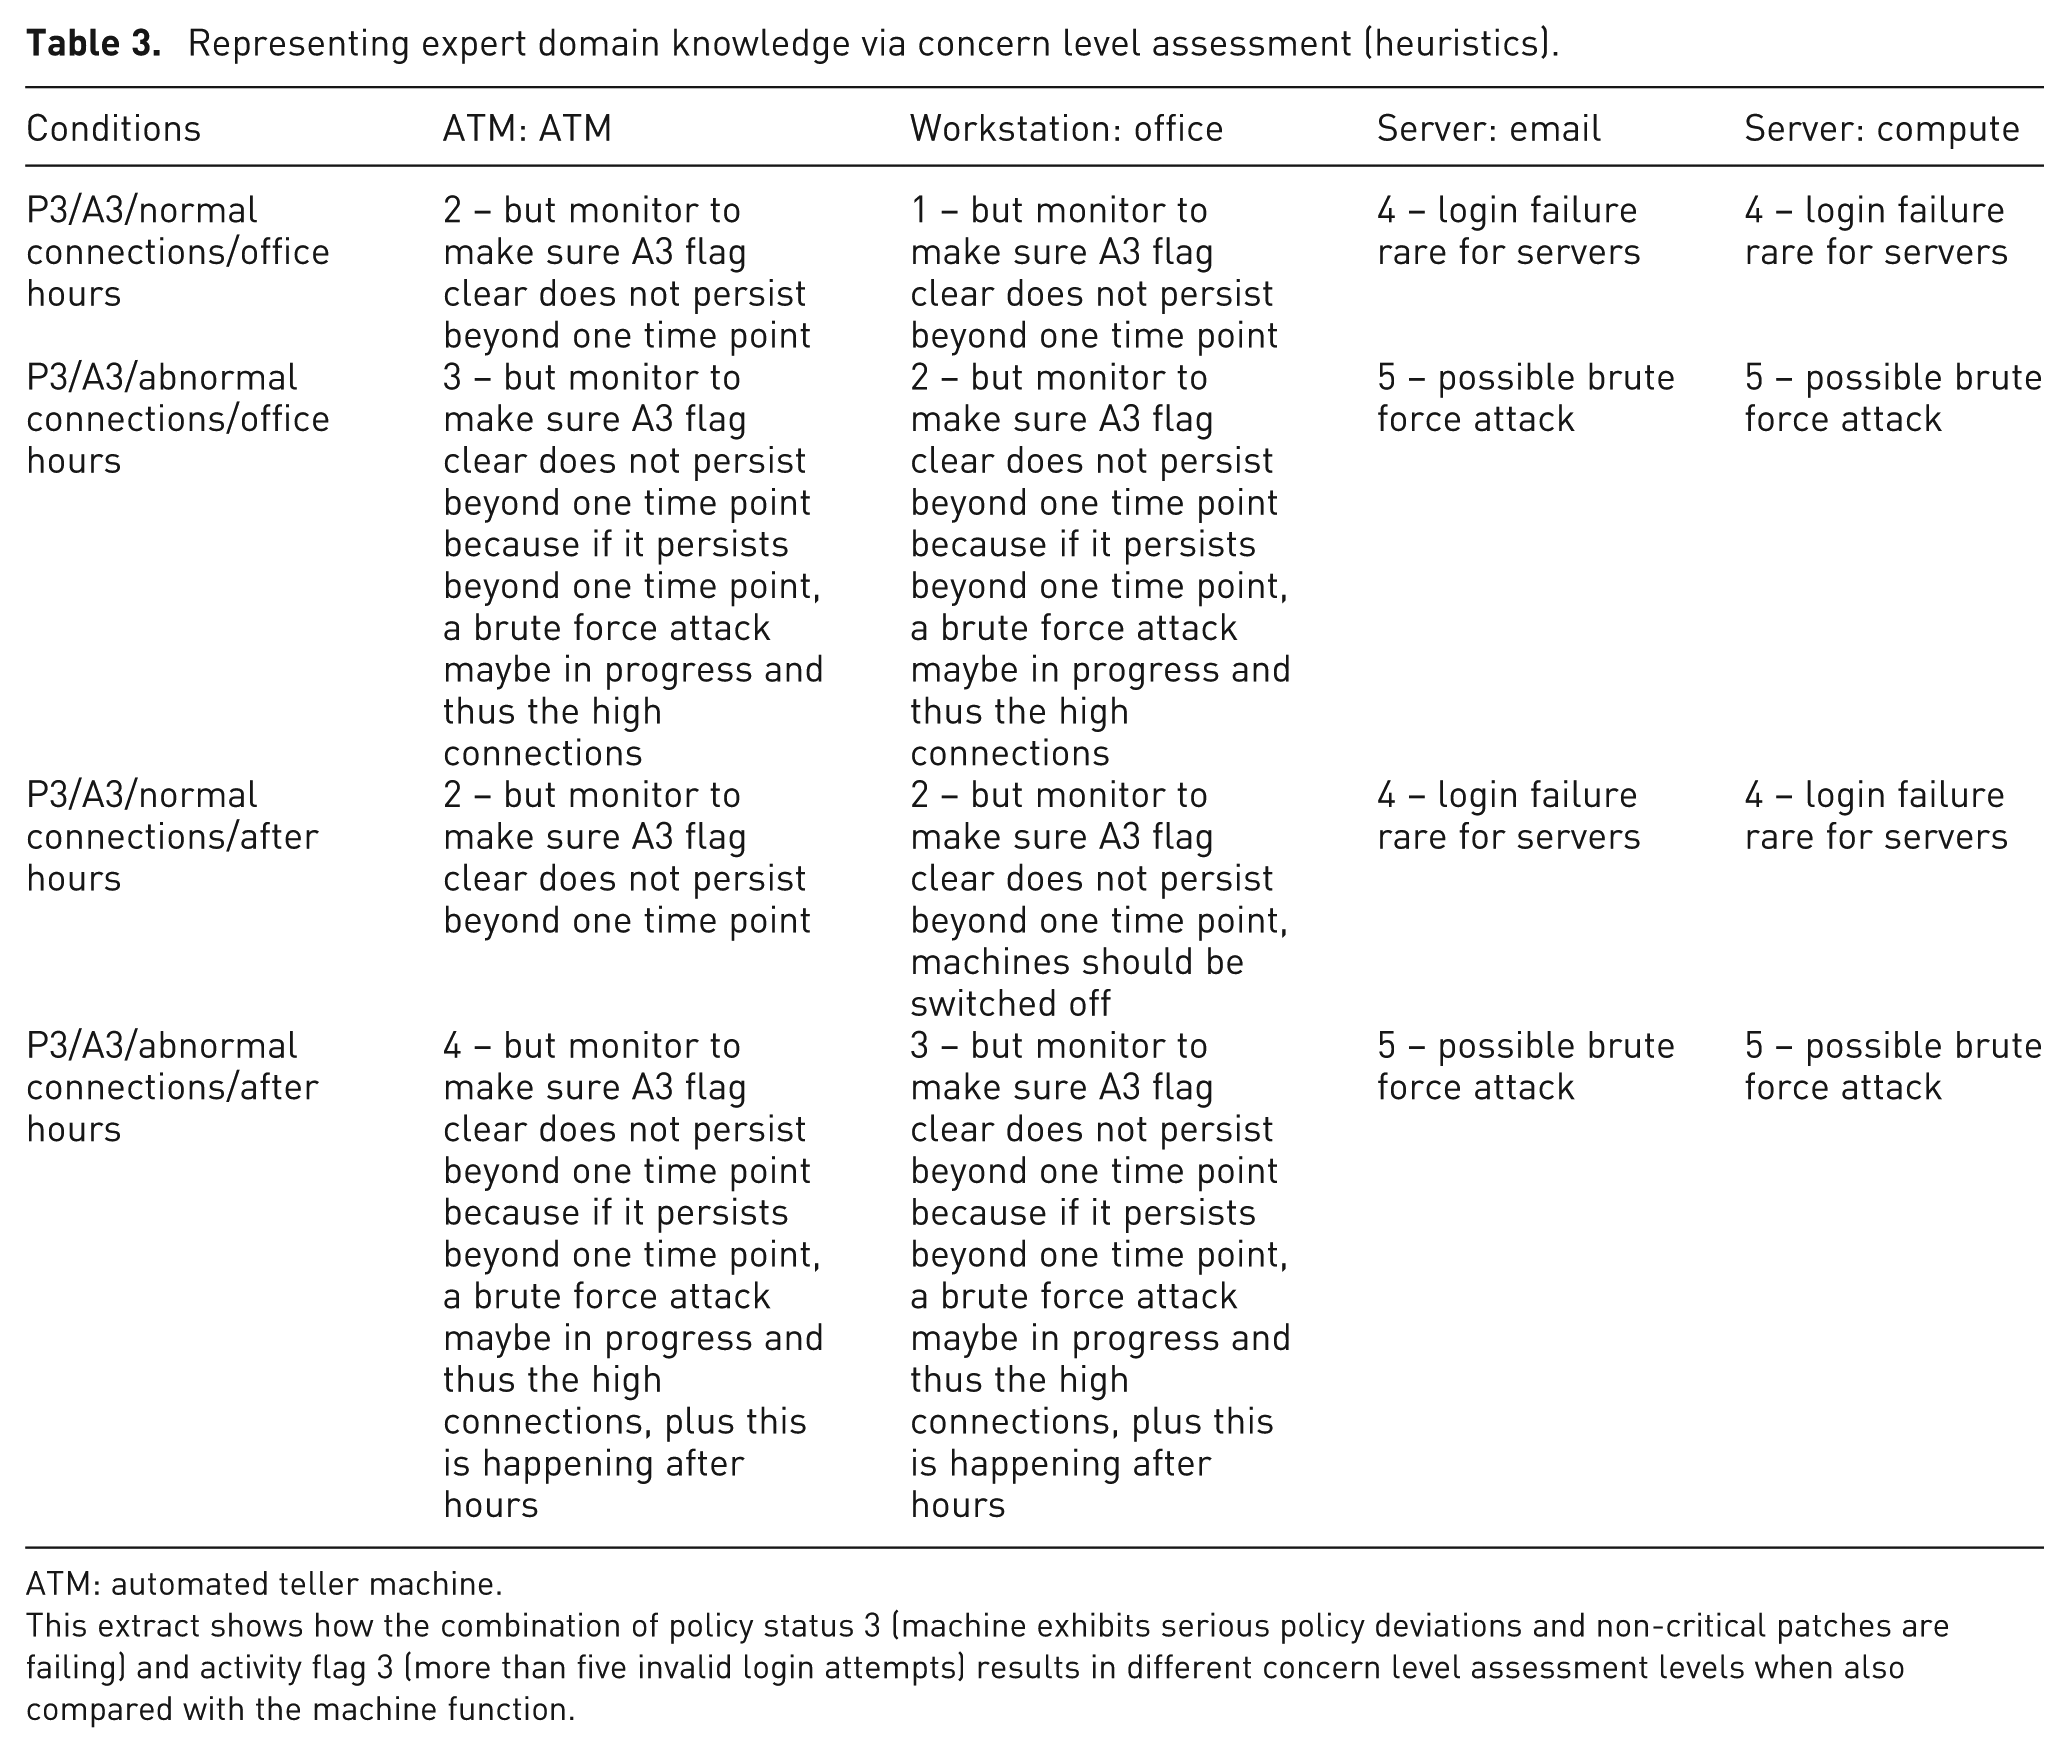
ATM: automated teller machine.
This extract shows how the combination of policy status 3 (machine exhibits serious policy deviations and non-critical patches are failing) and activity flag 3 (more than five invalid login attempts) results in different concern level assessment levels when also compared with the machine function.
Interview with cybersecurity academics
After the expert practitioner interviews, we conducted an interview with three academics who specialised in network security. This took the form of a critique of the most up-to-date version of the matrix, following the same procedure as the interviews with the practitioner.
The academics reviewed the matrix and corroborated its assessments. For example, they agreed that concern might be raised where system maintenance had failed to cure a moderate policy deviation and with the need to consider abnormally high numbers of connections and login failures differently depending on time of the day.
Implications of the knowledge elicitation for design
The knowledge elicitation interviews provided a number of useful outcomes. First, they gave an understanding of how different parameter combinations might be interpreted by expert network analysts, and by implication, which parameters would be important for reducing uncertainty in situation awareness assessments. They showed that such assessments can be complex with important distinctions arising from apparently subtle differences in parameter combinations. This confirmed one initial design idea that it would be useful to be able to rapidly filter the data set and obtain visual feedback according to complex parameter combinations.
Second, the interviews indicated variables needed for supporting interpretation, including some that would need to be calculated from the raw data. Following the interviews, we used the data to calculate these, including norms for the number of connections per machine function for the entire data set; each time zone during office hours; each time zone after office hours, the 2 February, 2 p.m. time stamp; changes in policy status, activity flag and number of connections (normal and abnormal) over the 192 time stamps; the actual time depending on time zone and whether or not a time was in or out of office hours.
We also regarded the CLA as a variable that could be calculated or rather inferred from the raw data and which could be usefully employed in interface design. As an embodiment of a number of expert assessments, it could perhaps be operationalised as a heuristic for guiding interaction. We had no assurances that these assessments were complete, or even accurate, but we did consider that they could provide useful guidance to an analyst when faced with a large data set.
We used the final version of the matrix to define a set of 97 production rules that could be used for deriving the CLA (see Table 4 for examples). These rules defined conditions under which different concern levels might be triggered. These conditions included specific values for some parameters and, where appropriate, left others unspecified. They also included the possibility for an additional persistence condition for capturing CLA values for parameter combinations that persisted over time. Each rule was also accompanied by a possible explanation/interpretation.
Examples of the 97 CLA heuristics.
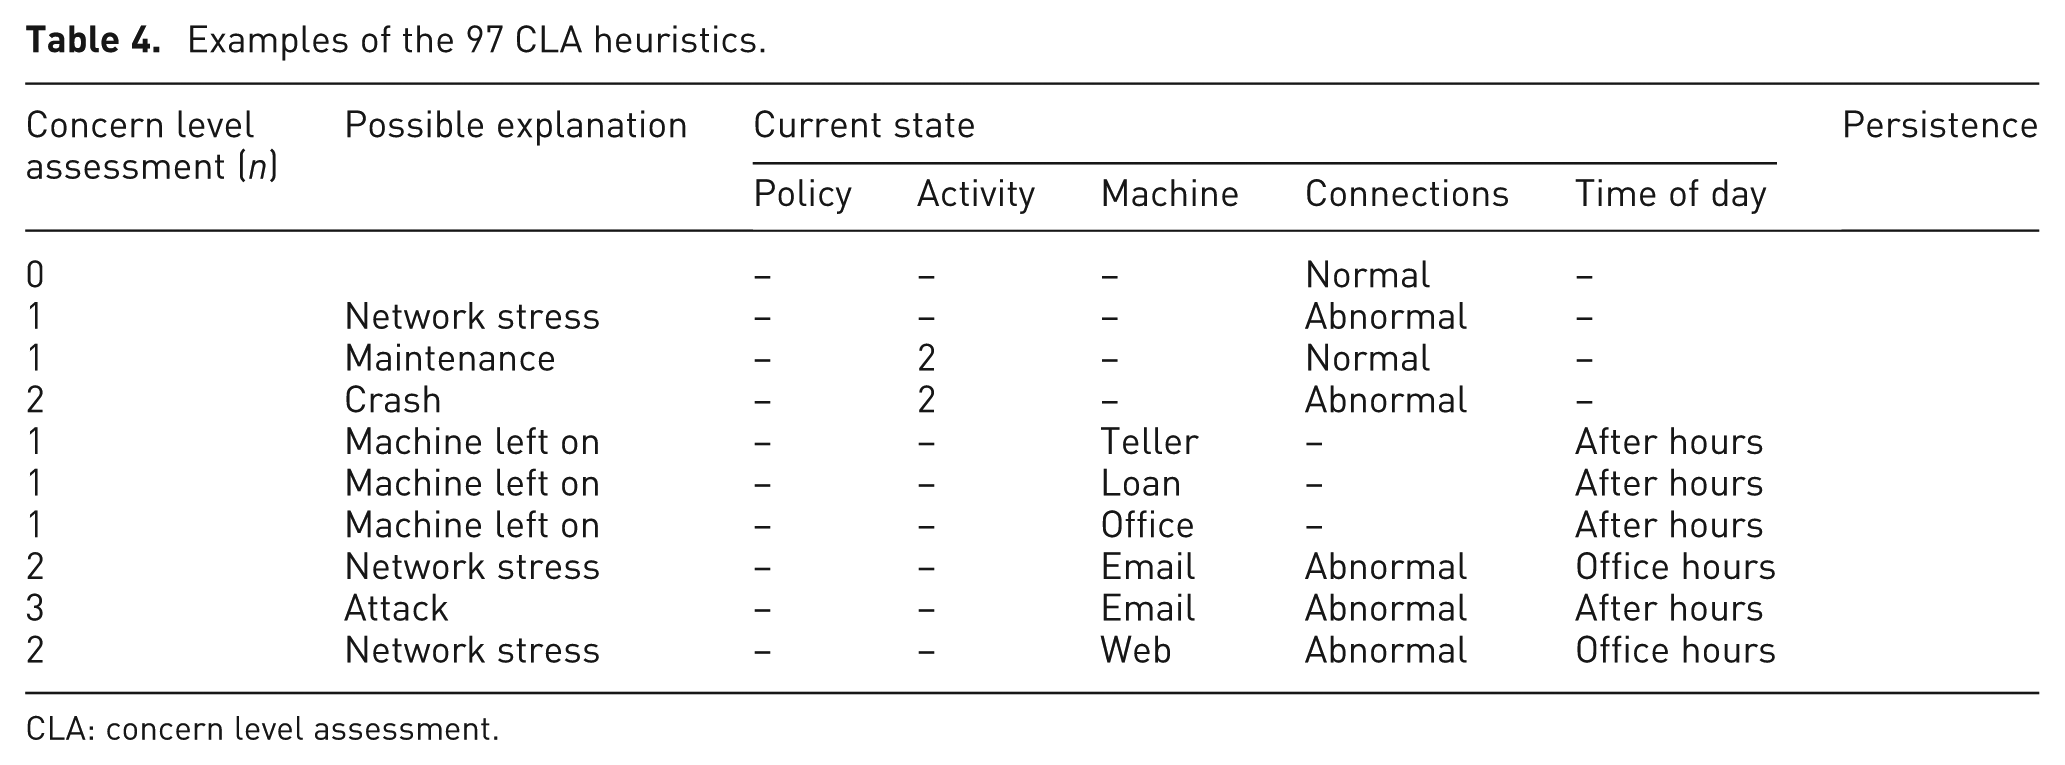
CLA: concern level assessment.
M-SIEVE
In this section, we briefly describe the M-SIEVE application, paying particular attention to how the elicitation interviews influenced its design and how we incorporated the CLA. The M-SIEVE interface has three parts (see Figure 1). To the left is a geographical view (Figure 1(a)) indicating the locations of the facilities housing network machines. For each facility, colour is used to indicate the highest policy status of its machines, shape is used to indicate site type (branch, data centre, etc.) and size is used to indicate the number of machines at the location (on a user-definable scale). Regions are overlaid on top of this. Given our interview finding that the interpretation of parameter combinations can depend on whether a facility is in business hours, this is symbolised for each region using a white or black background (black for night, white for day).
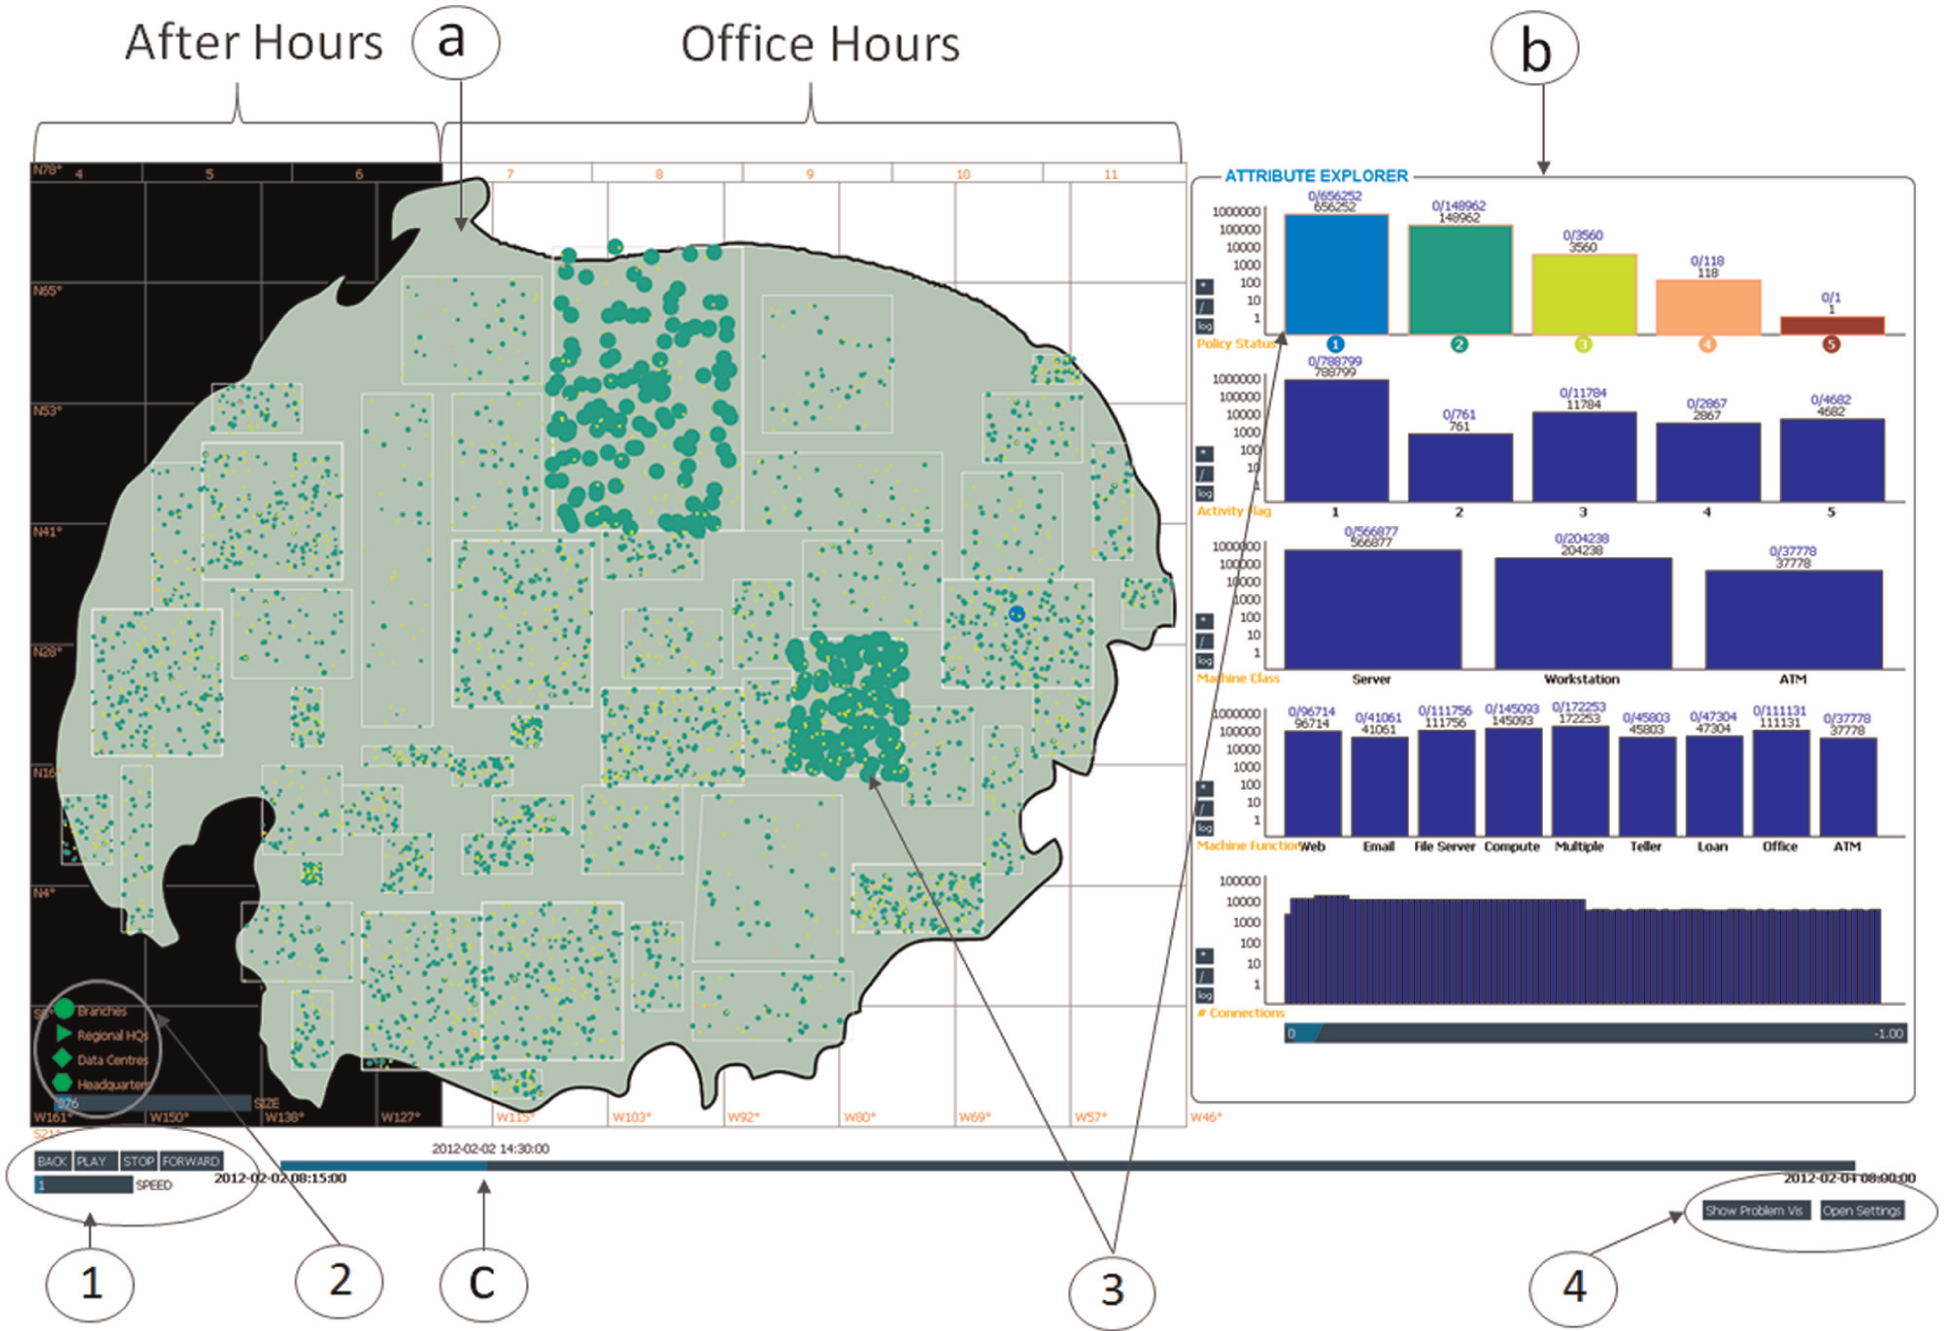
The M-SIEVE application: (a) the spatial window – map of BankWorld with overlays indicating machine locations, (b) the attribute explorer – represents each attribute as a interactive histogram and (c) timeline control – interactive time-bar for accessing specific points in time.
To the right of the interface, we used an attribute explorer (Figure 1(b)).23–25 This shows the distribution of machines over a vertically arranged set of horizontal histograms, where each histogram corresponds to one of the attributes (from top to bottom): policy status, activity flag, machine class, machine function and number of connections. Given the size of the data set, we visualised these parameters on a logarithmic scale.
The elicitation interviews also supported the need for rapid filtering by complex parameter combinations. Selecting a column on a histogram creates a filter corresponding to the associated bin range. Multiple column selections within a single histogram are combined as an OR query. Selections across multiple histograms are combined as an AND query. On selection, the query is automatically executed and the histograms are dynamically updated to show the distribution of values on the new subset. Using multiple coordinated views, 26 updates in the attribute explorer are automatically reflected in the map view. Conversely, regions can be selected within the map to further subset the data.
The interviews also showed how understanding prior states could lead to important differences in interpretation. At the bottom of interface is a time-bar (Figure 1(c)). Clicking on this moves the current time to that point and loads the corresponding status of machines according to the current filter. A play/pause button can also be used to automatically advance through sample points within the data set. The map view and histograms synchronously update at each time point.
Incorporating the CLA
We regarded the CLA as a variable that could provide useful heuristic guidance to a user. However, a significant issue was how to operationalise it in a way that could provide this guidance without constraining the expert from drawing their own conclusions. Ideally, we would have preferred to incorporate the CLA as an additional parameter within the attribute explorer. This way it could be incorporated into the filters or ignored. However, constraints of the VAST competition time frame led us to implement it within an additional live analysis module with a table visualisation. This showed a table of machines currently displayed on the map visualisation, subject to filtering by the attribute explorer or by selection from the map, ordered by CLA (see rightmost column in Figure 2). Using this table, the user can easily identify the Internet Protocol (IP) address, policy status and activity flag of the most severe machines (i.e. higher CLA values).
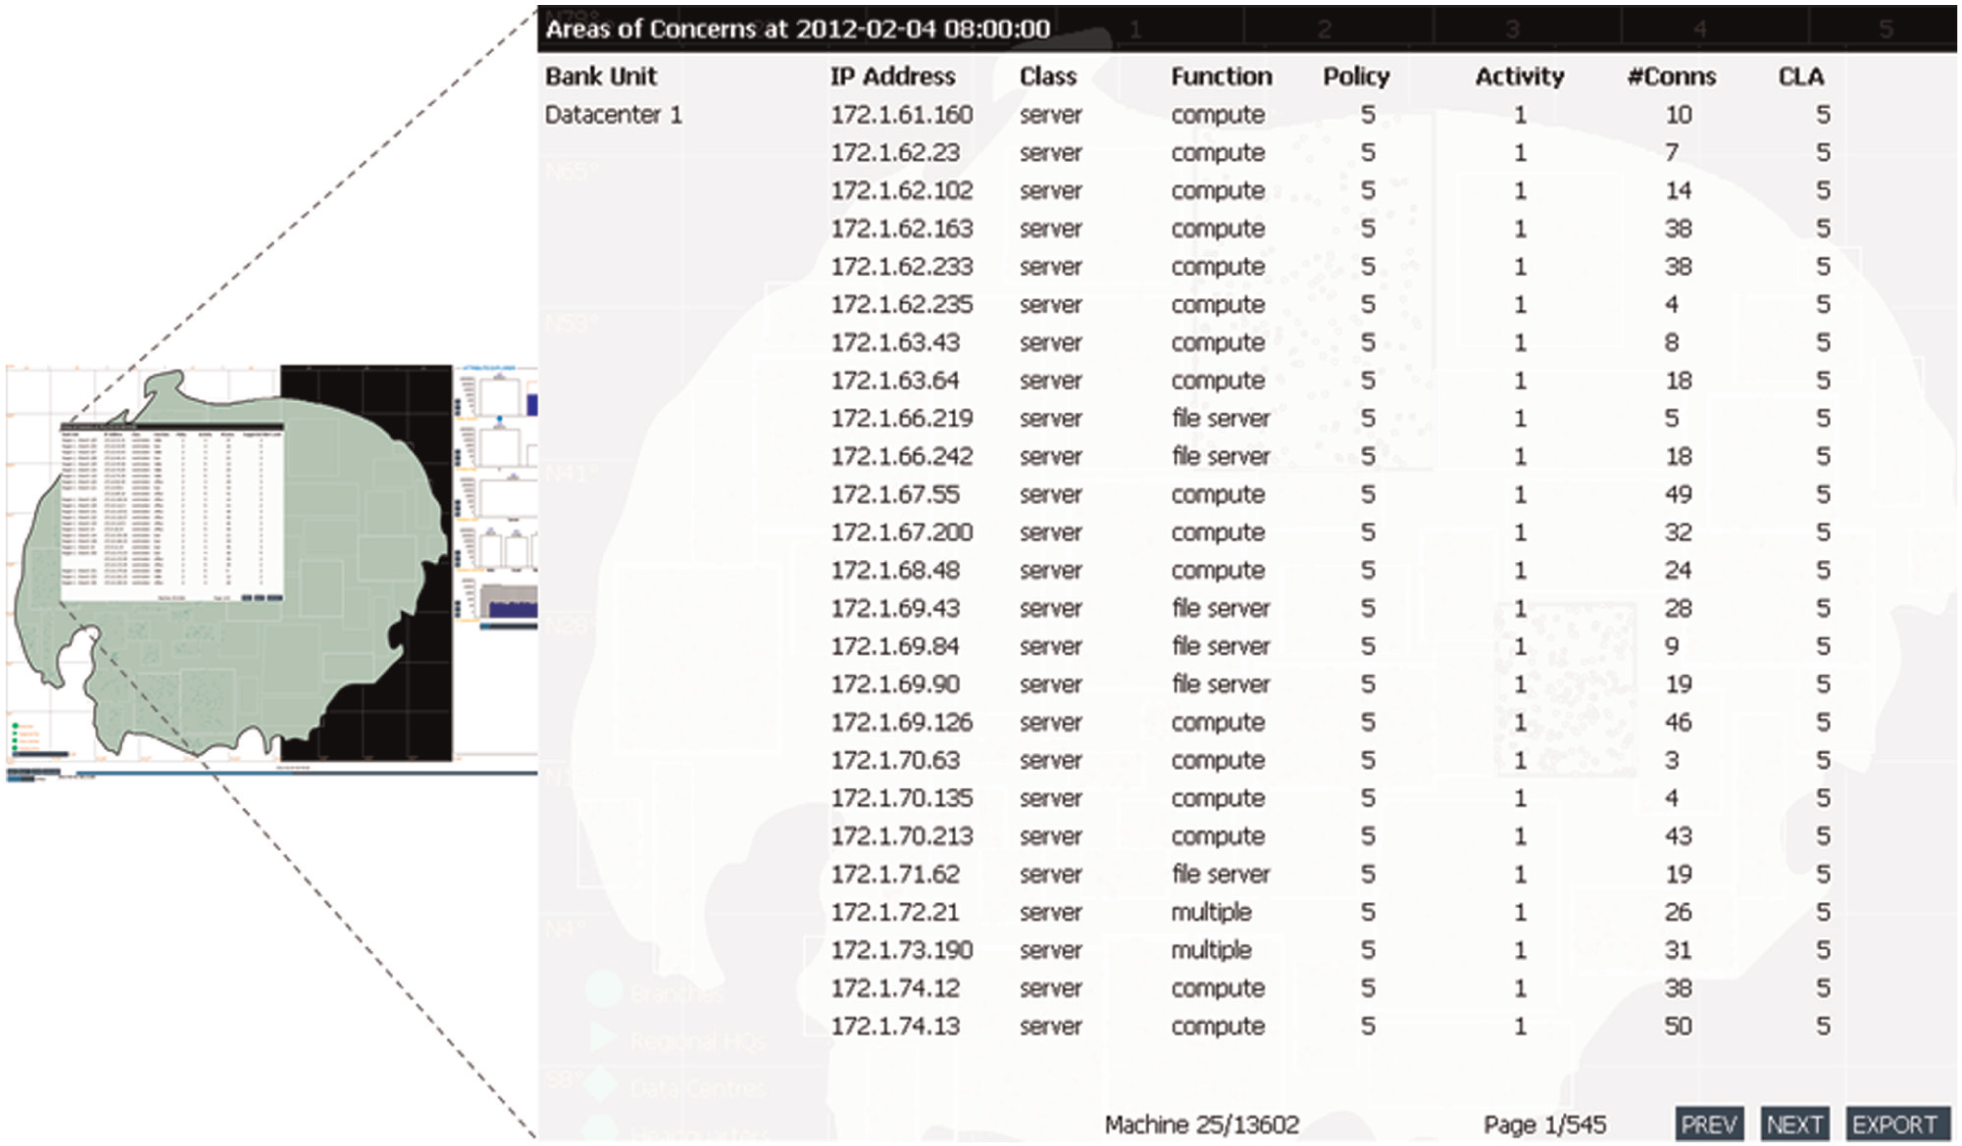
CLA data explorer, individual-level machine information at a single time point shown with the concern level.
This list can be exported as an XML file and read by the treemap viewer (see Figure 3). The treemap has three levels of drill down. At the top level, it displays the distribution of CLA values across the whole network. The user can select any CLA value and drill down to a further treemap, which shows the distribution of facilities with that CLA value. Selecting a facility then opens a further treemap, which shows how all CLA values are distributed across machines in that facility. This allows the user to drill down from a given CLA value to particular machines through different levels of granularity of the network. Logarithmic scaling is used throughout to reduce the effect of low-frequency areas appearing too small.
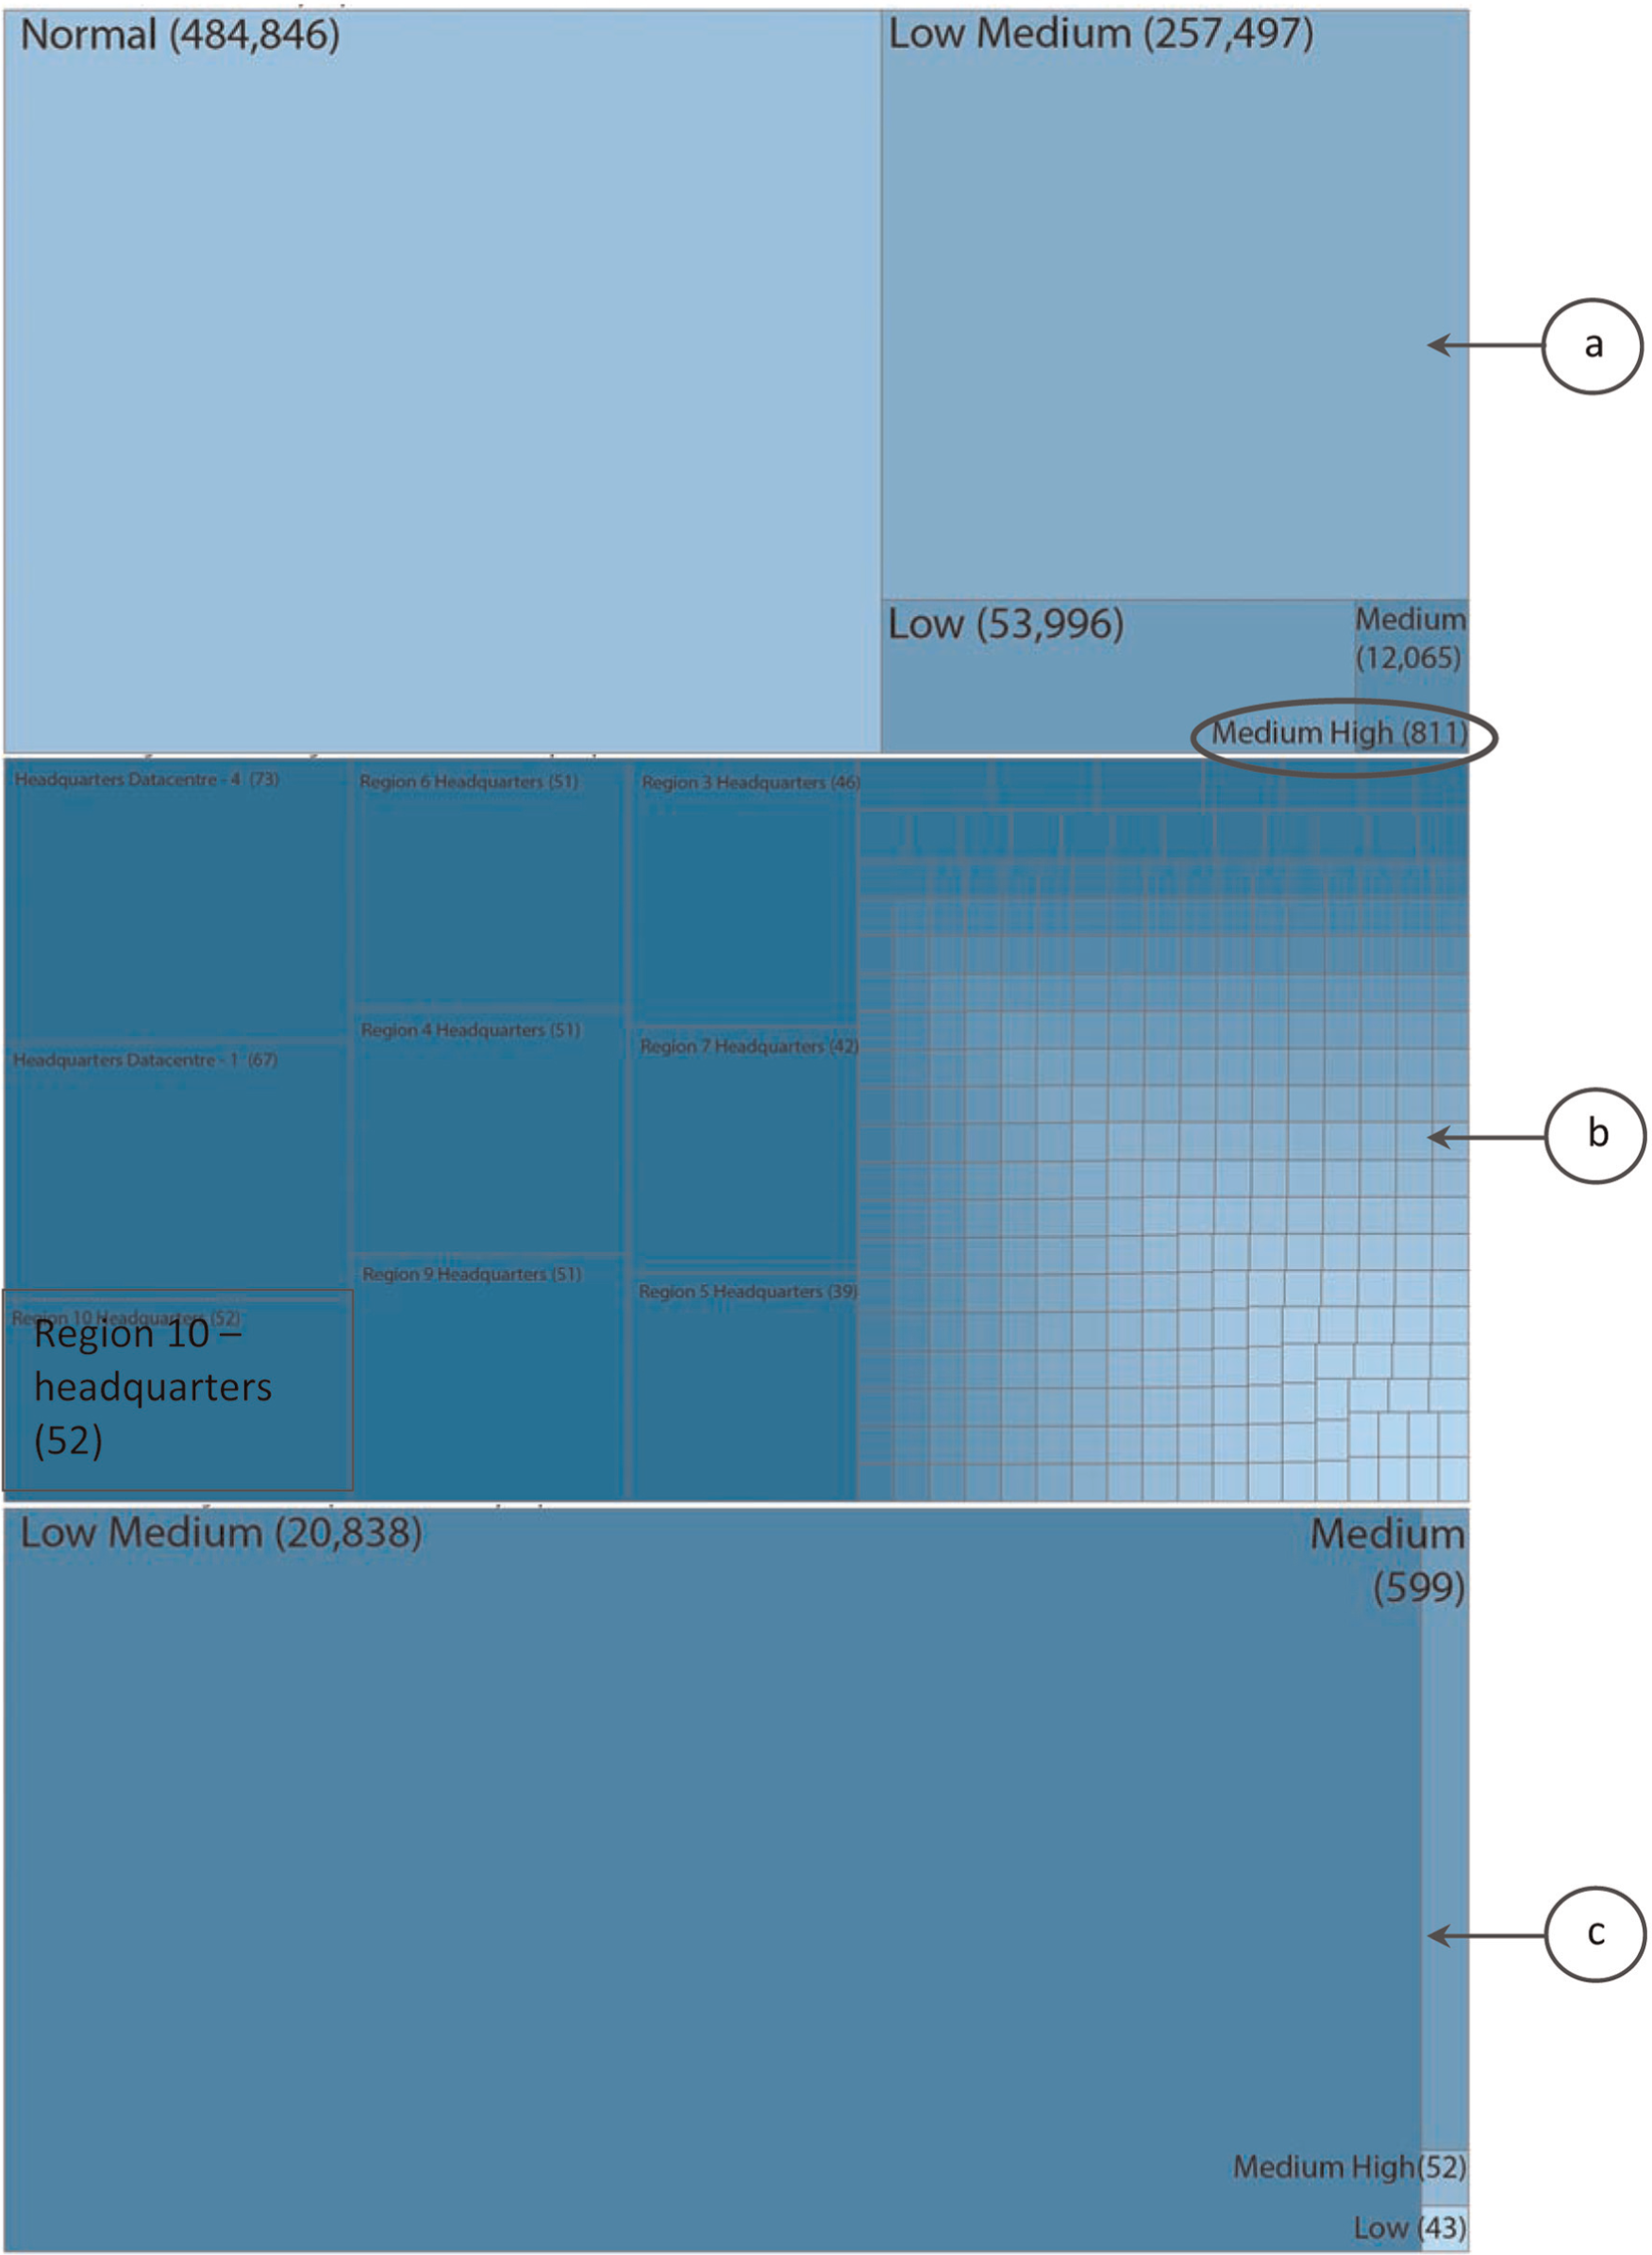
Treemap visualisation showing CLA for 2 February at 2 p.m.: (a) CLA distribution for the entire network, (b) CLA distribution for Region 10 headquarters and (c) CLA medium high (811) distribution across regions/facilities.
The role of the CLA in the VAST assessment
We were interested in the extent to which the CLA would contribute to the VAST assessments and also whether it would dominate over exploration of the raw data. We performed our assessment for MC 1 of the VAST 2012 challenge using M-SIEVE over two sessions. The first was performed by a group of academics with expertise in visualisation; the second was performed by the expert network-security practitioner together with one of cybersecurity academics who participated in the earlier knowledge elicitation exercise. For the assessment, we used a three-monitor set-up (see Figure 4): one showing the main M-SIEVE interface (see Figure 1), one showing the treemap (see Figure 3) and one showing a Microsoft Excel worksheet. The worksheet displayed histograms showing connection frequencies across machine function overall, for a single time point (2 p.m. on 2 February) and in different time zones and office/after hours. The details of the problem and accompanying metadata were provided on printed sheets. The assessment sessions were video recorded and participants were asked to think aloud.
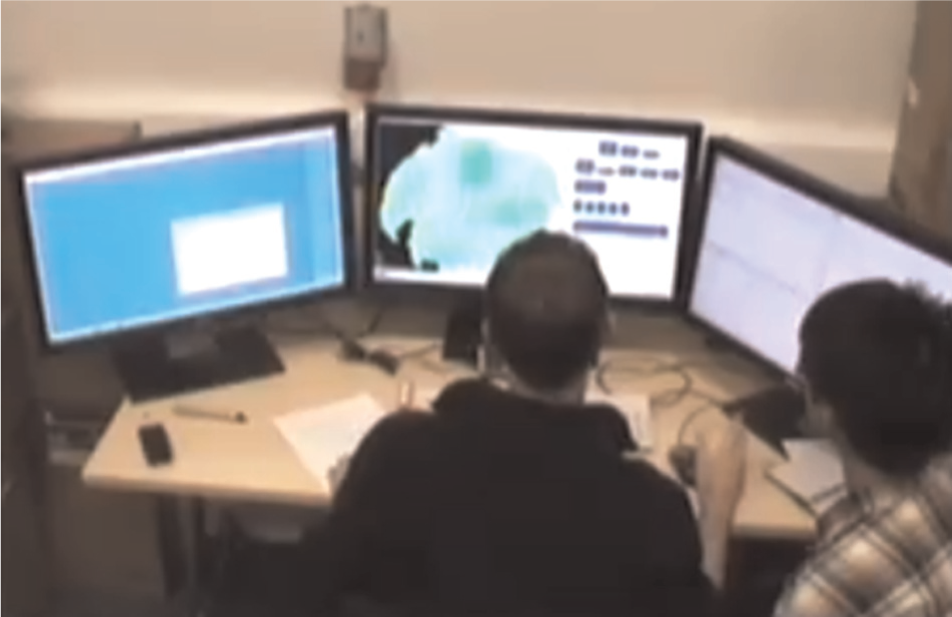
The M-SIEVE set-up for the assessment in the usability lab.
Analysis
We segmented the video data by periods in which the different anomalies that we reported were discovered and coded these for the extent to which the outcomes could be explained in terms of use of the CLA, visual exploration (of raw data) or both. Coding was determined by the observation of onscreen interaction with the CLA or the visualisation and also where these were discussed. The analysis was interpretive, based on a small sample and no controls were used; however, we consider the results indicative and useful.
Contribution of the CLA
Results of the qualitative analysis are summarised in Table 5 (MC 1.1) and 6 (MC 1.2). For each anomaly in the data, Table 5 shows whether or not it was discovered, and if so, whether this was attributed to use of the CLA, to visual interaction with the raw data (Viz) or both. Where items in the ‘discovered’ column are marked with an asterisk, the anomaly was not intentionally placed in the data set but was subsequently acknowledged as significant by VAST submission reviewers. Where the ‘discovered’ column is marked with a double asterisk, the anomaly was not intentionally placed in the data set and was not subsequently acknowledged as significant by the submission reviewers (but it nevertheless occurred).
Summary of the qualitative analysis of reports for MC 1.1.
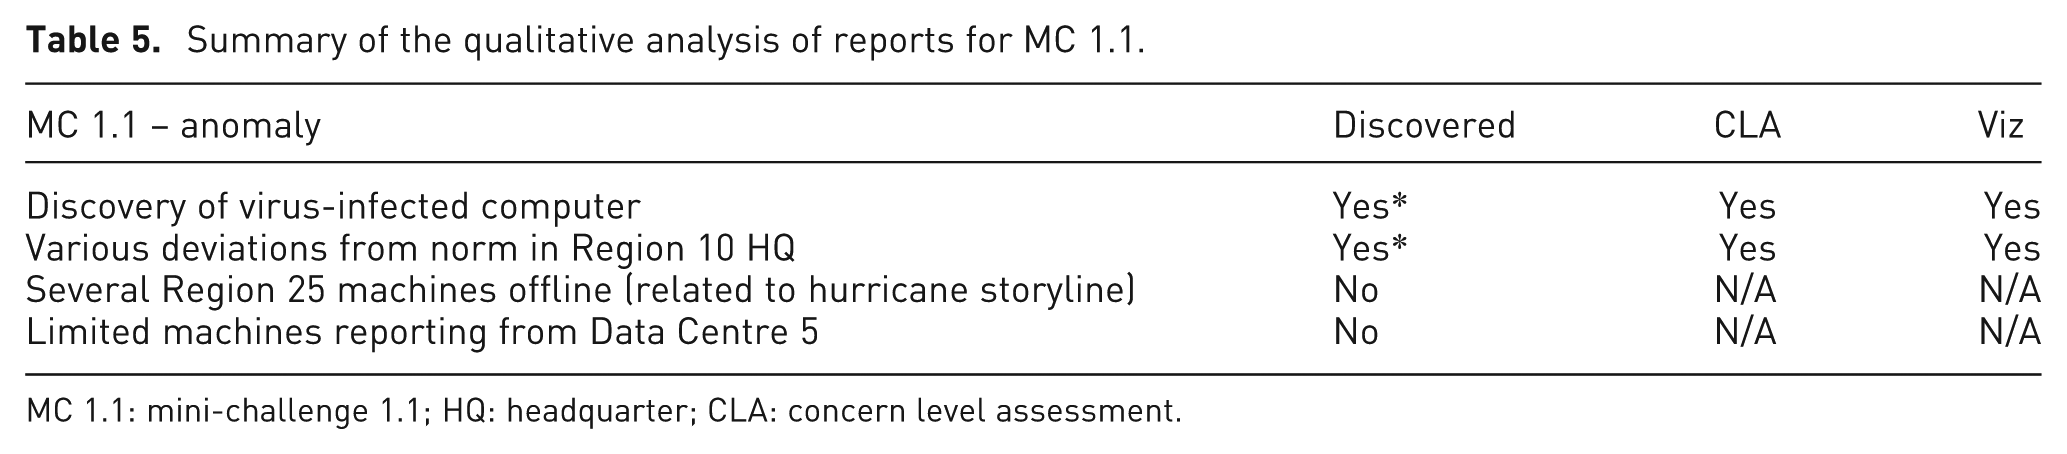
MC 1.1: mini-challenge 1.1; HQ: headquarter; CLA: concern level assessment.
Summary of the qualitative analysis of reports for MC 1.2.
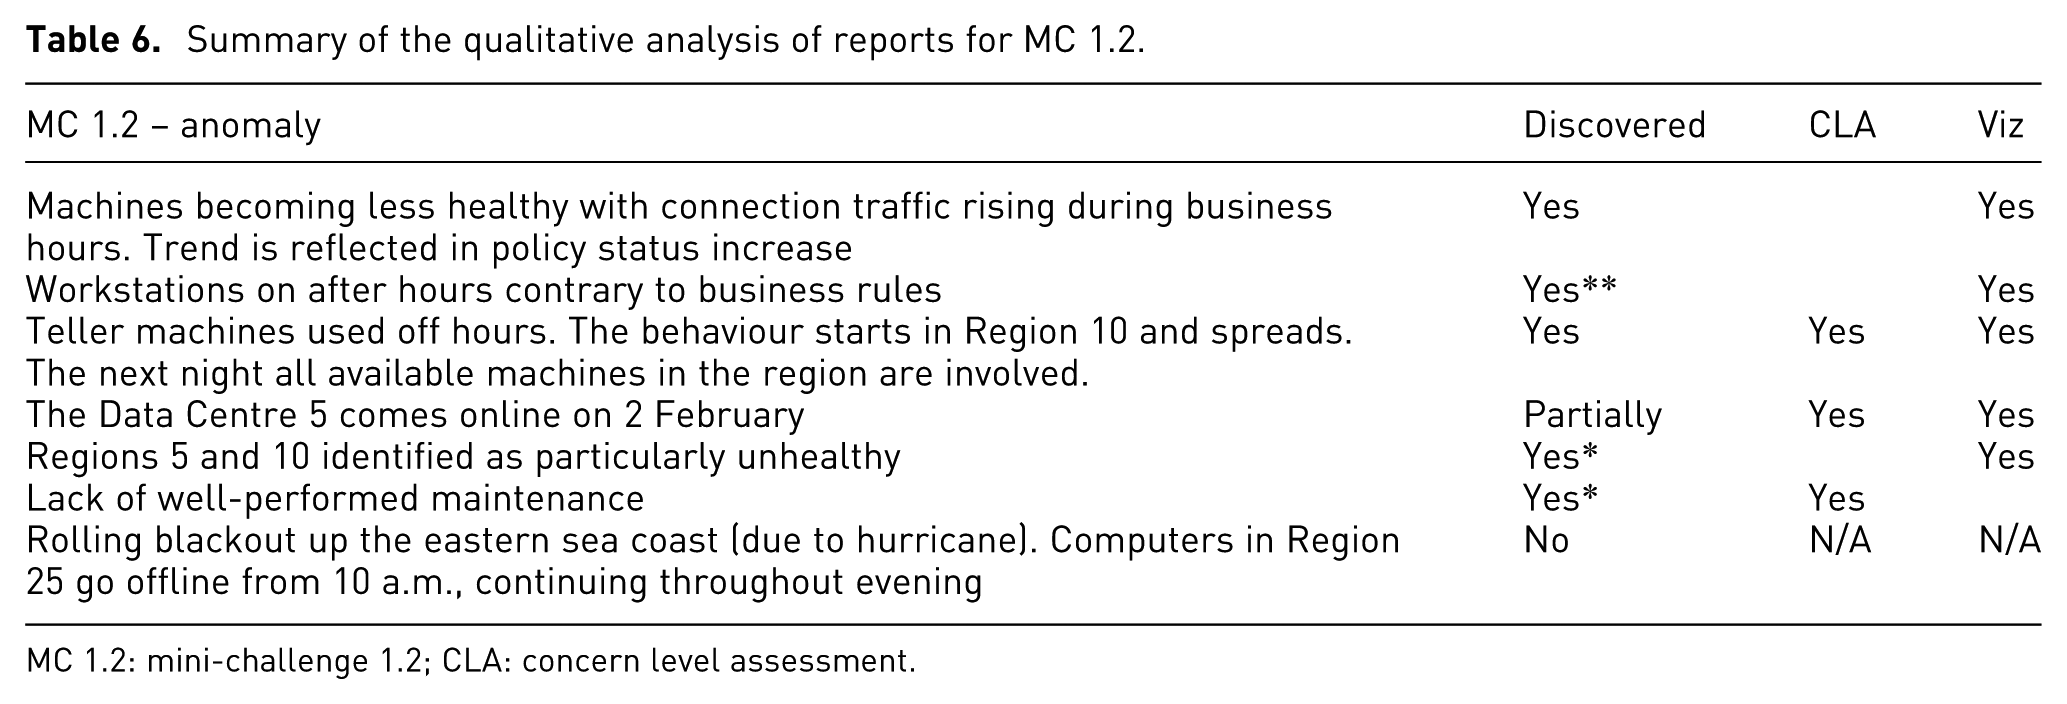
MC 1.2: mini-challenge 1.2; CLA: concern level assessment.
The summaries show that using M-SIEVE, our assessors discovered a total of eight significant anomalies – two for MC 1.1 and six for MC 1.2 (of which one was partially discovered). Of these, four were discovered using the CLA and raw data visualisations in combination, one was discovered using the CLA alone and three were discovered just the raw data visualisations.
In the following, we begin to describe in detail how the CLA contributed to the discovery of the first two anomalies we reported for MC 1.1 (acknowledged subsequently by reviewers as significant) and some related phenomena.
At 2 p.m., 2 February, there was only one machine at CLA 5. This was a machine in HQ datacentre-2 in Region 36, which had a virus infection (the anomaly). However, at that time, 811 machines were classified as CLA 4. For some machines, this is due to a high policy status, while for others it was due to a combination of activity flag and/or the number of connections for the machine type. For example, one web server had activity flag 4 and a statistically high number of connections for a web server. This can indicate a denial-of-service attack.
At this time, 12,065 of the machines were at CLA 3. For the majority, this was due to a policy status of 3, and for the remainder, this was due to a combination of activity level, number of connections and machine type. For example, some servers in the Region 10 HQs were rated CLA 3 due to the number of login failures. These are expected for workstations but not for servers. None of the Region 10 HQ machines were rated as CLA 0. For the majority, the CLA value is 1, but we determine that the facility as a whole is a cause for concern.
These results are encouraging. They show that the CLA played an active part in supporting the assessments that were made as part of our response to the VAST challenge. But they also show that while the CLA supported assessment and was solely responsible for one assessment, it did not do so at the expense of exploration of the raw data. Indeed, three assessments were attributed to exploration of the raw data only.
Discussion and conclusion
In this article, we have explored an approach to developing a visual analytic system for supporting situation awareness in a network-security context. Solutions to this problem, we argue, are aggravated by the need to support user exploration and interpretation while dealing with problems associated with the amount of data that can be reported concerning activity in large networks. Current IDSs employ automated detection and thus encode relevant expert knowledge. A visual analytics solution places more emphasis on user exploration and knowledge, but large amounts of data might make significant signatures and patterns difficult to find.
We propose a hybrid approach. In developing this approach, we performed a series of elicitation interviews with domain experts. We used a matrix to encode abductive inferences that might explain different parameter combinations. We learned that this was a useful technique since during interviews, it enabled our expert practitioner to focus attention on individual judgements in a systematic way, and by forcing the judgement of the practitioner, we were able to understand the inferences that were made and answer questions about the parameters that were useful. Some parameter combinations were ambiguous, particularly for deciding between competing plausible explanations where benign explanations competed with the less benign. By mapping out and extending the represented parameter space, we were confident that the results of the interviews were reasonably accurate and exhaustive. Indeed, the matrix evolved iteratively through a series of interviews, which culminated with the satisfaction of the expert practitioner that we had successfully captured his insights.
This exercise resulted in an understanding of how parameter combinations might be interpreted and which parameters were important, including some that were calculated from the raw data. From the early interviews with the expert practitioner, we also derived a way of discussing the severity of parameter combinations through a numerical scale, which we referred to as the CLA. The CLA was a subjective assessment that aggregated interpretation, plausibility and utility. Offered initially by the expert, it became the de facto currency of the interviews. Given its origins with the practitioner, we assume, if not an in vivo concept, it is at least intuitive.
For the academic experts, the presentation of a rule set perhaps belied the idea that it would be incorporated into a hybrid system that would be designed to support free-form exploration of the parameters in addition to incorporating an automated alerting system. This is perhaps a question of presentation. On using the final system, they appreciated the ability to use the complementary strategies of exploring the data or using the CLA.
Ultimately, the CLA was incorporated into M-SIEVE as an additional view using a treemap. Some problems remained unresolved following implementation relating to scaling the CLA data in ways that balanced usability with accurate interpretation. Moreover, the use of an additional view for the CLA left it standing outside of an integrated workflow to some extent. Given the context of the competition, limited time meant that we were not able to fully integrate the CLA to the extent we would have liked. Given more time, we could have added it as an additional overlay on the main view and as an additional histogram in the attribute explorer.
Given the need to monitor very large amounts of data in many analysis scenarios and the problems of managing the limited resource that is analyst’s attention, we see a future in finding ways to effectively combine automated detection with dynamic visual interaction. Analysts seeking situation awareness need systems that can show them where problems exist while giving them the freedom to explore data and reach their own conclusions, perhaps based on contextual factors that are known only on the ground. In future work, we intend to explore this design balance further as a potentially promising research direction.
Footnotes
Funding
This research received no specific grant from any funding agency in the public, commercial or not-for-profit sectors.