



Abstract
This work reports on the results of the Clean Sky WENEMOR project which has conducted an extensive experimental investigation of installed contra-rotating open rotors on a scale model of an advanced regional aircraft configuration. The tests were conducted in the Pininfarina Wind Tunnel, Italy and the data used for this analysis were taken from a linear far-field array of microphones. The contra-rotating open rotors were operated in pusher and tractor modes with approach and takeoff settings for revolutions per minute and thrust. Realistic modern blade profiles were supplied and utilized through the Clean Sky Green Regional Aircraft program. A range of airframe geometries was tested which included interchangeable tails, engine pylon elongation, engine pylon rotation, and variable wing to engine distance. Changes in the contra-rotating open rotor noise emission to the far field as a function of flow speed, angle of attack, and airframe geometry were clearly identified. The influence of airframe geometry on contra-rotating open rotor tonal content, directivity, and broadband levels is reported for emission angles from
Introduction
Throughout the 1980s significant research was conducted on a new propulsion technology, at that time referred to as prop-fan, with the objective of significantly reducing fuel consumption. 1 The technology was successfully flight tested but never widely applied partly due to excessive noise emissions. In recent years research has begun on a new generation of the propulsion system referred to as contra-rotating open rotors (CRORs) with the aim of achieving the already demonstrated reduction in fuel consumption combined with a reduction in noise emissions to address this additional environmental concern. Modern advances in aerodynamic design tools have made possible the development of open rotor systems with decreased noise emissions while maintaining their fuel burn advantage. This achievement has resulted in a better reception of the updated technology; however, optimal acoustic performance has still not been achieved. Numerous unanswered questions exist regarding optimum blade profiles and the interactions between the front and rear blade planes. Equally complicated to model are installation effects which can include the shielding and reflection of sound waves by the fuselage, wings, and empennage as well as the influence of the wing and pylon wake on rotor ingestion. Large-scale testing of open rotor systems is still necessary therefore to accurately assess open rotor systems.2–4
The wind tunnel tests for the evaluation of the installation effects of noise emissions of an open rotor advanced regional aircraft (WENEMOR) project was developed in response to the requirements of the European Clean Sky Joint Technology Initiative to assess the aeroacoustic noise emissions for an advanced regional open rotor aircraft configuration. The project was coordinated by Trinity College Dublin and included six other partners, namely Università Politecnica delle Marche, a large European wind tunnel facility (Pininfarina) and several small-medium enterprises (Eurotech, Teknosud, MicrodB, and Paragon S.A.) with specific competencies in design, manufacture, noise measurement, and data analysis. The project utilized a proposed design for an advanced regional aircraft configuration, developed within the Clean Sky Green Regional Aircraft (GRA) project, for the model geometries with realistic modern blade profiles for the propulsion system.
There were two test campaigns in the WENEMOR project which focused on the pusher and tractor engine configurations for both a single semi-isolated CROR engine which was “installed-on-pylon” and also for two CROR engines installed on a variety of airframes as reported in this work. Eret et al. 5 have reported on experimental results for the installed-on-pylon single CROR campaign. This engine simulator was identical to those utilized in this work. The pusher configuration performs quieter at approach than at takeoff and the overall trends show the efficient on-axis radiation with the tones at 2*BPF (blade passing frequency) dominating downstream of the CROR. In the tractor configuration, the influence of the fundamental BPF tone is reduced since the pylon is installed downstream of the rear rotor. Additional noise sources above those of a true isolated configuration arise as (i) the rear rotor wakes impinge on the pylon and (ii) the pylon potential effects induce once per revolution loading fluctuations on the rear rotor blades. The comparisons of the acoustic emissions of the pusher and the tractor configuration tested at the same flow velocities and angles of incidence favor slightly the tractor configuration at 2*BPF which are the dominant rotor tones when ignoring the influence of the pylon. These experimental results are being utilized by GRA partners to develop and validate numerical codes for CROR noise prediction with initial results recently reported by Sanders et al.6,7 The more recent paper by Sanders reviews the literature for installation effects.
Numerous recent studies have investigated CROR noise emission for isolated and installed engine tests at model scale.8–11 Furthermore, wind tunnel investigations with installed engine simulators in the presence of shielding surfaces 2 and scale model airframe geometries have also been conducted.12,13 The potential benefits of CROR have attracted large-scale investment and significant experimental and numerical research.
At cruise, the key noise source is quadrupolar in nature, 14 due to the flow compressibility and the shocks that occur because of the tip relative transonic Mach numbers, and the rotor-alone tones dominate the CROR spectrum. At low-speed conditions, rotor–rotor interaction noise, due to aerodynamic interference, affects significantly the noise signature. Peters and Spakovszky 15 have dissected and quantified the individual underlying noise mechanisms in combined computational fluid dynamics (CFD) and computational aeroacoustic analysis. Their work reported the principal mechanisms responsible for the CROR interaction noise that can be attributed to the following flow features: (i) rear-rotor upstream influence interacting with the front rotor, (ii) tip vortices shed from the front rotor interfering with the rear rotor, (iii) front-rotor viscous wakes affecting the rear-rotor loading, and (iv) front-rotor hub wake and hub boundary layer influencing the rear-rotor hub loading.
This paper will outline the airframe designs and experimental facilities, establish that the noise emission from the baseline configurations is as would be expected from literature, and then investigate the influence of the airframe configuration on the tonal and broadband noise emission to the far field. The airframe configurations will be ranked under various metrics and conclusions drawn as to the best performing airframe design.
Model design
The WENEMOR project16–18 designed, manufactured, and tested a 1:7.5 scale model of the proposed open rotor aircraft. The model consisted of a modular design featuring interchangeable tailpieces, variable fuselage length, engine pylon rotation and elongation and was controllable for angle of attack. The model was designed for aeroacoustic measurements in an open test section of a large low-speed wind tunnel for a wide-ranging set of configurations. The aircraft configurations were tested complete with two installed CROR engine simulators operated in both pusher and tractor modes. In pusher mode, the blade planes are downstream of the engine pylon and in tractor mode, they are upstream of the engine pylon.
A total of 16 aircraft configurations were tested consisting of nine pusher and seven tractor configurations. Each aircraft configuration could, in turn, be modified to a takeoff or approach setting through alteration of the blade pitch, engine RPM, and the airframe lifting surfaces. Tables 1 and 2 provide a summary of the variety of model geometries tested. The geometric details are expressed in terms of engine propeller diameter. The engine pylon angles are relative to the horizontal plane with 90° corresponding to directly below the fuselage, which is inverted in the wind tunnel, and so 90° corresponds to vertically upwards in the tunnel. The fuselage length could be varied to investigate the effect of wing to engine distance. In order to maintain an equal distance from wing to the engine front blade plane for the tractor configurations, the fuselage is extended by 0.4D (D is front and rear rotor diameter) compared to the equivalent pusher configuration.
Aircraft model pusher configuration geometries.

Aircraft model tractor configuration geometries.

The baseline configurations are referred to a PS-A and TR-A for the pusher and tractor configurations, respectively. Figure 1 shows the orientation of the model in the wind tunnel without engines. In addition to varying the fuselage length and engine pylon, a number of different tail types were applied to the model. Figure 2 shows the various pylon angles and lengths and the tail types used for the pusher configurations. These are equivalent for the tractor configurations with the engine simulators mounted in tractor mode. A fourth tail, not shown in Figure 2, which consisted of an alternative T-type was used on PS-D2 and TR-D2. Figure 3 shows the TR-EL model configuration installed in the Pininfarina Wind Tunnel facility.
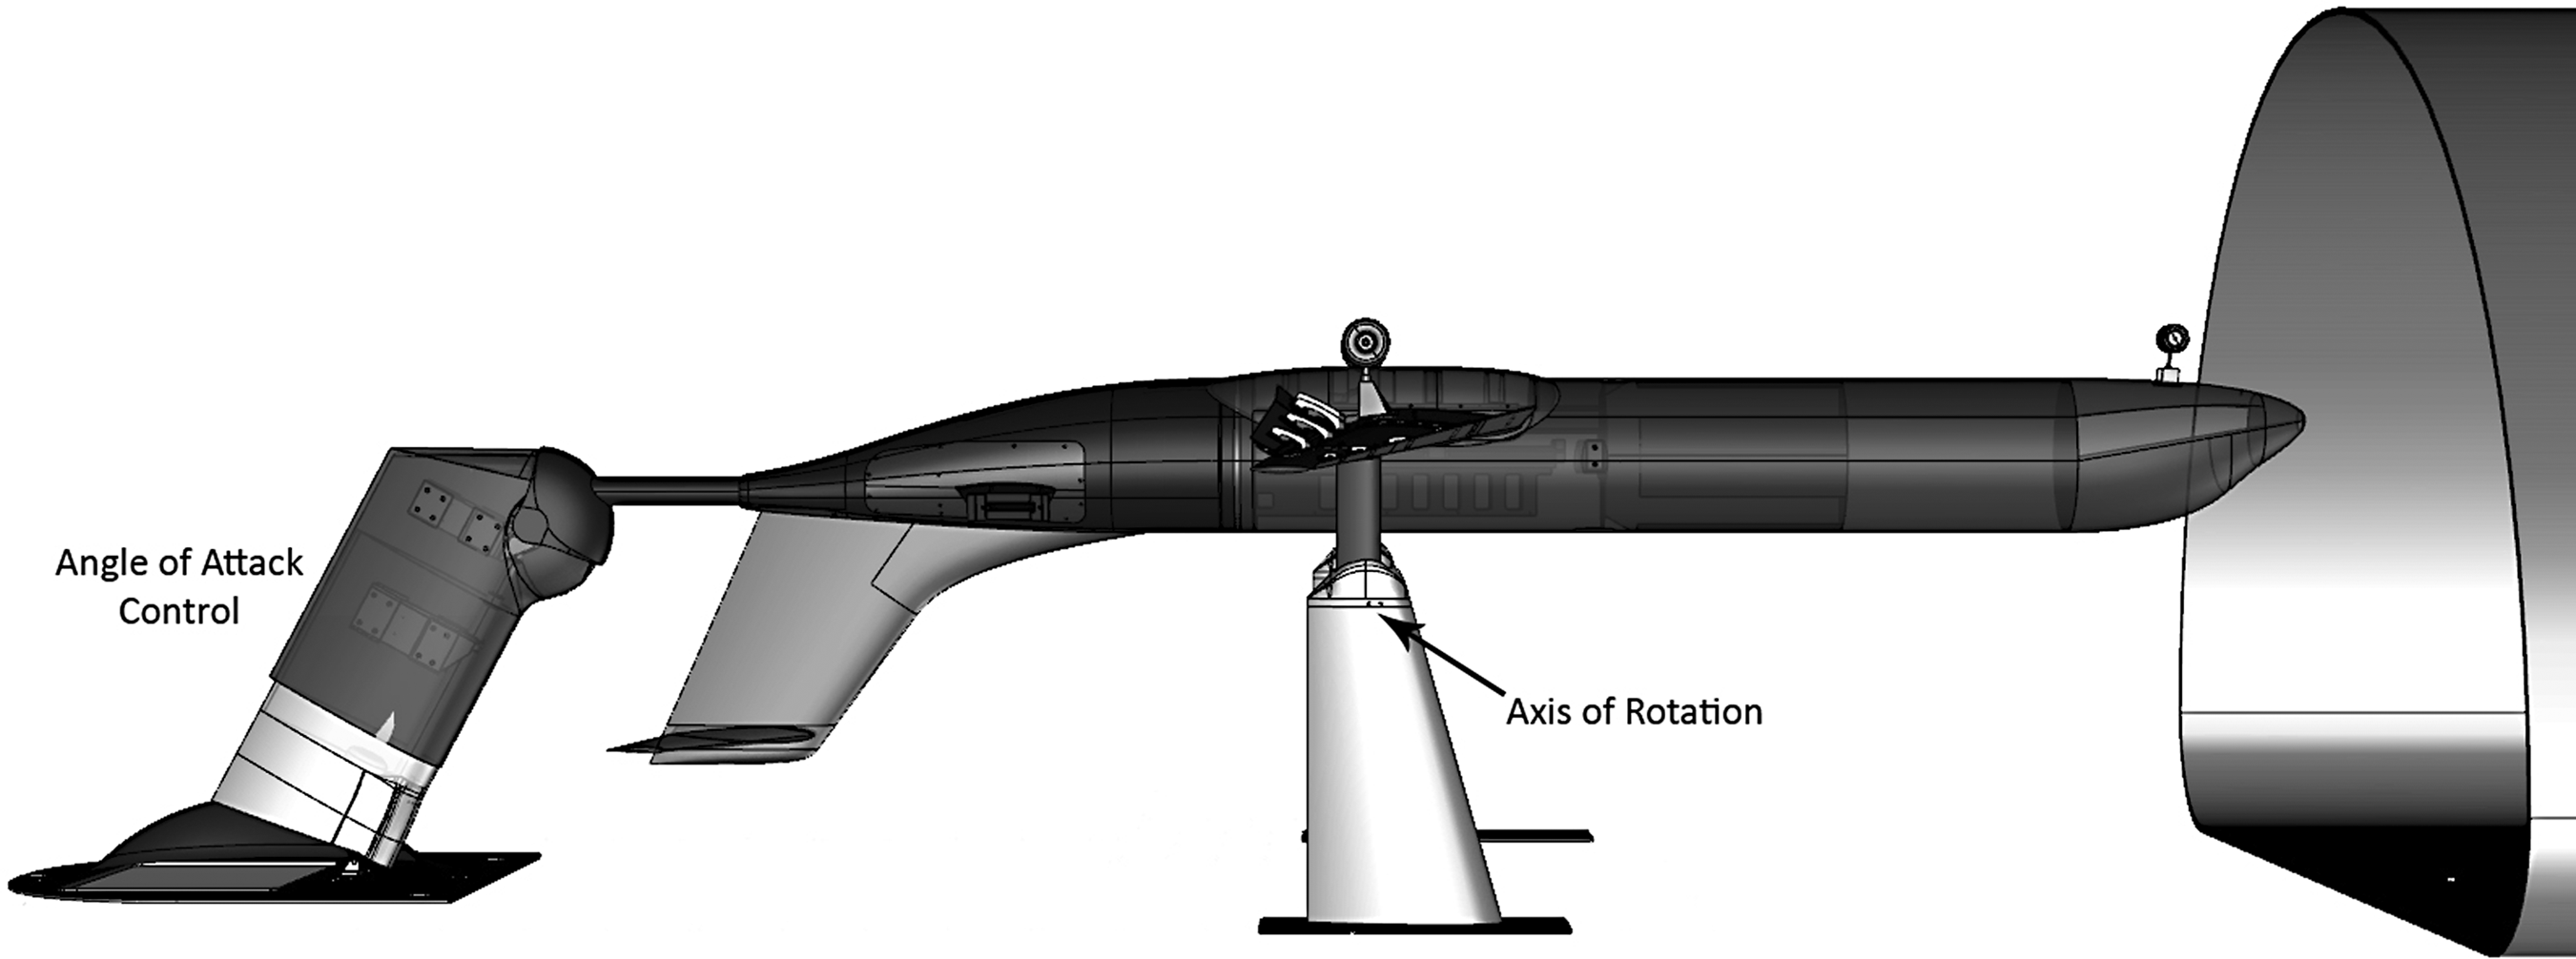
Model geometry PS-A configuration.

PS configurations: T-tail, L-tail, and U-tail; pylon angles; and pylon length.

Model geometry TR-EL in Pininfarina Wind Tunnel (linear far-field array visible in top right).
The design of the CROR features two planes of 12 blades. These are driven by a single electric motor and gearbox. This, therefore, produced exactly equal rotation speeds in the front and rear blade planes. Both left and right engines were driven from a single power supply with one RPM control system per engine. There was, therefore, no core flow through the engine and aerodynamic end caps were designed for the nacelle housing. The gearbox featured a spiral bevel gear system chosen for its low noise design. The engines featured a blade pitch control system which allowed the engine thrust to be calibrated experimentally for both takeoff and approach setting prior to installation in the Pininfarina facility. Calibration took place in a separate open-section wind tunnel prior to the test campaign and was conducted by the WENEMOR partner Eurotech. The engine utilized realistic, modern blade profiles that were provided through the GRA partners and were designed by Safran Aircraft Engines. The operating conditions of the engine simulators were specified by the GRA partners and delivered to the WENEMOR consortium under a confidentiality agreement and can therefore not be reported in detail here. A target RPM as a function of flow speed as well as a target apparent thrust value as a function of RPM was provided. The wind tunnel flow speeds for takeoff and approach conditions were chosen through Strouhal number scaling of the estimated flight conditions of the full-scale aircraft. Using the chosen wind tunnel flow speeds and the resulting engine RPM the target apparent thrust was achieved through experimental calibration of the blade pitch angle. The engine diameter is 0.5 m and engine RPMs for approach and takeoff setting were 2175 and 2359 r/min, respectively. The resulting blade tip speeds are 56.9 m/s for approach settings and 61.75 m/s for takeoff settings.
A single-engine nacelle also housed slip ring connectors for instrumentation connections to Kulite sensors embedded in the front and rear blade planes. Figure 4 shows the installed engine in pusher and tractor modes for configurations PS-EL and TR-EL.
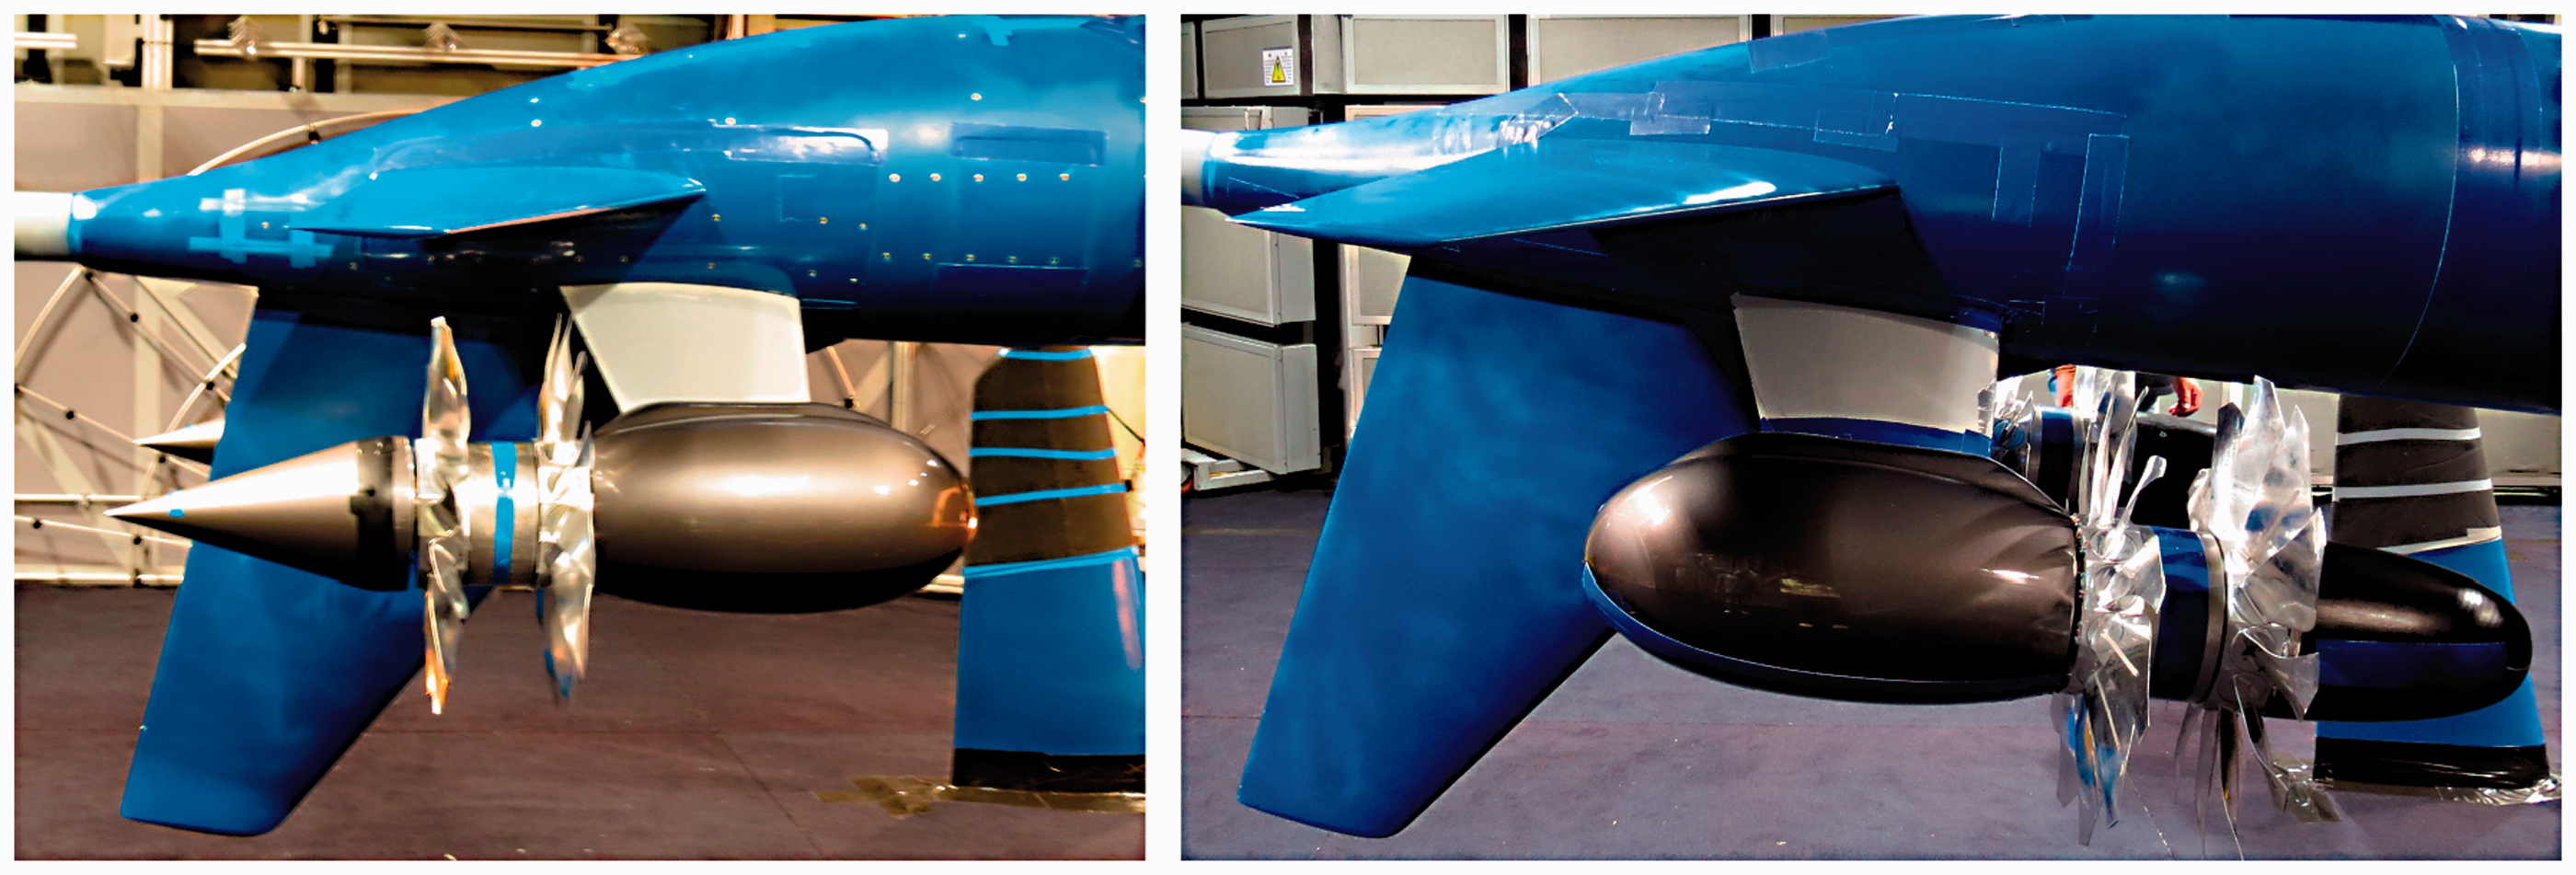
Installed CROR engine in pusher and tractor configurations—PS-EL and TR-EL.
Using automated systems in the wind tunnel each of these setups was then tested at a variety of angle of attack settings and flow speeds, summarized in Tables 3 and 4. This led to a total of 162 unique test setups for the pusher configurations and 126 unique test setups for the tractor configurations.
Approach wind tunnel and model angle of attack settings.

Takeoff wind tunnel and model angle of attack settings.

Experimental facilities
All tests were conducted at The Pininfarina Aerodynamic and Aeroacoustic Research Center in Turin, Italy. This facility contains a test section 8 m × 9.6 m × 4.2 m which is shown in Figures 5 and 6 along with the installed model and microphone arrays. Acoustic treatment of the wind tunnel has reduced background noise to 68.5 dBA at a flow velocity of 100 km/h and 77.7 dBA at 140 km/h (measured out of flow). The tunnel produces a very uniform velocity flow which varies by only 0.5% over the area of the test section with a turbulence intensity of 0.26%.
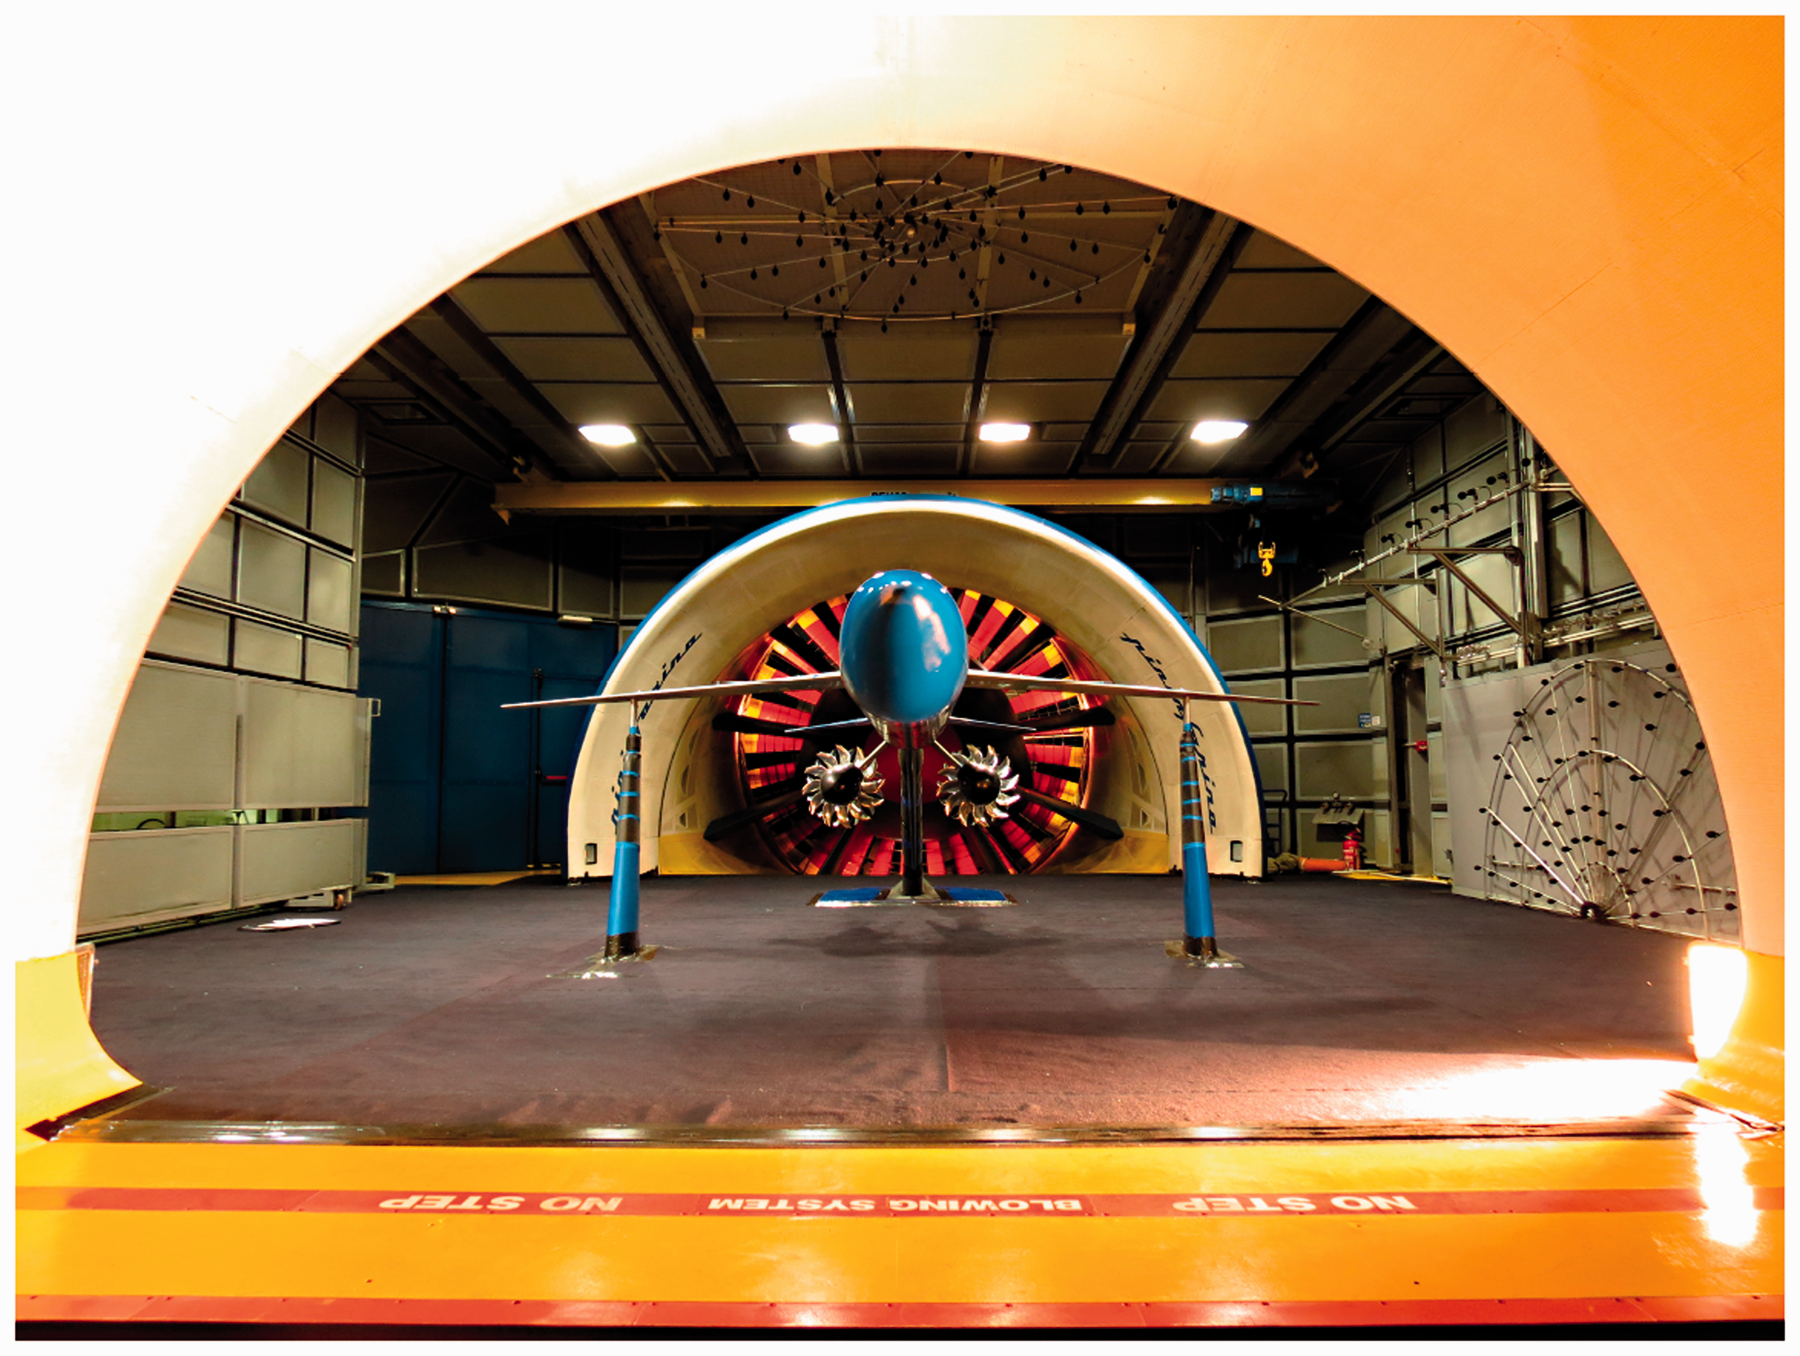
Pininfarina Wind Tunnel facility (including front and lateral microphone arrays).
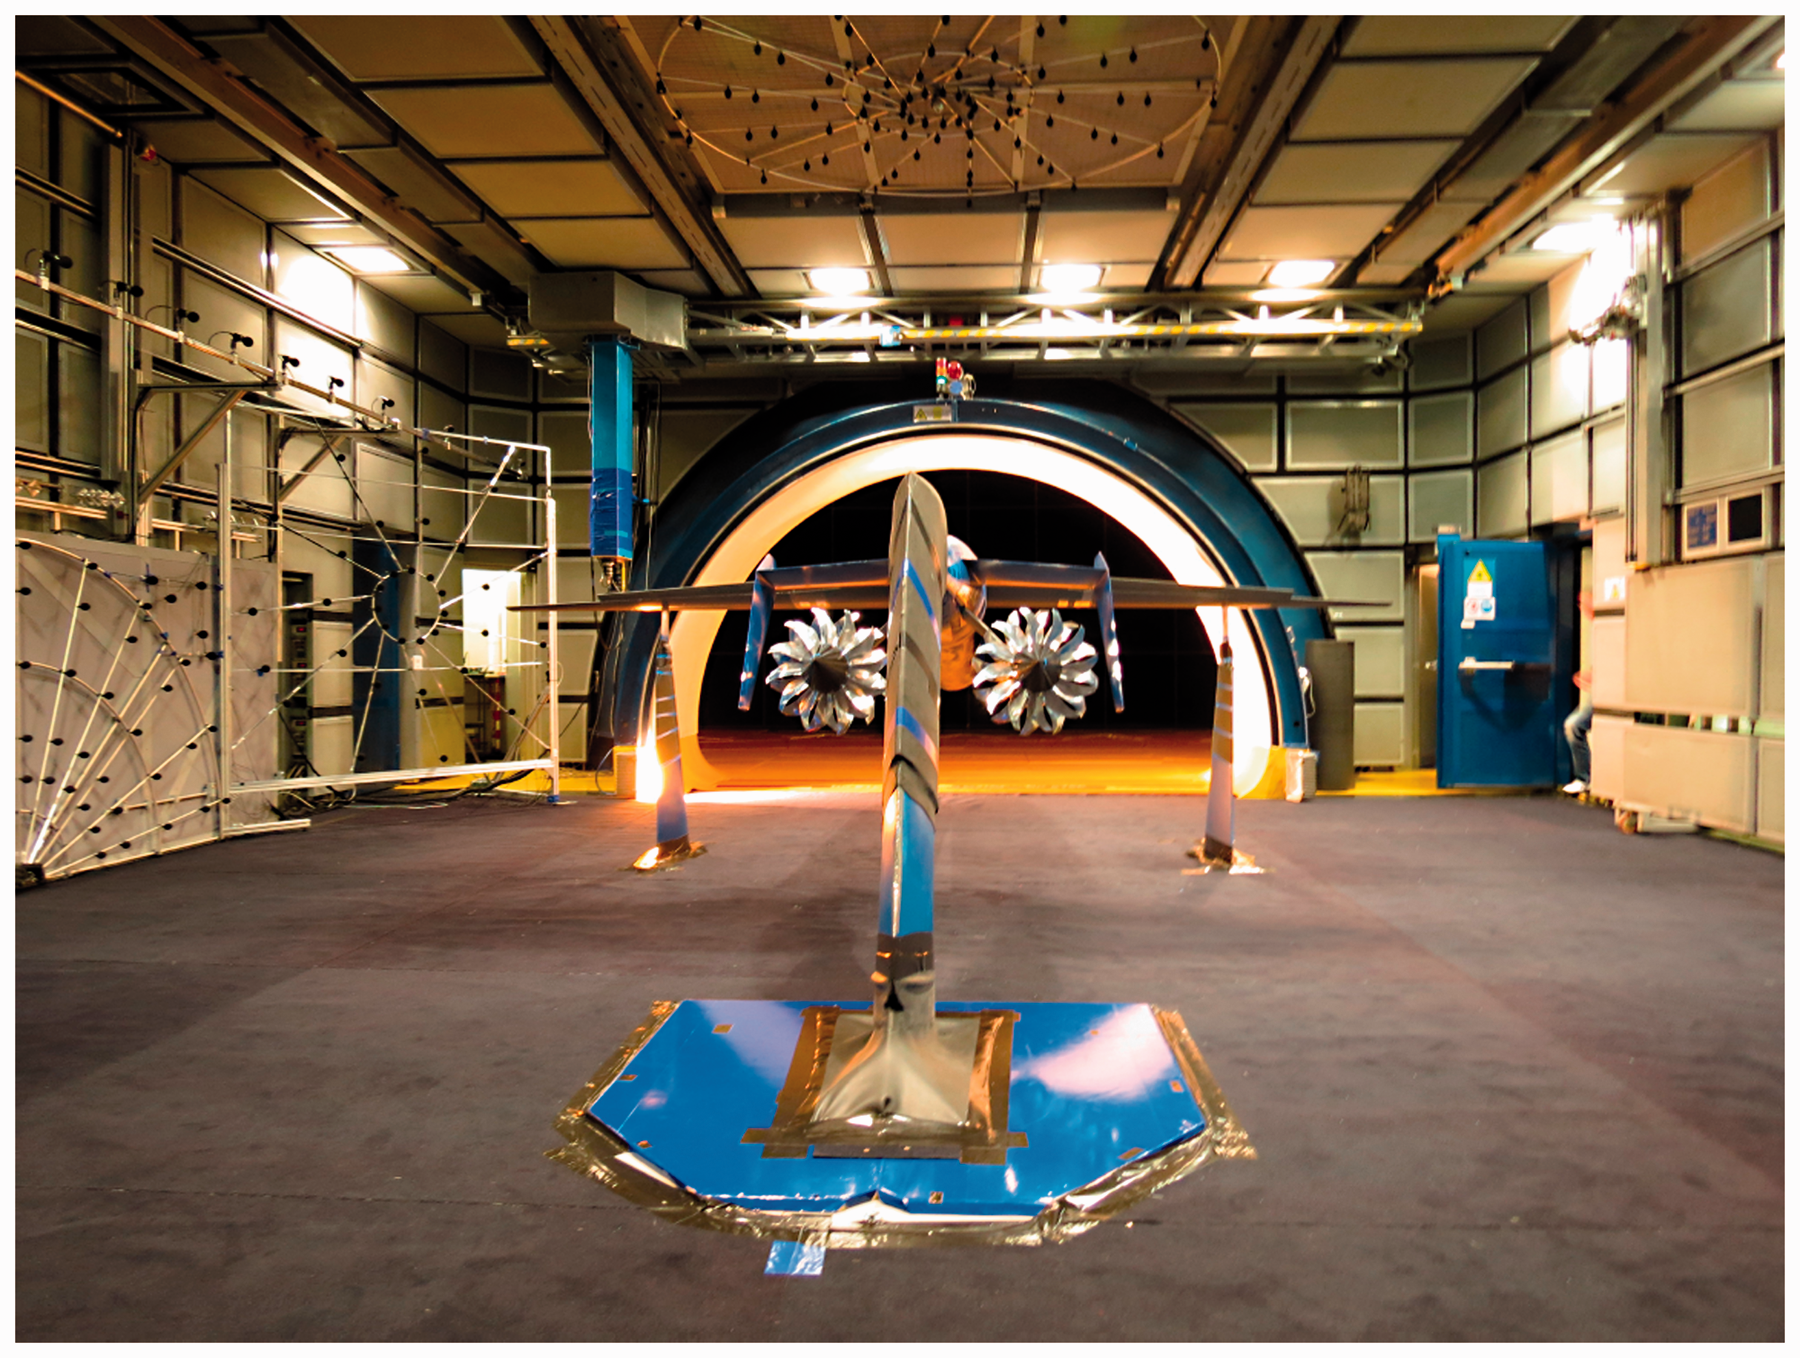
Pininfarina Wind Tunnel facility (including front and top microphone arrays).
A considerable array of instrumentation was deployed for each of these test setups and the linear far-field array was chosen for use in this work in order to allow a clear presentation of the results. The linear array covered angles from

Nominal far-field linear array positioning expressed in terms of engine diameter. Flow is from left to right.
Linear far-field array sensor positions expressed in terms of engine diameter (D).

X origin: front blade plane; Y origin: airframe Centerline; Z origin: WT floor height.
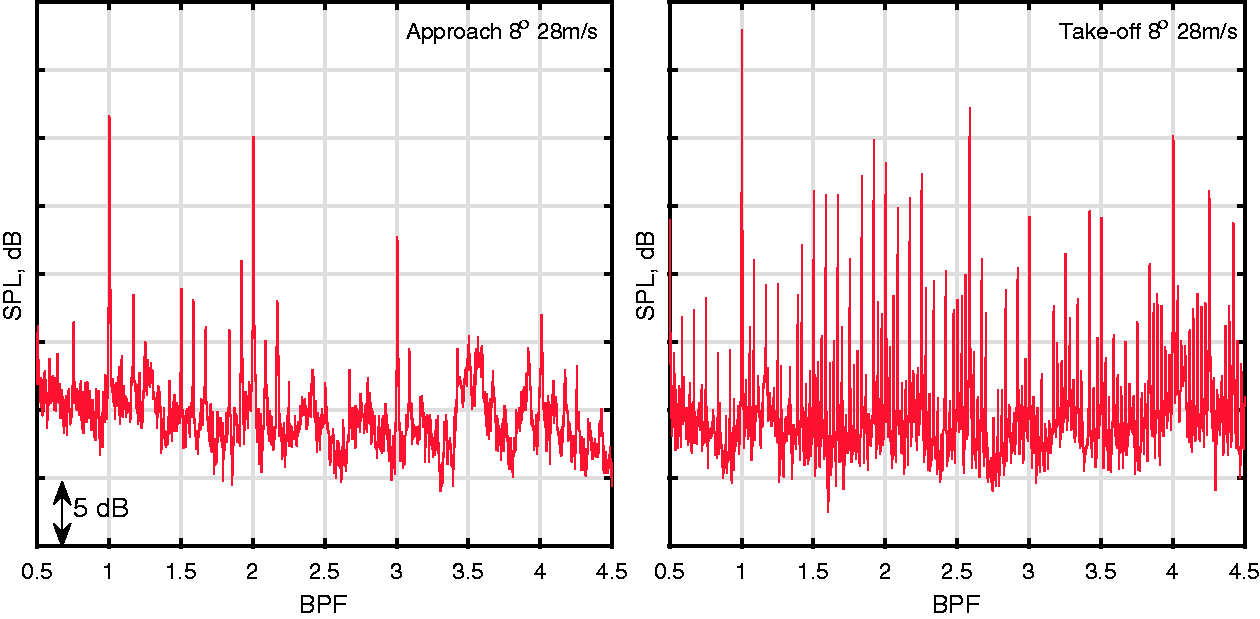
PS-A—narrow band spectra approach and takeoff comparison at
Additional instrumentation used but not reported in this work included flush-mounted pressure sensors in the engine blades and aircraft fuselage. Near-field noise measurements were made using a linear array of five microphones mounted on a traversing arm used to take measurements on seven planes centered about the front blade plane. Far-field sound measurements were acquired by three microphone arrays, namely a top, lateral, and front array.
Due to model geometry changes the center of the front blade plane shifts slightly for different configurations since the model axis of rotation is fixed at the aircraft wings and not the front blade plane. Where relevant these minor adjustments of the blade plane axis are represented in the figures of far-field sound levels by a dashed line corresponding to the blade plane. Data were acquired simultaneously on all systems for the far-field measurements at a data rate of 32,768 Hz for 10 s duration. Near-field measurements were conducted during separate test runs using the traversing arm and data were acquired simultaneously with the Kulite sensors. Datasets from all sensors were processed using the National Instruments Sound and Vibration toolkit incorporated into custom software in LabVIEW. A custom software tool was created to calculate a narrow band analysis up to 10 kHz with a frequency resolution of 1 Hz, 50% overlap, Hanning window, and 20 averages. From these narrowband spectra, the maximum amplitude of the BPF tones was extracted. The broadband level was also calculated using a tone separation procedure outlined later in this paper. Example spectra for approach and takeoff of the baseline PS-A configuration ate shown in Figure 8.
The focus of this work will be on the results of the linear far-field array; this array gives the widest arrange of emission angles and is suitable for consideration of sideline certification points and therefore very relevant for the airframe comparisons. The perpendicular distance from the center of the front blade plane to the linear microphone array varies depending on both engine pylon angle and also on the extension which ranges between a minimum distance of 6.28D and a maximum of 6.65D. The work of Sanders et al.6,7 conducted a numerical simulation of the WENEMOR engine and demonstrated that the far-field region begins at a distance of 1.5D for the fundamental BPF.
Results and discussion
One of the principal objectives of WENEMOR was to investigate the influence of the aircraft geometry on the noise emission of the CROR using a parametric study. Due to the wide range of configurations tested there is an intimidating dataset available for analysis. Recent work by Horváth et al. 19 has highlighted the difficulty of applying phased array beamforming techniques to CROR sources. This work has shown that typical tonal noise sources for CROR will be localized to their respective Mach radii rather than their true noise source locations. The initial analysis of the WENEMOR dataset has therefore focused on the results of the linear far-field array. The design of this array was such that the layout covered emission angles from 30° to 150° in steps of 10°. Numerical simulations often consider noise emission on an equidistant polar arc around the CROR source. 15 In the case of the experimental WENEMOR tests, there were two engine simulators present; this calls into question the validity of projections from the linear array focused on a single engine even when compensating for distance and flow effects. It was therefore decided to avoid a projection onto a polar arc and instead focus on the difference of the tone SPL at the linear microphone locations compared to the baseline configurations. This eliminates the need for a polar projection while maintaining valid comparisons between airframe configurations.
The baseline configurations, PS-A and TR-A, were used to characterize the noise emission of the CROR engines on the linear far-field array. The directivity of the source, in terms of BPF tones, as a function of AoA and flow speed was investigated using data from the linear far-field array.
In general, the noise signature of an isolated CROR contains the rotor-alone tones of the front and the aft rotor at its BPF, its harmonics, and the interaction tones, which are the sum of harmonics from the front and the aft rotor. Because the forward and aft rotors of the WENEMOR engines have the same number of blades (B) and the same rotational speed (N) in Hertz, the frequency of the rotor-alone tones and the frequency of associated interaction tones cannot be distinguished. The tone frequencies are expressed by equation (1)

Baseline configurations PS-A and TR-A: Tonal SPL of the BPFs
This section will verify the performance of the baseline pusher and tractor airframes considering the established trends for CROR noise emission in existing literature. According to Hanson 20 tones from isolated CROR engines which are even multiples of the BPF (i.e. 2*BPF and 4*BPF) radiate efficiently upstream and downstream of the CROR source. Work by Czech and Thomas 12 has found that the fundamental BPF is dominant at 90° to the engine. Figures 9 to 12 show the first four BPF tones for the baseline cases PS-A and TR-A for both takeoff and approach as a function of AoA and flow velocity along the linear far-field array. All these figures have the same vertical axis limits with a spacing of 5 dB for the vertical axis ticks. Levels can, therefore, be compared across all figures for the baseline pusher and tractor configurations. Levels are reported on microphone numbers from 1 to 13 which are nominally equivalent to emission angles from 30° to 150°. Since the model axis of rotation is fixed at the aircraft wings the front blade plane changes position relative to the linear far-field array with AoA changes; for this reason, microphone numbering and not precise emission angles are used on the plots. It is important to note that in these figures the angles of attack differ from 4°, 6°, and 8° at approach to 6°, 8°, and 10° at takeoff as per Tables 3 and 4.
Figure 9 shows the behavior of the n*BPF tones for the pusher baseline (PS-A) configuration at approach conditions. For the majority of test conditions tones at 2*BPF dominate the far-field levels at the locations measured by the linear far-field array, as would be expected for even order tones. The 3*BPF tones are the weakest with levels approximately 20 dB below the 2*BPF tones. The fundamental BPF tones increase in level with flow velocity and matches or exceed the 2*BPF tone level at all AoA for a velocity of
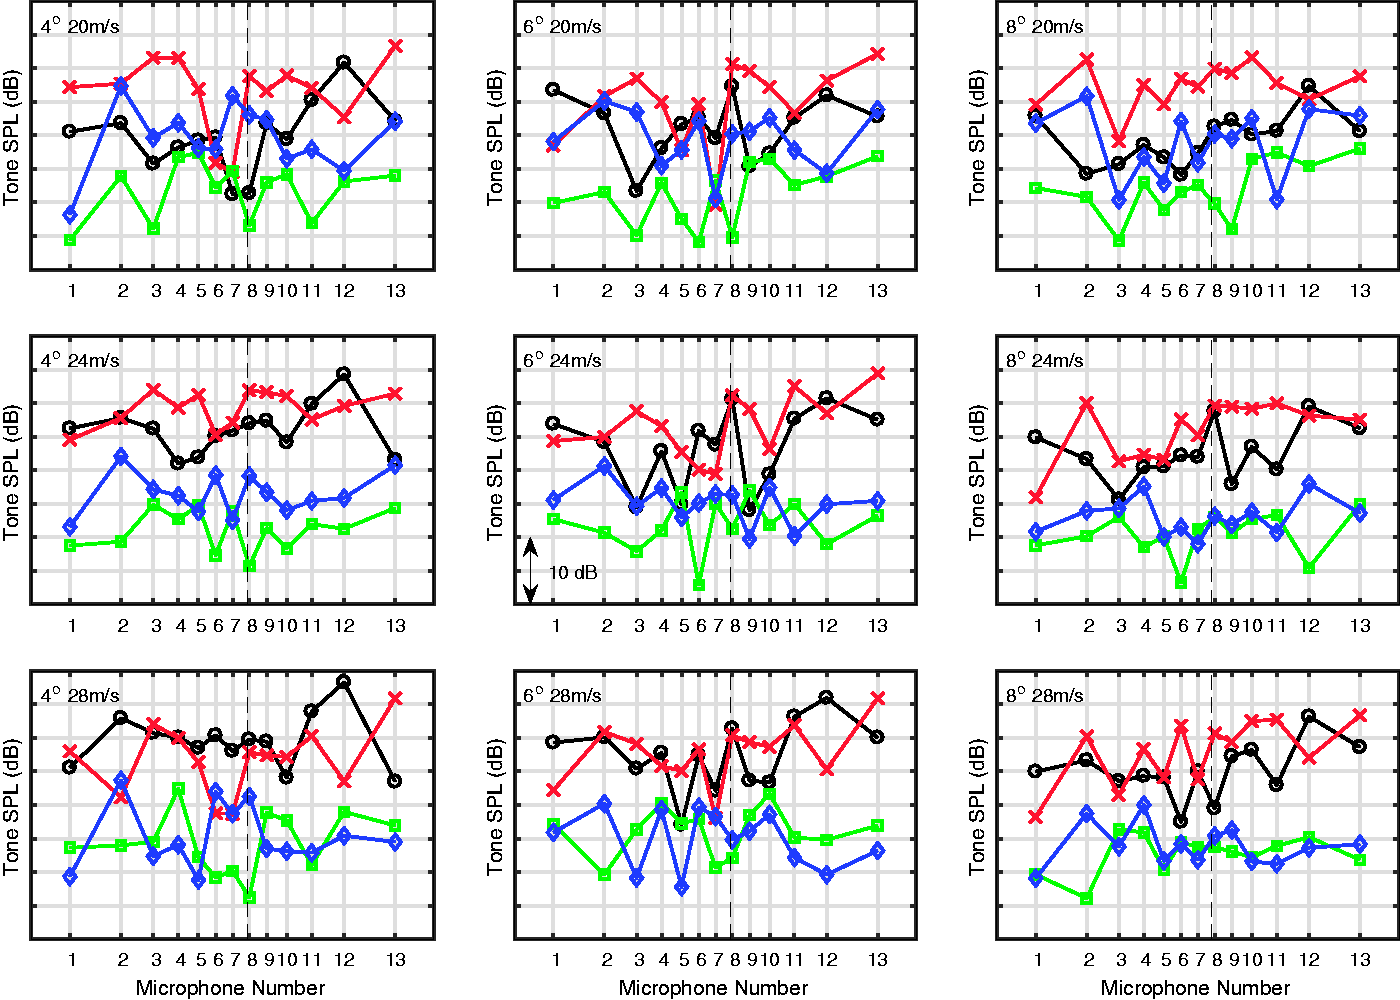
PS-A approach condition—blade passing tones for all AoA and flow speeds (BPF—black
Figure 10 shows the behavior of the nBPF tones for the pusher baseline (PS-A) configuration at takeoff conditions which have a higher RPM and different blade pitch settings. The 3*BPF tones are again the weakest with levels approximately 20 dB below the maximum tone. The fundamental BPF tone is now more dominant for a wide range of emission angles at all AoA and even at low flow speeds. This implies that the interaction with the pylon wake is stronger for the takeoff configurations. A possible explanation is that the takeoff configuration includes high lift devices on the wings, the wake of which may interact with the pylon wake and hence increase the influence of the pylon on the engine noise emission. The 2*BPF and 4*BPF tones are occasionally found to increase in level above the BPF tone for certain emission angles.
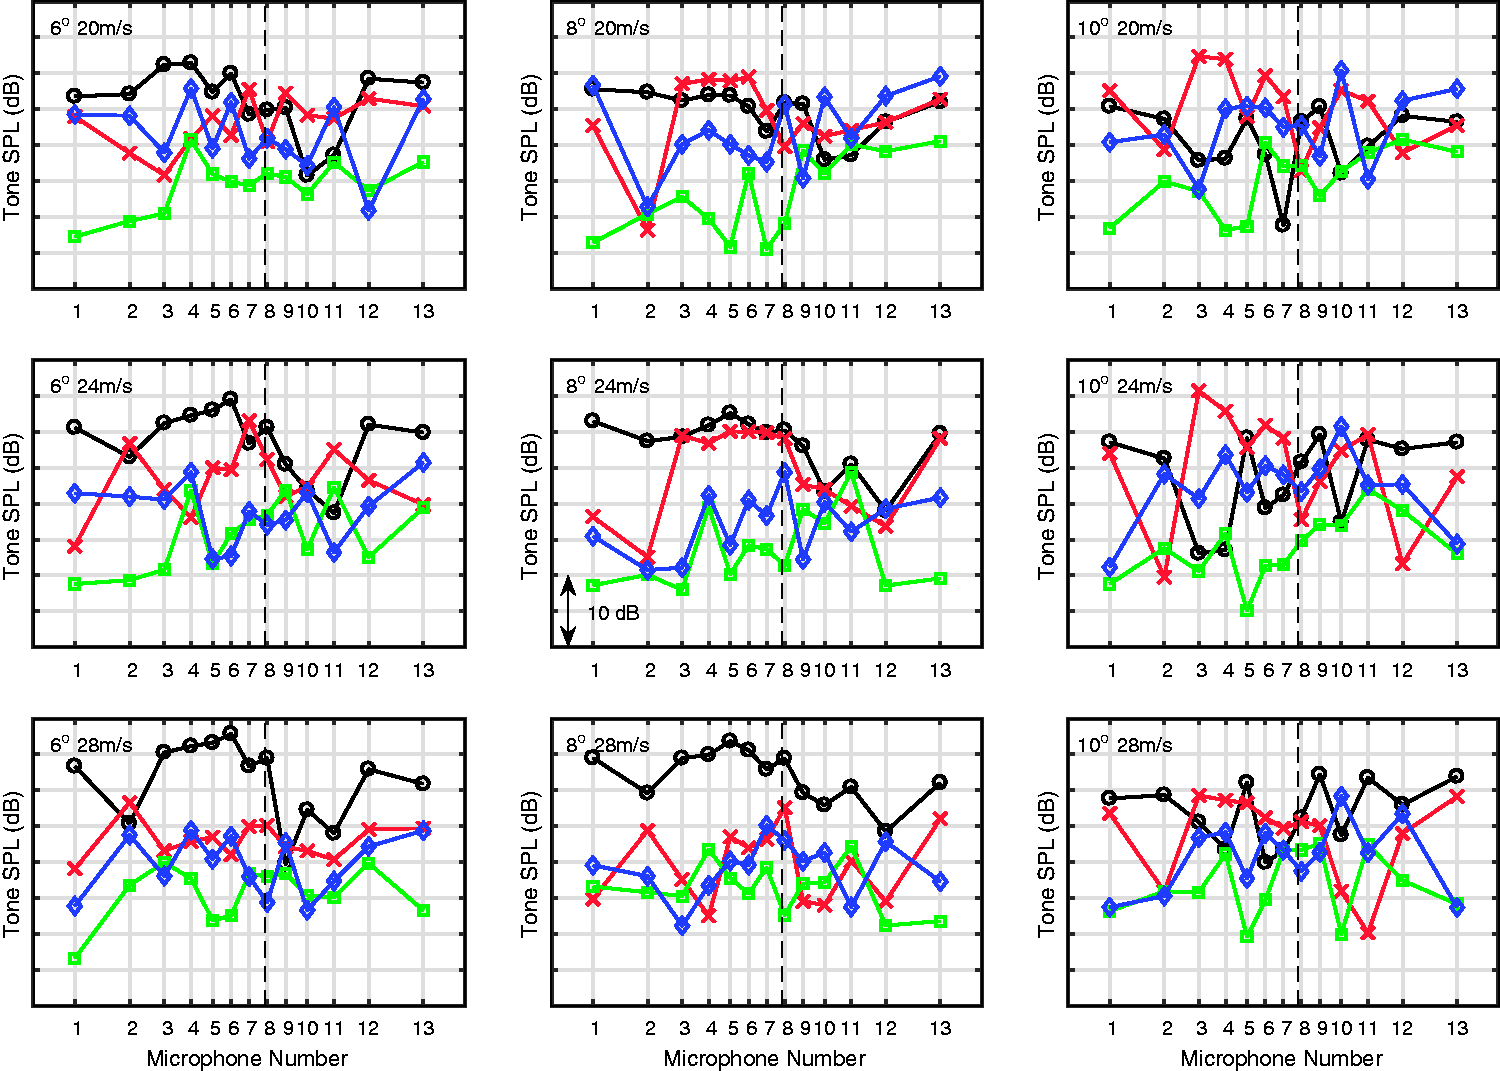
PS-A takeoff condition—blade passing tones for all AoA and flow speeds (BPF—black
Figure 11 shows the behavior of the n*BPF tones for the tractor baseline (TR-A) configuration at approach conditions. For the majority of test conditions, the 2*BPF tone dominates the far-field levels at the locations of the far-field array. There is a significantly lower influence of the fundamental BPF, in comparison to the pusher approach setting, with levels often in excess of 20 dB lower than the 2*BPF tone. In fact, the BPF tones are occasionally found to be in excess of 10 dB below the level of the 3*BPF tones which may be due to a greater number of interaction tones being coincident at a frequency of 3*BPF. At the lower flow speeds the maximum levels of the BPF tones are located in a lobe close to
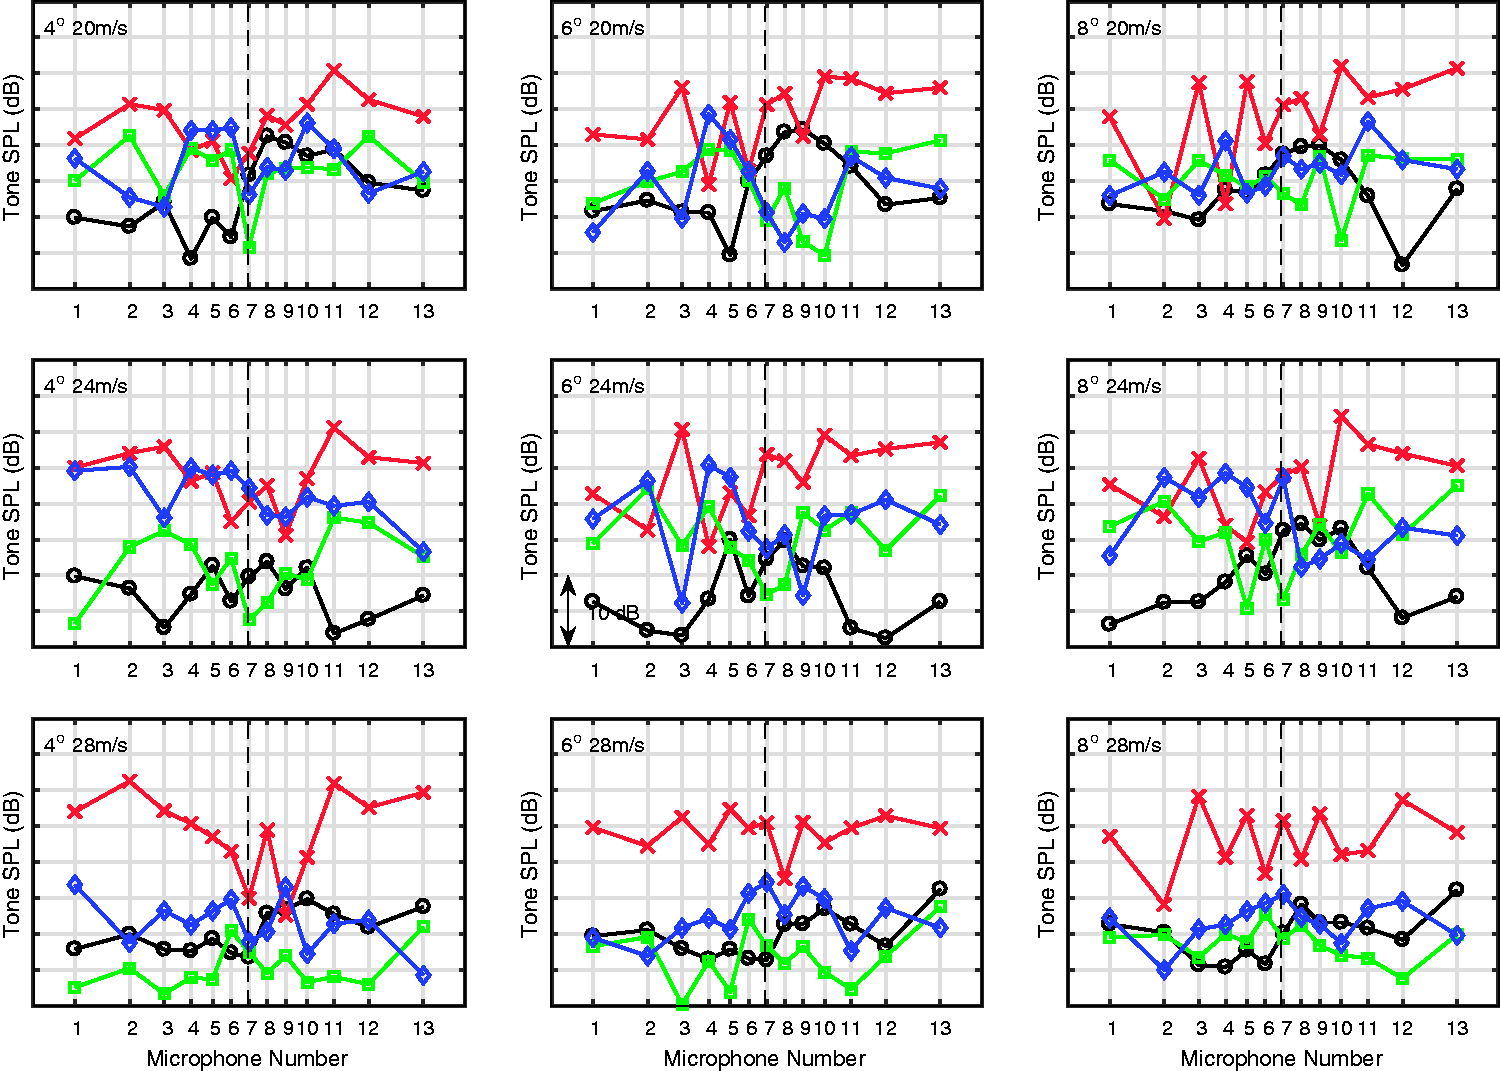
TR-A approach condition—blade passing tones for all AoA and flow speeds (BPF—black
Figure 12 shows the behavior of the n*BPF tones for the tractor baseline (TR-A) configuration at takeoff conditions. For all of the test conditions at almost all emission angles, the 2*BPF dominates the far-field levels at these locations. The levels of the BPF and 4*BPF tones are comparable for the majority of test cases, with a tendency for the 4*BPF tone to dominate over the BPF at emission angles above
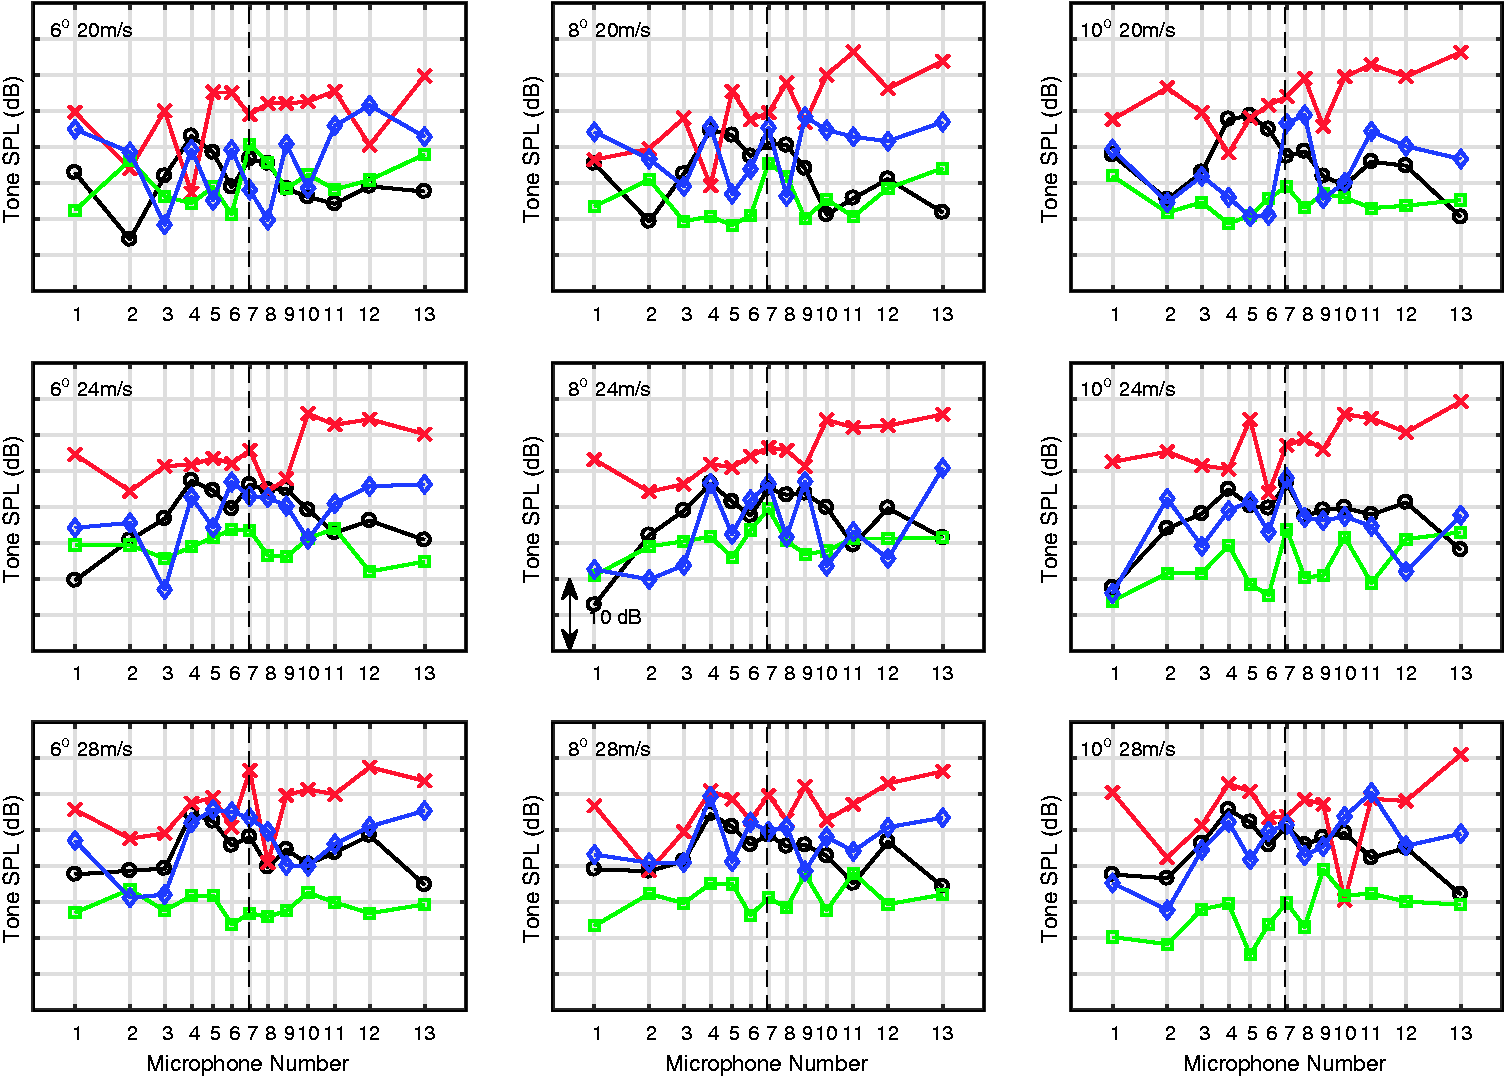
TR-A takeoff condition—blade passing tones for all AoA and flow speeds (BPF—black
Many of these trends compare well with the isolated installed-on-pylon tests of Eret et al.
5
which utilized the same engine simulator. As would be expected the upstream pylon causes the fundamental BPF to be more dominant in the pusher configurations than in the tractor configurations. One notable difference to the isolated installed-on-pylon tests is the relationship between the fundamental BPF and 2* BPF for the pusher tests. The 2*BPF was the most dominant tone for the isolated installed-on-pylon tests whereas, particularly for the takeoff tests, the fundamental BPF is more dominant for the airframe installed pusher tests. A possible explanation may be the difference in the azimuthal position of the engine pylon relative to the linear far-field array between the two tests. During the single engine, installed-on-plyon test the pylon was positioned directly below the engine, connected to the wind tunnel floor. The airframe tests connected the engine pylon to the airframe, a rotation of
The influence of the airframe on the tonal SPL at the BPFs
The investigation of the baseline airframes PS-A and TR-A confirmed that the noise emission of the CROR simulators was as expected from literature. The objective of this work is to assess the potential for the various airframes to provide shielding of the CROR noise emission. Due to the very significant number of test points in the measurement campaign which included 18 combinations of angle of attack, flow speed, and approach/takeoff settings for each of the 16 airframes it is possible to consider only a subset in this work. In order to compare the performance of the various airframe geometries, a single AoA and flow velocity condition are chosen. Only the
Figures 13 to 20 show the relative levels of the first four BPF tones between each pusher and tractor configuration and the relevant baseline configuration which is the middle subplot in each figure. The remaining subplots per figure correspond to the different airframe configurations to be found in Tables 1 and 2. All these figures have the same vertical axis limits with a spacing on 5 dB on the vertical axis ticks. Levels can, therefore, be compared across all figures. It should be noted that when observing the changes from the baseline that the relative levels of the tones, to be found in the center subplot, must be considered, e.g. a strong reduction in 3*BPF is not particularly relevant if the level of the dominant tone is 20 dB greater. A positive value (above the line) corresponds to a noise increase, whereas a negative value indicates a noise reduction. In order to compare the overall impact of the airframe on the microphones in the linear array, the sound pressures at each BPF tone are integrated along the array for each airframe using

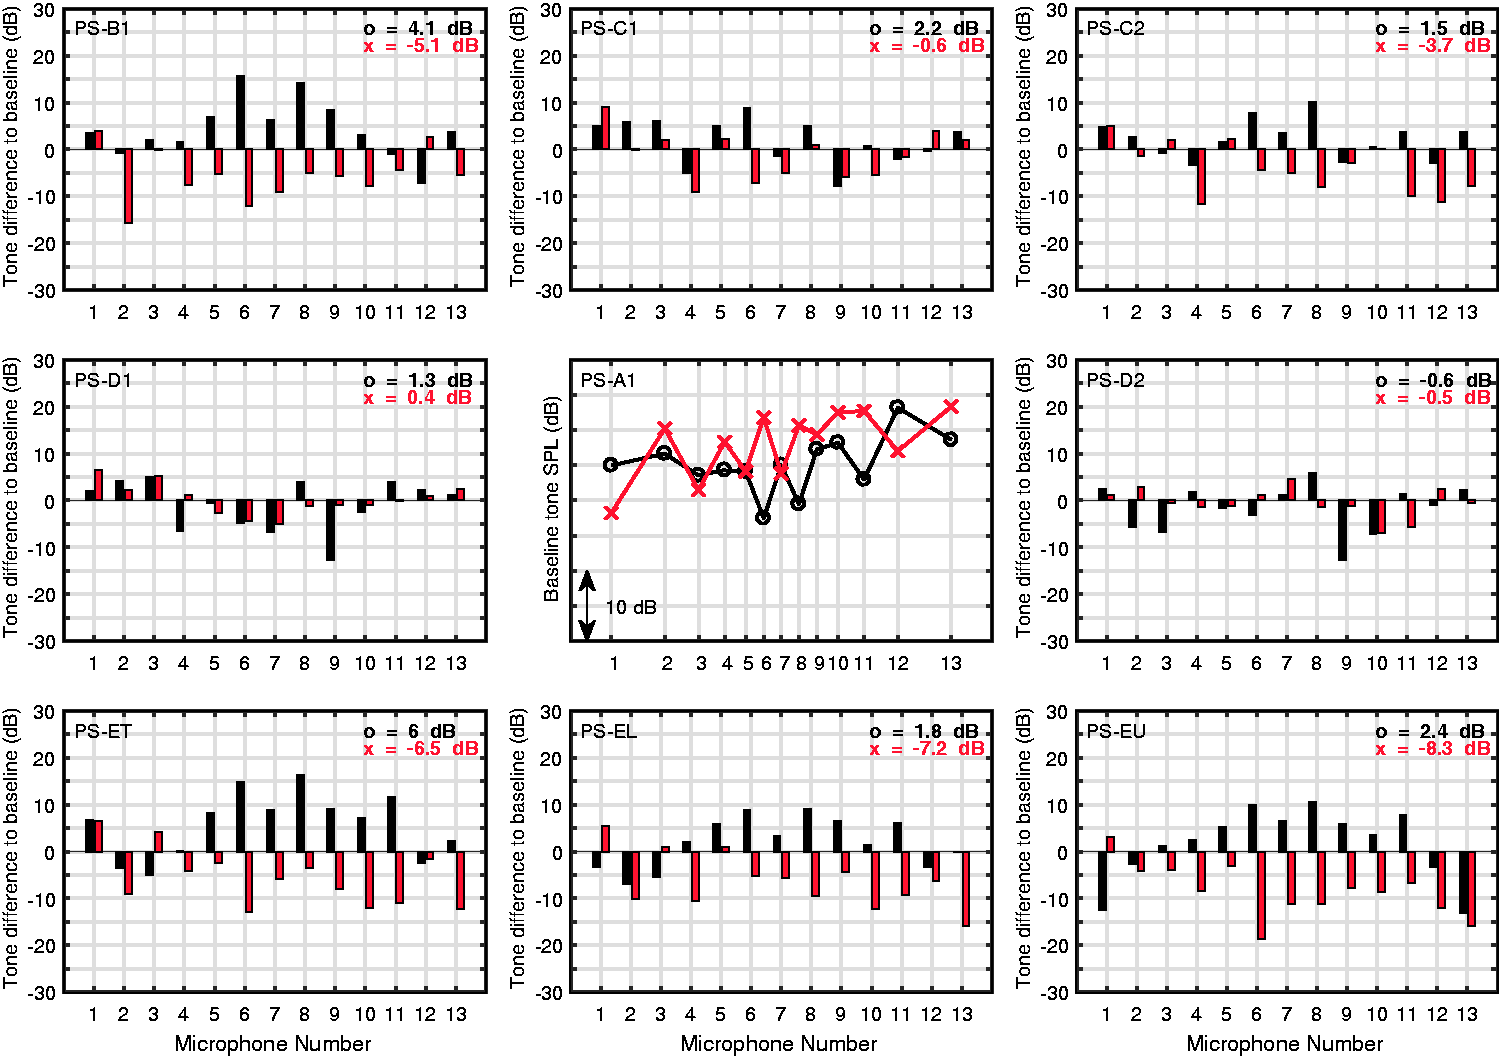
Pusher configurations approach condition—BPF and 2*BPF at
Figure 13 shows the BPF and 2*BPF tones for PS-A at approach settings and the difference of the tone SPL on each linear far-field microphone for each pusher aircraft configuration. The difference between the tone SPLs is reported as bar charts with black corresponding to the BPF tones and red corresponding to 2*BPF tones. It can be seen that the PS-B and three PS-E configurations have a very strong beneficial effect on the 2*BPF tone with reductions of up to
It is likely that these strong changes are due to the alteration in pylon angle from the baseline PS-A as these are the only four configurations with a pylon angle of
Figure 14 shows equivalent results for 3*BPF and 4*BPF at approach settings. The trends observed for these tones, which are generally in the region of
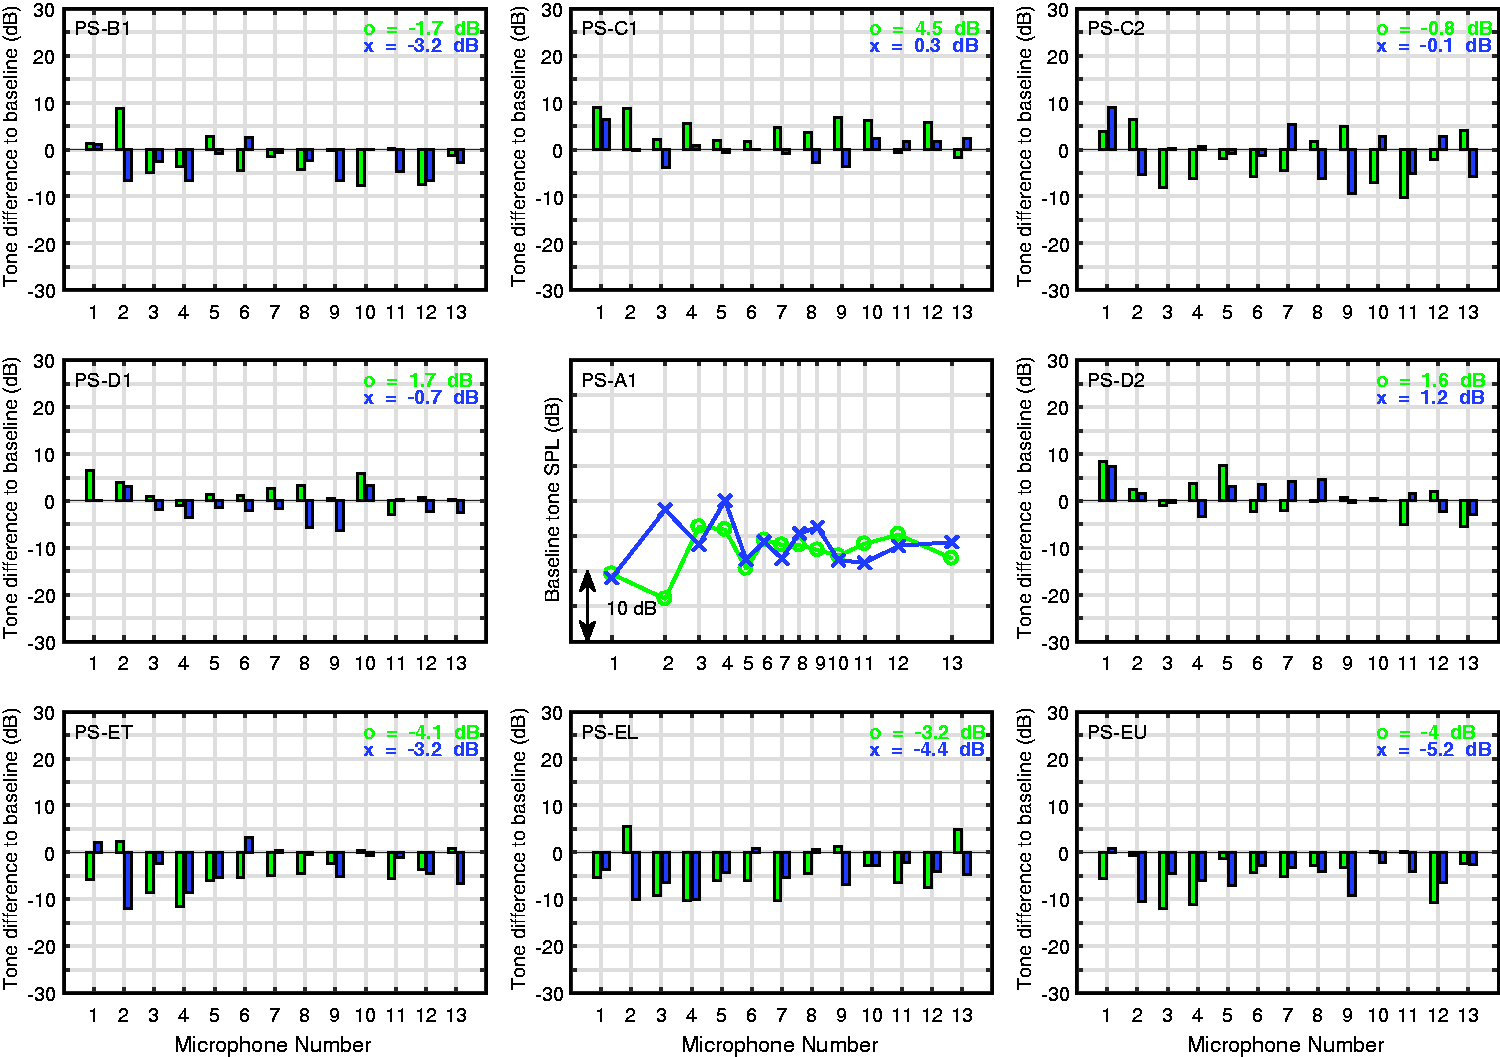
Pusher configurations approach condition—3*BPF and 4*BPF at
Next, we consider the same comparisons for the pusher configurations with takeoff settings shown in Figures 15 and 16. Considering Figure 15 in this instance the BPF tones are between
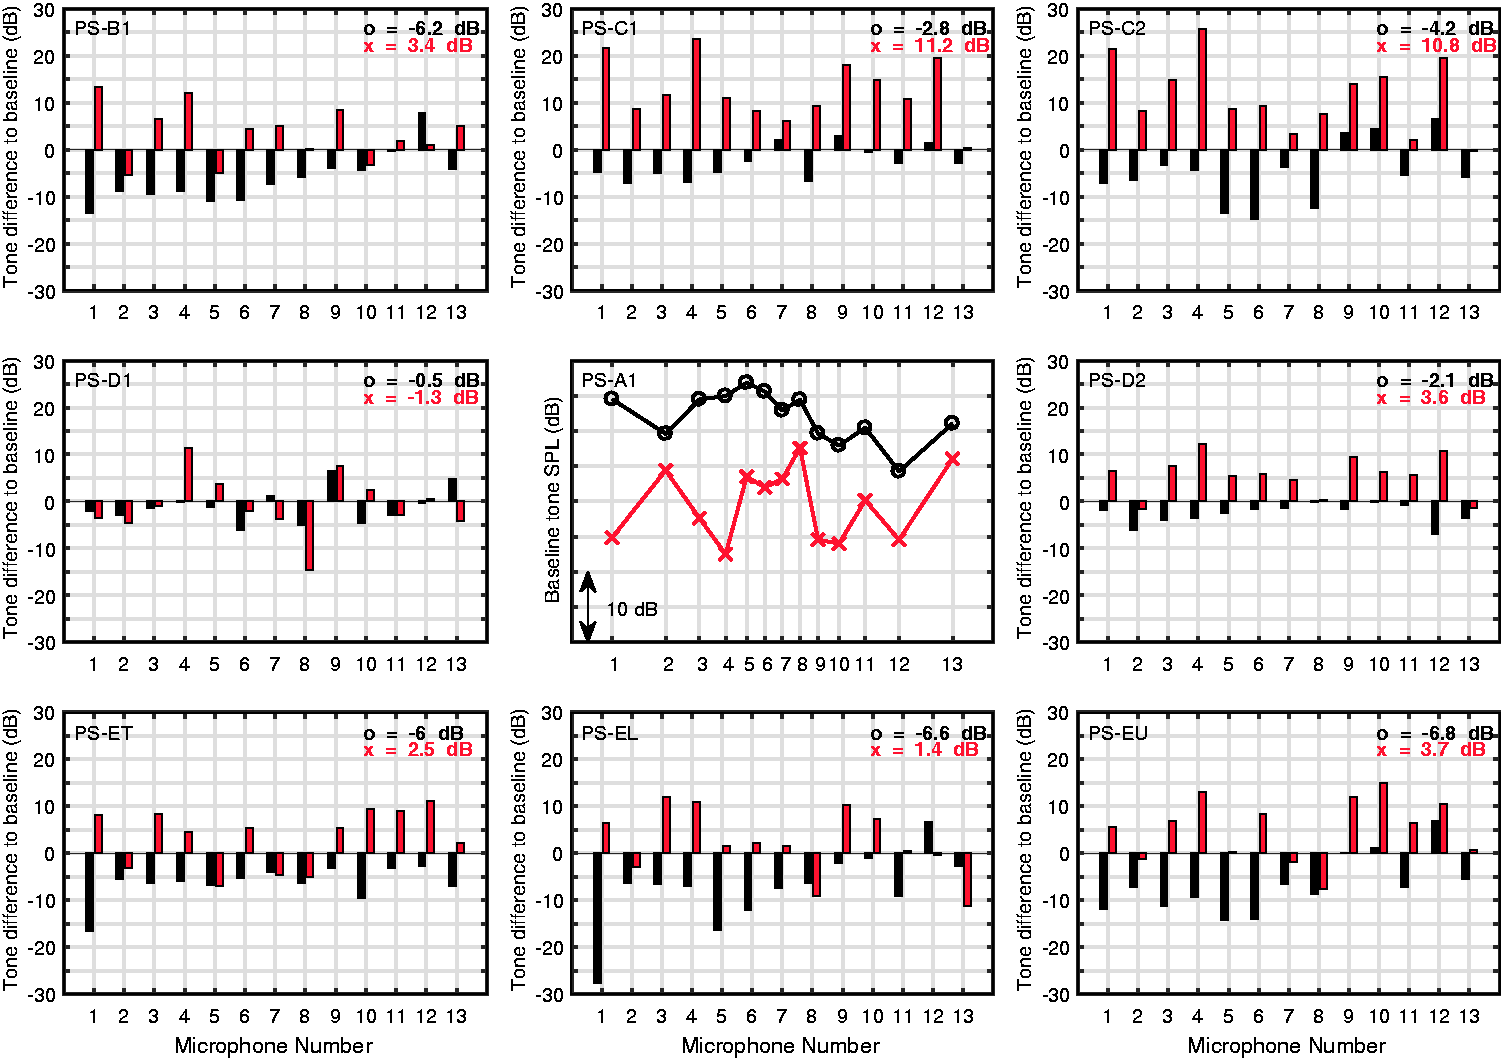
Pusher configurations takeoff condition—BPF and 2*BPF at
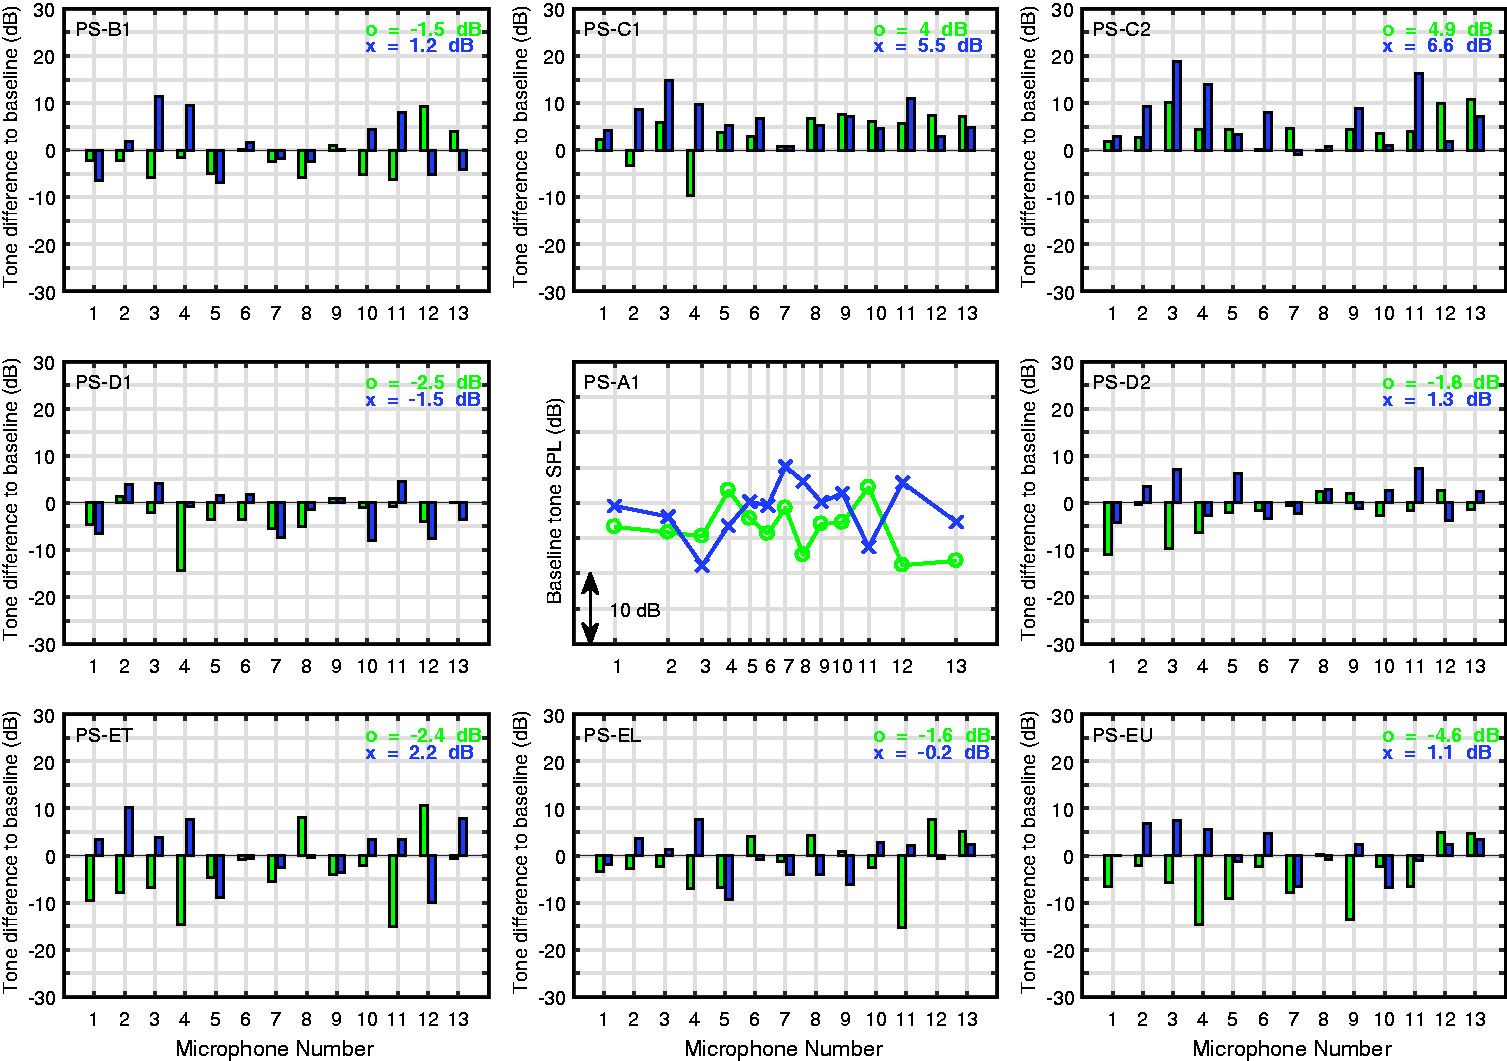
Pusher configurations takeoff condition—3*BPF and 4*BPF at
The effect of pylon length is also significant, shown in PS-C1 and PS-C2, with increases in excess of 25 dB for 2*BPF for some emission angles in comparison to the baseline configuration. When considering the reductions in BPF tones, these two airframes can be considered to switch the dominance from the BPF tones to those of 2*BPF.
Figure 16 shows the results for 3*BPF and 4*BPF for the pusher configurations at takeoff settings. PS-B1 and the PS-E configurations are again the strongest performers reducing the 3*BPF tone levels at the majority of emission angles. The effect of pylon length is again significant, with increases in excess of
When considering Figures 13 to 16 it is clear that the best performing pusher airframes in terms of tonal noise reduction are the PS-E L-tail and PS-E U-tail configurations.
We will now consider similar comparisons for the tractor configurations. While there were nine pusher airframe geometries there are only seven tractor configurations. The layout of Figures 17 and 18 is such that equivalent pusher and tractor airframes are located in identical subplots and all axis limits and vertical tick distances have been maintained.
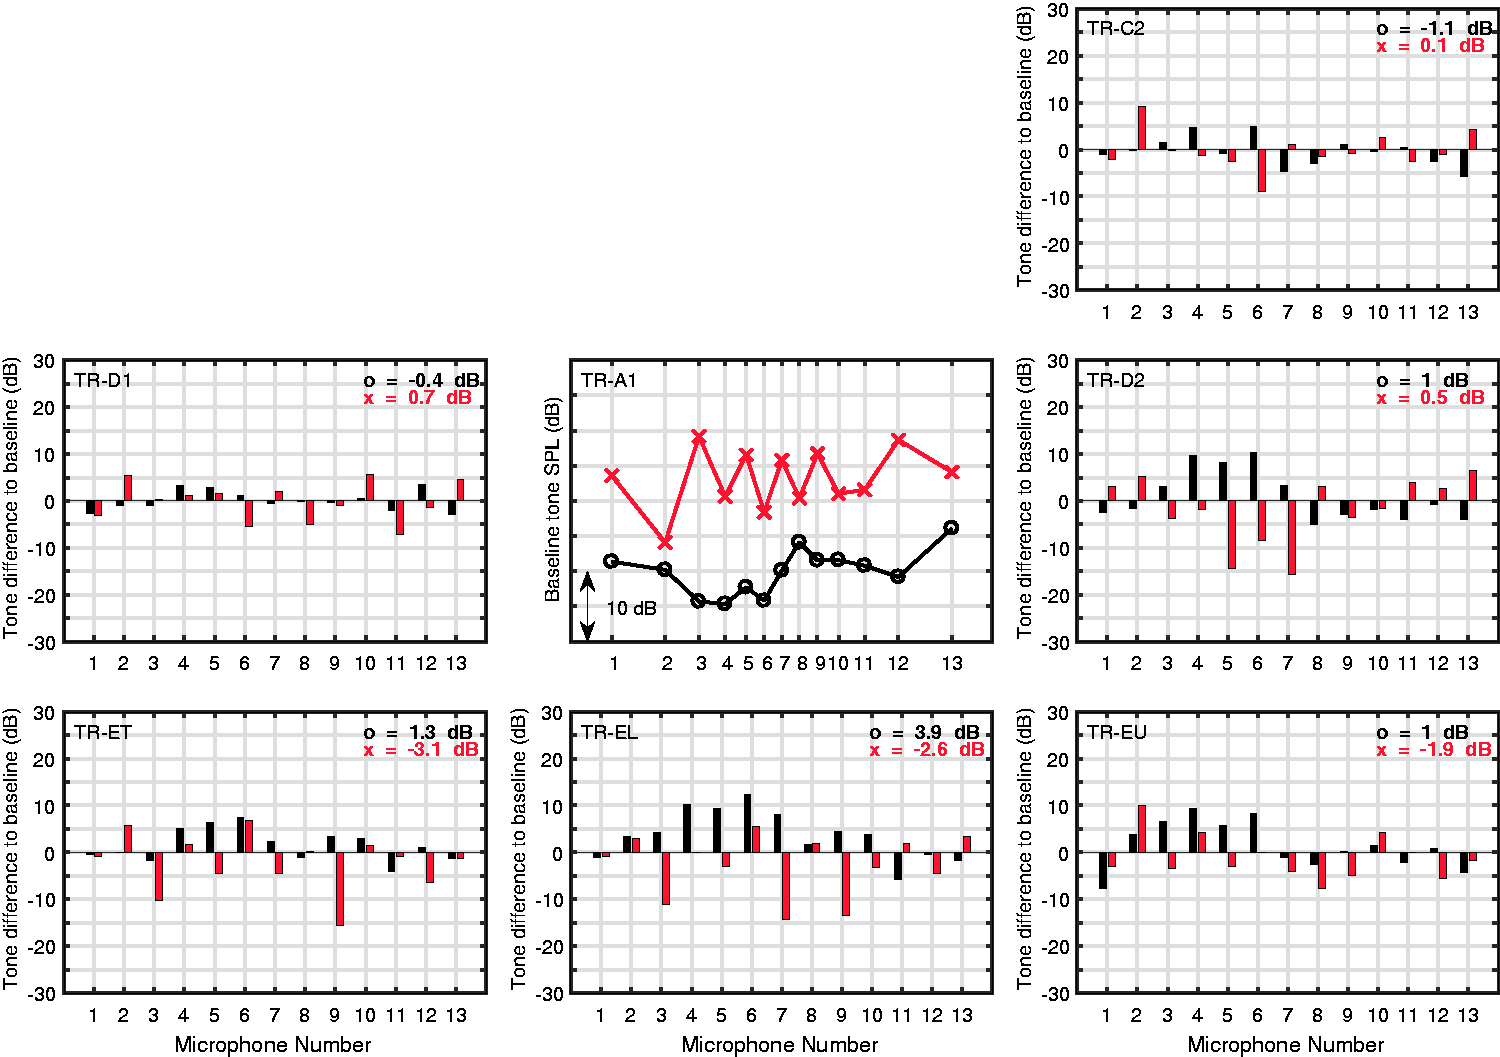
Tractor configurations approach condition—BPF and 2*BPF at
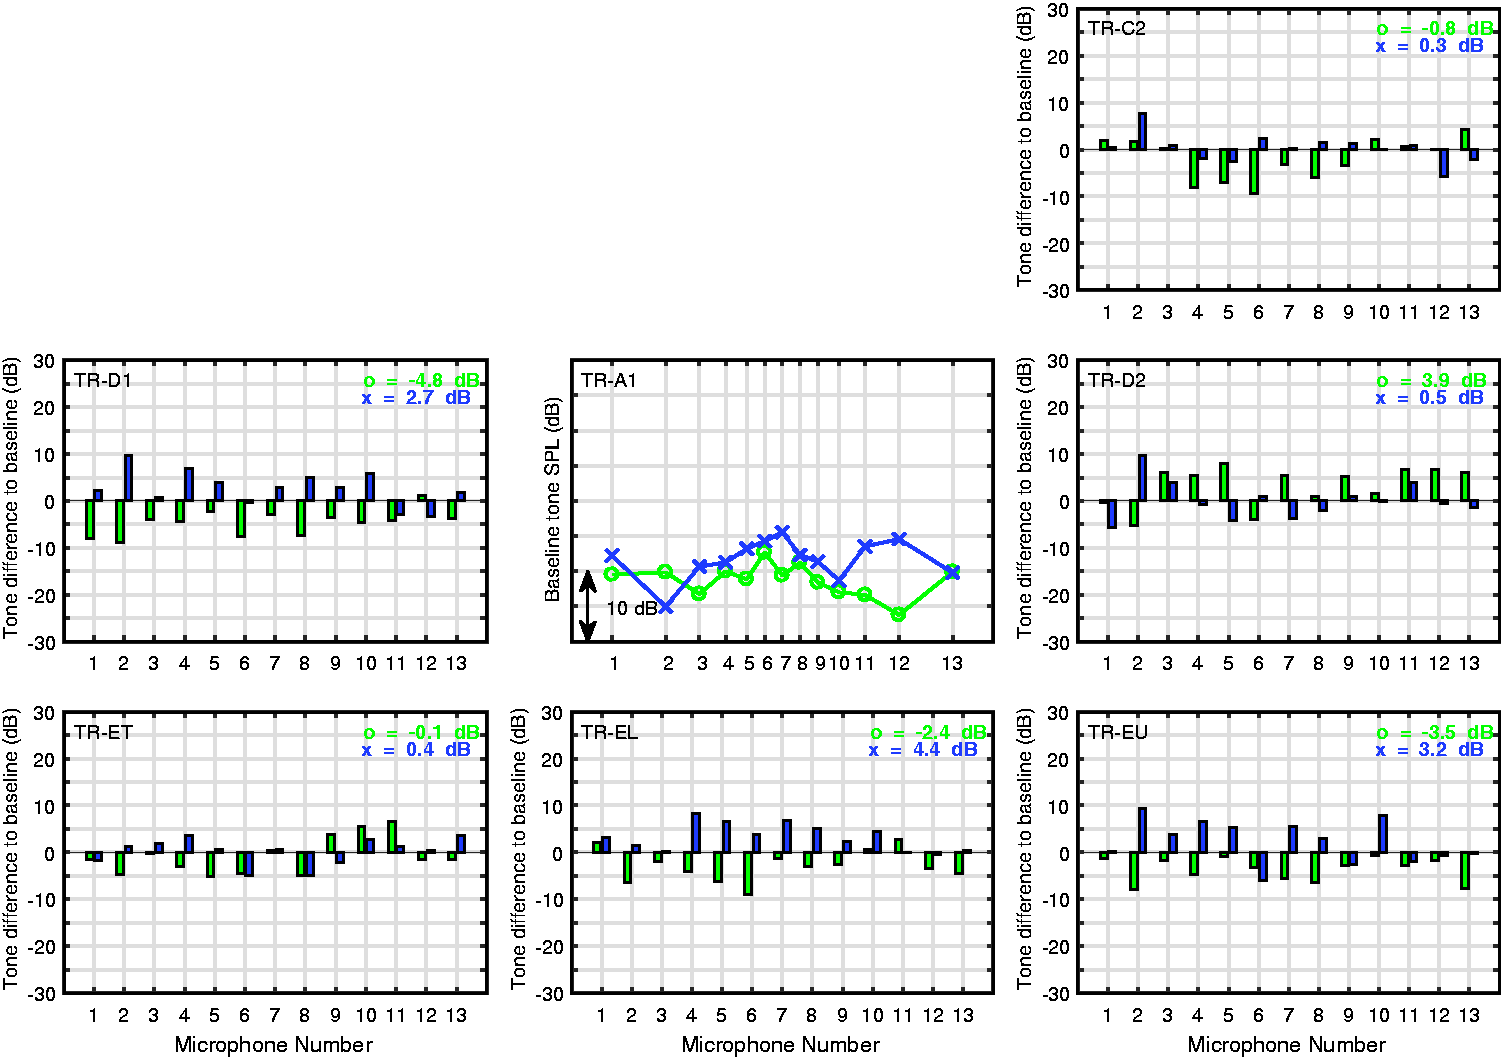
Tractor configurations approach condition—3*BPF and 4*BPF at
Figure 17 shows the fundamental BPF and 2*BPF for TR-A at approach settings and the difference of the tone SPL on each linear far-field microphone for each tractor aircraft configuration. The TR-E configurations, which are comparable to the PS-E airframes, are again the best performing airframes offering significant reductions of the dominate tones at 2*BPF while the increases in the BPF tones are negligible when considering the relative levels. The influence of engine pylon extension and the modified T-tail can be seen in TR-C2 and TR-D1, respectively. For these aircraft configurations, changes in SPL for both tones were minimal across emission angles. TR-D2, which featured fuselage extension, produced a beneficial change with reductions of almost 15 dB in 2*BPF at
Figure 18 shows the equivalent results for 3*BPF and 4*BPF at approach settings. Considering the dominance of the 2*BPF tone at all emission angles for the baseline tractor configuration at approach setting, the modifications to these tone levels will have minimal impact. All airframes produced an overall increase in the 4*BPF tones when compared to the baseline whereas every airframe with the exception of TR-D2 produced a reduction in the 3*BPF tones compared to the baseline.
Figure 19 shows the influence of the tractor configurations at takeoff settings on the BPF and 2*BPF tones. Considering the dominance of 2*BPF for the baseline TR-A configuration the only airframe with any noise reduction compared to the baseline is TR-C2 with a slight reduction in 2*BPF tones and a

Tractor configurations takeoff condition—BPF and 2*BPF at
Figure 20 reports the influence of the airframes on the 3*BPF and 4*BPF tones. In this instance, the 4*BPF tone also dominates the noise emission at a comparable level to the 2*BPF tones. The only airframe which produces a reduction in the 4*BPF tones is again TR-C2 with a

Tractor configurations takeoff condition—3*BPF and 4*BPF at
The influence of the airframe on the broadband content
While BPF tones are key elements of the CROR noise source further consideration must be given to broadband noise when operating in an installed configuration on an airframe. This fact was highlighted for in-flight conditions by Blandeau et al.
21
Blandeau’s work considered an uninstalled configuration with the rotor-wake/rotor interaction noise and the rotor trailing edge noise considered as the dominant broadband noise sources. In order to investigate the noise reduction achieved for the various airframe geometries, a similar approach to Stephens and Envia
2
was taken to separate tonal and broadband components of the noise. A peak-finding algorithm was used to identify and remove tones from the spectra. The algorithm broke the spectra into regions and identified peaks which were greater than 1 dB above the median value of the region, replacing them with interpolated values based on the neighboring points. The resulting spectrum can be considered a reasonable approximation of the broadband level. This procedure was compared to that of Sree and Stephens
22
which is based on the removal of an average tonal waveform. The results for the broadband level agreed within less than 1 dB between the two approaches so the less computationally expensive frequency domain approach was applied in this work. Figure 21 shows the resulting spectra for three emission angels for the PS-A configuration at
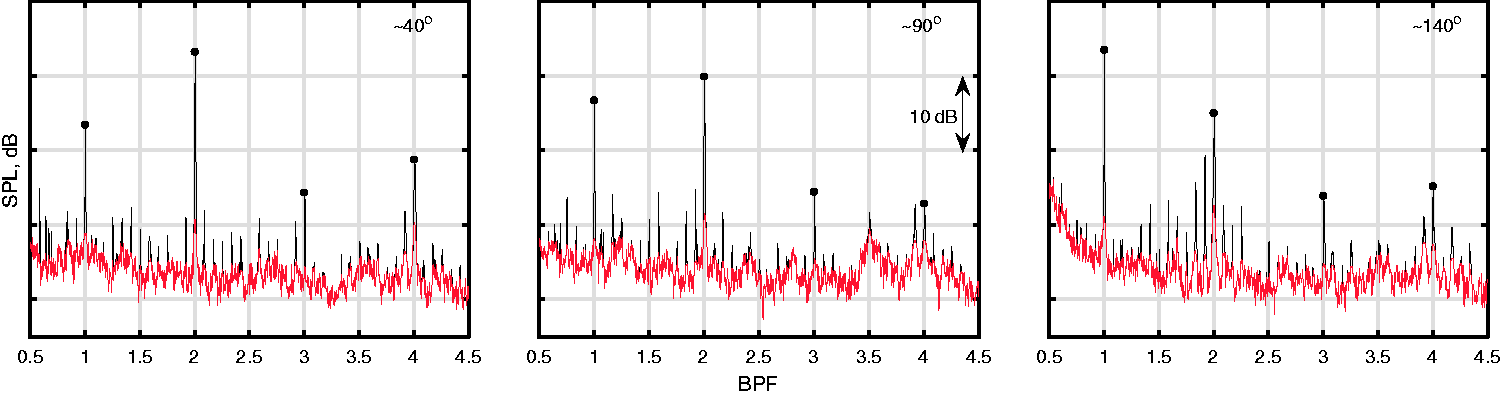
Sample spectra with tone and broadband separation for PS-A at
The plot is also rich in lower level tones which are multiples of the engine speed, i.e. a frequency step of 39.32 Hz is vivid, particularly around the 2*BPF tone downstream of the engine. The likely explanations for these are interactions with the engine pylon but there could also be effects from the wing wake or nacelle boundary layer, slight manufacturing inaccuracies of the blades or the impact of the spiral bevel gears (which had 23 teeth and are therefore close to 2*BPF) on the noise signals.
While the broadband component is clearly contaminated by wind tunnel and airframe noise sources (high lift devices and landing gear) it is assumed that these remain relatively constant for configurations which are at the same AoA and flow velocity. Despite the fact that this contamination remains present in all spectra, by comparing airframe configurations only at the same test conditions, it is possible to estimate the changes to the broadband and tonal contributions of the CROR source. The spectra were bandpass filtered between 0.5*BPF and 4.5*BPF and then the original spectra and the broadband-only spectra integrated to provide the OASPL and broadband SPL.
Figure 22 reports the broadband levels between 0.5*BPF and 4.5*BPF for the baseline pusher configuration, PS-A1, at all angles of attack and flow speeds in both takeoff and approach conditions. The vertical axis limits are maintained between all subplots with a vertical tick spacing of 2 dB. From this figure, we can see that the broadband level of the CROR is not strongly affected by the angle of attack as the level and directivity of the noise emission are reasonably constant moving down each column of the plot. Generally, broadband levels for the takeoff setting of the engine are lower than for those of the approach setting, the increase in engine RPM does not necessarily produce an increase in the broadband level due to the adjustment of the blade pitch between the two cases. Increasing the flow speed, represented by moving to the right in the rows of the figure, has a stronger increase in the broadband level with increases of up to 8 dB at
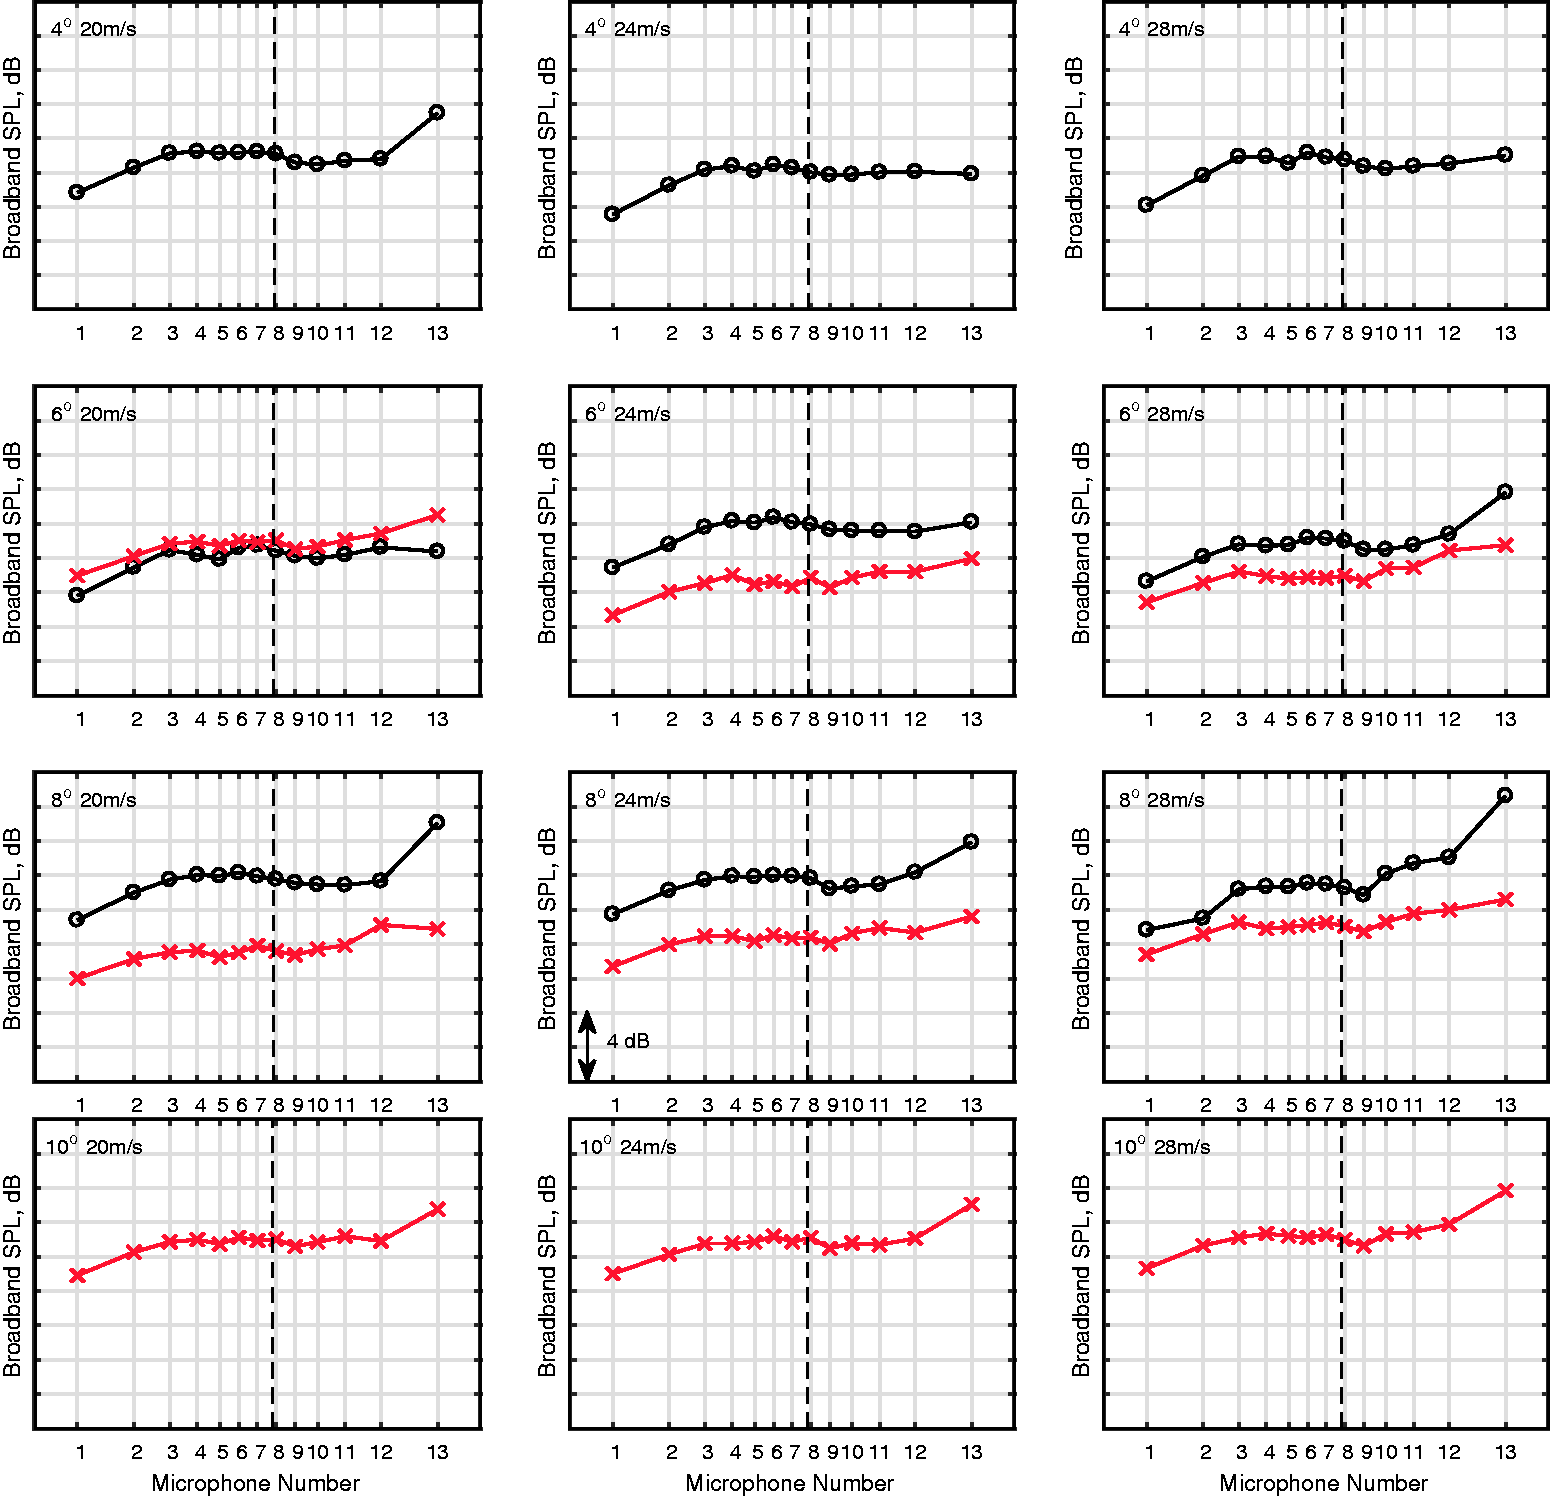
PS-A1 baseline configuration broadband noise levels approach and takeoff conditions (approach—black
Figure 23 reports the influence of the airframe on the broadband noise emission for both takeoff and approach settings for pusher. As before only the data from the
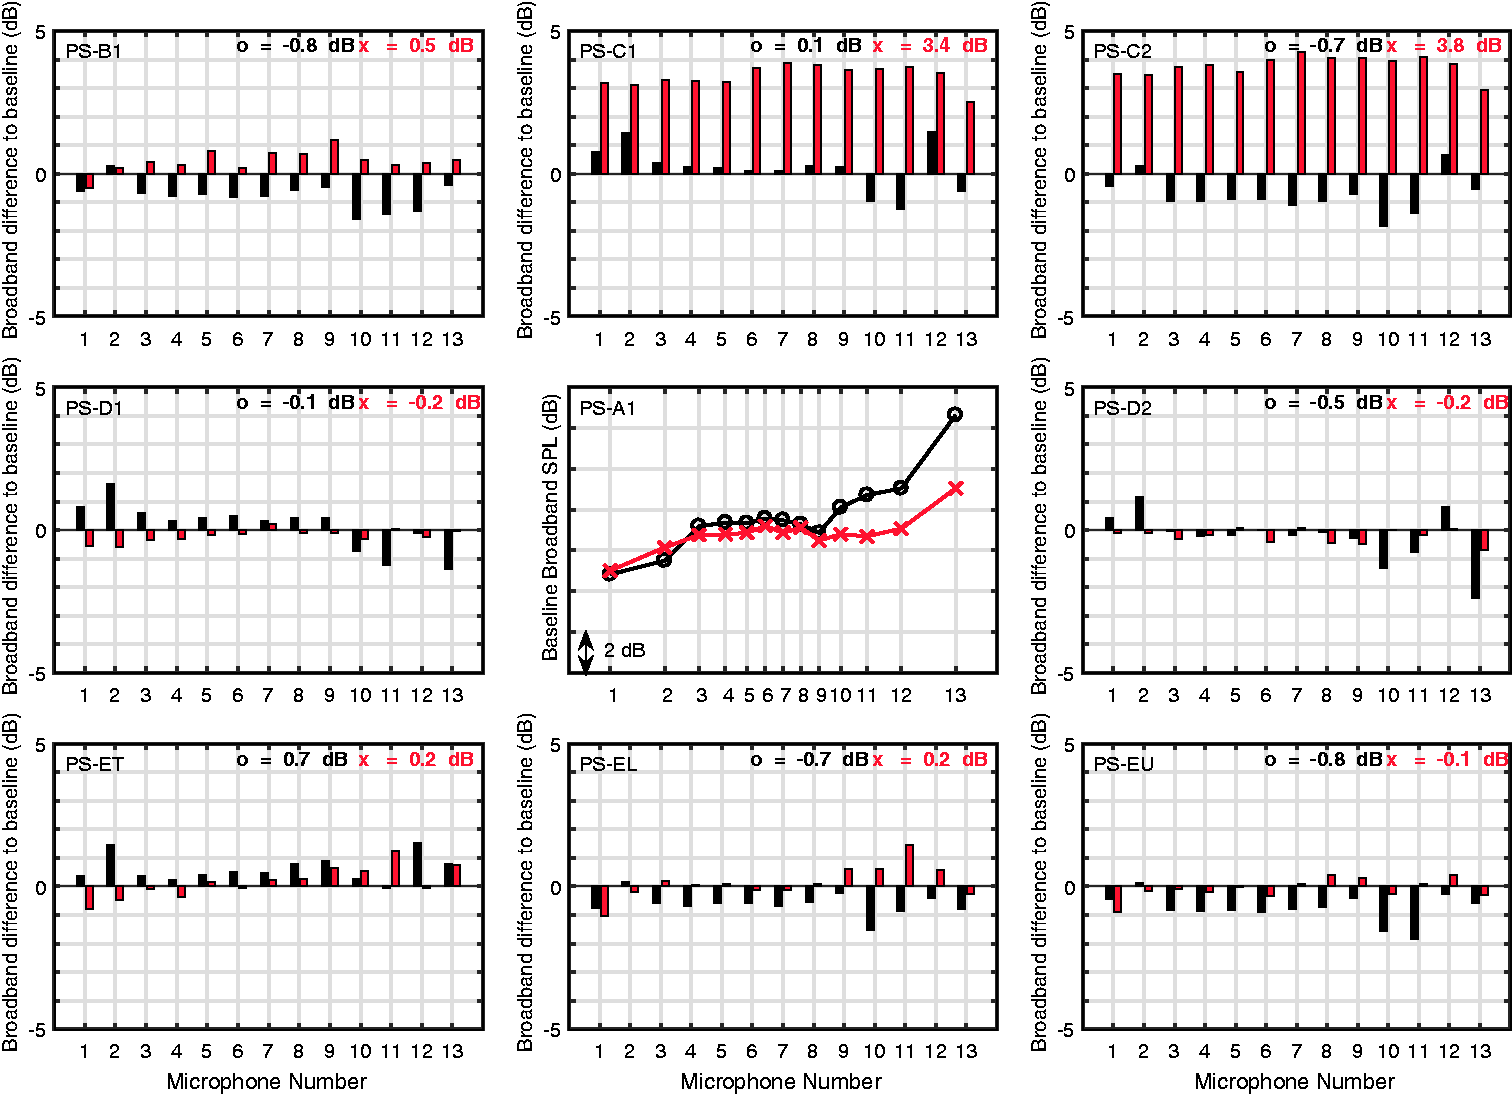
Pusher configurations—the difference of the broadband SPL from PS-A1 baseline at
Generally, the influence of the pusher airframes is minimal on the broadband sound emission with differences of less than 1 dB at most emission angles. The exceptions to this are the PS-C1 and PS-C2 airframes which increase the engine pylon length. In the case of these airframes, a significant increase in the broadband content of over 3 dB across the emission angles of the linear array is reported but only for the takeoff settings of the airframe and engine. There is no easily identifiable explanation for this increase as without a flow field measurement or CFD simulation of the airframe it is not possible to investigate if the longer engine pylon placed the engine blades into the wake of upstream airframe components, in particular, the wing wake. This is a potential explanation but one which cannot be verified. The difference in the wing configuration with high-lift devices deployed between takeoff and approach settings could also explain why the same result is not found for the approach conditions.
Figures 24 and 25 show the equivalent results for the tractor configurations. Figure 24 maintains the same axis limits as Figure 22 and in this case, significant differences in the broadband level are observed between takeoff and approach setting on the airframe and engines. The TR-A1 approach cases show very similar trends to the PS-A1 cases as the broadband level is relatively unaffected by the angle of attack of the airframe and increases by up to 8 dB with increased flow speed with minimal changes in directivity. The takeoff setting of the TR-A1 airframe and engines shows very high broadband levels, up to 12 dB above the approach setting at the
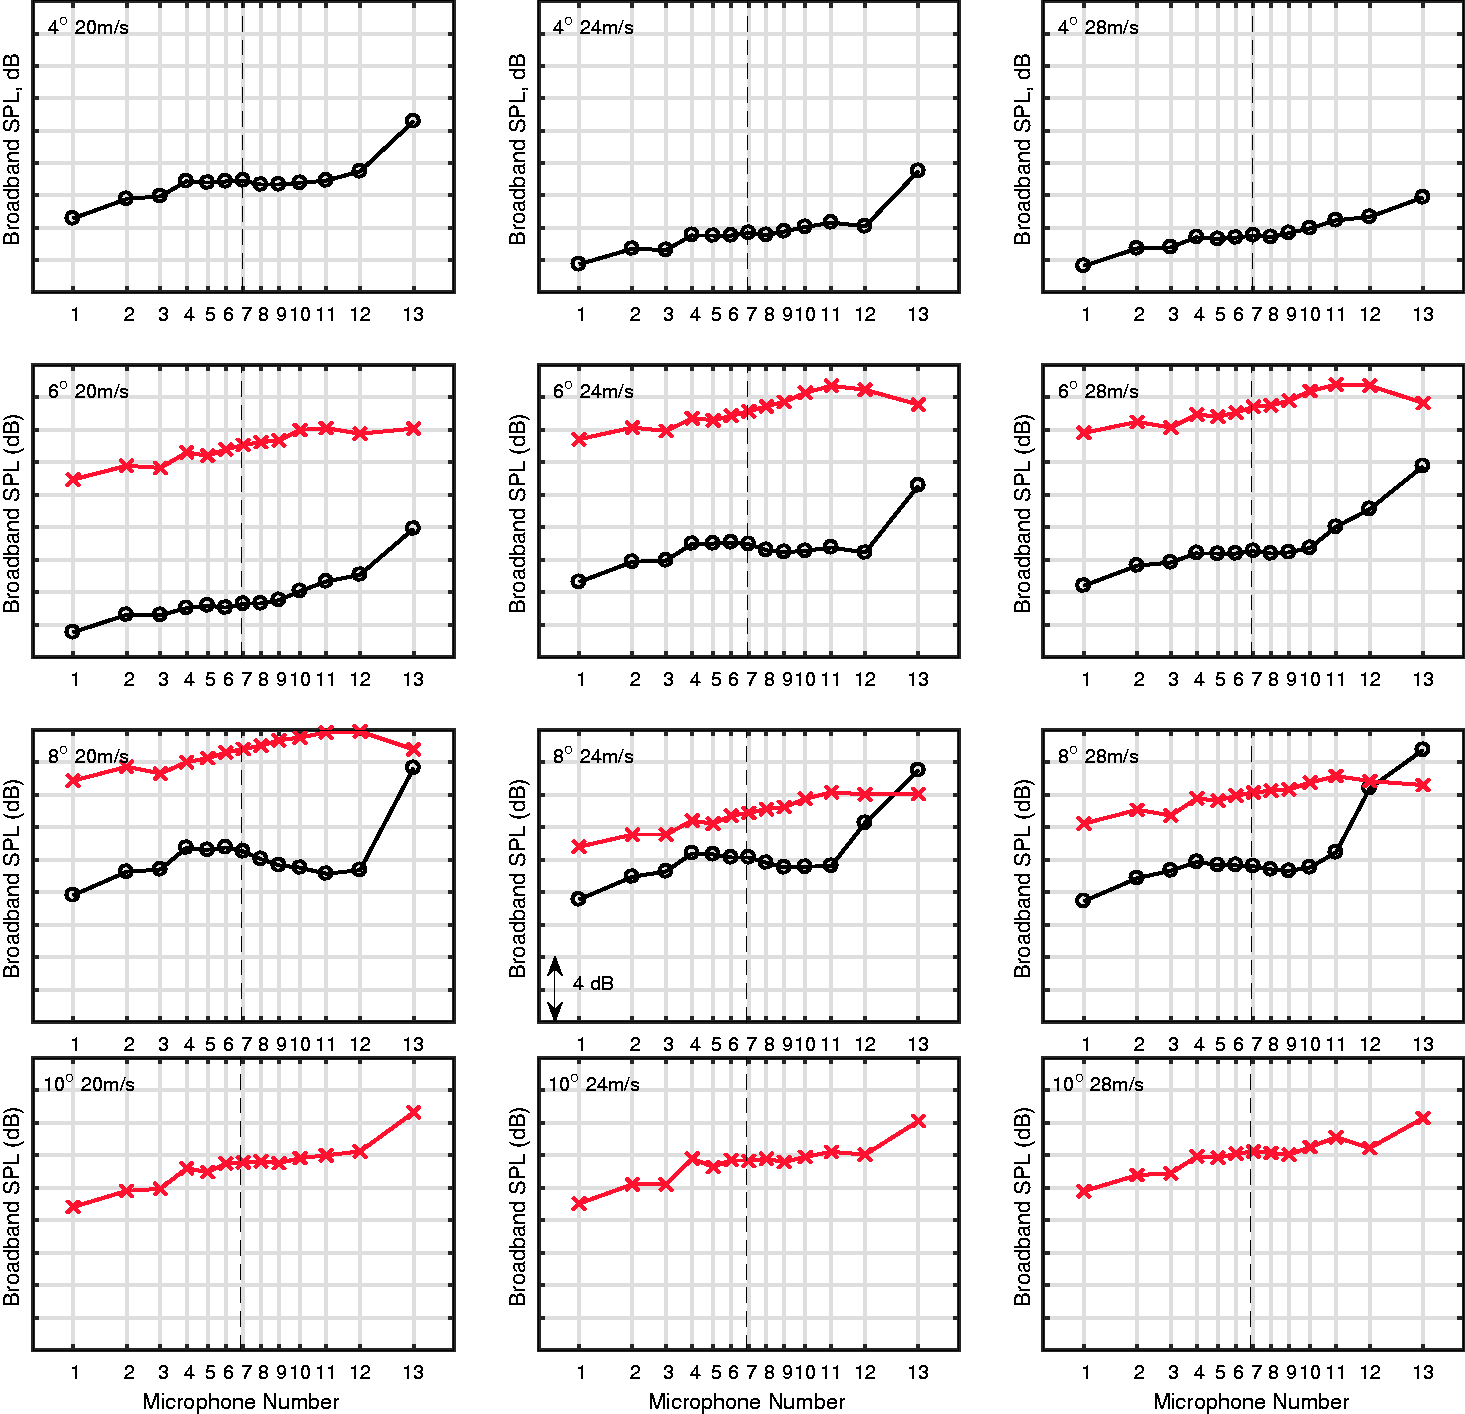
TR-A1 baseline configuration broadband noise levels approach and takeoff conditions (approach—black

Tractor configurations—the difference of the broadband SPL from TR-A1 baseline at
Figure 25 reports the influence of the tractor airframes on the broadband noise emission for both takeoff and approach settings. As before only the data from the
Overall assessment of the airframe performance
With the data presented in the previous sections, it is possible to rank the noise reduction performance of the airframe configurations in terms of the tonal SPLs, the broadband SPL, and the overall SPL over the entire far-field array. Tables 6 and 7 show the resulting rankings for the 16 airframe configurations operated at approach and takeoff conditions at
Ranking of the airframe geometries based on far-field noise levels—approach conditions at

BPF: blade passing frequency; OASPL: Overall sound pressure level.
The tables show that there are strong differences in airframe performance when the different measures are considered. The levels of the BPF and 3*BPF tones are strongly influenced by the engine pylon which is upstream in the pusher airframe cases. As a result, the tractor airframes are significantly better performers at the BPF with the top seven airframes all being the seven tractor configurations.
Considering the approach settings shown in Table 6 there is a difference in level of
When we consider the relative levels of the tones reported in the previous sections it is clear that the BPF and 2*BPF tend to dominate the tonal noise emission. As an example of the difficulty in assessing the best performing airframe it is worth considering the case of PS-EU which ranked first in terms of 2*BPF noise reduction but 14th in terms of the BPF; there are many examples like this where the best performing airframe at a certain tone performs very poorly for other tones. A good choice of the best performing airframe in terms of the overall tonal emission for the approach conditions at this particular angle of attack and flow speed could be TR-ET which ranked sixth at the BPF, second at 2*BPF, fifth at 3*BPF, and seventh at 4*BPF. This ranking puts this airframe in the upper half of the ranking table for all of the tones considered and in second place at the dominant tone. This airframe also ranked fourth and third for broadband SPL and OASPL, respectively. It could also be argued that TR-C2 which ranked first in terms of OASPL and quite well across the other measures is the best performing airframe; in this case, the dominant 2*BPF tone is approximately 3 dB higher than TR-ET as can be seen in Figure 17.
The results for the takeoff conditions shown in Table 7 are quite different. For the takeoff settings at these test conditions, the PS-E configurations, in particular, the U-tail, are very strong performers with good rankings under all of the metrics considered. The tractor configurations are generally clustered in the lower half of the rankings for all of the measures with the exception of the BPF tones which are strongly influenced by the engine pylon.
Ranking of the airframe geometries based on far-field noise levels—takeoff conditions at

BPF: blade passing frequency; OASPL: Overall sound pressure level.
While the results shown in Tables 6 and 7 are insightful they only consider the
Ranking of the airframe geometries based on far-field noise levels—approach conditions.

BPF: blade passing frequency; OASPL: Overall sound pressure level.
Ranking of the airframe geometries based on far-field noise levels—takeoff conditions.

BPF: blade passing frequency; OASPL: Overall sound pressure level.
Table 8 shows that the PS-E and TR-E airframes are strong performers at approach conditions with the lowest noise emission under a number of different measures. In the case of the PS-E airframes, the level of the BPF tones is among the highest of the airframes considered but the impact of this tone on the noise emission can be reduced through technologies such as pylon blowing and can, therefore, be addressed.
When we consider the ranking for the takeoff settings, shown in Table 9, the airframes which have a low OASPL combined with low tonal SPL are again the pusher airframes PS-E with the PS-D airframes also performing well.
A true ranking of the airframe configurations needs to take into account more factors based on certification limits such as EPNL. The frequency content of the broadband, as well as the relative levels of the tonal content to the broadband, has significant impacts on annoyance-based metrics such as EPNL. This would require fly-over modeling of the aircraft noise emission at certification points. The WENEMOR dataset has provided an experimental input for this type of activity which has been pursued as part of the technical work of the Clean Sky program.
Conclusions
This work shows results from the recently completed WENEMOR project. The project successfully tested a wide range of airframe configurations featuring installed CROR engines operated in both pusher and tractor modes. In total nine pusher and seven tractor airframe geometries were tested which were operated with both approach and takeoff settings for both the airframe and the CROR engines. This produced 32 unique airframe and CROR test conditions which were each tested at a variety of AoA and flow speeds. In total 288 test conditions were completed as part of the installed airframe tests. The geometric parameters which were varied included interchangeable tailpieces, variable fuselage length, engine pylon rotation, and engine pylon elongation. While over 250 near and far-field sensors were deployed throughout the test campaign this work focuses on the results of the linear far-field array which covered emission angles from
These results successfully identified changes in the CROR noise emission to the far-field as a function of flow speed, AoA, and airframe geometry. The changes in directivity, tonal content, and broadband levels of the CROR source have been clearly identified for the airframe geometries tested. The noise emission of the baseline airframes correlated well with what was expected from literature. The relative levels of the rotor tones and their associated directivity patterns were easily understood from the theory of CROR noise emission. The very large test campaign led to an intimidating dataset for analysis. The choice of exactly equal blade rotation speeds and blade count allowed for simpler analysis of the tonal noise emission as rotor-alone tones and interaction tones could be considered together with respect to airframe shielding.
The investigation of tones at the first four BPFs for the pusher configurations identified an improved performance for the configurations featuring a
For the tractor configurations, the TR-E configurations, which are comparable to the PS-E airframes, are again the best performing airframes offering significant reductions of the dominate tones at 2*BPF while the increases in the BPF tones are negligible when considering the relative levels.
These results compare well with the numerical simulations of Sanders et al.,6,7 which reported beneficial effects of increased pylon angle and for the L and U tails. The differences in directivity for the various BPF tones and the broadband noise demonstrate the challenge faced when designing an airframe with shielding benefits for CROR noise. This work has shown that, for the variety of airframes configurations considered here, the best performing design is a function of both the component of the noise emission and also varies with angle of attack, flow speed, and between takeoff and approach settings. Tables 6 and 7 showed differences of up to
Further investigation of the airframe effects on the broadband components of CROR noise emission was conducted through the application of a frequency domain tone deletion algorithm. Generally, the broadband emission of the engines was less sensitive to changes in angle of attack than the tonal noise. Changes of up to 8 dB were observed at certain emission angles with increasing freestream velocity. The various airframes affected the broadband noise levels observed on the linear far-field array on the order of
Footnotes
Acknowledgments
Authors acknowledge all the partners that took part in the WENEMOR project: UNIVPM, MicrodB, Pininfarina SPA, Eurotech, Teknosud, Paragon with TCD as coordinator. The authors would like to acknowledge the work of Dr Francesco Amoroso of Eurotech who led the manufacture of the model, Mr Marco Esposito of Teknosud who led the wind tunnel model design, and Mr Antonello Bianco for leading the wind tunnel test campaign. The authors also acknowledge Messrs Michele Averardo and Massimiliano Di Giulio from LEONARDO Aircraft as Clean Sky topic managers.
Declaration of conflicting interests
The author(s) declared no potential conflicts of interest with respect to the research, authorship, and/or publication of this article.
Funding
The author(s) disclosed receipt of the following financial support for the research, authorship, and/or publication of this article: The research leading to these results has received funding from the European Union’s Seventh Framework Programme (FP7/2007–2013) for the Clean Sky Joint Technology Initiative under grant agreements no. (278419) (WENEMOR).