
Abstract
This study introduces a new method for precise acoustic drone localization and tracking via the noise generated by the drone. Drone noises include harmonic frequency components which are related to the rotational speed of the propeller and the number of blades. This study integrates utilization of the frequency components around harmonics into Steered Response Power - Phase Transform (SRP-PHAT). First, a custom discrete Fourier transform (namely DFT-Harmonics) is defined which concentrates only on the vicinities of harmonics to capture the frequency components possibly related to the drone sound. Then, DFT-Harmonics is integrated into SRP-PHAT, which is named SRP-Harmonics. The benefits of SRP-Harmonics are explained and illustrated via SRP maps and videos. Experiments with real microphone array data show that SRP-Harmonics is precise in localizing and tracking a drone, while the ordinary SRP-PHAT can not be reasonably successful. Moreover, SRP-Harmonics after Kaiser window can maintain its performance even when significant level of artificial white noise or natural wind noise exists in the data.
Keywords
Introduction
Unmanned aerial vehicles (UAV) or namely drones are today utilized worldwide in commercial, defense or civil applications. The potential missions and the variety of possible applications of small drones are inevitably increasing.1,2 The current and prospective opportunities provided by the drones within social, environmental or commercial areas increase the popularity of them. 3 Of course, this popularity inevitably brings many problems such as the growing controversy about drone trespass. 4 Because of the need for avoidance of drone trespass in civilian environments or in defense industry, drone detection, localization and tracking are listed among popular research questions. 5 This research area is so popular that several authors attempt to collect all the related studies to construct literature reviews on this subject.5–9 Four major categories namely radar, visual, acoustic, and radio-frequency sensing systems are cited to classify these studies. 5 Use of drone sounds for detection or tracking can be attractive because of not requiring line-of-sight, independency from visual or light conditions and the low costs to build the system. 7 Acoustic detection or localization of the drones can be critical also for the drones which may not emit any radio wave. 6
The majority of the acoustic studies regarding drones are about detection or classification of drones. In the literature, the features utilized in detection of drone sound can be listed as follows: short time energy, temporal centroid, zero crossing rate, spectral centroid, spectral roll-off, Linear Predictive Cepstral Coefficients and finally Mel-Frequency Cepstral Coefficients. And the classifiers employed during detection of drone sound can be listed as follows: Gaussian Mixture Model, Hidden Markov Model (HMM), K-Nearest Neighbors, Support Vector Machines, Q-factor wavelet transform, Skinny Pattern, Convolutional Neural Network, Recurrent Neural Network and finally Light-Weight Convolutional Neural Network.10–19 All these studies depend on machine learning (mainly deep learning), and differ in the features that are used in the systems.
Beyond detection or classification, drone localization and tracking were also studied in the literature. Generalized Cross Correlation - Phase Transform (GCC-PHAT) based time difference of arrival (TDOA) estimations or direction of arrival (DOA) estimations for localization, and Kalman Filter or HMM systems for tracking have been previously utilized.20,21 Indoor acoustic localization systems were constructed to allow localization of drones in GPS-denied environments. 22 Fang et al. 23 used a different technological setup (fiber-optic acoustic sensors) rather than ordinary microphone array to localize the drones. Furthermore, there exist studies about acoustic source and noise localization around aerial vehicle components and engines to be able better design these components.24–27
Periodic or harmonic components within the sounds of aerial vehicles were previously exploited in detection, direction finding and localization of these vehicles. There are a couple of sources of UAV noise that can be harmonic, 28 but the noise of propeller and rotor is often the loudest harmonic noise source. Magliozzi et al. 28 stated that the propeller noise can be considered as the combination of harmonic components and broadband noise. The harmonic components are directly related to the rotational speed of the propeller and the number of blades. The harmonics were utilized to reduce the computational complexity of the direction finding algorithms firstly for ground vehicles 29 and then for drones.30,31 Moreover, Harmonic Line Association (HLA) was used to classify drone sounds.32,33
Combined schemes for drone detection and localization were also developed where HLA was used for only drone detection not for localization.34,35 Itare et al. 36 employed time-domain delay-and-sum beamforming for DOA estimation of a drone via frequency components in accordance with harmonics. Finally, Djurek et al. 37 stated that attempting to build acoustic signatures for drones based on only the harmonics and their ratios is not adequate. They said that the frequency components close to harmonics should be also taken into account, because there always exist frequency components around the harmonics that are related to the rotation of electric motors and quadcopter blades (i.e. the narrow band random components as defined by Magliozzi et al. 28 ).
Unlike all these studies, this study integrates utilization of frequency components around harmonics into Steered Response Power - Phase Transform (SRP-PHAT), and the new proposed method is named as Steered Response Power around Harmonics or simply SRP-Harmonics. First, a custom discrete Fourier transform (DFT) is defined and named as DFT-Harmonics. DFT-Harmonics only and densely concentrates on the vicinities of harmonics. Next, integration of DFT-Harmonics and SRP-PHAT is proposed. The new method (i.e. SRP-Harmonics) and its benefits are explained and illustrated via SRP maps. Finally, by means of experiments with real microphone array data, it is shown that SRP-Harmonics is quite effective in localizing and tracking a drone. In the conclusion, the effectiveness and practicability of the proposed method and the future research directions are discussed.
Steered response power around harmonics (SRP-Harmonics)
As mentioned previously, this study integrates exploitation of the frequency components around harmonics into SRP-PHAT method. In order to make this integration, first a custom DFT is defined, and it is named as DFT-Harmonics. Next, estimating TDOA via GCC-PHAT based on DFT-Harmonics is illustrated to conceptually introduce the new localization framework. Next, SRP-Harmonics (i.e. integration of DFT-Harmonics and SRP-PHAT) is described. Finally, before moving on to localization experiments, the harmonic components of the noise of DJI Phantom 4 and the issue of wind noise are briefly discussed.
A custom DFT to concentrate only on vicinities of harmonics: DFT-Harmonics
In this section, the idea is to develop a custom DFT which concentrates only on the vicinities of the harmonics of a periodic signal (e.g. drone sound). The ordinary DFT and the inverse transform have been previously defined as follows:
38


In this study, a custom DFT which concentrates only on the vicinities of harmonic frequencies of the periodic signals is proposed, so it is simply referred to as DFT-Harmonics. DFT-Harmonics can be defined as follows:


Finally, the complete sequence

In the rest of this study, the parameters are designated as

Finally, the inverse transform for DFT-Harmonics can be defined as follows,
The continuous time frequency

In order to more clearly define the new method and to more accurately depict its difference compared to the conventional method, before analyzing the drone sound, the new concepts will be first explained via a nearly-perfect periodic signal that is a steady /AA/ vowel sound from a male voice for 0.36 s. The reason of this attempt is that the harmonics of this almost periodic signal are more significant, so this will result in more clear SRP maps. The harmonics of the drone sound will be discussed later.
Figure 1(a) illustrates the ordinary DFT of this signal against (a) The ordinary DFT of a nearly-perfect periodic sound, (b) the components of DFT-harmonics around a single harmonic.
Figure 1(b) illustrates the difference between the ordinary DFT and DFT-Harmonics. It shows the vicinity of the second harmonic which is labeled by the dashed red rectangle shown in Figure 1(a). Only a few frequency components of the ordinary DFT hit the second harmonic. On the other hand, in DFT-Harmonics, the frequency components are densely located around it as shown in Figure 1(b). Consequently, DFT-Harmonics will be proficient in comprising all the important frequency components related to the rotation of electric motors and quadcopter blades by taking into account the harmonic components as well as the narrow band random components.
GCC-PHAT and localization via DFT-Harmonics
To obtain the time delay or namely TDOA (in samples) between two signals

As can be seen in Figure 2(a), the cross-correlation function is supposed to be a delayed impulse function where (a) The cross-correlation function obtained by using ordinary DFT corresponds to a delayed impulse function, (b) the location of the source can be determined by intersection of hyperbolas, (c) the cross-correlation function obtained by using DFT-Harmonics corresponds to a delayed impulse train multiplied by a 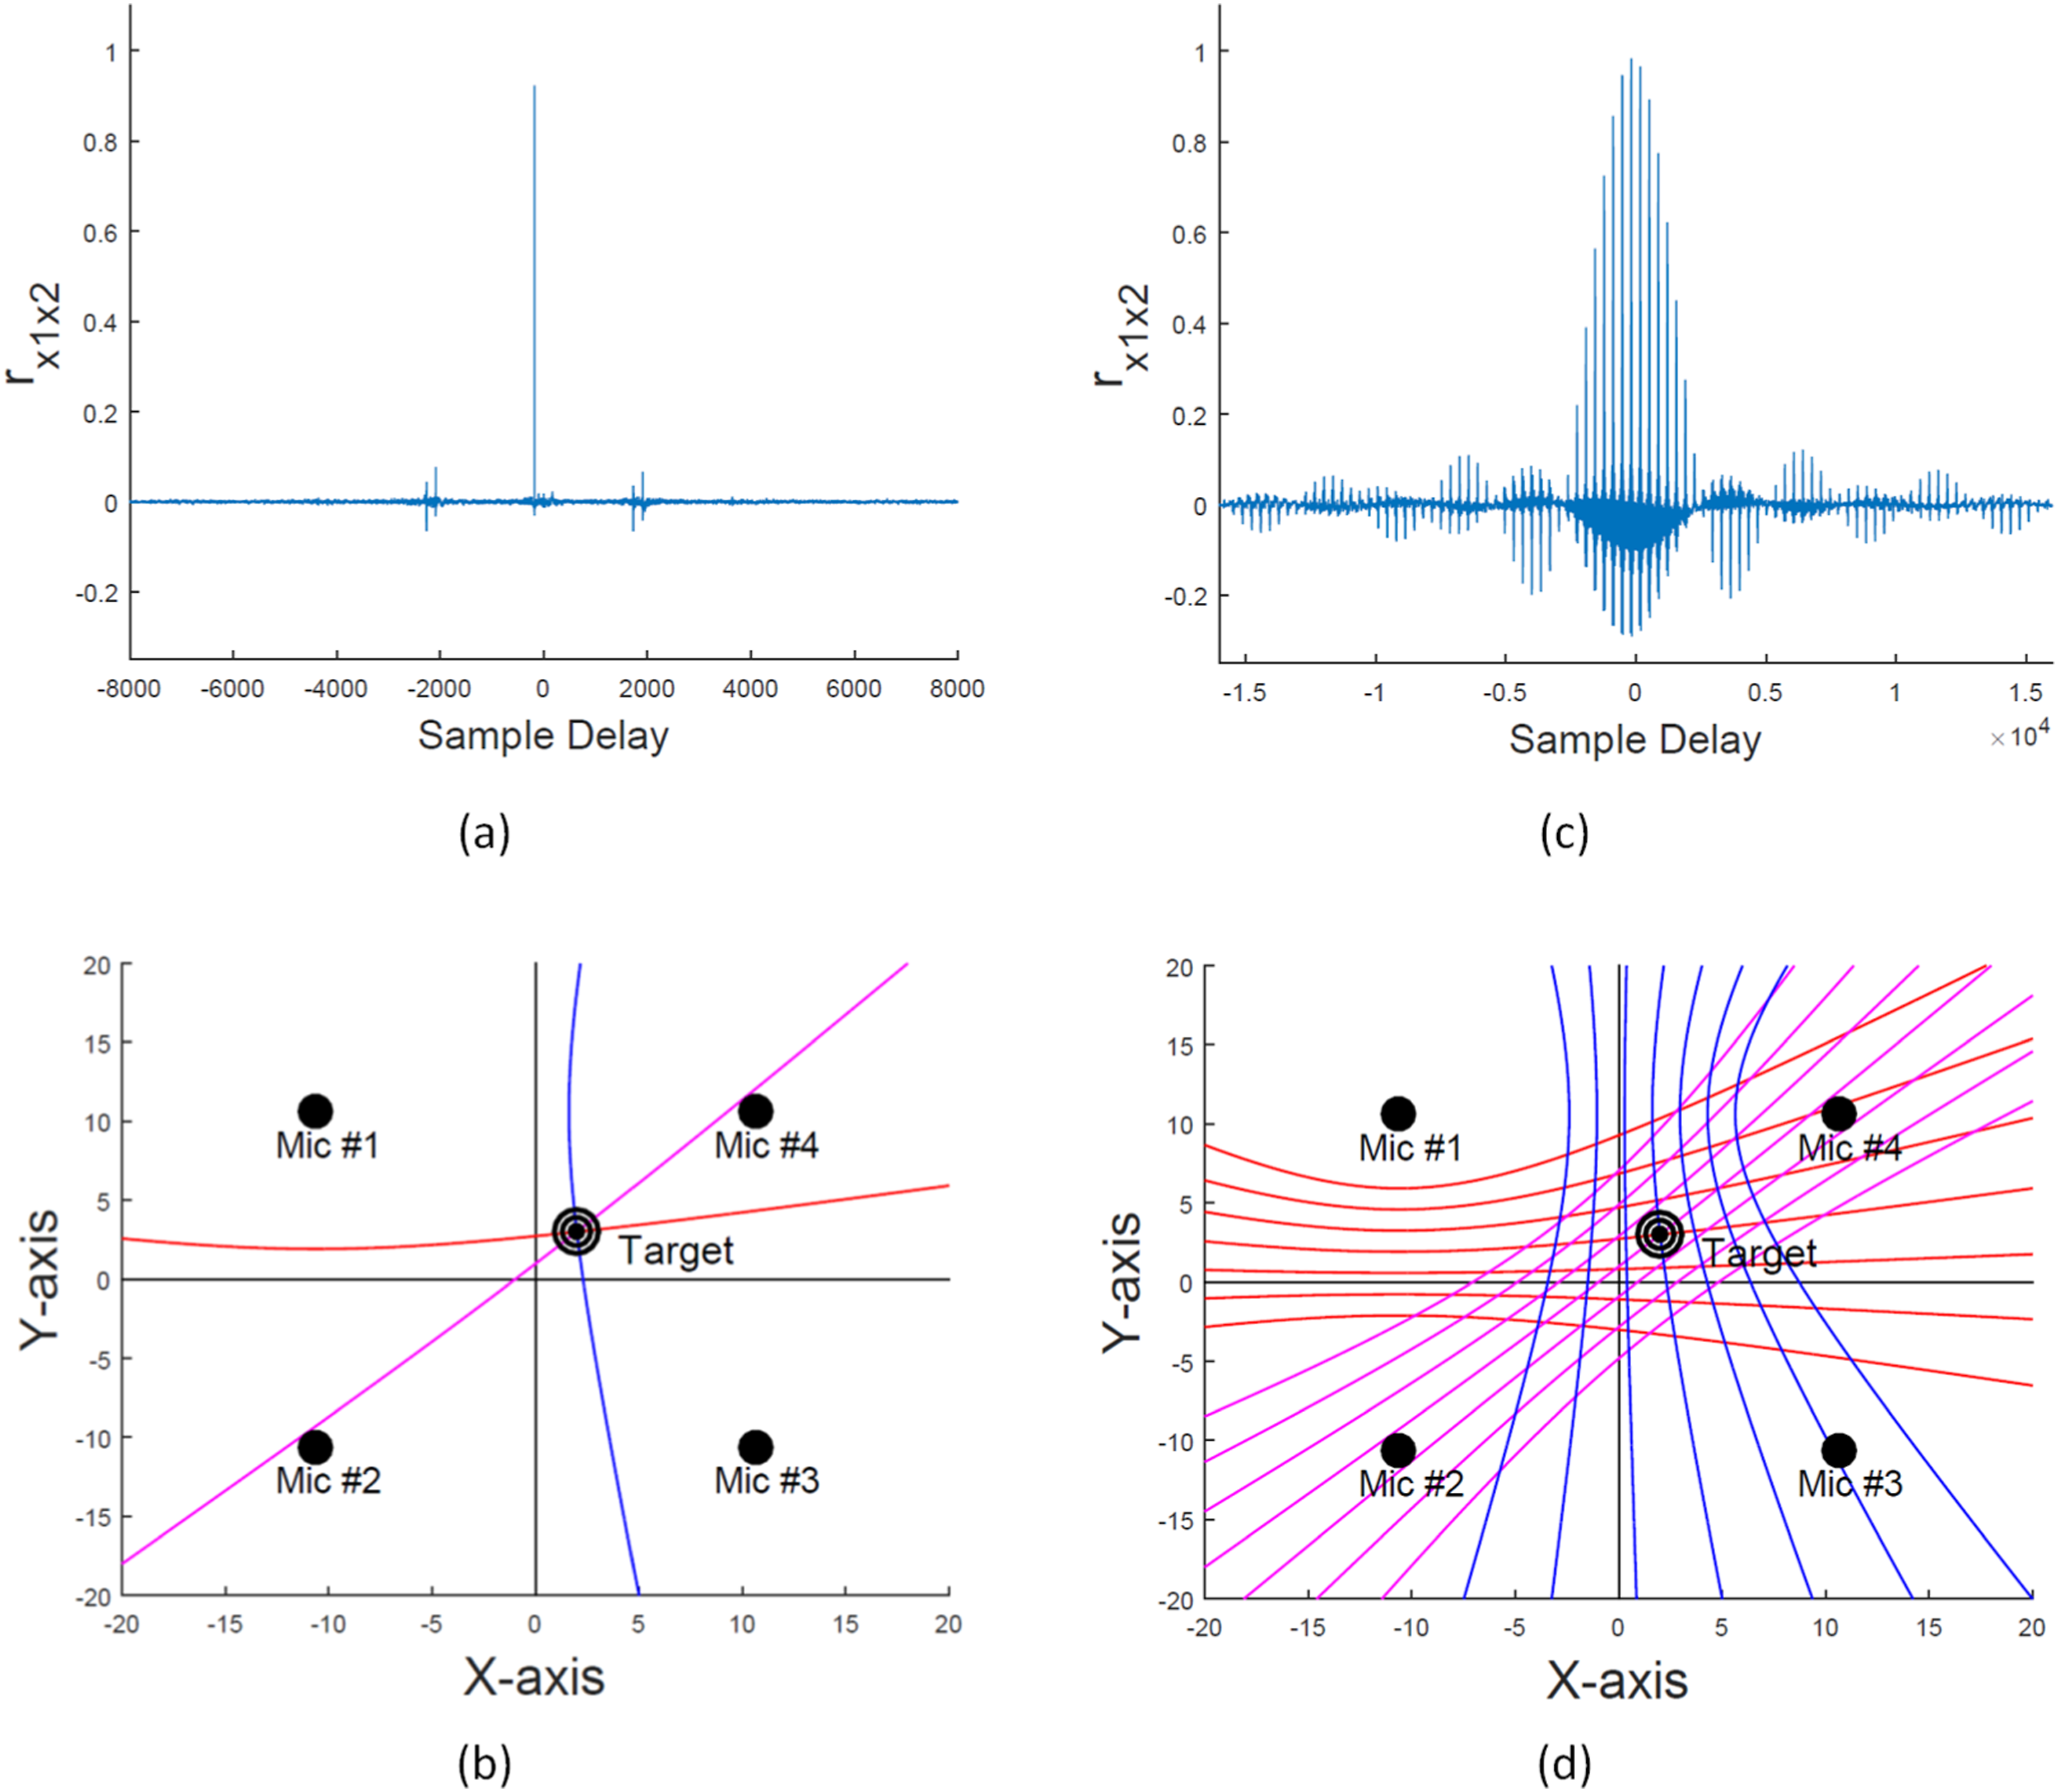
This study utilizes DFT-Harmonics instead of the ordinary DFT, therefore the new function

From this perspective, the new time-domain cross-correlation function is supposed to be as follows:

The side effect of utilization of DFT-Harmonics is the formations of local maxima in the time-domain cross correlation function. If it is considered that all these local maxima correspond to also other hyperbolas in two dimensional space, the scheme of intersections of hyperbolas becomes a grid as shown Figure 2(d). This grid will explain the overall view of the SRP map obtained via DFT-Harmonics shown in the next section. At the first glance, it may be considered that formation of this grid would confuse the localization process, however it will be shown that the local maxima will not create any significant issue and SRP-Harmonics can effectively localize the source.
Ordinary SRP-PHAT versus SRP-Harmonics
SRP-PHAT is a powerful localization method which is based on the proposition that the location of the source emits more energy than all other locations in the search space. Before providing formula of SRP-PHAT, the function which maps the point
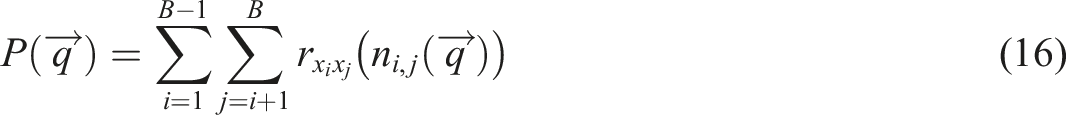

In this study, equation (16) is reorganized by inserting the correlation function
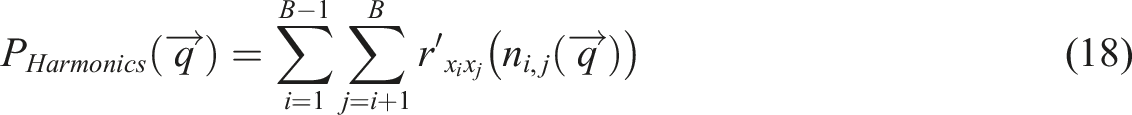
Figure 3 demonstrates the SRP maps for different signal-to-noise ratios (SNR) of a sample artificial localization scheme based on again the same signal mentioned above. In this localization scheme, four different microphones are located at (−10, −10), (−10, 10), (10, −10) and (10, 10) m. In the simulation, white Gaussian noises with different SNR values are added to the data. Finally, the source is attempted to be localized via SRP-PHAT and SRP-Harmonics. In the SRP maps shown in Figure 3, the resolution is 0.1 m and the darker color represents the higher power value. The SRP maps of SRP-PHAT and SRP-Harmonics for different SNR values in an artificial localization scheme with nearly-perfect periodic sound.
Figure 3(a) shows the map of the ordinary SRP-PHAT for noise-free condition. As can be seen, the hyperbolas can be clearly observed in this map, and these hyperbolas intersect each other at the position of the target (i.e. the source). As a result, the maximum point of the SRP map occurs exactly at the target position. Figure 3(d) shows the map of the SRP-Harmonics for noise-free condition. As can be seen, the grid of hyperbolas mentioned in the previous section is visible in this map. The dominant hyperbolas intersect each other at the position of the target, so the maximum point of the SRP-Harmonics occurs also exactly at the target position. From this perspective, both methods appear to be equal, however the advantage of the SRP-Harmonics will be apparent when the noise level increases.
Figure 3(b) shows the map of the ordinary SRP-PHAT for SNR value of −10 dB. As can be seen, the SRP map is now imprecise, yet it is still possible to observe the intersection of hyperbolas at the target position. Consequently, the maximum point still occurs at the target position. On the other hand, Figure 3(e) shows the map of the SRP-Harmonics for SNR value of −10 dB. Unlike the map of ordinary SRP-PHAT, this map is quite clear and it appears that it has not been affected by this high level of noise. Again, the maximum point of the SRP-Harmonics occurs at the target position.
Figure 3(c) shows the map of the ordinary SRP-PHAT for SNR value of −15 dB. Now, the SRP map is significantly imprecise, so the maximum point of the SRP map occurs at a false position. On the other hand, the map of the SRP-Harmonics shown in Figure 3(f) is relatively clean compared to Figure 3(c). And, the maximum point of the SRP-Harmonics still occurs at the target position. Therefore, SRP-Harmonics is an effective noise-resilient method for the signals having significant harmonics. In the next sections, it will be shown that SRP-Harmonics is a proper and effective method for drone localization and tracking, because the drone noise also possesses apparent harmonics.
Harmonics of drone sound, wind noise and effect of Kaiser windows
As mentioned previously, the overall aim of this study is to build a method to effectively localize the drones through their noises. In the previous section, it is mentioned that SRP-Harmonics can effectively localize the signals having significant harmonics. In the literature, it was mentioned that the sounds of aerial vehicles have significant harmonic components. When the sound of the DJI Phantom 4 is recorded outdoor with the sampling rate 48 kHz, the spectrogram of this humming sound is obtained as shown in Figure 4(a). As can be seen, the existence of horizontal parallel lines that are visible especially under 1 kHz indicates the presence of harmonics. (a) Spectrogram of the drone sound, (b) the auto-correlation function, (c) frequency spectrum of the drone sound in which harmonics are apparent.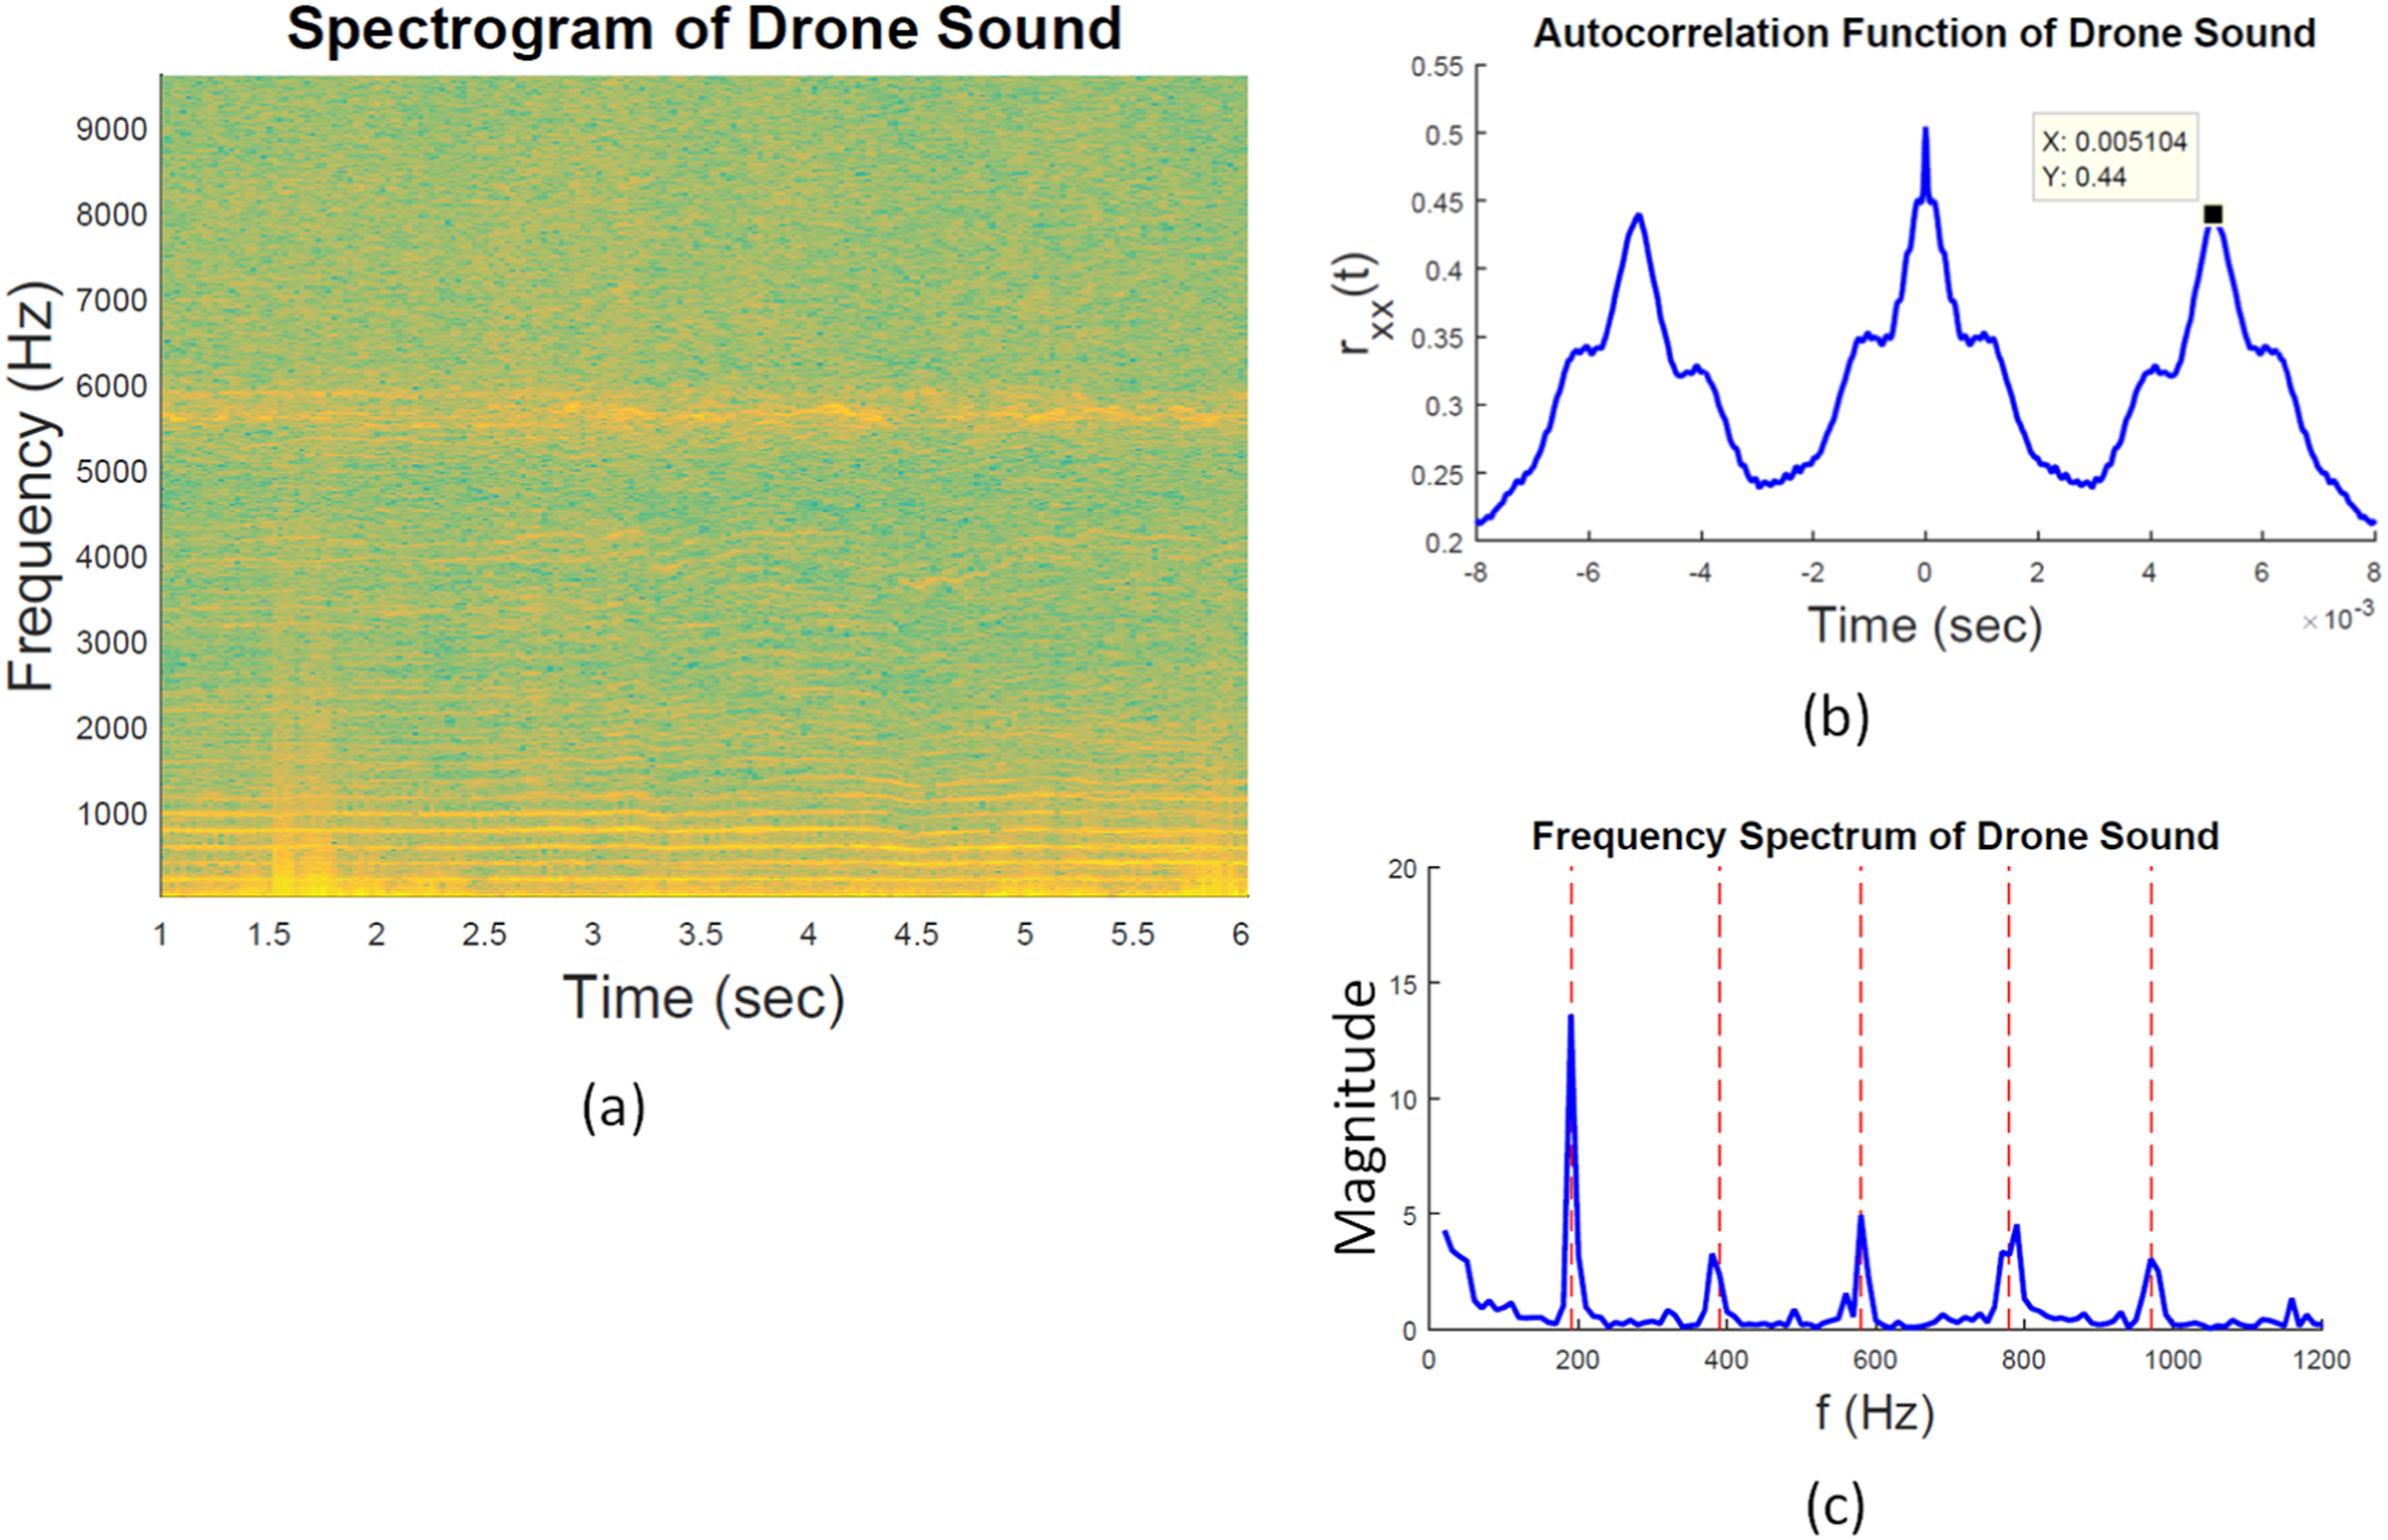
In the autocorrelation function of the drone sound shown in Figure 4(b), there exists a significant peak which occurs at 5.1 ms, therefore the fundamental frequency of the drone sound is 196 Hz (i.e. 5880 rpm of motor by keeping in mind that the propeller has two blades 28 ). Figure 4(c) shows the spectrum of the drone sound where the harmonics are quite visible.
Of course, the signal should be windowed during its analysis to be able deal with short time intervals of the signal each time. The side lobes of the frequency response of rectangular windows are relatively high, which creates the problem of spectral leakage. 38 Therefore, the spectral view of the harmonics of the drone can be improved by utilizing window functions such as Hamming, Hanning and Kaiser windows so on. In this study, Kaiser windows are preferred because their frequency response can be adjusted by setting the β Kaiser to a desired value.
At this point, it will be discussed that Kaiser windows not only enhance the harmonics of drone sound, but also, as a side effect, significantly attenuate the negative effect of the wind or gust. As shown in Figure 5(a), the effect of wind or gust can be defined as a low frequency noise with a very large amplitude. The large amplitude of the wind noise results in very significant low-frequency components in the spectrum. If rectangular windows are utilized in case of wind, the frequency components of wind noise have very high side lobes which suppress the harmonics of the drone sound as shown in the red plot of Figure 5(b). On the other hand, by applying other windows which have lower side lobes, this negative effect of wind or gust can be attenuated. If Kaiser window with β
Kaiser
= 10 is applied, then the side lobes of wind are quite attenuated, and the harmonics of drone sound become apparent as shown in the blue plot of Figure 5(b). (a) Drone sound together with wind (or gust) noise in time domain, (b) drone sound together with wind (or gust) noise in frequency domain and the effect of utilizing of Kaiser windows.
Simulations and experiments
In this chapter, by using the real microphone array data, it will be demonstrated that SRP-Harmonics is quite effective in localizing and tracking a drone by means of the noise that it generates. First, localization of a stable drone is discussed. Next, the resilience of SRP-Harmonics is discussed via artificial white Gaussian noise, artificial wind noise and natural wind noise experiments. Finally, tracking a moving drone in two and three dimensional spaces is discussed.
Experiments of localization of a stable drone via microphone array
In this section, the experiments of localizing a stable drone via real microphone array data are presented. The microphone array used to record the data is the TASCAM® US1800, the microphones are Audio-Technica® AT2031, and finally the drone is DJI Phantom 4 as shown in Figure 6(a). The microphones are located outdoor linearly with 3.30 m distance. The heights of the microphones are adjusted to 1.2 m via adjustable microphone stands as depicted in Figure 6(b). When auto take off is applied, DJI Phantom 4 takes off and hovers at an altitude of 1.2 m that is the same height with the microphones. Consequently, accepting the center of the microphones as the origin and the alignment of the microphones as the x-axis, an outdoor two dimensional localization setup is established. For three dimensional localization, the drone is positioned to a random altitude. The equipment used in the experiments and the experimental setup.
In a sample experiment, the drone is located at the point (9, 14) m via 50 m measuring tape, and its sound has been recorded by the microphone array for 11 s after take-off. The number of harmonics included in calculations for SRP-Harmonics is 7. The fundamental frequency of the drone sound is calculated and updated for each time window to be able to more effectively apply SRP-Harmonics. When the window length is set to be 0.5 s, SRP maps (with 0.05 m resolution) shown in Figure 7 are obtained. As can be seen, while SRP-Harmonics (Figure 7(b)) is successfully localizing the drone, the ordinary SRP-PHAT (Figure 7(a)) can not be quite precise about its location. Moreover, if the window shift length is set to 0.1 s, the video at the link https://youtu.be/I0q1NTxCJig is obtained which contains all the maps of SRP-Harmonics through 11 s. As can be seen throughout video, SRP-Harmonics can accurately localize the drone. (a) SRP map of SRP-PHAT for localization of a stable drone, (b) SRP map of SRP-Harmonics for localization of a stable drone (https://youtu.be/I0q1NTxCJig).
Experiments with artificial white Gaussian noise, artificial and natural wind noise
To statistically inspect the noise resilience of the SRP-Harmonics, the drone is localized at 55 different locations as a grid from −12.5 to 12.5 m with 2.5 m increment along x-axis and from 10 to 18 m with 2 m increment along y-axis. For each location, the sound of the drone hovering at the height of 1.2 m is recorded for around 10 s. The window length is set to 0.5 s and the shift length is set to 0.1 s. With these parameters, the drone is localized via SRP-PHAT and SRP-Harmonics, and root mean squared (RMS) localization errors of all these windows are calculated.
Firstly, artificial white Gaussian noise is added to the microphone array data. As can be seen in Figure 8(a), SRP-Harmonics can successfully localize the drone and maintain its success up to 40 dB SNR. On the other hand, the ordinary SRP-PHAT can not effectively localize the drone in any noise level. As mentioned previously, Kaiser windows enhance the harmonics of the drone sound. When Kaiser Windows with βKaiser = 10 are applied before SRP-PHAT, it is observed that it significantly improves the performance of SRP-PHAT yet it is still not quite effective. Finally, utilization of Kaiser Windows also improves the performance of SRP-Harmonics. As seen, SRP-Harmonics after Kaiser Window maintains its initial success up to 30 dB SNR. (a) RMS localization error in case of artificial white Gaussian noise, (b) RMS localization error in case of artificial wind noise, (c) spectrogram and localization error of SRP-Harmonics in case of natural wind noise, (d) spectrogram and localization error of SRP-Harmonics after Kaiser window in case of natural wind noise (https://youtu.be/ON8T0jqWGdY).
Secondly, artificial wind noise is added to the microphone array data. Random noise signals are created which include frequency components only below 100 Hz to simulate the wind noise. As can be seen in Figure 8(b), SRP-Harmonics can successfully localize and maintain its success up to 10 dB SNR. SRP-Harmonics after Kaiser Window maintains its initial success up to 0 dB SNR. Utilization of Kaiser windows significantly improves the performance of SRP-Harmonics, because it attenuates the negative effect of wind noise as mentioned previously. Finally, both the SRP-PHAT and the SRP-PHAT after Kaiser window can not precisely localize the drone.
Lastly, the wind screens of the microphones are deliberately removed to record the sound of drone together with natural wind noise. Figure 8(c) shows a sample spectrogram where wind (or gust) blows after 7.5 s and it creates around 0 dB wind noise, which is estimated by comparing the power spectral densities before and during the wind. As seen in Figure 8(c), the localization performance of SRP-Harmonics decreases in case of this level of wind. However, as seen in Figure 8(d), utilization of Kaiser windows makes the drone harmonics quite apparent. Therefore, the localization performance of SRP-Harmonics after Kaiser window can maintain its success in spite of this natural wind (or gust) noise. The video at the link https://youtu.be/ON8T0jqWGdY demonstrates these spectrograms together with the recorded audio.
Experiments of tracking a moving drone via microphone array
In this section, the experiments about tracking a moving drone are presented. First the drone takes off, then a random direction is arranged via the orientation stick of the remote controller. Finally, by pushing the movement stick exactly forward and keeping its position stable, the drone is allowed to make a linear movement with a random constant speed. During this movement, its sound is recorded via the microphone array. The trajectory that the drone followed and its speed are later obtained via DJI GO app.
A sample movement of the drone is illustrated via red dots in Figure 9(c). The speed of the drone is 2.85 m/s. In this sample experiment, both the window and shift length are 0.2 s. Figure 9(a) and (b) show the SRP maps of SRP-Harmonics for two different time instants. As can be seen in these SRP maps, the global maximum points coincide with the current drone positions. In Figure 9(c), it can be seen that throughout the movement of the drone, SRP-Harmonics produced outlying estimations for only two frames. These outlying points occur because the movement of the drone causes instability in TDOA values. The relative distances of the moving drone to each microphone keep changing within a time window, therefore this issue can occasionally confuse the localization algorithm and produce outliers. In Figure 9(c), all the other localization points coincide with the trajectory of the drone. The video at the link https://youtu.be/WAaoHe-U3Bg contains all the maps of SRP-Harmonics as a movie throughout the motion of the drone. (a) and (b) are the SRP maps of SRP-Harmonics for two different time instants while the drone is moving (https://youtu.be/WAaoHe-U3Bg), (c) the estimated locations versus the trajectory of the drone.
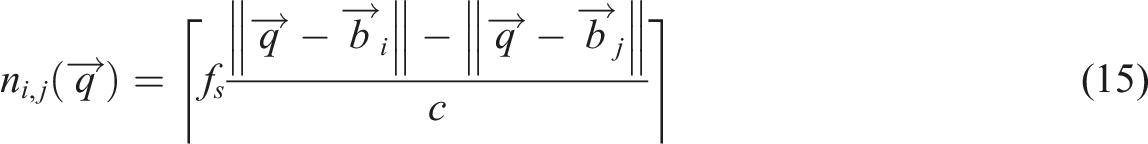
To statistically inspect the success of the SRP-Harmonics in drone tracking, the sound of the drone is recorded for 96 different linear motions with random initial point and speed. By each time applying different levels of force to the movement stick in the remote controller, it is aimed to obtain a wide range of drone speed that is between 1.5 m/s and 10 m/s. In these experiments, the window length is reduced to 0.1 s and the shift length is set to 0.05 s. Using Intel® Core™ i7 processor at turbo boost (4.6 GHz), the average execution time of localization with these specifications is found to be 0.034 s when the matrices representing TDOA in samples (equation (15)) throughout the search space are previously recorded on the computer for the current measurement geometry. Therefore, these specifications are ideal for real-time localization for this processor capacity.
In Figure 10(a), the box plots of the percent of outlying estimations for different levels of drone speeds can be seen. Even though the rate of outlying estimations can reach important values, it is proposed that the remaining points which coincide with the trajectory of the drone are quite enough to adequately estimate the speed and the trajectory of the drone via Linear Least Squares (LLS). The outlying estimations can be eliminated progressively throughout the motion of the drone. The process initiates with agglomerative hierarchical clustering after receiving a couple of location estimations (i.e. 5 estimations or more). Because the outlying estimations have a tendency to randomly scatter throughout the search region, the estimations associated with the drone trajectory stay close to each other compared to outlying points. Consequently, the initial location estimations which are not outlying are used in calculating the first estimations about the parameters of the drone trajectory. After this point, by detecting and eliminating outlying estimations every time, the LLS based estimations of the speed and the trajectory of the drone are sequentially updated. (a) The box plots regarding drone tracking when SRP-Harmonics is calculated for the whole range, (b) the box plots regarding drone tracking when SRP-Harmonics is dynamically confined into a 4 × 4 m area around the point estimated via trajectory parameters.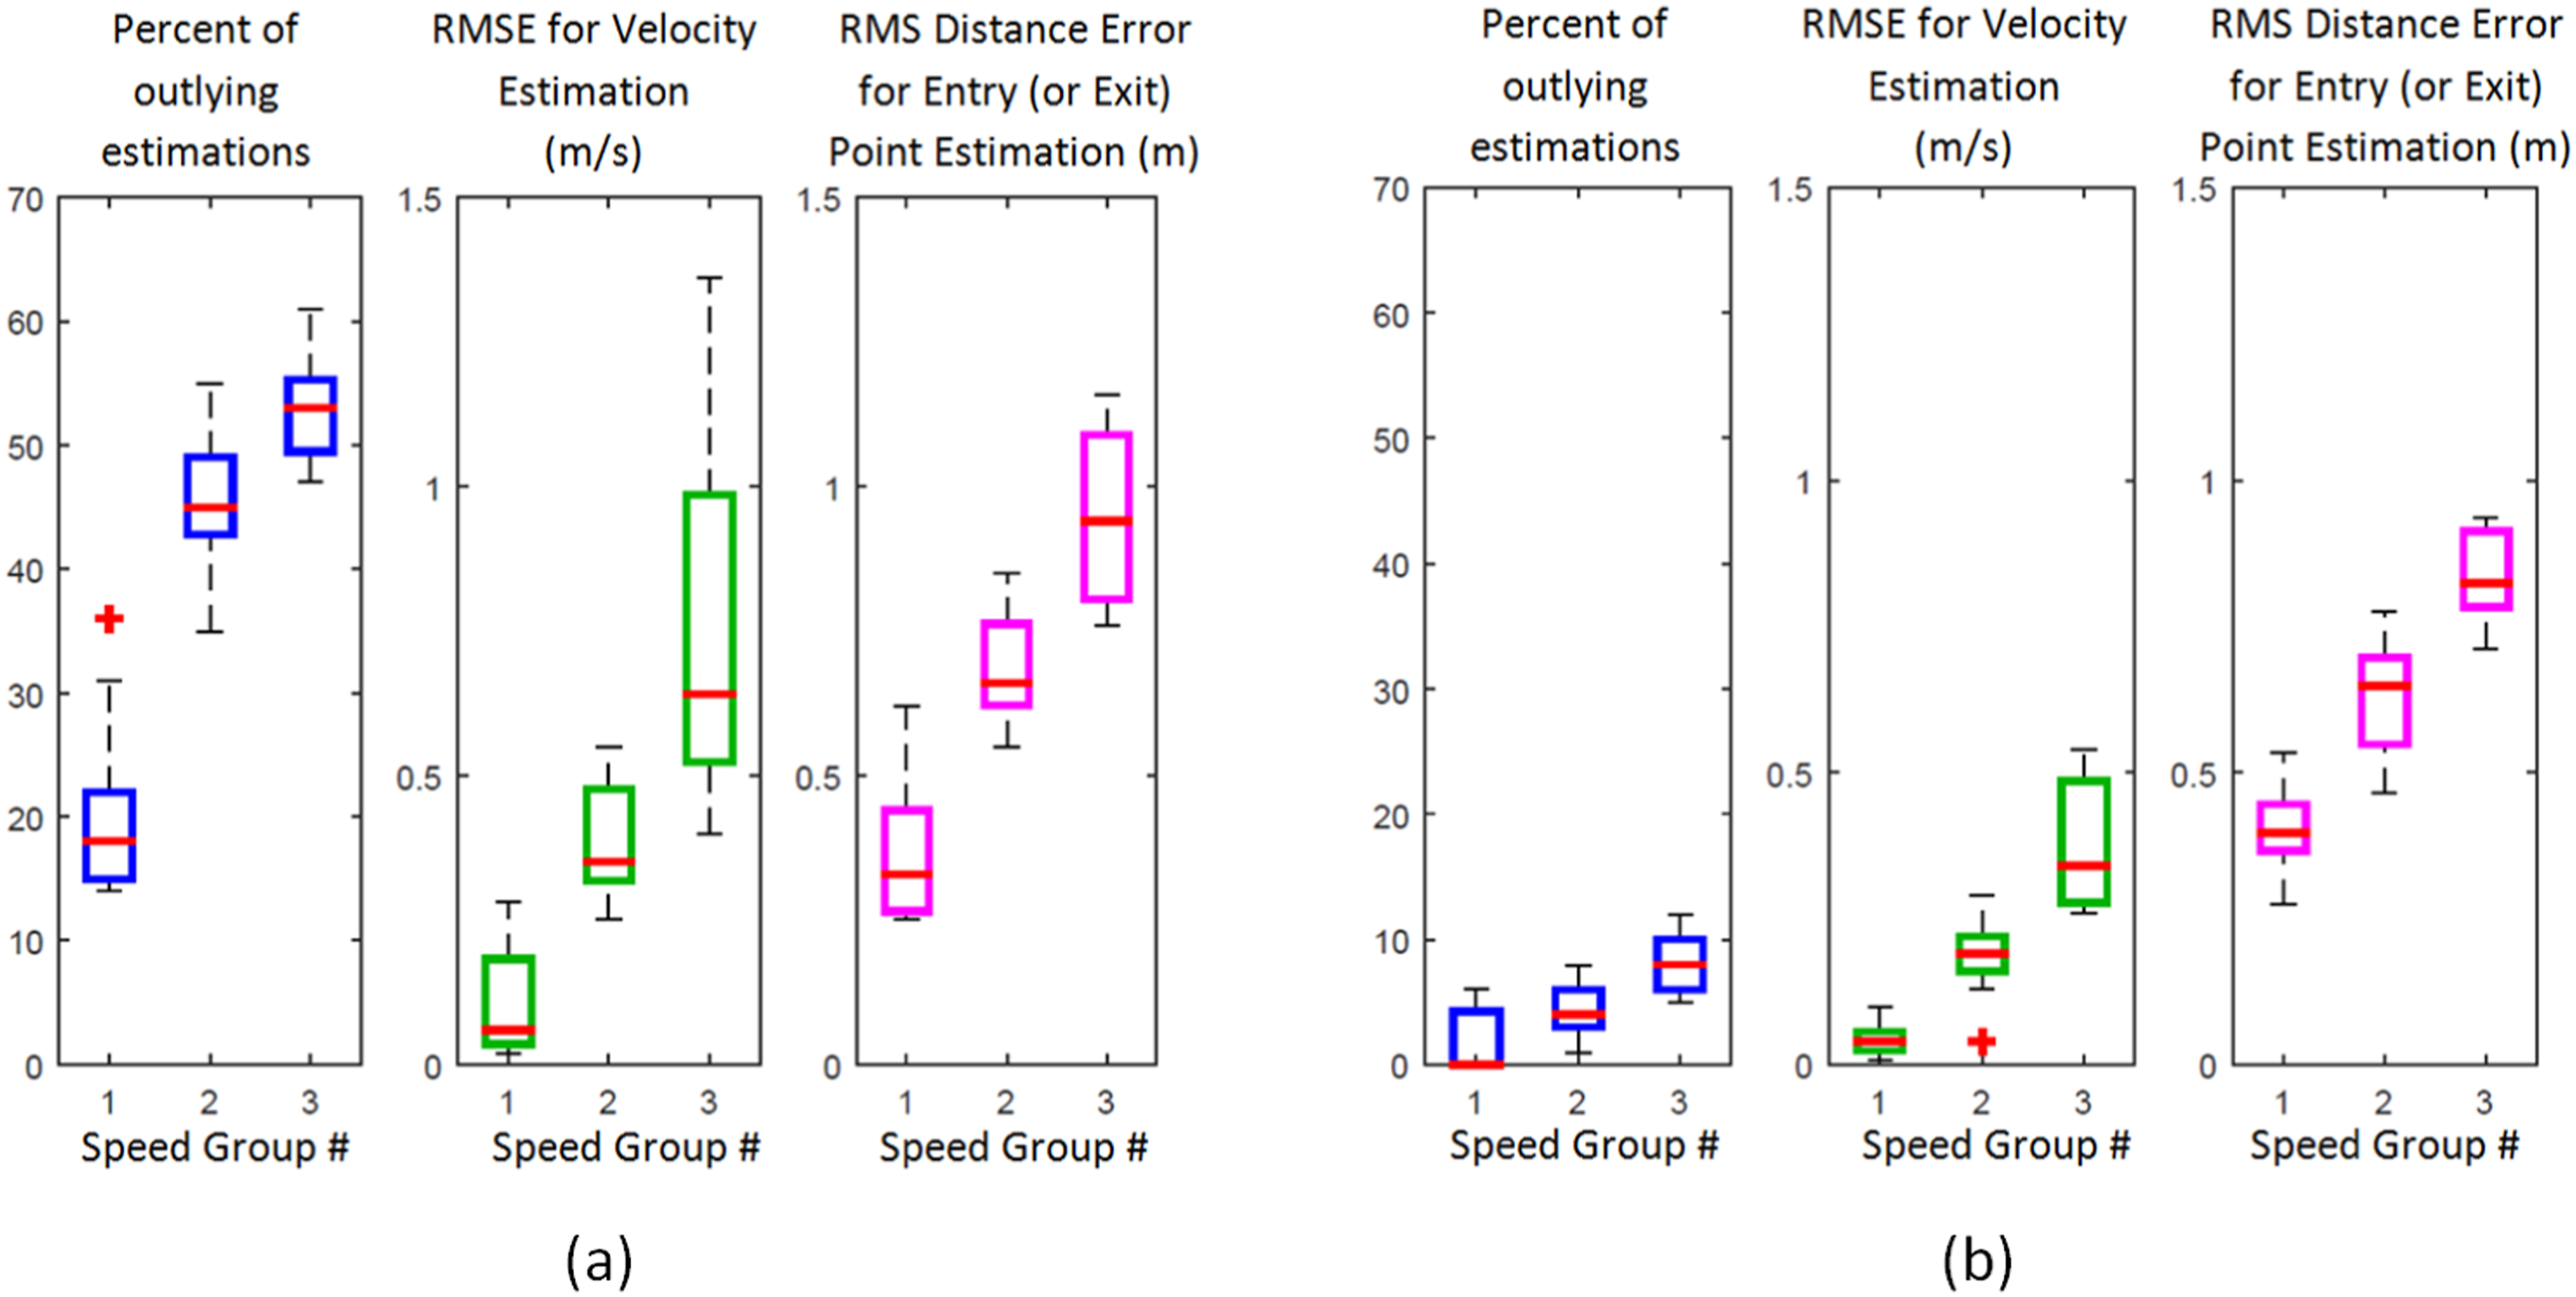
The statistical results of these experiments are summarized in Figure 10(a). Different linear motions of the drone are divided into three groups based on the speed of the drone. Speed Group #1, #2 and #3 include the motions within the speed range 1.5 – 4 m/s, 4 – 7 m/s and 7 – 10 m/s respectively. As can be seen in Figure 10(a), increasing the drone speed results in an increasing number of outlying estimations. However, as mentioned before, remaining estimations can be sufficient to satisfactorily estimate the velocity and the trajectory of the drone. Similarly, as can be seen in Figure 10(a), increasing the drone speed also raises the error in estimations of the velocity and the entry (or the exit) point of the drone to the region of interest.
Finally, these estimations can be enhanced by dynamically confining the SRP-Harmonics area instead of calculating the SRP-Harmonics every time throughout the whole range. After obtaining the first guess about the trajectory parameters, the SRP-Harmonics calculations are now confined into a 4 × 4 m area around the points estimated via trajectory parameters. As seen in Figure 10(b), this method significantly reduces the rate of outlying estimations. When the box plots in Figure 10(a) and (b) are compared to each other, it can be observed that confining the area of SRP-Harmonics also considerably reduces the errors in velocity estimations and somewhat reduces the errors in entry (or exit) point.
Drone localization and tracking in three dimensional space
In this part, drone localization and tracking in three dimensional space via microphone array are presented. For three dimensional localization, the drone is positioned to a random altitude as explained in Figure 6(b) and a triangular measurement geometry is constructed where the microphones stay at (−4.8, 0, 1.2), (4.8, 0, 1.2), (0, 0, 1.2), and (0, 3.2, 1.2) m. In the previous sections which assume two dimensional space, localization via SRP-Harmonics can be easily visualized via SRP-Harmonics surfaces or namely the maps. However, in this section which deals with three dimensional space, localization via SRP-Harmonics can only be visualized via SRP-Harmonics volumes instead of surfaces. Figure 11(a) depicts the SRP-Harmonics volume via the isosurfaces corresponding to 50% of the global maximum value. As seen, there exists an isosurface enclosing the location of the drone. The video at the link https://youtu.be/R4E7kIYuU8Q shows that this isosurface is also enclosing the global maximum, so finally, global maximum coincides with the drone location in three dimensional space. As seen in Figure 11(b), the SRP-Harmonics can successfully localize the moving drone (with a speed of 5.9 m/s) in three-dimensional space with a few outlying estimations. Three-dimensional drone localization and tracking (https://youtu.be/R4E7kIYuU8Q).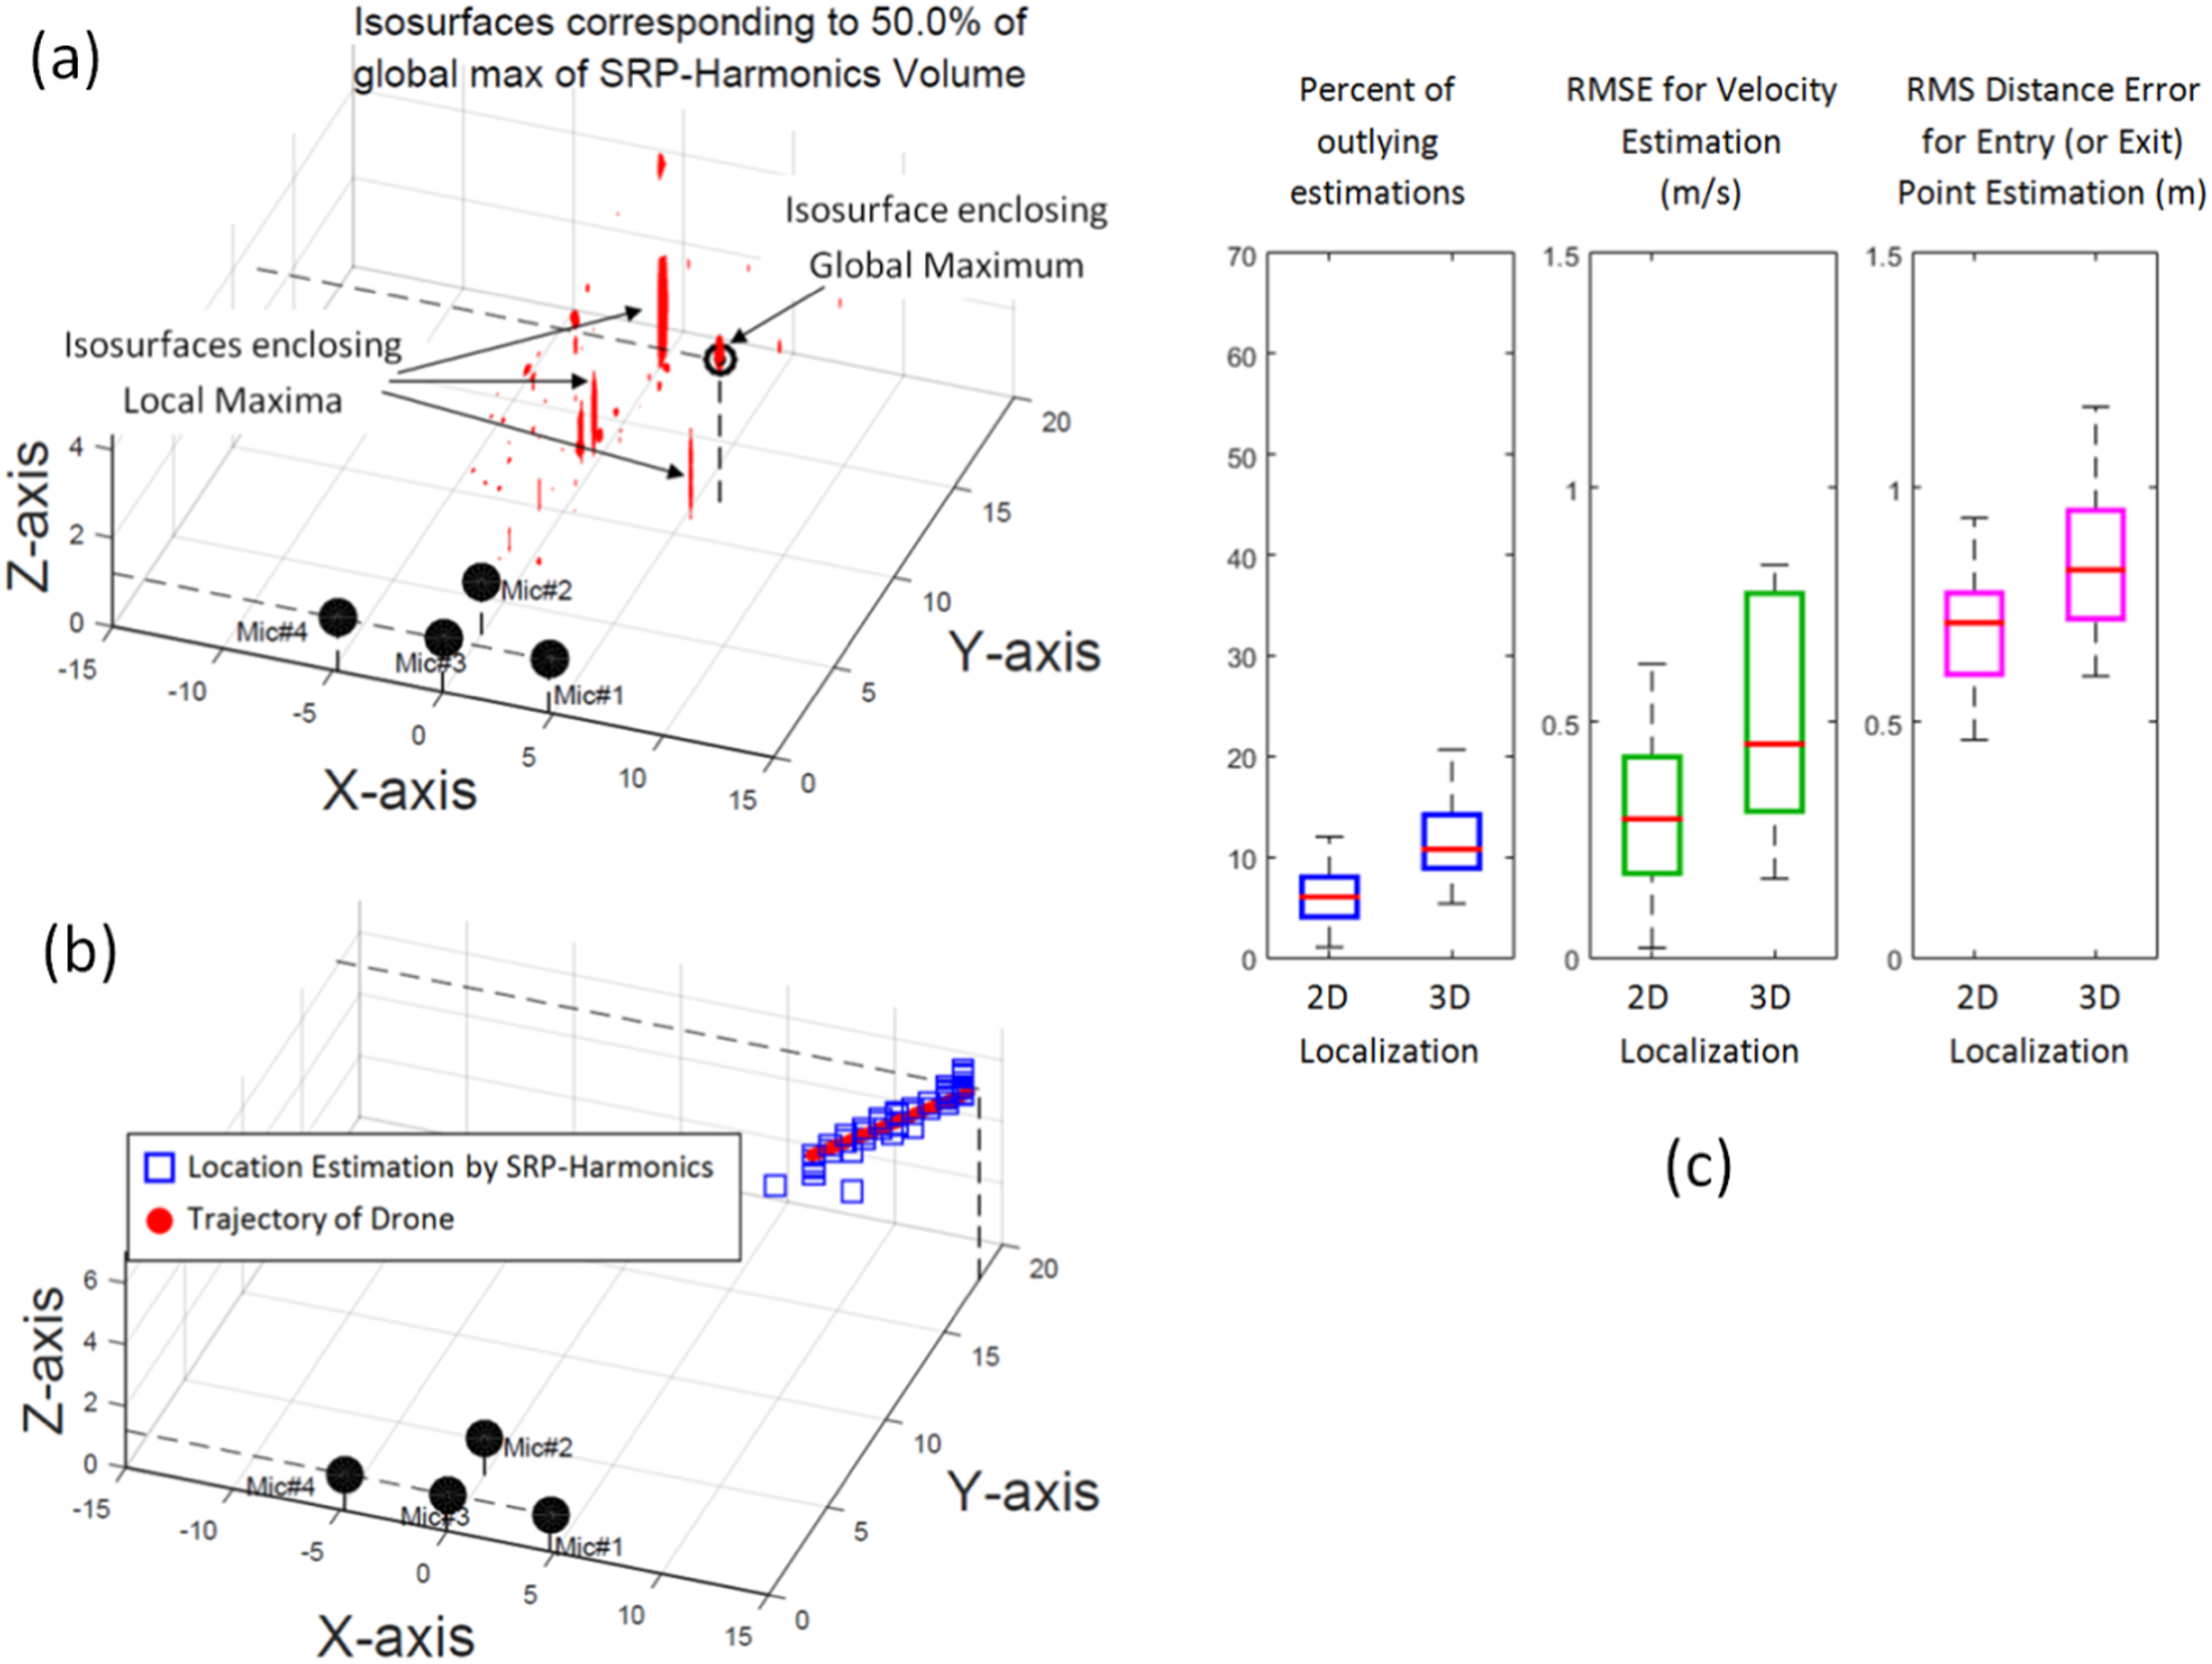
To statistically inspect the success of the SRP-Harmonics in drone tracking within a three-dimensional space, similar to the previous section, the sound of the drone is recorded for 65 different linear motions with random initial point, speed and random altitude (i.e. 1.2 to 6 m). In these experiments, the drone speeds are between 4 and 10 m/s, so they are corresponding to Speed Group #2 and #3 defined in the previous section. It can be said that SRP-Harmonics can adequately estimate the parameters of the trajectory of the drone when the box plots in Figure 11(c) is observed. Figure 11(c) also compares the estimation errors of two-dimensional versus three-dimensional localization. Finally, it can be observed that estimation errors of three-dimensional tracking are slightly higher than those of two-dimensional tracking.
Conclusion
In this study, an effective method for acoustic drone localization and tracking is introduced by integrating utilization of the harmonics into SRP-PHAT. While making this integration, this study also takes into account the frequency components close to the harmonics (i.e. the narrow band random components). Consequently, a successful localization scheme is obtained to acoustically localize the drone. The validity and reliability of the proposed method in acoustic drone localization and tracking are demonstrated by the real microphone array data. The overall characteristics and behavior of SRP-Harmonics have been depicted by visual materials namely SRP maps and videos of SRP maps to justify its success. For a stable measurement geometry, when the matrices representing TDOA in samples throughout the search space are previously recorded on the computer, real-time localization and tracking by SRP-Harmonics are feasible in two or three-dimensional space.
Due to the limitations on the number of available microphones and the lengths of available XLR cables, there were constraints on the measurement geometry in this study. A lot of microphones can be scattered throughout a region and possibly with three-dimensional configurations, so the localization distance can be significantly expanded within three-dimensional space. Moreover, utilization of more sophisticated microphones which are suitable especially for outdoor recording can also increase the range of localization. Nevertheless, the range of localization in the experiments of this study is also critically important to localize and track the drones which are trespassing or coming closer toward an area or a building for any reason.
SRP-Harmonics is also suitable to be adapted to many other applications. Localization of ground vehicles is also possible as long as they generate sounds including apparent harmonic components. Localization of human voice is also possible via SRP-Harmonics by employing the voiced parts of the speech. SRP-Harmonics can also facilitate detection and recognition of the drones when a library including the fundamental frequencies of different types of drones is available. Finally, localization of multiple drones is also possible especially when the drones have different fundamental frequencies. To sum up, considering again the reasons of employing acoustic localization for drones (i.e. not requiring line-of-sight, independency from light conditions, low costs, ability of localization of the drones not emitting any radio wave), this study contributes to this area by introducing an effective and viable method for drone localization. Until the researchers achieve to develop entirely silent aerial vehicles 1 through advanced drone noise analyses, 43 future studies will continue to study the acoustic localization of the drones.
Supplemental Material
Supplemental Material
Supplemental Material
Supplemental Material
Footnotes
Declaration of conflicting interests
The author(s) declared no potential conflicts of interest with respect to the research, authorship, and/or publication of this article.
Funding
The author(s) disclosed receipt of the following financial support for the research, authorship, and/or publication of this article: This study was supported by Eskişehir Technical University Scientific Research Projects Commission under project number 24ADP051.
Supplemental Material
Supplemental material for this article is available online.
References
Supplementary Material
Please find the following supplemental material available below.
For Open Access articles published under a Creative Commons License, all supplemental material carries the same license as the article it is associated with.
For non-Open Access articles published, all supplemental material carries a non-exclusive license, and permission requests for re-use of supplemental material or any part of supplemental material shall be sent directly to the copyright owner as specified in the copyright notice associated with the article.