



Abstract
It is well established that previous crime events are valuable indicators for the prediction of future crime. Near-repeat burglaries are incidents that occur in close proximity in space and time to an initial burglary. The current study analyses near-repeat victimization patterns in Malmö, Sweden’s third-largest city. The data, provided by the local police, cover a six-year time frame from 2009 to 2014. The complete dataset, as well as each year’s individual dataset, was analysed using Ratcliffe’s Near Repeat Calculator version 1.3. Results reveal significant near-repeat victimization patterns. For the full dataset, an observed/expected ratio of 2.83 was identified for the first week after an initial incident and an area of 100 metres surrounding the original burglary. Separate analyses of each individual year reveal both similarities and differences between years. Some years manifest near-repeat patterns at longer spatial and temporal distances, indicating a need for further studies on the variability of near repeats. Preventive strategies that include both private and public actors need to be intensified and focused on the first two weeks after a burglary.
Keywords
Introduction
Burglary has been described as a crime that has a powerful impact on its victims (Mawby et al., 1999). Burglary rates have declined slightly (Stepanek, 2011), but in Sweden the rate has remained relatively stable, with approximately 1 percent of surveyed households reporting a residential break-in per year according to the Swedish Crime Survey (BRÅ, 2016). The rate of break-ins in Sweden is somewhat higher in single-family housing than in multi-family housing, and is more common in the larger cities (BRÅ, 2016).
According to Morgan (2001), data reveal that a small number of houses, about 4 percent, accounted for 44 percent of all property crimes. Researchers have come to the conclusion that a between-places relationship must exist (Farrell and Pease, 1993; Polvi et al., 1991). Thus Braga et al. (2012) argue that burglary is not evenly spread across places; instead it is clustered in space and time. It is now well established that past victimization is a strong predictor of future criminal offences (Johnson and Bowers, 2005; Mawby, 2013). Research has highlighted an increased risk for the re-victimization of previously victimized properties, which peaks within 48 hours of the first attempt, and then lasts for nearly one month (Braga et al., 2012). The related concept of near-repeat victimization patterns has received increasing attention since the early 2000s. Near-repeat events are crimes that occur in close proximity in both time and space to an initial crime event of the same type, but without targeting the exact same victim as the first event (Weisel, 2005).
The present study focuses on near-repeat patterns in the city of Malmö, Sweden. This study is among the first to cover the topic in a Scandinavian context and thus represents a contribution to the international body of research in this area. In addition, the present study may contribute to our knowledge of yearly variations in near-repeat patterns because six years of burglary data are examined both in a combined analysis and separately for each year.
Repeat and near-repeat victimization pattern
Although near-repeat patterns of crime have been documented in several countries, there are limitations regarding the phenomenon’s theoretical foundations, methods and study settings. Near-repeat studies are of a quantitative, explanatory nature and do not consider descriptive components in the study. An example is that less focus has been set on studying the phenomenon from the offender’s perspective in terms of selecting the targeted area (Wells et al., 2012). When it comes to burglary incidents, Morgan (2001) differentiates between exact repeats, where one house is burgled multiple times, and near repeats, where proximate houses get burgled close to an initial break-in. Studies have hitherto been able to verify the repeat victimization phenomenon for a large number of offences, such as street robbery (Farrell et al., 1995), theft from cars (Johnson et al., 2009), domestic violence (Farrell et al., 1995) and burglary (Bowers and Johnson, 2004; Johnson et al., 2007; Pease, 1998).
Similarly, patterns of near repeats have been noted for crimes such as street robberies (Haberman and Ratcliffe, 2012; Youstin et al., 2011), vehicle theft (Block and Fujita, 2013; Lockwood, 2012; Youstin et al., 2011) and shootings (Ratcliffe and Rengert, 2008; Wells and Wu, 2011; Wells et al., 2012; Wyant et al., 2012; Youstin et al., 2011), but the most common offence studied in relation to near-repeat patterns is burglary (Bernasco, 2008; Hernandez, 2013; Johnson, 2013; Lindström and Martinez-Olsson, 2016; Short et al., 2009; Townsley et al., 2003; Wu et al., 2015). Near-repeat patterns are defined as a heightened risk following an initial offence and thus relate to how victimization spreads within a more or less homogeneous area (Ye et al., 2015).
Knox and Bartlett (1964) portray space–time dependency using a ‘disease contagion’ model. Knox developed a method using the time and place where a disease broke out, and then compared each event with every other one to establish whether there were time–space patterns. If a similar process applies to near-repeat burglary patterns, events would take place closer in time and space than they would with a random distribution (Johnson et al., 2007: 207–8). Among the problems faced by this area of research is the limited number of empirical studies on near-repeat patterns and on the specific mechanisms that might explain why crime clusters occur, along with how their interplay creates opportunity that appeals to offenders to act in a certain area (Johnson et al., 2007; Ye et al., 2015).
Several studies have been conducted to analyse near-repeat victimization patterns and their underlying mechanisms. Most of these have been conducted in western, industrialized countries and show fairly substantial increases in the relative risk of burglary following an initial incident (Johnson, 2013; Townsley et al., 2003). Findings from Belo Horizonte, Brazil, however indicated much lower increases in risk, while still noting statistically significant near-repeat patterns (Chainey and da Silva, 2016). This points to a need for more research into inter-contextual variations in near-repeat patterns. To date, no journal paper has been published on the existence of near-repeat burglary patterns in Sweden (see, however, Lindström and Martinez-Olsson, 2016), and the current study will thus contribute to the international literature on near repeats by adding evidence from Sweden to the existing body of research. Although adding knowledge from a Swedish context may contribute to a better understanding of near-repeat patterns, the present study also aims to improve the state of the knowledge on near-repeat patterns by comparing the levels of near-repeat patterns in the same city but over time. Near-repeat patterns are examined separately for each of six consecutive years and, by considering year-on-year differences, further insights may be obtained into the stability and change of near-repeat events.
Theoretical background for near-repeat patterns
Having emerged in the field of environmental criminology, the study of crime events and place is influenced and supported by several inter-related but distinct theoretical schools. Two major theoretical explanations have been suggested in relation to near-repeat patterns of burglary. The boost hypothesis suggests that having successfully completed a burglary, offenders will return to commit a further offence (Bowers and Johnson, 2004; Tseloni and Pease, 2003). An offender who has learned about the vulnerabilities in a given area may thus be incentivized to return in the belief that this may be profitable, or to spread knowledge of the location to other potential offenders. This can more broadly be related to opportunity theories, which state that crimes depend to a large extent on how opportunities present themselves (Cornish and Clarke, 1987), and in this case can be considered in relation to the awareness space of the offender (Brantingham and Brantingham, 1995). Offenders, for instance, tend to burgle houses near to where the offender lives (Bernasco and Nieuwbeerta, 2005); similarly it has been shown that commercial robbery is more likely to take place in proximity to an offender’s former residence (Bernasco and Koistra, 2010). In essence, the argument regarding near repeats boils down to the offender learning (more) about the opportunities that are present in a given area following an initial burglary. Several studies have suggested that the boost account constitutes a plausible explanation for the near-repeat phenomenon (Bowers and Johnson, 2004; Johnson et al., 2009).
The other major hypothesis stipulated in relation to near repeats is the flag hypothesis. This view proceeds not so much from the offender’s awareness as from the place itself, which may have inherent weaknesses that serve as an invitation to offenders. Such weaknesses might include easy access or low surveillance, which have more broadly been discussed in relation to the availability of targets and a lack of guardianship as constituting key factors with regard to criminal events (Cohen and Felson, 1979). It is likely that both the boost and the flag phenomena contribute to the occurrence of near repeats: a simulation study noted that heterogeneity in target attractiveness, which would correspond to the flag hypothesis, presented a good fit for actual distributions of burglary, but that boost-based explanations were also needed as a complement (Johnson, 2008).
Both the flag and the boost explanations for near repeats can largely be understood in relation to opportunity theories, which are based on ideas of rational offenders making informed decisions (Cornish and Clarke, 1987). In the case of the boost account, an offender who has learned of opportunities or vulnerabilities makes a rational decision to return to the area to generate more profit, whereas, in the case of the flag account, offenders take advantage of existing vulnerabilities to commit crime. As has been noted above, existing opportunities or vulnerabilities can also be understood in relation to the routine activity theory, which states that crime should be explained in terms of the combination of an offender, a suitable target and a lack of guardianship (Cohen and Felson, 1979). An area with poor guardianship may, for example, be vulnerable more or less constantly; similarly, a high-value target that is suitable for burglary may also be considered to be so fairly constantly, which would fit with the flag account. On the other hand, however, an offender might not have been aware of these conditions prior to becoming familiar with the area, and the presence of a motivated offender may thus in part be hypothesized to be associated with the boost account.
Methods, setting and data
The aim of the present study is to quantify the presence of near-repeat patterns of burglary in the city of Malmö, Sweden, and to consider whether there are differences in year-on-year patterns of near repeats.
The setting
Malmö, located in the southernmost part of Sweden, is the third-biggest city in the country with 318,000 residents. The city has grown continuously for the last 20 years and is expected to reach a population of 338,400 in 2018. Malmö has a high level of mobility owing to its university and its location on the border with Denmark. As part of the Öresund region, Copenhagen, in Denmark, and Malmö, in Sweden, share a common labour market. Each day, around 50,000 people commute into Malmö, while around 30,000 commute to work in surrounding areas (Larsson, 2014). Malmö’s housing characteristics are mainly shaped by rental apartments (Larsson, 2014). The present study employs data from what was formerly the Malmö Police Area, which encompasses the municipalities of Malmö and Burlöv. Burlöv is a small municipality just north of Malmö with about 17,000 residents, bringing the total population of the studied municipalities to over 330,000. The city of Malmö has changed rapidly since the 1990s, not least as a result of the inauguration and rapid expansion of the city’s university, which was founded in 1998. The educational level of the city’s inhabitants has increased rapidly, and its workforce has become more reliant on the resulting changes in skills (Johansson, 2015).
Data
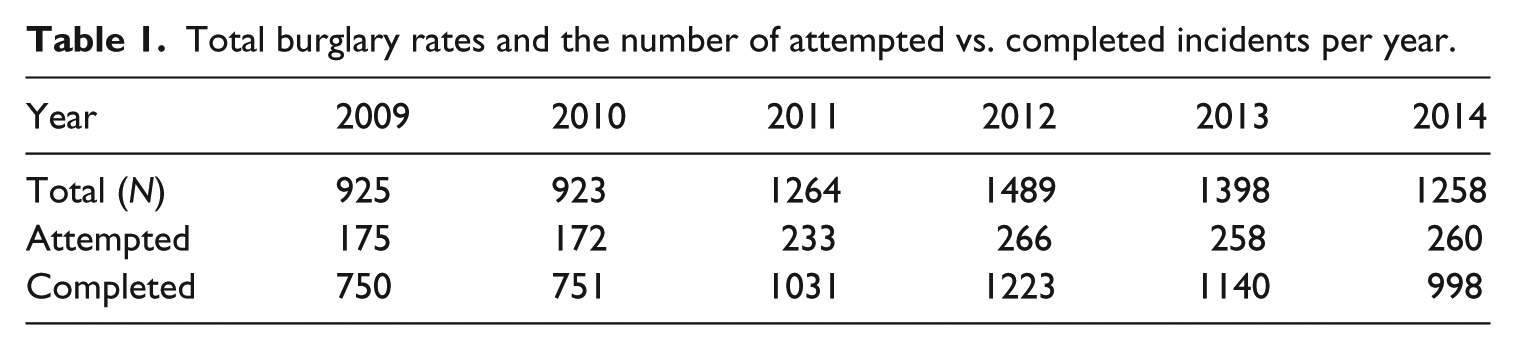
A complete list was provided of police-recorded home burglary data for the years 2009 to 2014. The list includes incidents relating to both single-family houses and multi-family housing. The data contain geographical information on 7257 burglary events in the form of x and y coordinates, as well as the start date of the incidents. 1 The geocoding was performed by the police and, although geocoding can be problematic for some crime types (see Gerell, 2016, for a discussion relating to assault data), the reliability of such coding is likely to be better for burglary because each home has a specific address. Of the total number of incidents, 1364 events were attempted burglaries and 5893 were completed offences; 8 cases were excluded owing to the absence of geographical data. In addition, two incidents had been geocoded as lying outside municipal boundaries and were thus also excluded. In this study, the chosen point of comparison was the start date of an incident, and data were also available for end date and reporting date. Because many incidents are not discovered immediately, the start and end dates can be imprecise and represent only an estimation of the time of a burglary. Using the start date will tend to result in more incidents on Fridays and at the beginning of holidays, whereas using the end date results in more incidents on Sunday–Monday and at the ending of holidays. Either would be preferable to the reporting date, which would introduce an additional bias to the data through differences in the time taken to report the crime to the police. An overview of burglary rates per year is presented under Table 1. The burglary count was lowest in 2009, when a total of 923 incidents were reported. The highest number of annual incidents was recorded in 2012, at 1489.
Total burglary rates and the number of attempted vs. completed incidents per year.
Burglaries are clustered in specific parts of the city, largely correlating with building and street network density (Figure 1). Figure 1 presents kernel density maps of burglary for each year, based on a 500 metre radius calculation performed in ARCGIS10. The figure includes separate frames for buildings, for streets and for two areas of the city that will be discussed later in the paper. There is some notable yearly variation, both in terms of the levels of density that are recorded (min = 89, max = 185), and in terms of specific places, which in several cases vary from mid–high to very high across different years.
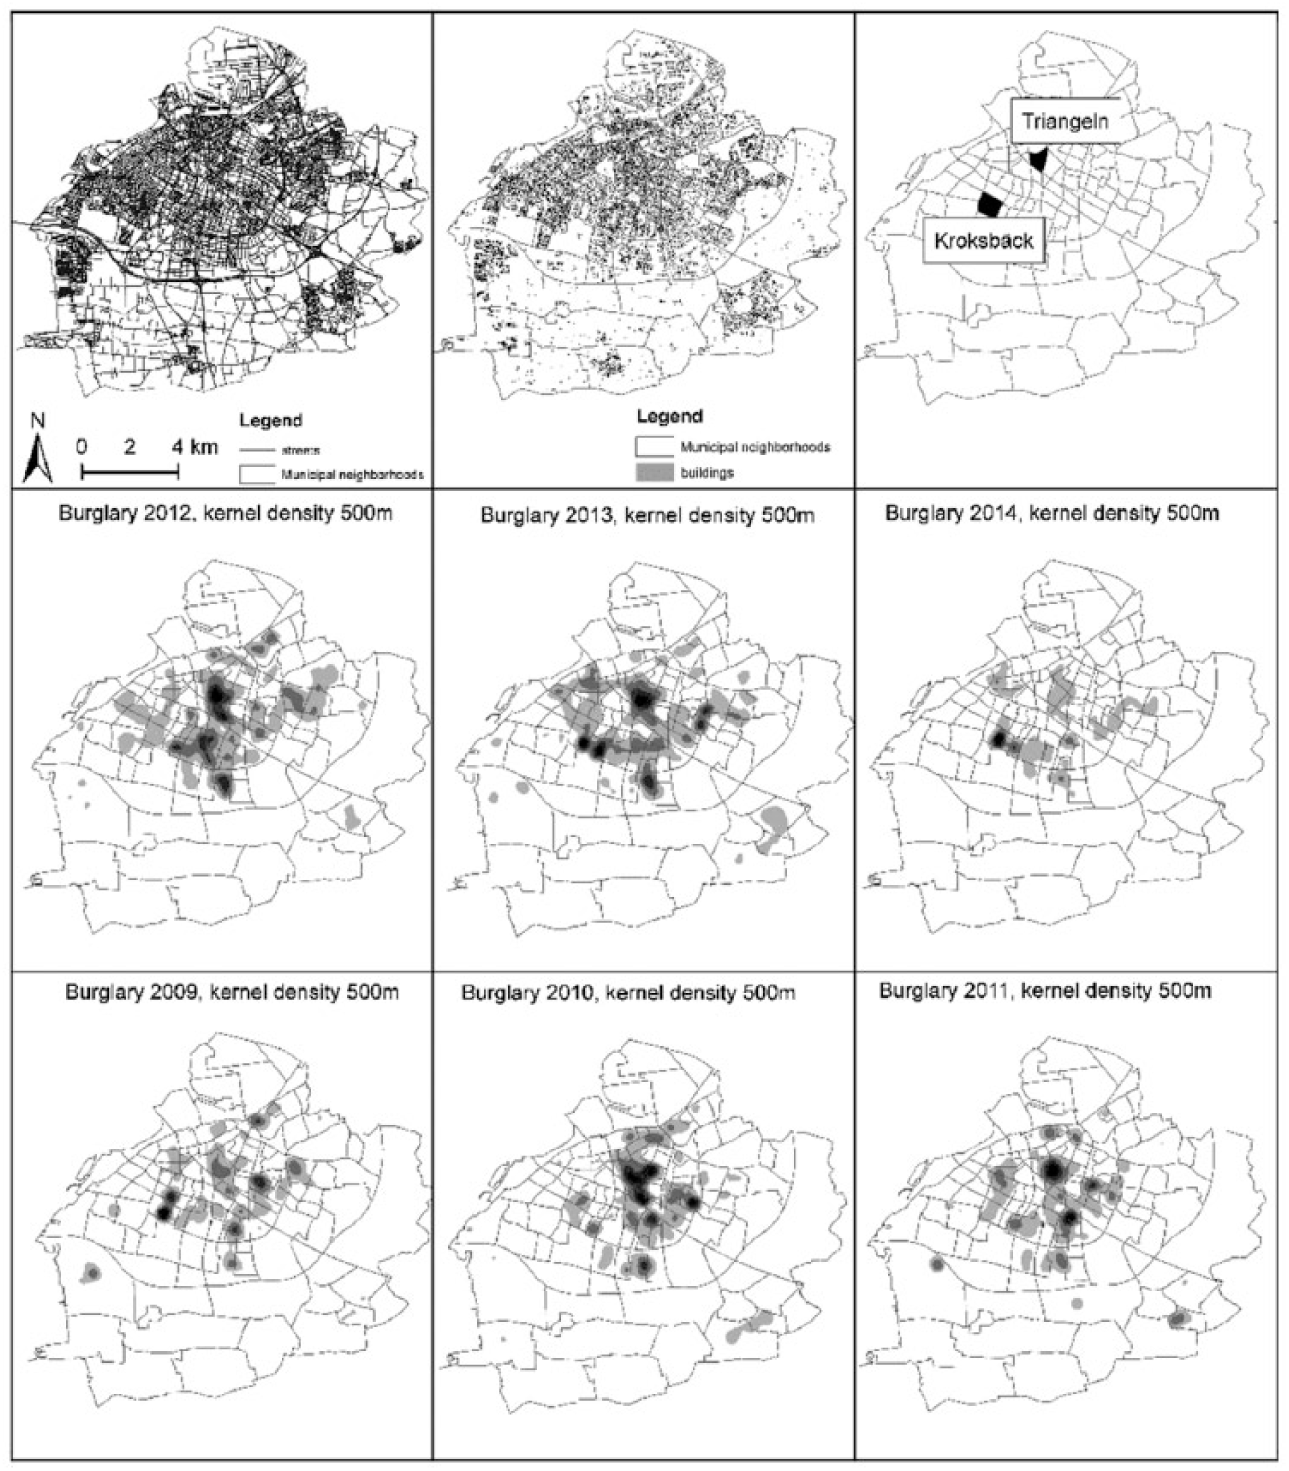
Malmö maps. Top row, Left: Street network (2011). Top row, middle: Buildings (2011). Top row, right: Two neighbourhoods with particular changes in burglary and near-repeat patterns. Middle and bottom row: Kernel density based on 500 metre radius for burglary in Malmö, 2009–14. Density visualized by within-year equal intervals.
Research design
The present study considers seven different near-repeat analyses, one for the full dataset on burglaries from 2009 to 2014, and one separate analysis for each of the years included in the analysis. Jerry Ratcliffe’s Near Repeat Calculator version 1.3 was used to establish near-repeat patterns (Ratcliffe, 2009). The program makes use of a Monte Carlo simulation approach to estimate the total number of near repeats. Significant relationships in the proximity of incident pairs are tested and the results are summarized in a matrix with space–time values. The matrix presents estimations of observed/expected (OE) ratios for an incident to occur repeatedly in a certain time–space interval (Ratcliffe, 2009). This process was conducted for all 7257 burglaries in the years 2009 to 2014 in the main analysis. In addition, the same procedure was performed for each year separately to obtain detailed information about the development of near repeats from year to year.
The current study uses a spatial bandwidth of 100 metres, with 10 bands and a temporal bandwidth of 7 days with 10 bands. The spatial distance was measured using Manhattan distances. Manhattan distances are more similar to actual distances than Euclidian distances, and represent the calculator’s default setting (Ratcliffe, 2009). Events are considered to be of substantial significance if they are significant at a level of at least p = 0.05 with an OE ratio of 1.20 or higher (Ratcliffe, 2009).
In the attempt to detect possible connections between burglary events, the aim is to determine whether a larger number of incident pairs occur in proximate space and time than would be assumed on the basis of an allocation by chance (Johnson et al., 2007).
The test is the null hypothesis that time and distance of burglary events are unrelated. It is, however, claimed that, if time and space of onset are dependent, a significant near-repeat pattern shows up and represents a higher probability for another burglary to be committed in a proximate spatiotemporal area.
Accordingly, one burglary event in a particular dataset is paired up with every other incident (Johnson et al., 2007). On the basis of several iterations, event pairs are built and expected values generated through the reallocation of event dates to spatial points (Ratcliffe, 2009). This Monte Carlo procedure is repeated several times for each cell in the matrix to create pseudo p-values and (OE) ratios (Ratcliffe and Rengert, 2008). The more repetitions that are conducted, the higher the predictive power of an event occurring. The resulting expected frequency matrix generates a null hypothesis scenario, which indicates potentially significant differences between the expected and the observed values (Ratcliffe, 2009). OE ratios display the discrepancy between the expected value and the actual data (Ratcliffe, 2009).
An additional analysis was also conducted using 200 metre time bands and 14 days with 10 spatial bands and 10 temporal bands to examine distance and time decay. In addition, each year was analysed separately to see whether changes in near-repeat patterns follow changes in the overall burglary crime rate.
Ethical considerations and data availability
In the context of a burglary, the privacy of residents is seriously violated and this requires that the data be treated with confidentiality. Since break-ins often cause trauma for the victims, it is essential to ensure anonymity (Oliver, 2010). Furthermore, ensuring that the identity of victims remains confidential produces advantages for both the researcher and the victims involved. First of all, the psychological impact on the victims can be reduced by not presenting too much information about the residents. Secondly, the researcher is able to work more objectively throughout the research process and is able to examine a sensitive topic through the numerical representation of the participants/incidents (Oliver, 2010). The present research project was approved by the Ethics Council of the Faculty of Health and Society at Malmö University.
Results
The results show the presence of repeat and near-repeat victimization patterns in Malmö municipality. Both in the data for each year and in the full dataset, the most overrepresented space–time range is 1–100 metres and 0–7 days. Interestingly, however, there are substantial year-on-year differences in the size of the observed OE ratios, and in several cases also with regard to which spatiotemporal distance bands were associated with significant levels of overrepresentation.
As regards same-location repeat incidents, very high overrepresentations were identified, although it should be noted that, in the case of multi-family housing, several apartments share the same coordinates. Thus, a same-location repeat might involve two different apartments having been burgled rather than a true repeat burglary of the same home, and both types of incident are included in the values for same-location repeats. Although these shortcomings should be noted, the high OE ratios noted for same location nevertheless shows that the risk of an additional burglary at an address is very high after an initial incident, and that such a risk is present for a full eight weeks.
In general, near repeats are identified within 1–100 metres and up to 42 days, 101–200 metres and up to 28 days, and 201–400 metres and up to 21 days, with a significance level of .001 (see Table 2). The overrepresentation of near repeats at larger spatial bands declines to 7 days. In the first band –1–100 metres and 0–7 days – the immediate space–time difference from an initial event is the highest, with a 183 percent higher risk than would be expected if there was no association between spatial and temporal distributions. As the space–time distance from the initial event increases, the OE ratio decays in a fairly consistent way. Using space and time bands that are twice as large yields substantially similar findings, and thus the results do not appear to be sensitive to the specifications employed here (see Appendix Table A2).
Observed/expected ratios for near-repeat patterns 2009–14 in the city of Malmö.
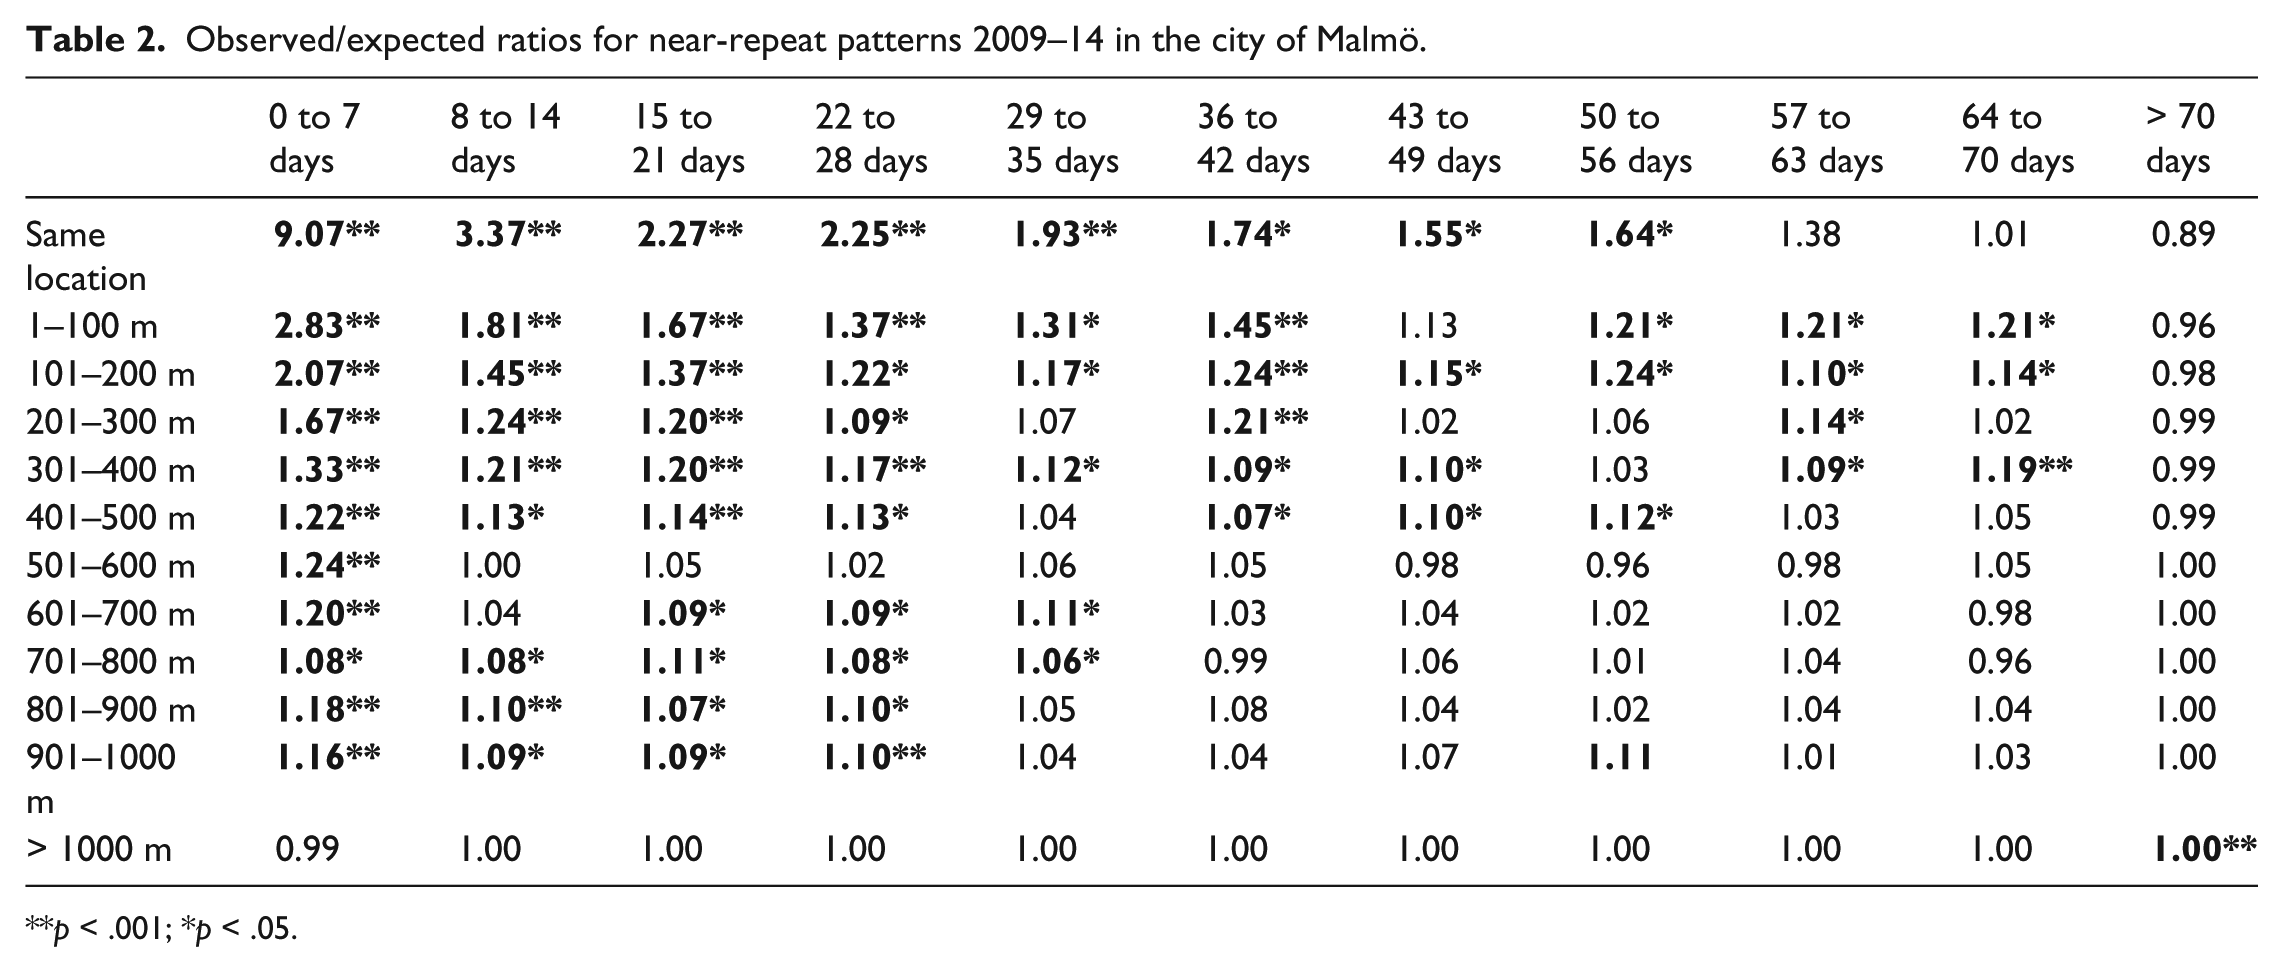
p < .001; *p < .05.
Table 3 presents a summary of the year-on-year differences in observed OE near-repeat ratios (see Appendix Tables A2–A7 for yearly near-repeat patterns). As can be noted, the yearly fluctuations are fairly large, and this is an important finding that underscores the conclusion that while the basic finding that near-repeat patterns exist is valid, there is also large variability in the specifics of these patterns. Consider for instance the case of the 301–400 metre distance band and the 0–7 days temporal band, for which Table 3 shows OE values between 1.0 and 1.7. In relation to levels of significance, this means that near-repeat patterns are noted at the 99 percent level in 2009 and 2014, and at the 95 percent level in 2012, but that there are no significant associations in the years 2010, 2011 or 2013 (see Appendix for specifics).
Variation in observed/expected values for the years 2009–14 analysed separately.

Discussion
The present study has consistently identified near-repeat patterns of burglary in all seven datasets tested, and the concept of near repeats thus appears to be of importance for our understanding of burglary in Malmö, Sweden. The strongest near-repeat patterns were noted for short time and space distances, and this finding was stable across all datasets. In particular, repeat incidents at the same location are registered for very high OE values, suggesting that repeat burglary at the same address is of great importance. There are, however, important variations to take into consideration when less stable associations are considered. Substantial differences in relative risk were noted between different years, and in many cases this also resulted in non-significant associations for some years while other years show highly significant results for the same spatiotemporal bands. The full dataset with all six years of burglaries has a great deal more statistical power compared with the one-year datasets and thus paints the most reliable picture, but it is still important to note that this picture may obscure year-on-year differences that could yield a more nuanced understanding of the near-repeat phenomenon. Although some of these differences between years are to be expected as normal fluctuations and/or the result of error, we argue that the most pronounced differences are likely to be related to substantial changes in the spatiotemporal patterns of burglary.
Some cases in point can illustrate why such differences may occur. One distinctive burglary cluster was noted in the Triangeln area in 2010 (see Figure 1, top right). In this year, the construction work on the Triangeln Station was completed, which may have led to higher levels of mobility in the area and possibly to new potential offenders incorporating it into their awareness space. Davies and Bishop (2013) emphasize that a burglary cannot be seen as an isolated incident, but rather is a crime that has to be analysed in the context of the environmental circumstances of a neighbourhood. It is possible that an increased flow of people through the area, and the associated changes in routine activities, may have had an impact on the occurrence of burglary. Researchers explain differences in burglaries and near-repeat levels as being due to seasonal factors and urban background influences, such as available transportation, housing density or social factors (Davies and Bishop, 2013; Johnson et al., 2007). But, although the case for changes in burglary rates in Triangeln area related to the new train station is fairly straightforward, it is less clear how and if this would impact on near-repeat patterns. Possibly a change in the awareness space of offenders took place with the new train station that adapted to new opportunities faster than non-offenders could respond to them, but there is no research to substantiate such a process. It can, however, be noted that the area currently has fences/walls around the residential blocks, which were not there at the time the train station was inaugurated.
Another case in point can be noted for the years 2013 and 2014, when near-repeat patterns with higher effect sizes were noted in the first couple of time bands. Some near-repeat burglaries in these two years may be linked to reconstruction efforts in the neighbourhood of Kroksbäck (highlighted in Figure 1, top right). During the winter of 2013–14 more than 50 burglaries were noted in this neighbourhood alone, although not all were reported to police. This is likely to have been related to the presence of scaffolding, which provided potential burglars with easy access to apartments for a limited time period, thus explaining the surge in burglaries that occurred (Gerell and Hallin, n.d.). If such a relationship between reconstruction and an increase in near-repeat burglary indeed exists, it may be considered as providing support for the flag account of near-repeat patterns (for example, Johnson, 2008). The neighbourhood temporarily exhibited an increased vulnerability to burglary as a result of the improved access to apartments provided by the scaffolding, and the neighbourhood was thus flagged as vulnerable, resulting in an increase in the number of near repeats. Possibly this could also be related to some sort of process where information spreads to offenders regarding such a vulnerability. Potential offenders living in the neighbourhood would be aware of such a vulnerability, and could possibly spread their knowledge further to other potential offenders. Such findings would, however, need to be substantiated with additional research before any firm conclusions can be drawn.
In comparison with other studies (Chainey and da Silva, 2016; Johnson et al., 2007;Townsley et al., 2003; Wells et al., 2012), near-repeat burglary patterns in Malmö are generally quite durable, which adds to the complexity and cross-contextual variation that has previously been identified in the research (Johnson et al., 2007). In their comparison of 10 cities across 5 nations, Johnson et al. (2007) noted that there was some consistency between contexts, but also substantial differences. In the case of Philadelphia, USA, significant near-repeat patterns were identified within 200 metres and 8 weeks, and in the case of Canberra, Australia, patterns were noted within 1200 metres and 4 weeks. The present study yields similar results regarding differences for a within-city comparison over time.
Chainey and da Silva (2016) investigated 19,453 domestic burglary incidents in a four-year time period in Belo Horizonte, Brazil. For four out of five distance bands, they found significant overrepresentations up to three weeks after an initial incident, and for one out of five distance bands there was a significant overrepresentation in the fourth week after initial incident. In the case of Malmö, significant overrepresentations were found across all 10 time bands, which is an interesting difference to note.
Chainey and da Silva (2016) themselves argue that the results are caused by a different housing infrastructure in Belo Horizonte. Compared with western cultures, residents live in high-rise apartment buildings or in ‘irregular self constructed houses’ (Chainey and da Silva, 2016: 1). Furthermore, the lower level of repeats and near repeats can be explained by reference to lower levels of opportunity. Buildings, with the exception of favelas, have inbuilt situational crime prevention factors, such as guards or high perimeter fencing. In favelas, however, social capital, for example in the form of networks, together with proximate living, leads to a stronger community and to collective efficacy (Sampson et al., 1997), which is a restraining factor for burglars (Chainey and da Silva, 2016). The analysis thus emphasizes the power of environmental influences on burglaries.
Although it is viable to explain the presence of, and variations in, near-repeat patterns on the basis of environmental theories of criminology, no firm conclusions can be drawn based on the current study. However, the findings presented here show that future investigations should focus on year-on-year differences to untangle whether, and how, near-repeat patterns may be related to routine activities shaped by the developing structure of a city.
As argued by Haberman and Ratcliffe (2012), analysis of near repeats may be of importance for the development of a predictive technique to forecast future burglaries. Since future burglary risk is highly dependent on past victimization, it is essential to develop preventive methods that focus on previous victims and near repeats (Bowers and Johnson, 2005; Hirschfield et al., 2010; Pease, 1998). One step in this direction has already been taken. In some countries, for example the USA and the UK, police patrol cars work with ‘predictive policing’ methods and ETAS crime forecasting models, which have been claimed to decrease the crime volume by 7.4 percent (Mohler et al., 2015).
Owing to stronger and more stable effect sizes within the first week and 200 metres, as well as within two weeks and 100 metres after an initial burglary, specific strategies focused on this time frame are recommended (Bowers and Johnson, 2005). It may be particularly advisable for the police to act immediately, for instance by using different forms of patrolling or monitoring in combination with attempts at involving both the area’s residents and other key actors. First of all, information regarding security precautions such as closing windows and locking doors when leaving the house can be emphasized when the risk of burglary is likely to be elevated. Residents in neighbourhoods where a lot of burglaries occur can also be notified to keep an eye open and implement neighbourhood watch and asked to emphasize mutual caretaking (Mawby et al., 1999). The police, as a central actor, need to support residents and resident groups such as neighbourhood watch associations by means of information, advice and other forms of support. Warning signs, as well as flyers on how to protect homes, can be distributed. In some countries, for example Germany, the police offer free counselling and discount agreements with insurance companies or banks (loans) in order to support target hardening efforts. Further, since significant near-repeat patterns have been detected at greater distances, it is important to implement follow-up police investigations, in addition to patrolling, in order to make residents feel safer. Communication processes between police departments need to be further improved in order to apprehend suspects more quickly (Dreißigacker et al., 2015). The significant differences between years also highlight a need for the police to gain good knowledge of local communities in order to be able to identify increased risks of burglary and to develop prevention efforts accordingly. If increased vulnerabilities to crime are temporary, such as with the case of scaffolding in the Kroksbäck neighbourhood, it becomes important to act on them quickly in order to be able to prevent crimes related to such vulnerabilities.
Conclusion
The present study contributes to academic knowledge on near repeats primarily in two ways. Firstly, it provides peer reviewed evidence from a new geographical context, Sweden. Secondly, it provides new insights into annual variations in near-repeat patterns that may help inform future research and prevention efforts.
The aim of the study was to examine near-repeat burglary victimization patterns in Malmö. As expected, in all datasets the risk of a near-repeat victimization peaked within the first week and 1–100 metres of a previous break-in. The data revealed that the immediate space–time difference within the first week was 183 percent greater than would be the case in the absence of a pattern of near-repeat victimization.
The analysis of differences between years revealed that, although some core patterns are stable across all years, there are also substantial year-on-year fluctuations. This points to a need for further studies into stability and change in near-repeat patterns, and for more empirical work focused on explaining why such changes may occur. This may also be an important consideration for crime prevention practitioners. Crime prevention should focus on the shortest distances from an initial incident in both time and space because the patterns here are more stable, but additional efforts could also be implemented at greater time–space distances if these are informed by some form of analysis showing that near-repeat patterns may be extended as a result of shifts in routine activities or other changes in the relevant environment.
Footnotes

References
Supplementary Material
Please find the following supplemental material available below.
For Open Access articles published under a Creative Commons License, all supplemental material carries the same license as the article it is associated with.
For non-Open Access articles published, all supplemental material carries a non-exclusive license, and permission requests for re-use of supplemental material or any part of supplemental material shall be sent directly to the copyright owner as specified in the copyright notice associated with the article.
