



Abstract
In recent years, various academic studies have proposed crime forecasting models based on the concept of repeat victimization. Some of them have been modelled from the area of differential equations and others from the perspective of spatio-temporal statistics, within the framework of point processes. These models have tended towards a certain sophistication in their formulation, which at times impedes understanding of the predictive mechanism and how it adapts to different realities. Predictive models that function well in one environment or society do not appear to do so in others. In this article, the possibility of crime forecasting for burglaries with forced entry in Catalonia is studied from the perspective of near repeat victimization on a larger territorial scale than is usual. To this effect, the explicative and predictive possibilities of this criminological theory are explored and a predictive system that does not require mathematical or statistical models is proposed. We found that a large part of the series of burglaries with forced entry in residences in Catalonia between 2014 and 2015 follow patterns of near repeat victimization. In addition, the average intensity of burglaries in space–time was high, as was the standard deviation. This system is adaptable to different environments and gives police forces the opportunity to improve preventative strategies and to optimize resources using standard tools. Last, the limitations of this approach are debated and new lines of investigation proposed that could increase its predictive capacity without abandoning the concept of repeat victimization.
Introduction
Can forced entry burglaries be predicted? And if so, is this forecast useful for changing police preventative strategies? These are questions that are nowhere near being definitively answered. In recent years, numerous academic studies (Farrell and Pease, 1993; Farrell et al., 1995; Pease, 1998; Pease and Farrell, 2014; Townsley et al., 2000; Townsley, 2003) have proposed crime forecasting models based on the theory of near repeat victimization, a variant of repeat victimization. The latter posits that, after victimizing a target, criminals tend to target it again after a short period of time, whereas in the case of near repeat victimization the target can also be one with similar characteristics to the first.
This criminological theory was formulated and popularized when it started being applied to different types of crimes almost three decades ago. In the case of burglaries, the theory has helped the understanding of their distribution and concentration in space and time. Other classic criminological theories such as crime opportunity (Gottfredson and Hirschi, 1990), routine activity (Cohen and Felson, 1979), rational choice (Clarke and Cornish, 1985) – all of which are mentioned in Opportunity Makes the Thief: Practical Theory for Crime Prevention (Felson and Clarke, 1998) – and foraging behaviour (Bernasco, 2009) help to substantiate and reinforce it. Two explicative hypotheses are also formulated: the heterogeneity or flag explanation (Tseloni and Pease, 2003) and the boost explanation (Bowers and Johnson, 2004; Ornstein and Hammond, 2017), also known as sudden increase in risk or dynamic risk. The former explains what is known as ‘static’ risk because it does not change over time or it does so over a long period of time, establishing that there are some houses that are more attractive to burglars than others, be it because they have fewer security measures, they are easy to access or they promise more valuable booty, and so on. The second hypothesis posits that, after a burglar has successfully stolen from a residence, they are likely to burgle either the same residence again or a residence close to it, looking to repeat their success by replicating the first burglary.
The repeat and near repeat theory of victimization has been empirically proven in many countries for residential burglaries (Johnson et al., 2007; Kikuchi et al., 2010; Kumar and Chandrasekar, 2011; Wang and Liu, 2017). To this effect, the coordinates of the place where the burglary took place and the time it occurred (normally during daytime) are needed. Without it always being stated explicitly, it is usually assumed that the environment studied is relatively homogeneous. With this information, the Knox test for different spatio-temporal segments is normally applied. This test compares the distribution of the spatio-temporal points (x, y, t) of the burglaries with the distribution of points obtained in the random case, normally using the Poisson distribution as a reference (Ratcliffe, 2008).
In addition to this statistical test, the phenomenon can also be visualized with crime mapping. A series of weekly and fortnightly hotspot maps indicate that there is a spatio-temporal dynamic appearing and disappearing in different places at different time intervals.
This clustering dynamic for burglaries with forced entry has been compared with contagion and epidemic processes, and also with earthquake aftershocks. These already mathematically modelled phenomena inspired the equations of the near repeat victimization prediction models. There are models in the area of differential equations that simulate these hotspot generating processes (Short et al., 2008) and there are also models based on the spatio-temporal perspective within the framework of point processes (Mohler et al., 2011). In general, both approaches have tended towards a certain sophistication in their formulation, which sometimes hampers understanding of their predictive mechanics and their practical adaptation or application to different territorial and social realities.
Not only have these patterns been modelled mathematically but computer software has also been designed to generate forecasts automatically. The most well known is the American PredPol (2020); in Europe the leading software is the German PRECOBS (IfmPt, 2020).
These and other programs have been applied to different countries, normally on a local rather than a national scale, and especially in large cities. Although the results obtained seem to have been mainly positive, they have also sparked some discussion about the degree to which they contribute to lowering the crime rate. They are generally seen as predictive models that work well in some environments or societies, but do not seem to work, or at least not to work very well, in others. If the models are based on repeat victimization, clearly part of their success will depend on the intensity of this victimization. To this effect, a study carried out in Brazil (Chainey and Figueiredo, 2016) has demonstrated the major difficulties involved in observing this phenomenon in cities with a lifestyle and residences dissimilar to those in the Anglo-Saxon world. In Mediterranean and Latin American countries, urban zoning and residences and the way of living in them are all different and can affect the phenomenon of near repeat victimization. In the case of the Brazilian city studied (Bello Horizonte), slums (favelas) are interspersed with neighbourhoods comprising residential skyscrapers, so it is logical to think that in such diverse environments near repeat victimization manifests itself in dissimilar ways.
Catalonia is another case in point owing to its great territorial heterogeneity, both as a whole and in its inhabited area. Catalan villages and cities are usually visualized as a mosaic made up of old towns, modern areas and flats, areas with villas and bungalows, neighbourhoods of mostly terraced houses, areas with tourist apartments, and rural zones with scattered residences. Clearly, this heterogeneity affects crime opportunity and is a determinant in shaping crime hotspots (Vozmediano and San Juan, 2010) and, of course, near repeat victimization hotspots.
In 2013, given the surge in forced entry burglaries, the Catalan police force Mossos d’Esquadra, together with the University of Girona, began to study the possibility of adopting some of the existing models and software for predicting burglaries and improving their preventative policing strategies. The study brought to light the difficulty in applying them in such a heterogeneous environment and the need to explore other alternatives. Both the dynamics of the waves of burglaries that appeared to be happening in different parts of the territory and the more isolated incidents of residential burglaries disconcerted police. Their main concern was, and still is, to find a system that would enable them to determine which of the areas affected by burglaries is the most suitable for intensifying preventative actions.
The aim of the present study is just that: to determine the most sensitive areas where waves of burglaries are most likely to occur and to study their temporal dynamic. The aim is to test near repeat victimization on a larger scale than is habitual, meeting the need to understand the general dynamic of residential burglary hotspots across the country. The hypothesis is that, if near repeat victimization is observed on a small scale, normally at a distance of just a few hundred metres, then it will also be observed on a large scale (more than 1 km). However, in these more extensive areas more than one focus of near repeat victimization may coincide temporally, which could mask the analysis of the phenomenon. The study will demonstrate that criteria can be established for determining when the theory of near repeat victimization can and cannot be used to make forecasts in a specific area.
Although enlarging the scale decreases the accuracy of a possible forecast, it also increases the chances of observing repetitions. Furthermore, too big a scale could make effective preventative actions impracticable, so the aim is to find the smallest spatio-temporal segmentation where waves of burglaries can be observed and, at the same time, can potentially facilitate optimal preventative policing actions.
The article is structured as follows: presentation of data, method to test near repeat victimization on a large scale, validation with data, limitations, discussion on the viability of possible predictive models and conclusions.
Data
The territory: Catalonia
Catalonia is a country in Mediterranean Europe on the east coast of the Iberian peninsula, occupying 5.5 percent of this land area. It is bordered by the Pyrenees and France to the north, the Mediterranean sea to the east and Spain to the west and south.
The territory is divided into a total of nine police regions. Each region includes a set of Basic Police Areas, the territory’s primary units usually encompassing several municipalities and defined by geographical and policing criteria, from where most of the police patrols are dispatched. These regions are geographically diverse; the territory of the Barcelona Metropolitan Basic Police Area is almost entirely urban, whereas the Eastern Pyrenees Basic Police Area is mountainous with few, generally small villages. The largest urban centres are the metropolitan area of Barcelona and the coastal zones, which are also where most residential burglaries with forced entry occur. Although Barcelona is the Catalan city with the most burglaries, this study focuses on the other eight regions, which are where most waves of burglaries tend to be observed with no or very few reported burglaries for several weeks followed by sudden spates of these crimes over short, consecutive periods of weeks, which end to return to further long periods without any burglaries.
Crime data
The data used in this study are the reports of burglaries with forced entry made to the police in Catalonia in 2014 and 2015. The location in Universal Transverse Mercator coordinates and a window of time (generally less than a day) when the burglary is assumed to have occurred are recorded for each burglary. The type of residence burgled – a flat, a house or a farmhouse – and whether it is a first or second residence are also specified. According to these data there were 24,928 burglaries with forced entry in Catalonia in 2014 and 27,488 in 2015, representing an increase of 10.3 percent. These data have been provided by the Government of Catalonia police force – Mossos d’Esquadra.
Methods
The analytical framework followed to study the burglaries was (1) doing a descriptive analysis, (2) segmenting the territory of Catalonia into square cells and the time into fixed time intervals, (3) projecting the spatio-temporal points (x, y, t) of the burglaries onto the square based prisms obtained, (4) studying the temporal series associated with each prism obtained from counting the number of burglaries occurring in the total time period considered, (5) studying the non-randomness of the series of data, and, last, (6) proposing and debating possible predictive algorithms.
The size of the cells for this study was 5 km by 5 km and the time intervals coincided with the natural weeks. The average weekly burglaries were calculated for each of these cells (Figure 1) and the values obtained were recorded on a histogram. This average served to classify the intensity of the burglaries.
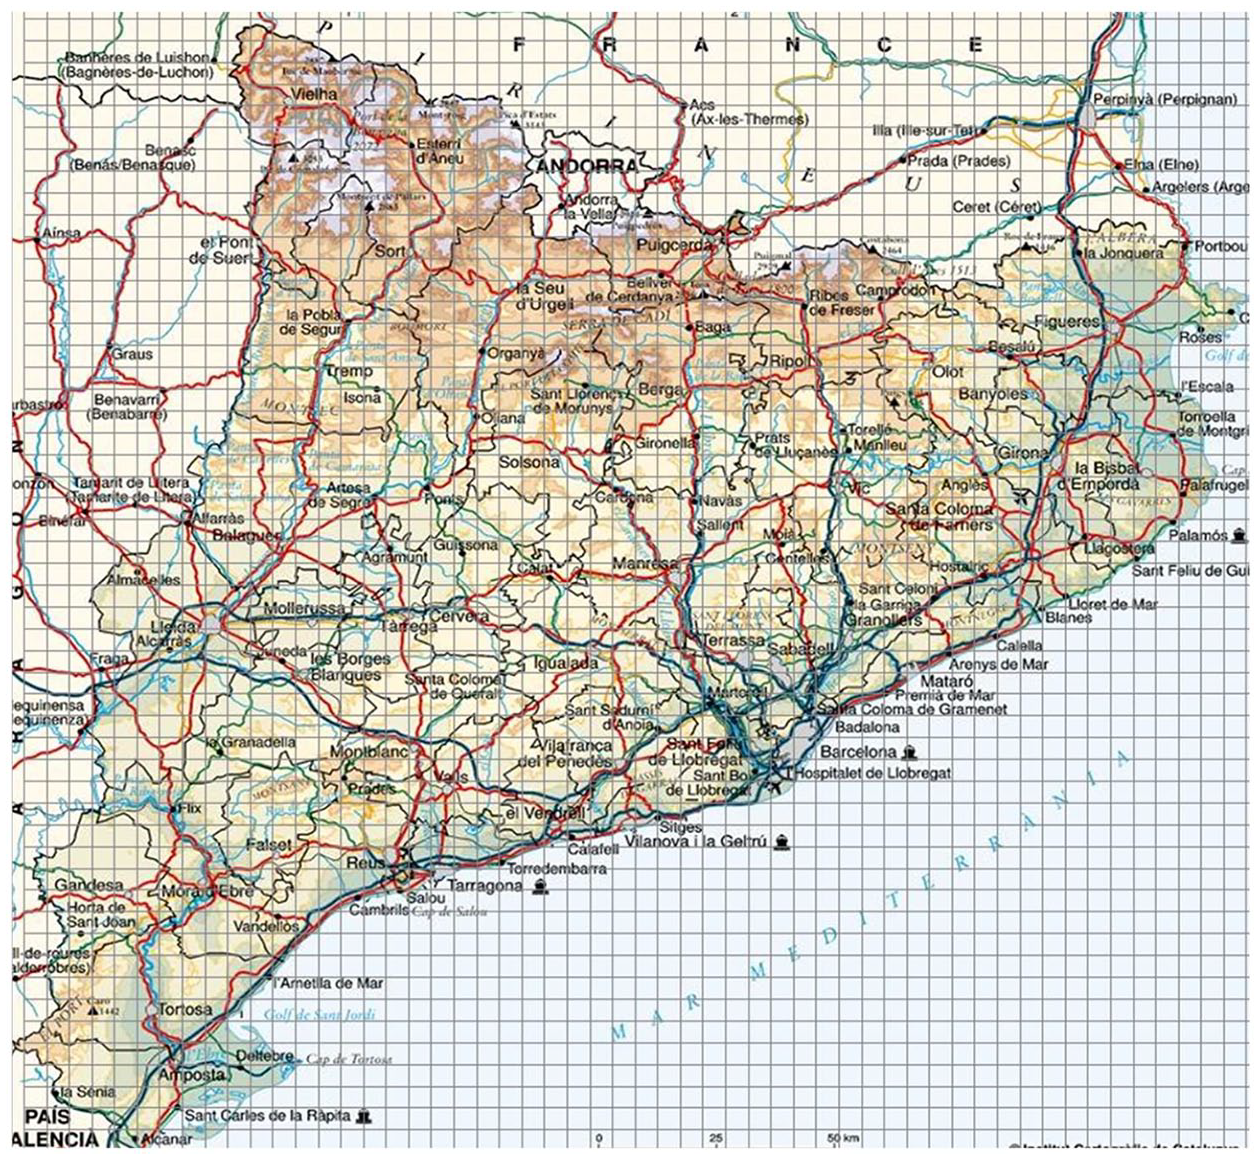
Map of Catalonia with a grid of square cells of 5 km × 5 km superimposed onto it.
Once these spatio-temporal segments were established, the randomness of the robberies was studied using the runs test and the concept of activation levels to verify that waves of burglaries can be observed and predicted. The goodness-of-fit contrast was also used on the Poisson distribution.
The two tests provide different, complementary information. According to the theory of near repeat victimization, there is a spatio-temporal dependency in the sense that a residential burglary occurring at the moment t1 conditions the probability of there being a burglary in the same or a nearby residence in the consecutive moment t2. Hence, the distribution of the burglaries should not be random. This is not contradictory to a large proportion of the cells remaining distributed the same as or similar to the Poisson distribution. The goodness-of-fit test does not consider whether the data are random or not and counts only the frequencies, independently of the order in which the values in the different time intervals have appeared.
In fact, even if it could be proved that the number of burglaries in a cell follows a Poisson law with independent and, therefore, random events between the different time intervals, waves of burglaries could still be observed. This can be tested with the simulations of the Poisson distribution, which generate more or less frequent waves. It could therefore be said that random and non-random factors converge in the waves. With the aim of identifying, measuring and comparing them, we propose constructing what has been called ‘non-random force matrices’ of the wave, which capture the probability of transition between the different usual levels of activation in consecutive time intervals. These matrices enable us to visualize the intensity or the non-random ‘force’ of each of the cells and their usual levels of activation in a compact, summarized way, while at the same time measuring the intensity of the run as a global fit of the Poisson distribution. These matrices complement the previous contrasts.
Lastly, to evaluate the optimal situations for forecasting and preventing burglaries with forced entry in a particular cell, the variation coefficient, defined as CV = σ/µ, was considered, which has been taken by other research on near repeat victimization as a benchmark to detect areas with repeat patterns (Saldaña et al., 2018). It could be said that CV is a measure of the usual height of the ‘peaks’ of the waves in relation to the height of the surface (average) with respect to the bottom. When these two heights are similar, the situation is optimal for predicting, provided that the waves are non-random for larger groupings. The graphical representation of the CV shows the three basic situations that can occur (Figure 2 and Table 1).

Graphical representation of the coefficient of variation.
Interpretation of the coefficient of variation.

Optimal configuration of the spatio-temporal segmentation
Once a space (e) and some time intervals (t) are established, the average µ and the standard deviation σ are determined, in addition to the CV, which will indicate that the spatio-temporal segmentation is optimal when the CV is closest to 1. Where the distribution of frequencies is compatible with a Poisson, the CV will be optimal if
Bearing these considerations in mind, the optimal criteria for the cell or space to make forecasts when CV ≈ 1 are established, and non-randomness is observed for larger groupings.
Analysis of the maps
Crime maps are a usual police analysis technique that provide very valuable information to interpret criminal phenomena (Chainey, 2012; Gonzales et al., 2005; Swain, 2010). The explanation of static risk is usually related to both the immediate environment (type of residence and neighbourhood) and the general environment (whether it is a tourist area, if it is in the centre or on the outskirts of a town, whether it is close to a main road, and so on). All this knowledge, which can be collected through layers of information, is not usually recorded in police reports in a structured, automatic way but it can be visualized on the map.
In this study, crime data have been represented on different scale maps to facilitate interpreting the phenomenon and the results obtained. The map of Catalonia, the grid of cells, the map of hotspots and other classifications of the cells have been represented at a scale of 1:100. The individual cells have been represented at a scale of 1:50,000, allowing identification of the type of zone of the targeted residence (urban zone or an area with scattered houses, zones with houses or blocks of flats, residential estate, city centre, tourist area, rural area, near main roads, and so on). These maps have been taken from the Cartographic Institute of Catalonia (ICGC, 2020) and the grid of cells was superimposed onto them.
Results
Function of the distribution of burglaries in fixed time intervals
The daily average of residential burglaries in Catalonia is 70.5 and the histogram shows a relatively symmetrical distribution around this figure, although more frequent values of between 55 and 75 and less frequent but more variable values of between 76 and 125 can be observed.
The same histogram was produced for different police regions showing that, as the daily average of burglaries in a territory falls, the frequencies diagram goes from having a shape that is similar to the Normal distribution to having a clearly asymmetrical shape, similar to the Poisson distribution. This property can be observed with any type of territorial division: the lower the number of burglaries in a territory, the closer the distribution is to a Poisson; and the more burglaries there are, the greater the tendency towards a Normal distribution.
Taking a segmentation of cells of 5 km × 5 km and time intervals of a week, Figure 3 shows different coloured cells depending on average weekly burglaries. In the two years under study there were burglaries in 807 cells, generally with a very low intensity: in nearly three out of four cells (71.6 percent) average weekly burglaries were fewer than 0.25, in other words less than an average of 1 burglary per month. Only three cells have an average higher than 30 burglaries a week, and they are located in the city of Barcelona. The 17 cells that present an average of between 5 and 30 weekly burglaries were located in Barcelona and some other large cities, some of which have a tourism profile. The rest, a little over 100, had averages of between 0.6 and 5.0 burglaries per week.
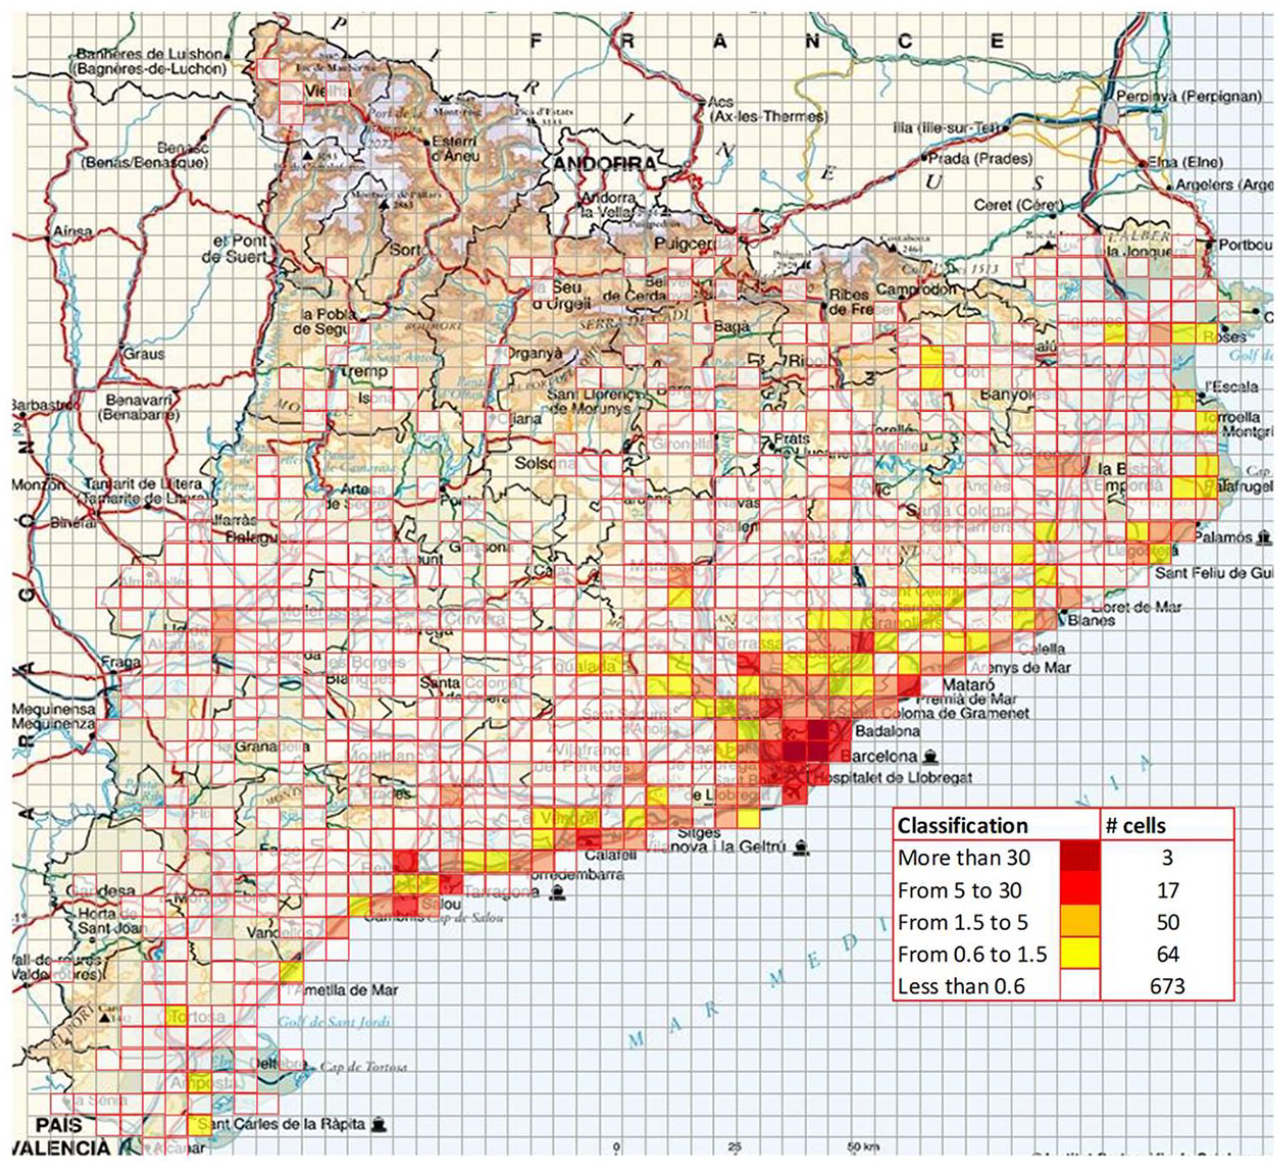
Hot cells of weekly residential burglaries with forced entry in Catalonia (2014–15).
Based on the goodness-of-fit test of the Poisson distribution, it was observed that the frequencies of 98.5 percent of the cells with an average lower than 0.6 were compatible with the Poisson distribution. Of the 64 cells with averages between 0.6 and 1.5, 44 (64.1 percent) passed the Poisson goodness-of-fit test, and some of the other 20 would have passed it if they had had a less heavy tail (in other words, by eliminating the two or three weeks when ‘too high’ a number of burglaries were registered). Lastly, the cells with an average higher than 1.5 had a distribution of frequencies that is more incompatible with the Poisson distribution, such that only 19.4 percent of the cells passed the test and, among these, there were none with an average higher than 6.0 burglaries per week.
Hence, it is confirmed that the fewer burglaries there are in a cell, the more the distribution of their frequencies tends towards the Poisson. Taking this property to the extreme, the conclusion could be reached that the probability of a specific residence being burgled at a specific time follows a Poisson distribution. Then, the added property of this distribution,
This result is true independently of the time intervals by which the burglaries are counted.
Study of the non-randomness of the burglaries in cells of 5 km × 5 km and intervals of 1 week
The runs test was applied for time intervals of 1 week and for different levels of activation. The series had 103 values corresponding to the number of whole weeks in the years 2014 and 2015.
With a significance level of less than .1, it can be seen how in some cells random runs from a certain level to a level of >8 burglaries can be observed, whereas others have significant levels of only less than .1 for some specific, normally consecutive levels. In a few cells, the significance level at which the non-random runs appear is slightly higher, between .1 and .2, and it is likely that point activations (runs with a single 1) are more frequent in these than in the rest.
The results obtained based on all the 5 km × 5 km cells and time intervals of a week indicate that the cells that are more likely to present non-random runs are those with averages between 1.5 and 8.0, for levels of >0, >1, >2, >3 and >4. With a significance level lower than .2, 82.0 percent are non-random; with a significance level of .15, 73.1 percent are non-random; and with a significance level of .1, 67.2 percent are non-random.
Non-randomness is observed in 67.2 percent of the cells with averages of between 0.6 and 1.5 for runs with levels between >0, >1 and >2, with a significance level of less than .2. With a significance level of less than .1, this is the case in 45.3 percent of the cells. Almost half (47.22 percent) the cells with an average of events between 0.3 and 0.6 have non-random runs for the levels >0 and >1, with a significance level of .2. With a significance level of .1, this is the case with 38.9 percent of the cells. Lastly, the cells that have an average of events below 0.3 usually have too few burglaries to be able to study the non-randomness. Nonetheless, 31.2 percent have non-random runs for levels >0 and >1, with a significance level of less than .2. With a significance level of less than .1, this is the case with 22.7 percent of the cells. In the cases where the average number of burglaries a week is less than 0.1, the runs test is too sensitive to small changes and is therefore not very reliable.
To these results must be added the fact that in 100 percent of the cases the value of the statistic of the runs test when there is non-randomness is negative; in other words, the non-randomness is the result of the greater grouping of the data with respect to what would be expected in the random case.
Thus it can be said that, in general, activation levels that generate non-random runs by grouping the burglaries can be observed. These activation levels are usually near to the average number of burglaries and are normally in the interval (µ − σ, µ + σ). These results seem to confirm the theory of near repeat victimization but, as we have already pointed out, the Poisson distributions also generate waves than can appear to be non-random.
To test this, random Poisson simulations were carried out, passing the runs test. Specifically, 100 series of 103 values with a theoretical average of 1 were simulated, and runs for the levels >0, >1 and >2 were sought.
The result of the 100 simulated series is that, with a significance level below .2, 27.0 percent of the series have non-random waves in some of the three cotes (>0, >1 or >2), whereas this figure is only 12.0 percent with a significance level of .1.
Comparing this percentage with the 67.2 percent and the 45.3 percent, respectively, obtained in the cells with averages of between 0.6 and 1.5 burglaries, it is clear that, for burglaries with forced entry, the possibility of observing waves with a non-random appearance in the phenomena governed by the Poisson law is greater.
This result is even clearer and more differentiated when it is compared with the sign of the statistic of the runs test. In the case of the Poisson simulations, in only 50 percent is this negative, compared with 100 percent in the case of the runs of burglaries (in both cases, considering only the cases that are non-random). However, despite this clear result in favour of non-randomness by grouping the runs of burglaries, a certain proportion of ‘false’ non-randomness generated by a random dynamic of the law of Poisson should always be kept in mind.
With the aim of isolating these two effects – the false ‘non-random’ and the ‘non-random’ caused by the phenomenon of near repeat victimization – it is proposed to work with the ‘non-random force’.
Optimal cells
There are 67 cells that fulfill the optimal cell criteria to forecast and prevent (Table 2). In the two years in question there were 11,715 burglaries with forced entry in these cells – 25.5 percent of the total burglaries in Catalonia – and in all of them the average number of weekly burglaries was higher than 0.6.
Number of burglaries according to the type of cell.

The weekly averages of these cells are between 0.62 and 3.38 (Table 3), and in all of them non-random activation runs are observed for different levels. The cells with an average between 0.6 and 1.5 have non-random activation levels between >0, >1 and/or >2, whereas those with an average higher than 1.5 have non-random activation levels between >0 and >4.
Averages of the optimal cells.

These 67 cells on the map of Catalonia are represented in Figure 4, together with the non-optimal cells with an average higher than 0.6. The number of burglaries depending on the type of cell is shown in Table 2.
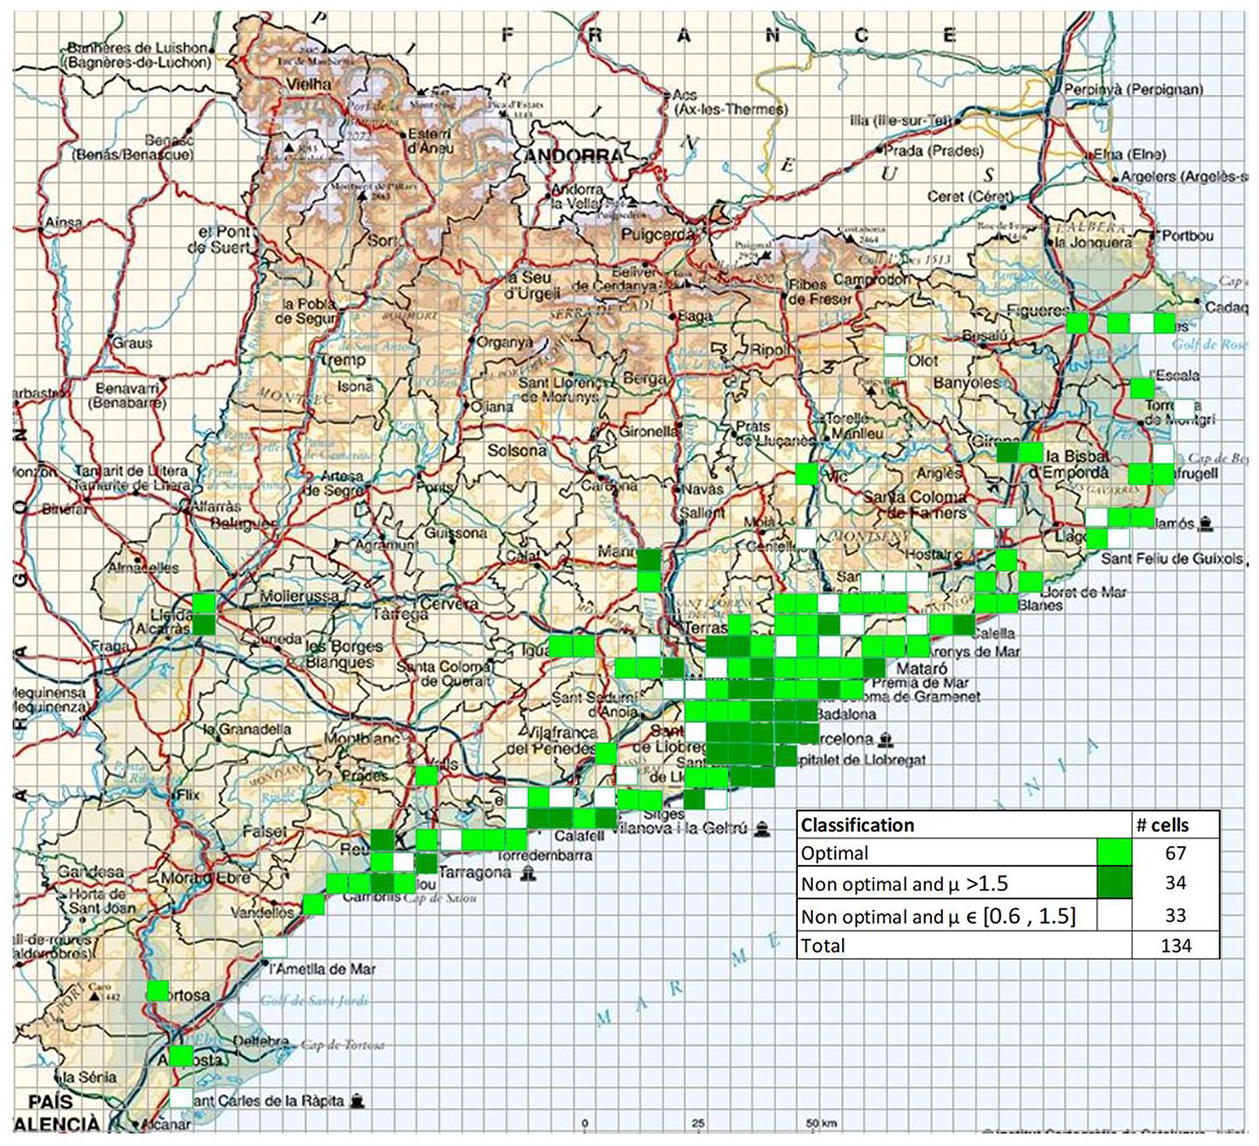
Representation of the optimal and the non-optimal cells.
Most of the 34 cells that do not have an optimal configuration and have an average higher than 1.5 (25) have a CV < 0.7, despite often showing non-random behaviour. In these 34 cells, 24,303 burglaries were localized, representing 52.8 percent of the burglaries occurring in 2014 and 2015. Most of the 33 non-optimal cells for forecasting, with averages between 0.6 and 1.5, are mostly so because they have a CV > 1.3, because the average is quite a lot lower than the standard deviation. The other 673 cells are non-optimal and have averages of less than 0.6. In these cells in the two years under consideration, there were 7225 burglaries, representing 15.7 percent of the total.
The cells with wave dynamics are usually the same as those that have more static risk (hot cells). Hence, those with more non-randomness are the ones with the highest weekly average, between 1.5 and 8.0.
Up to this point, the system proposed in regular cells has ignored the geographical features of the subjacent territory, which, as has been pointed out, is usually heterogeneous and can condition both forecast and prevention.
The configuration of time intervals in weeks and areas of 5 km by 5 km could initially be considered too large to be able to carry out effective preventative police activity. Nonetheless, prevention can focus on very specific spaces of each of these cells, hugely reducing the area of action.
The heterogeneity of the territory captured inside the optimal cells can be observed. Population clusters can be seen, as well as extensive residential areas (concentrations of houses) and areas with scattered houses, surrounded by varying environments (coast, mountain, plane, woods, industrial areas, and so on), often crossed by relatively important roads (dual carriageway or motorway). Some of the cells have up to three population clusters and others only one. There are also some that contain only neighbourhoods, albeit relatively important ones. Some of these cells have a tourism profile, and others have residential or urban profiles. However, the most important detail in each of these cells is that a large part of their interior contains no houses or contains some houses but with a very low density (scattered).
A high density of residences, which subsequently indicates a high probability of burglaries, can generally be observed in only no more than five or six of the 25 sub-cells of 1 km2. Hence, despite a relatively large area in terms of forecasting, preventative action could in fact focus on 25 percent of the territory of the cell.
The non-optimal cells with µ > 1.5 also show a high heterogeneity, but they are usually more populated and tend to contain large towns. In these cases, the territory at highest risk or with the highest concentration of burglaries can cover 50 percent of the cell or more.
Lastly, the non-optimal cells with 0.6 < µ < 1.5 are likewise heterogeneous environments, and they are also similar to the optimal cells, but in this case they are less densely populated. The population clusters cover less than 25 percent of the cell or consist of residential estates or scattered houses.
Discussion
Through a segmentation into cells of 5 km × 5 km and time intervals of a week, it has been shown that a large part of the series of burglaries with forced entry in residences in Catalonia between 2014 and 2015 follow patterns compatible with near repeat victimization. This is because the data are not random either in space (owing to the heterogeneity of the territory) or in time (owing to the formation of waves).
This result could be surprising. Although the study changes the usual micro level configuration in which the theory of near repeat victimisation is explained, the same spatio-temporal patterns that it describes remain. The phenomenon of repetition, which could be masked by the overlapping waves of burglaries of different groups of authors, finally emerge clearly. In the most attractive cells, waves are observed and are not random, but show stable repeat patterns as expected in the micro case.
It could be deduced that the perpetrators of these waves are the same or that they are mostly the same, despite some occasional overlaps. Otherwise, some coordination between different rival groups would be necessary in order to victimize the same spaces and during the same time periods, which seems quite unlikely.
The fact that burglaries intensity in the optimal cells is relatively low, often with activation levels of one or two burglaries and executions that generally do not exceed four or five burglaries per week (less than one burglary per day) reinforces the idea that perpetrators in each of the detected waves is largely the same. Scattered burglaries, from different criminal groups, are difficult to match stably in space and time to generate non-random repetition patterns. Therefore, it seems clear that the spatio-temporal patterns observed in home burglaries in Catalonia, from a macro perspective, could be explained by the phenomenon of near repeat victimisation.
The macro scale option was not the first considered in the study. At the beginning of the research, well-known and available tools were used to check the phenomenon of near repeat victimisation, including “Near repeat calculator” (Ratcliffe 2008) and other free software . As an example, the space time bandwidths of home burglaries in the city of Barcelona were studied. The result was very different depending on the district considered, motivated, again, by the environment heterogeneity. In an aerial view of the city, it’s possible to observe these constructive changes in the neighbourhoods and districts. This problem, initially only detected in Barcelona, was seen to be a common factor in virtually all inhabited areas of Catalonia.
One of the main limitations of Knox’s test-based software is the assumption, usually not explicit, of the space homogeneity. This assumption can be correct when considering cells of up to a few hundred meters, but not more than 1 km. At least, not in Catalonia, where within the same 5 km × 5 km cell there are very different environments of housing and uninhabited areas. In these heterogeneous spaces the replicas of burglaries take place, not in a concentric way and at a certain distance from the initial one, but taking various forms according to the territorial disposition of similar inhabited areas. When the initial area is relatively small but, not far away, similar patterns are observed within the same or adjacent cells, the hazard also appears to be able to make jumps to these unconnected but close areas, both in space and similarity.
These new repeat patterns could be some of the particularities of the phenomenon of near repeat victimization in extensive and heterogeneous spaces. It was also observed that the average intensity of burglaries in space–-time was high, as was the standard deviation, so it was decided to calculate some matrices that would show the viability of each cell or space where a forecast was to be made, the states that generate waves and their non-random ‘force’.
With the optimal cell criteria depending on the CV and non-randomness, the proposal would be to accept the 67 optimal cells to make forecasts with the space–time segmentation considered. With respect to the non-optimal cells with µ > 1.5, a different segmentation that would make them optimal would be required. As it has been shown that these generally behave non-randomly, one option would be to subdivide them into smaller cells or to reduce the time intervals considered.
With respect to the non-optimal cells with averages between 0.6 and 1.5, the opposite is required: increasing the size of the cells and the time intervals. Regarding the first option, some of these cells are surrounded by others with a configuration that is already optimal, or by cells with a much higher average of burglaries, and the proposal is to subdivide these. Therefore, the option of increasing the size should be studied on an individual basis, and the shape obtained may not be square, but could be a juxtaposition of different square cells and sub-cells. Another option would be to increase the time intervals or to simply discard them for making forecasts.
Of the remaining cells, those with a very low intensity of burglaries that also more often display random behaviour are not easily mouldable to make a useful forecast, because either the territory or the time intervals considered would need to be much larger and this would make the preventative policing task much more complicated. It is therefore suggested that they are discarded for forecasting.
Hence, in a first round, with a strictly defined segmentation and depending on the percentage of events observed in these different sets of cells, a model is achieved that is able to viably forecast and prevent one in four residential burglaries with forced entry. In a second round, acting in the way described in the non-optimal cells with averages between 0.6 and 1.5, a configuration to forecast two out of three burglaries could be achieved. Hence, overall, three out of four of the burglaries with forced entry in Catalonia could potentially be forecast.
Thus, with this system of relatively extensive regular cells, a first forecast algorithm can now be designed.
This is, therefore, a new option for the criminal prediction that is added to the many proposals that have emerged in recent years. But perhaps it is the first to propose working from a macro level perspective, which may enrich the already intense debate on the practical application of predictive policing.
From a micro level perspective, predictions are much more limited in space, which, a priori, would be an advantage when planning preventative actions. However, the number of microcells included in these predictions can be much higher than in the macro case, and with a lower expected number of burglaries in each, given that the repetitions that fall outside the narrow bandwidth considered will not be counted. This means dispersing more preventative actions and the need for more police resources to try to make these actions relatively intense and effective in each micro risk area.
In the macro level case, 5 km × 5 km cells include 25 1 km × 1 km cells, and can be complicated to make intense preventative actions with a deterrent capacity due to the big size of the risk area. But it has been demonstrated that the heterogeneity helps to reduce the space in the cell where there are more likely to be burglaries, which is where the preventative action should be focused. And at the same time, this extensive prevention can have an effect beyond the immediate environment of the first burglaries and be effective even for other future prior burglaries nearby or for those that are not replicas of the previous week.
Hence, in this type of heterogeneous and large-scale environments, the size of the cell by itself is not an indicator of the accuracy of the forecast or the effectiveness of the prevention.
In fact, the heterogeneity can be studied in greater depth and used to further delimit the area most susceptible to burglaries. According to the theory of repeat victimization, criminals repeat their crimes in similar settings, so if they have burgled in a residential area they will probably burgle again in a residential area, and if they have burgled in a block of flats then they will probably burgle again in blocks of flats with similar characteristics, and so on for neighbourhoods of detached houses, etc. This type of information can be very valuable for planning a good preventative strategy because it will facilitate fine-tuning the forecast, thus increasing the accuracy of police action in a relatively extensive risk environment.
Another aspect suggested by the territorial visualization of cells, and related to the reflections made in the previous paragraph, is the limits of the cells. Obviously, if a residential zone has been detected where there have been burglaries and repetitions have been forecast, prevention should not focus strictly on the space in the cell if it has continuity outside its limits. The practical information for the preventative strategy must indicate that the residential estate, neighbourhood, type of neighbourhood in the area, and so on, is highly likely to be the target of burglaries, with a certain flexibility in the interpretation of the limits of the cell.
These examples show that the heterogeneity and the classification of the territory into homogeneous areas will determine both forecast and prevention, which is generally assisted by a thorough knowledge of the territory. To this effect, some academic researchers are studying how to incorporate this information into mathematical and statistical models to improve forecasting (Smith et al., 2010).
The coincidence of both static and dynamic risk in the same area and its interaction explains the crime concentration. This is the Flag-Boost-Interaction or FBI theory (Farrell and Pease, 2017).
Police preventative actions must be adapted to the concurrence of both risks in the cells. On the one hand, the environment must be worked from the point of view of the static hotspots to attempt to devise preventative strategies that reduce the risk, looking to find the most influential factors that will enable them to reduce the crime opportunity (the type of residence, the buildings’ security measures, proximity to main roads, etc.), for example using Risk Terrain Modelling (Caplan and Kennedy, 2011). The long-term hotspots or hot cells contribute useful information for structural-type prevention because they detect the most targeted places over time. On the other hand, the study of the dynamics of burglary hotspots such as the one proposed here must help to decide on sporadic preventative actions to stop waves of burglaries being generated. The two strategies must complement one another, and they must involve different police preventative actions normally in the same sensitive cells or environments.
Thus, the theory of near repeat victimization provides a valid general pattern that must be adapted to each specific territory, because there is always a random component and a non-random component in terms of both space and time, which can be understood only locally. In general, the non-random tendency of the burglaries is observed in relatively large areas, whereas in small areas or in a specific residence the occurrence of burglaries is totally random. An explanation for this could be that criminals decide to burgle depending on two basic decisions: which area to burgle and when, and which specific residence to burgle within the area chosen on a specific day and time. The non-random component is associated with the first decision, which is normally maintained over a time interval of two or three weeks. The chosen area can normally be delimited with homogeneity criteria for the territory. The criminals must study the area before committing the first burglary, and, if it is successful, they will almost certainly do it again with high expectations of similar success. The random spatial component is due to not knowing which specific residence in the area will be the next target, and the random temporal component is the impossibility of knowing on which day and at which specific moment the next robbery will occur within this wave.
With this approach, concepts such as similarity and proximity are important, in terms of both space and time. Some generalizations of this theory could contemplate the hypothesis that criminals can select more than one unconnected area to commit the burglaries ‘at the same time’ (on the same day or in the same weeks). These different chosen areas are likely to have similar characteristics, so geographical proximity could be extended to proximity via road. For example, if two of the chosen areas are connected by the main road and the traveling time between them is therefore relatively short, they could be considered to be ‘near’ each other from the perspective of this theory.
If this hypothesis was proven to be correct, a classification, as detailed as possible, of the homogeneous areas of a territory could be made to calculate the minimum time it takes to go (via a land route) from one of these areas to another, and then to construct a matrix of proximities that summarizes this information, combining geographical distance with environmental similarity. Hence, when there is a burglary in a particular area, the theory of ‘widespread’ near repeat victimization would indicate that there is an increased likelihood of burglaries in that area and in the ‘nearby’ areas according to this new distance.
From this perspective, it would be interesting to study the topological aspects of the theory of near repeat victimization. Some studies refer to this need to review the types of spatio-temporal patterns applied in the analysis of criminology, among them those to do with the relationship between the objects represented (points, lines, trading estates) (Leong and Sung, 2015).
Apart from classifying the territory into homogeneous areas, more detailed information about each robbery could also be a great help to improve forecasts. This would include the modus operandi, the type of booty stolen, and how the residence was broken into. The police currently use this information to investigate the crime, but it could also be useful to make a more accurate forecast and to guide prevention. Nonetheless, if the critical area is homogeneous, all the residences are likely to continue being a possible target owing to similarity (the same home security systems, similarly expected booty, and so on). Hence, the degree to which forecasts would be improved is unclear. Furthermore, it is likely that this information is to some extent already included in the information that enables us to classify the area as homogeneous.
As already pointed out, the data considered in this study regarding burglaries take only space and time into consideration. Although space offers reliable data with precise coordinates, time can be more imprecise. Forced entry burglaries generally occur when the owners are not at home, so it is often difficult to be accurate about the exact time of day it happened beyond the day and a window of time (morning, afternoon or night). And when the burglary occurs in an unoccupied second residence, the time window is even more extensive and can be as much as several weeks. In these cases, the data about the burglary are only approximate. In 2014 and 2015, one in four burglaries happened in second residences, which are usually found only in specific, delimited areas with a tourism profile. This temporal limitation will condition a possible forecast, which, in the best of cases, cannot go beyond the day the burglary may occur. For this study, it was decided to use intervals of a week.
Another limitation of this type of study is the black figure. The police know about only the reported events, and there is little information about the black figure. Nonetheless, we can assume that the unreported burglaries are the less serious ones. Some of these may be attempted burglaries or ones where the damage or the value of the goods stolen was low. It can also be assumed that, in general, they have a spatio-temporal distribution that runs parallel to the known facts, with a similar static and dynamic risk.
These limitations were considered during the course of this study. One reported burglary more or less can cause a variation of 0, 1 or 2 more runs, depending on the level, and can modify the results of some statistical contrasts. This is why to confirm the results, the relatively high significance levels of .1 and .2 and other statistical parameters such as the sign of the value of the statistic of the runs test, were considered.
Regarding the significance level of the runs test, if what is contrasted is that the data are non-random for larger groupings, then the region of acceptance is only the left tail of the N(0;1) where there will be all the cases in which the number of runs is less than expected, which will imply that the test statistic is negative, as happened with 100 percent of the cases where non-randomness was observed (except for the cases already discarded owing to a low intensity of burglaries). Hence, the significance level of the results obtained is, in fact, half of that shown.
Lastly, despite these limitations, the data were shown to be robust enough to demonstrate the general dynamic of the burglaries in space–time on a large scale, allowing for some first exploratory studies about the patterns of near repeat victimization in Catalonia.
Conclusions
This study showed that, from a macro perspective, the burglaries with forced entry in Catalonia follow a spatio-temporal pattern that is compatible with repeat victimization. The proposed approach enables us to explore useful predictive models for preventing waves of burglaries. The methodology used is generic and can be applied to any territory, at least as a starting point, and before adopting more complex predictive models. On applying this to Catalonia, it is shown that a large number of burglaries – up to a maximum of three out of four – can potentially be forecast and prevented, from the point of view of the viability of both forecasting and preventative actions. The information about the dynamics of the hotspots justifies the concentration of potential resources in specific places and times. Nonetheless, to obtain the best results, preventative actions must address both the static and the dynamic risk with different preventative strategies and actions. It has been observed that cells with the highest static risk, with a relatively high and stable average burglary intensity, usually coincide with the optimal ones to predict. That is, those that generate a dynamic pattern in the form of non-random waves, which is in line with the FBI theory (Farrell and Pease, 2017) and explanations of crime concentration.
The study was not a micro-analysis and was not carried out on a small scale, but, in this sense, there are limitations to do with the classification of the homogeneous areas. Without discarding the possibility of forecasting burglaries in Catalonia much more accurately in both space and time using complex mathematical models, it is likely that better results would be obtained from combining macro statistical information with micro territorial and police information, and that this approach would significantly reduce the number of residential burglaries. Here, we’d like to mention the last sentence of the article “Crime concentrations: Hot Dots, Hot Spots and Hot Flushes” (Ignatans and Pease, 2018). They say: “Predictive patrolling is possible, and simple locally grown software and expertise is generally to be preferred to commercial products because of the in house learning and skills enhancement which it brings.
Heterogeneity inside large cells can help to make predictions more precise and accurate, as patterns of near repeat victimization are likely to be in similar areas to those of initial burglaries. In practice, this limits the risk area to one or a few of the 1 km2 sub-cells.
The experience derived from this study carried out in Catalonia may be common to that of other territorial law enforcement agencies in similar settings. This may be the case in a large part of the southern regions of Europe. So global prediction and prevention strategies are also possible in there, using the large-scale or macro level option. The heterogeneity of the environment, towns, cities, neighbourhoods, and homes seems to be key to finding the optimal space-time configuration to achieve a useful prediction for the design of preventative strategies.
In any case, police forces are generally recommended to carry out specific, local or regional studies of their territory and its particular problems before adopting any strategic preventative strategy guided by predictive models.
The criteria for adopting one model or another should not be so much the precision of predictions, in the exclusive sense of a very narrow space time bandwidth, but the preventative options that offer to police. Models that generate a myriad of micro-cells where there may be some very few repeats from recent days burglaries, can complicate the police effort to prevent all of them. Otherwise, this study would propose what we can call the surfer’s strategy, this is, to act on the higher wave crests, even if this means ensuring larger spaces. The reward will probably be the great descent down the wave, because these will probably concentrate a big part of the total burglaries of the territory during the week and, as we’ve said, during the year.
Following this macro focus of the theory of repeat victimization, some future lines of research are suggested that revise the concept of ‘proximity’ and formulate the theory in heterogeneous environments, so that replicas in unconnected but similar areas can be considered. When homogeneous, small-sized areas are distributed over relatively large spaces, it seems likely that repeats will not fit in a single area and simultaneous waves may be reproduced in several. In determining which areas may be affected simultaneously, the similarity of environment and the geographical distance and displacement between them will play an important role. This could lead to new risk irradiation patterns that need to be studied in depth to improve both predictions and preventative strategies.
Footnotes
Acknowledgements
The authors would like to thank the Department of Computer Science, Applied Mathematics and Statistics of the University of Girona and, in particular, Doctors Maria Aguareles, Marta Pellicer and Josep Antoni Marti for the constant support and advice they have given since they proposed studying forecasting residential burglaries in Catalonia using mathematical models in 2012. These researchers’ interest led to crime forecasting being proposed as one of the topics of study at the 115th European Study Group with Industry held in Barcelona in 2016. The contributions made by mathematicians from different countries at this conference, especially when posing and structuring the problem, were key to carrying out the present study. We would also like to thank the researcher George Mohler, leading mathematician in the study of crime forecasting models, for the chance to see how the PREDPOL programme works.
Declaration of conflicting interests
The author(s) declared the following potential conflicts of interest to the research, authorship, and/or publication of this article: The manuscript is an original contribution that has not been published before, whole or in part, in any format, including electronically. All authors will disclose any actual or potential conflict of interest including any financial, personal or other relationships with other people or organizations, that could inappropriately influence or be perceived to influence their work, within three years of beginning the submitted work.
Funding
The author(s) received no financial support for the research, authorship, and/or publication of this article.
