



Abstract
This research challenges the long-standing paradigm that considers compositional analysis to be the key to researching historical Islamic geometric patterns. Adopting a mathematical description shows that the historical focus on existing forms has left the relevant structural similarities between historical Islamic geometric patterns understudied. The research focused on the hexagonal-based Islamic geometric patterns and found that historical designs correlate to each other beyond just the formal dimension and that deep, morphological connections exist in the structures of historical singularities. Using historical evidence, this article identifies these connections and presents a categorization system that groups designs together based on their “morphogenetic” characteristics.
Islamic geometric patterns
Islamic geometric patterns (IGPs) are a common feature of Islamic architecture and exist in a variety of shapes and types. The designs employed the most innovative mathematical knowledge of the time to produce a cultural heritage that spread throughout the Islamic world for centuries. Abu’l Wafa al-Buzjani’s book Risâla fimâ yahtâju al-sâni’u min a’mâl al-handasa (On the Geometric Constructions Necessary for the Artisan) gives important clues about the methodology employed in deriving geometry. The thought process Al-Buzjani employed is known today as “algorithmic design thinking,” which identifies a step-by-step procedure of form generation to explore variations and increases the accuracy of the final product.
Yet, the dominant approach to studying IGP focuses on the formal characteristics of historic singularities, with less focus on the mathematics and relations between design parts. Consequently, research on IGP does not incorporate the computational mechanism that is responsible for producing the design multiplicities in the investigation process. This approach is clearly evident in studies aimed at establishing systems of categorization to group together designs that share similar characteristics through the identification of an underlying grid system. The result is classification of the IGP into several categories. The designs included in each category range from designs that share the same repetition structures such as groups of square- or hexagon-based designs1,2 to designs that share the same system of proportions, such as in El-said et al.’s 3 study.
However, a few studies have moved beyond this traditional formal approach to emphasize the relationship between mathematics and historic IGP. One such study is by Al Chorbachi, where the author examined the geometry in Fi tadakhul al-ashkal al-mutashabiha aw mutawafiqa (On interlocking similar or congruent figures) manuscript and identified the formula used to generate the design. By manipulating the formula, she was able to derive several new design variations. 5 Although this study examined a specific design, it provides an approach that is concerned with utilizing a scientific method rather than merely focusing on the formal qualities. Another interesting example is by Lalvani. 6 He presented a “shape code” that diagrams the relations between the points to describe Islamic geometry using notations. Studies that followed focus on the incorporation of digital tools for design exploration purposes. Aljamali, Kaplan, and Izadi proposed different methods and developed computer programs for design exploration. By defining parameters and manipulating the values of those parameters, they derived new designs.7–10 Riether and Baerlecken 11 explored the use of digital design and fabrication tools to create spaces from patterns.
However, the mathematical approach to classifying the patterns is primarily based on symmetry. The first study that scientifically investigated IGP was conducted by Müller 12 . Müller analyzed the symmetry of the patterns based on group theory. This research was followed by a publication by Abas and Salman, 14 who attempted to identify a method to categorize the design of IGP. They acknowledged the important contribution of group theory in studying the patterns and used scientific notation to identify individual geometric designs. Djibril and Thami 15 developed a computational method for identifying the symmetry group of the patterns. However, these studies did not investigate internal geometric designs. Rather, they focused on repetition and design propagation using symmetry. Consequently, it remains unapparent how designs that share the same symmetry may relate to or be differentiated morphologically from each other.
Digital morphogenesis
The writings of French philosopher Deleuze, 16 Deleuze and Guattari, 17 and Deleuze 18 from the second half of the 20th century had an impact on the use of digitals in architectural design. In his book, Difference and Repetition, Deleuze developed a theory of how forms come into existence—morphogenesis—and aimed to identify ways of novel creation. Deleuze argued that the forms we observe in reality are an “actualized” status of an idea and that the generative process is capable of producing other possibilities of what Deleuze identifies as “virtual” realities. Not to be confused with “substitute reality”; “virtual” here refers the space of possible ideas that can be actualized. 19 To Deleuze, an actualized form carries morphogenetic possibilities that have not yet been actualized. He further argued that this potential population of virtual design multiplicities precedes the singularity of actualized design and, therefore, the virtual is just as real as the actual.
Later, Deleuze’s work made its way to architectural philosophy through the writings of Greg Lynn. Folding in Architecture by Lynn, 20 which is based on Deleuze’s Le pli, is considered one of the first attempts to theorize digital architecture. Lynn proposed the manipulation of formal representations using digital tools, fundamentally challenging the dominant representational logic of traditional architecture. 21
The use of digitals is changing ways of thinking about architecture; research and design are no longer about a specific, actualized form, but rather the process that generates the form and is capable of generating morphological multiplicities. Morphology is a fundamental concept in the digital design process; it helps not only in exploring design multiplicities and form optimization but also in understanding forms’ origin, evolution, and devolution, which are important concepts in both the research and design of forms. Knowing what is possible in the virtual space and comparing it to the actualized designs can reveal information about the selection process. 22
Methods overview
This research utilizes mixed methods in two sequential phases. In phase one, simulation modeling is employed. Simulation is constructed through the observation of reality and aims to provide a comprehensive representation of this reality. In this research, mathematical simulation models are utilized to “capture real-world relationships in quantifiable abstract values.” 23 Consequently, representational codes were derived to capture the “reality” of the historic IGP in a numeric form. In the subsequent phase, content analysis is utilized to study and compare the representational codes, searching them for possible correlations. The process of conducting content analysis includes the identification of the “content categories,” “recording units,” and “system of enumeration.” 24
Data collection
This research employs non-probabilistic purposive sampling that tracks surviving designs. The literature review played a central role in guiding the data search process. Chronologically, the period from the 9th to the 15th century is identified as the era of “invention.” 14 Geographically, close examination of the literature reveals that IGP were developed in the Abbasid Dynasty in Baghdad and Samara and then dispersed into other regions, later reaching the Mamluk, Timurid, and Nasrid Dynasties. 13 Therefore, all designs that exist on monuments belonging to these dynasties were also considered (Figure 1).
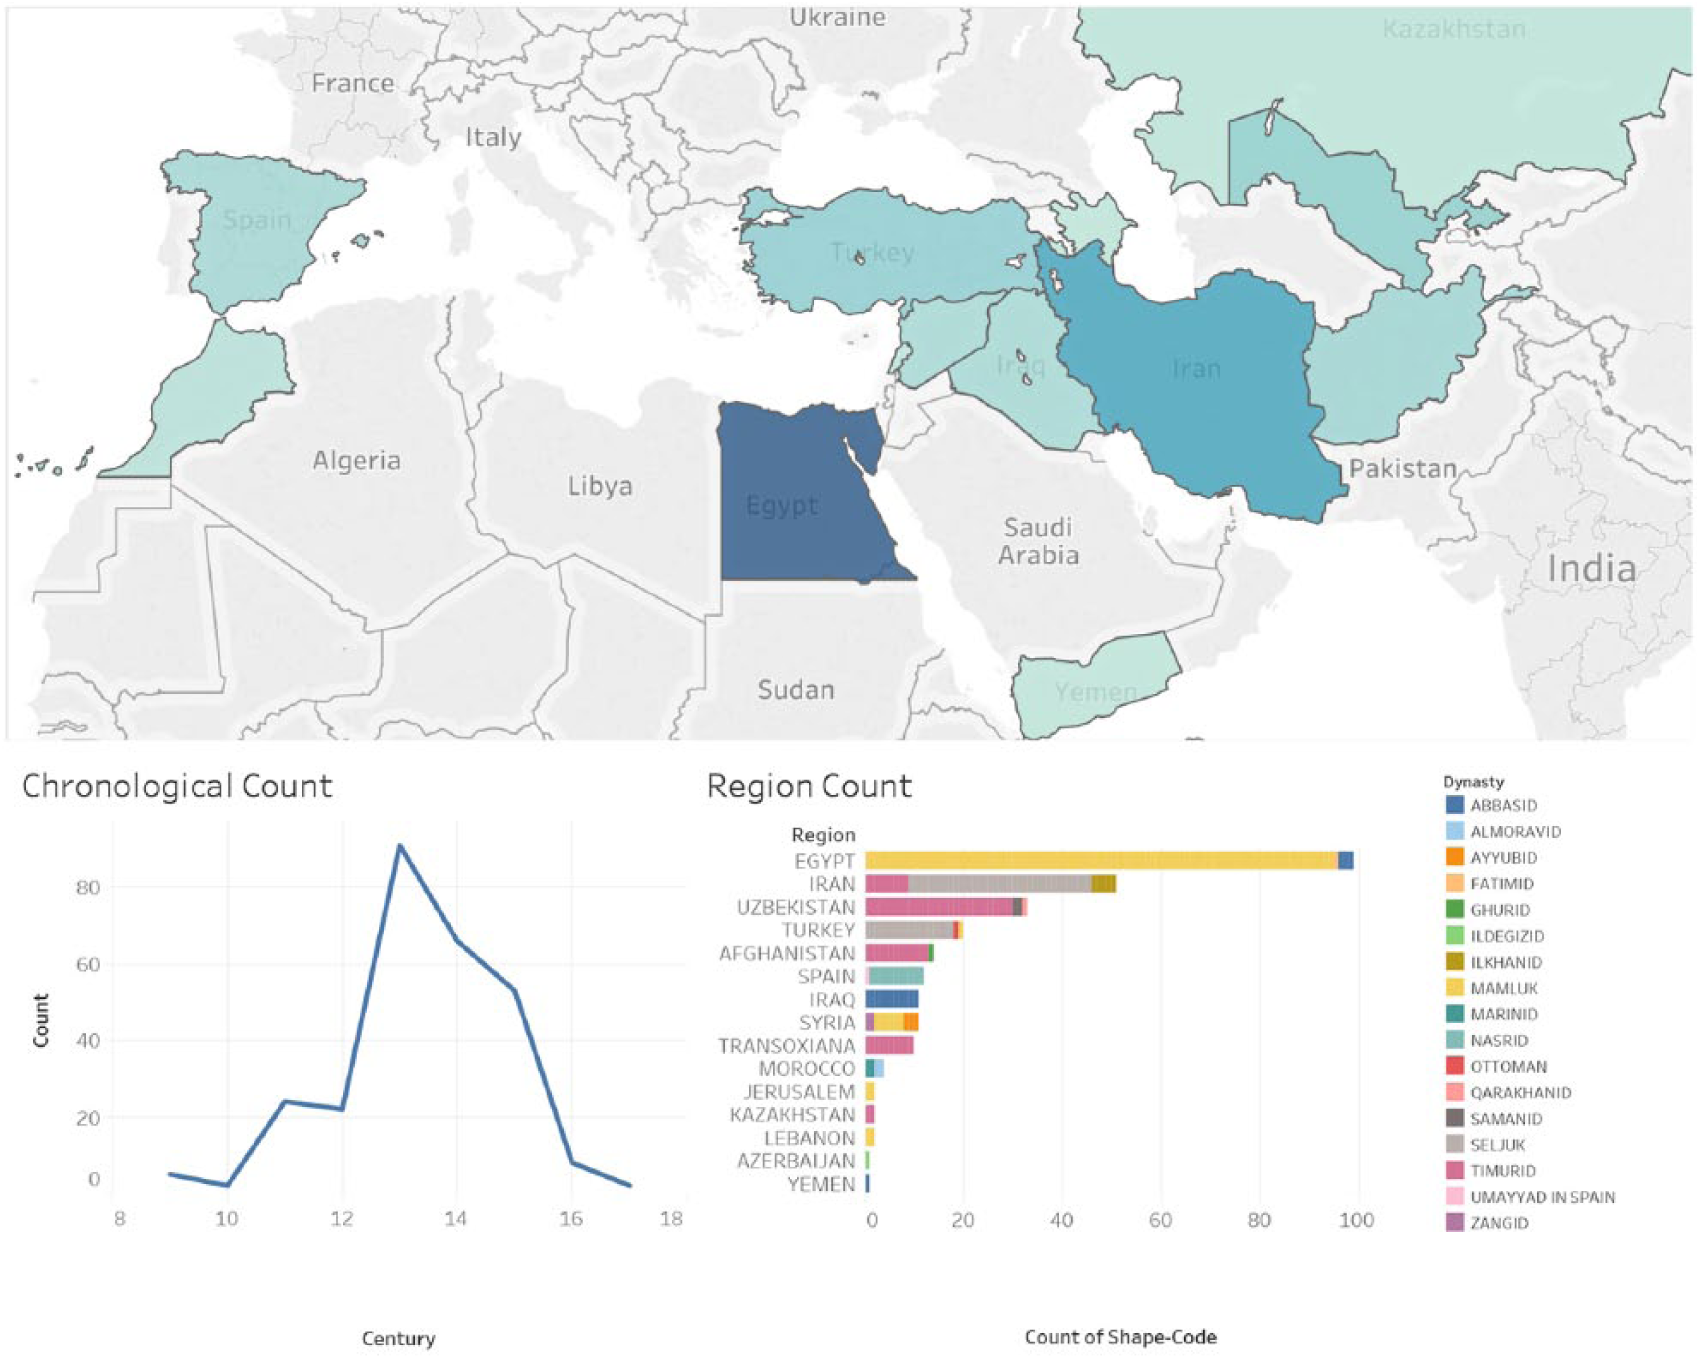
Top: shows the geographic distribution of the collected data. Bottom right: a bar chart demonstrates the total number of designs collected from each region. The colors on each bar refer to the proportion of designs that belong to different dynasties. Bottom left: shows the number of each collected design in relation to chronological period.
This research focuses on hexagonal IGP. These types of geometric patterns have been widely used in the Islamic world since the early days of the patterns. Furthermore, Abas and Salman’s 14 study of symmetry showed that hexagonal IGP are the most frequently used periodic pattern.
Data from historical buildings were collected through photographs gathered from books,13,25–28 journal articles,29,30 library archives (the Aga Khan Documentation Center at MIT and the Creswell Photographic Archive at The Ashmolean Museum), and authoritative websites (Archnet and dome websites).
In the early stages, designs were limited in number, and the literature13,27 identifies the monuments by their original names, dynasty, and geographic location. Multiple sources were examined, and the designs were collected and arranged chronologically. The literature discusses designs after the early stages in terms of the governing dynasty and mentions some monuments as examples and discusses particular designs. The collection process resulted in a total of 273 designs collected from mosques, madrasa, hospitals, mausoleums, and palaces.
The morphological description
In the first section, geometric analysis concerning the understanding of the “reality” of the IGP is conducted, then the development of the representational codes is discussed.
Analysis of the IGP
Periodic IGP consists of two main components: a repeat unit (RU) and a repetitive structure. 3 While the RU contains the primary geometric design to be populated, the repetitive structure stacks the RU to fill the space completely, leaving no gaps. Together, the RU and the repetitive structure determine the wallpaper symmetry group to which the pattern belongs.
Determining the wallpaper group is important for identifying the “fundamental unit” (FU). This unit represents the minimum geometric composition that is being systematically replicated. 14 Thus, the employment of such a unit in the development of a geometric description produces shorter, more “economical” codes.
In the case of hexagonal patterns, there are five possible types of wallpaper groups: P3, P3M1, P31M, P6, and P6M (Figure 2).
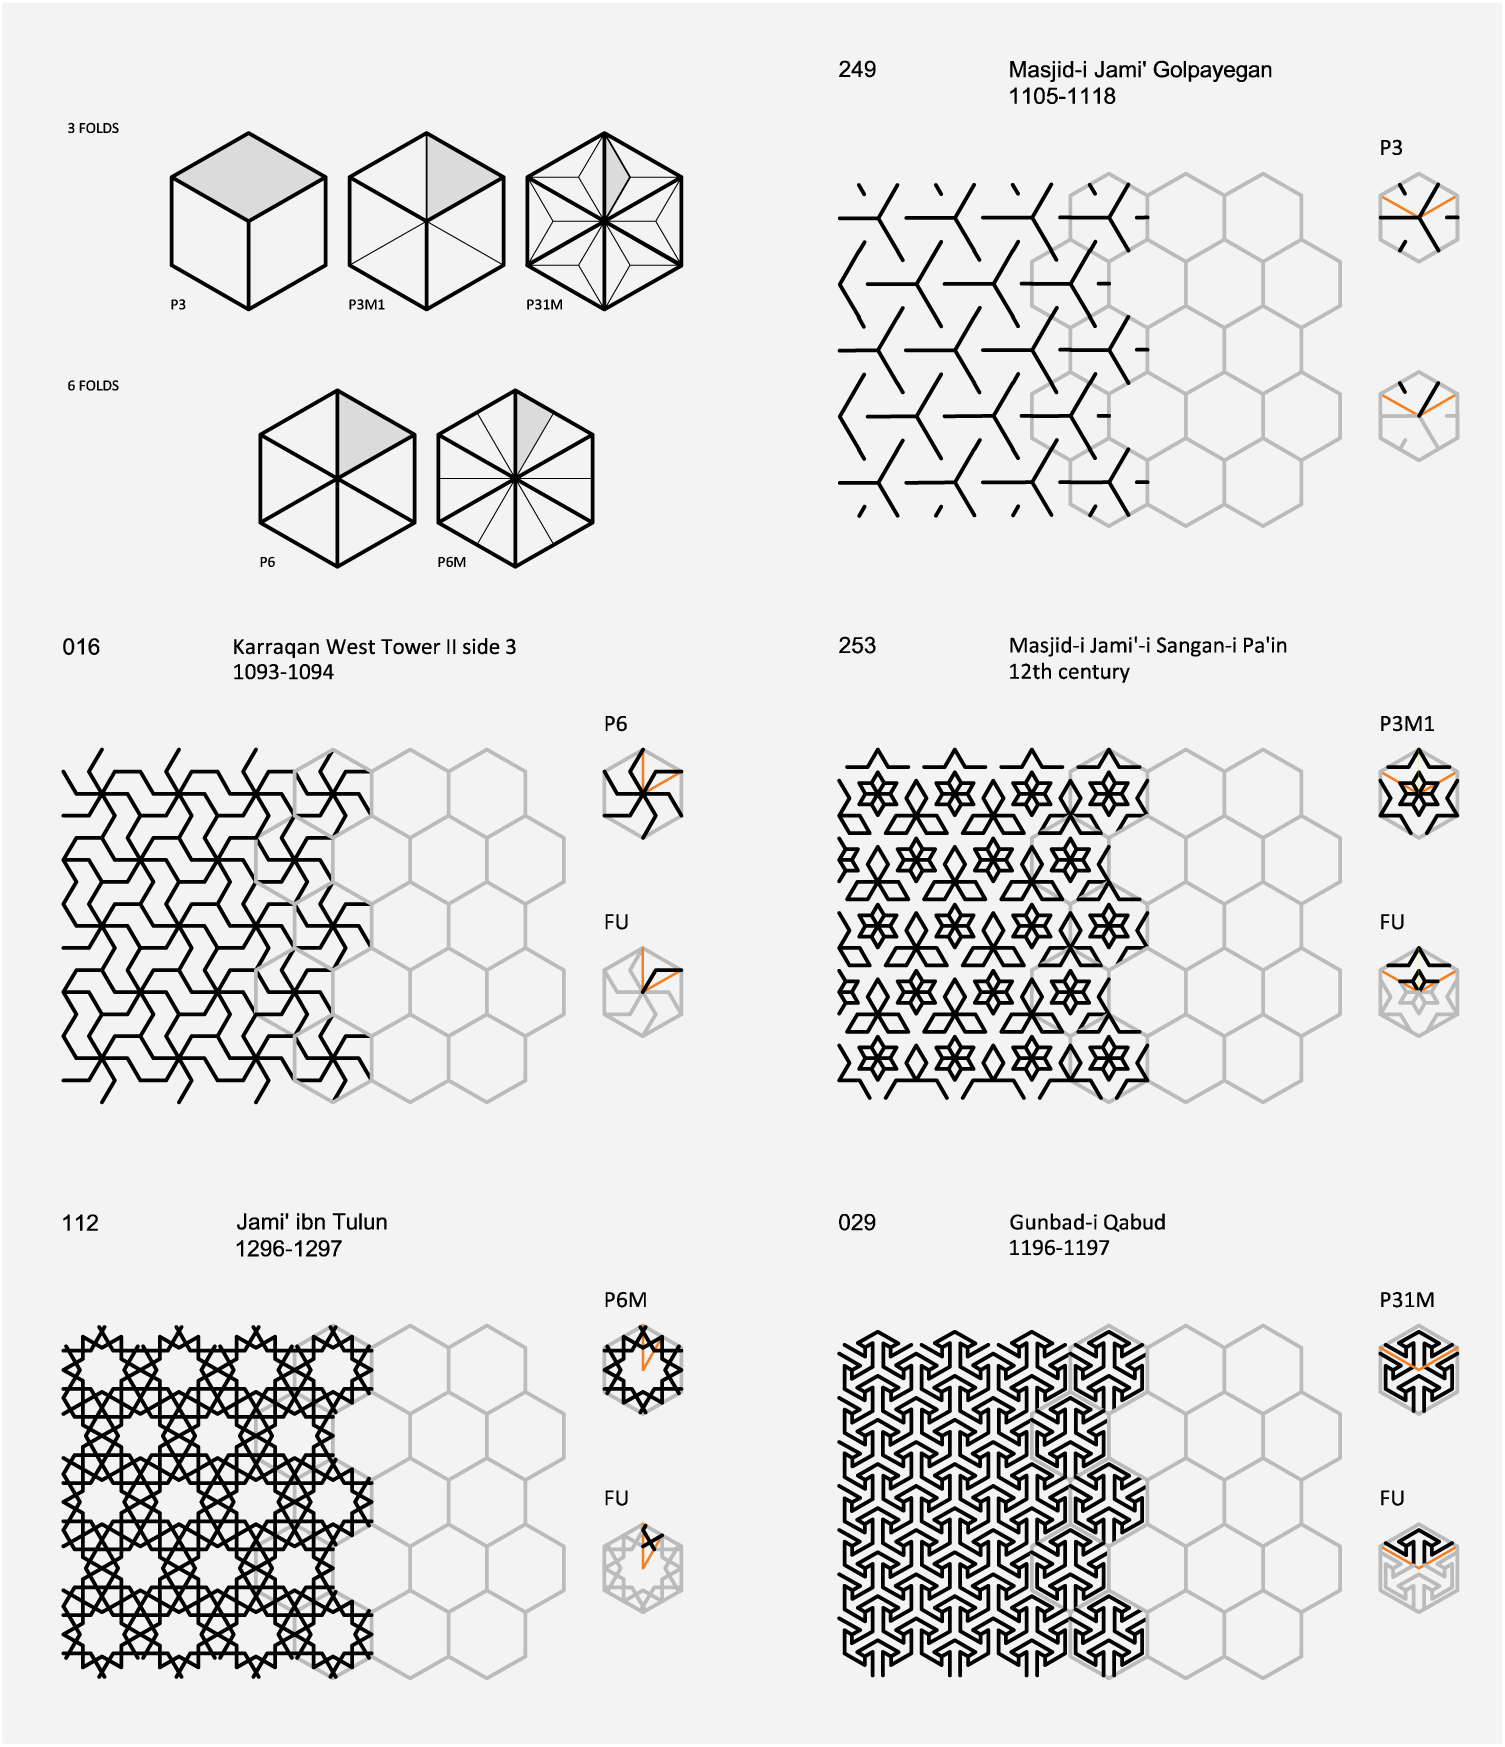
Examples of each of the five types of the symmetry wallpaper groups and the process of identifying the FU. Top left explains the FU by itself (“The International Crystallographic Notation” was employed to label different types of symmetry groups).
The representational codes
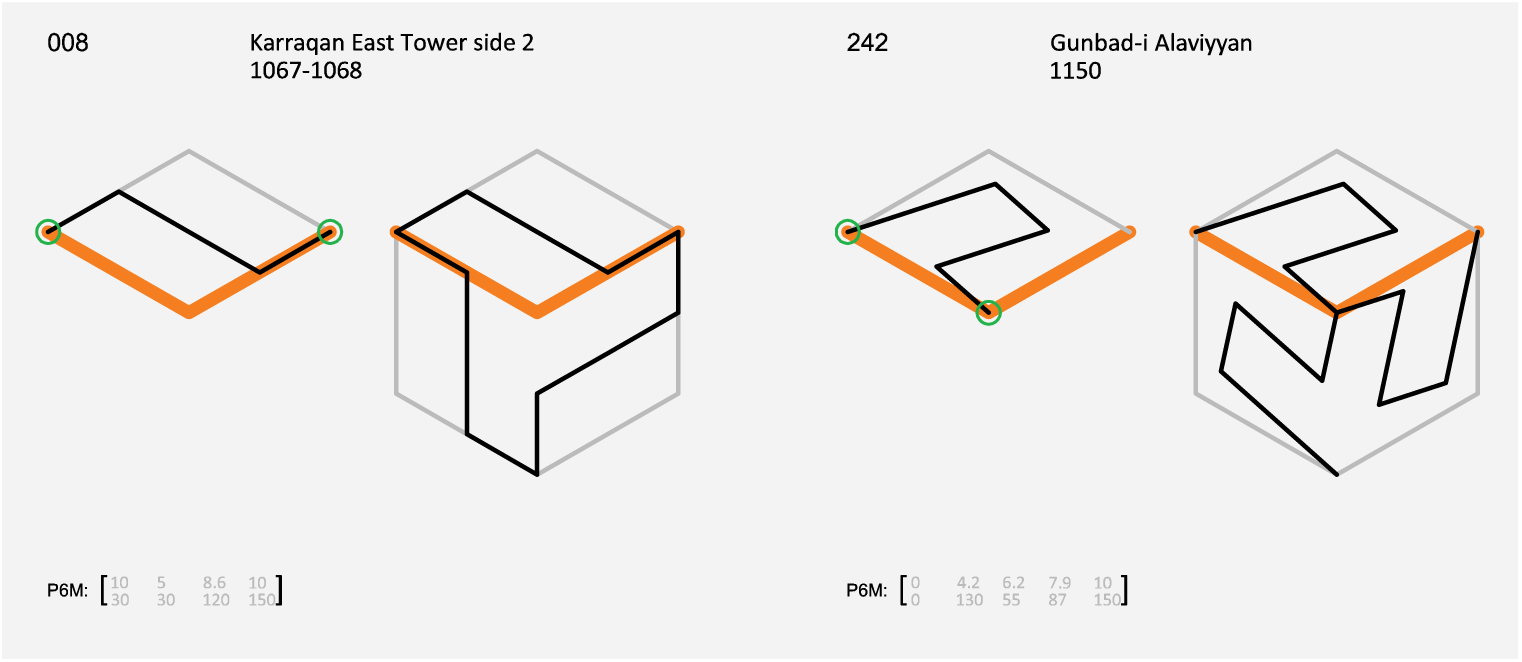
The representational codes exploit symmetry information and constructional components—points and their relationships—that fall within the FU to develop a “deterministic” simulation model that “outputs” geometric patterns based on an “input” of numeric code. The constructional components within the FU can be represented mathematically by referring to each of the constructional points in a sequenced manner in a similar way to March and Steadman’s 31 method. In general, and based on the design within the FU, two scenarios were identified: single and multiple polyline(s). In the first scenario, the FU contains only a single polyline that can be described by listing all of the constructional points that fall within the FU in a sequenced manner.32,33 For instance, the design that exists within the FU of the Ibn Tulun mosque (shown in Figure 3) can be represented as

where

Similarly,

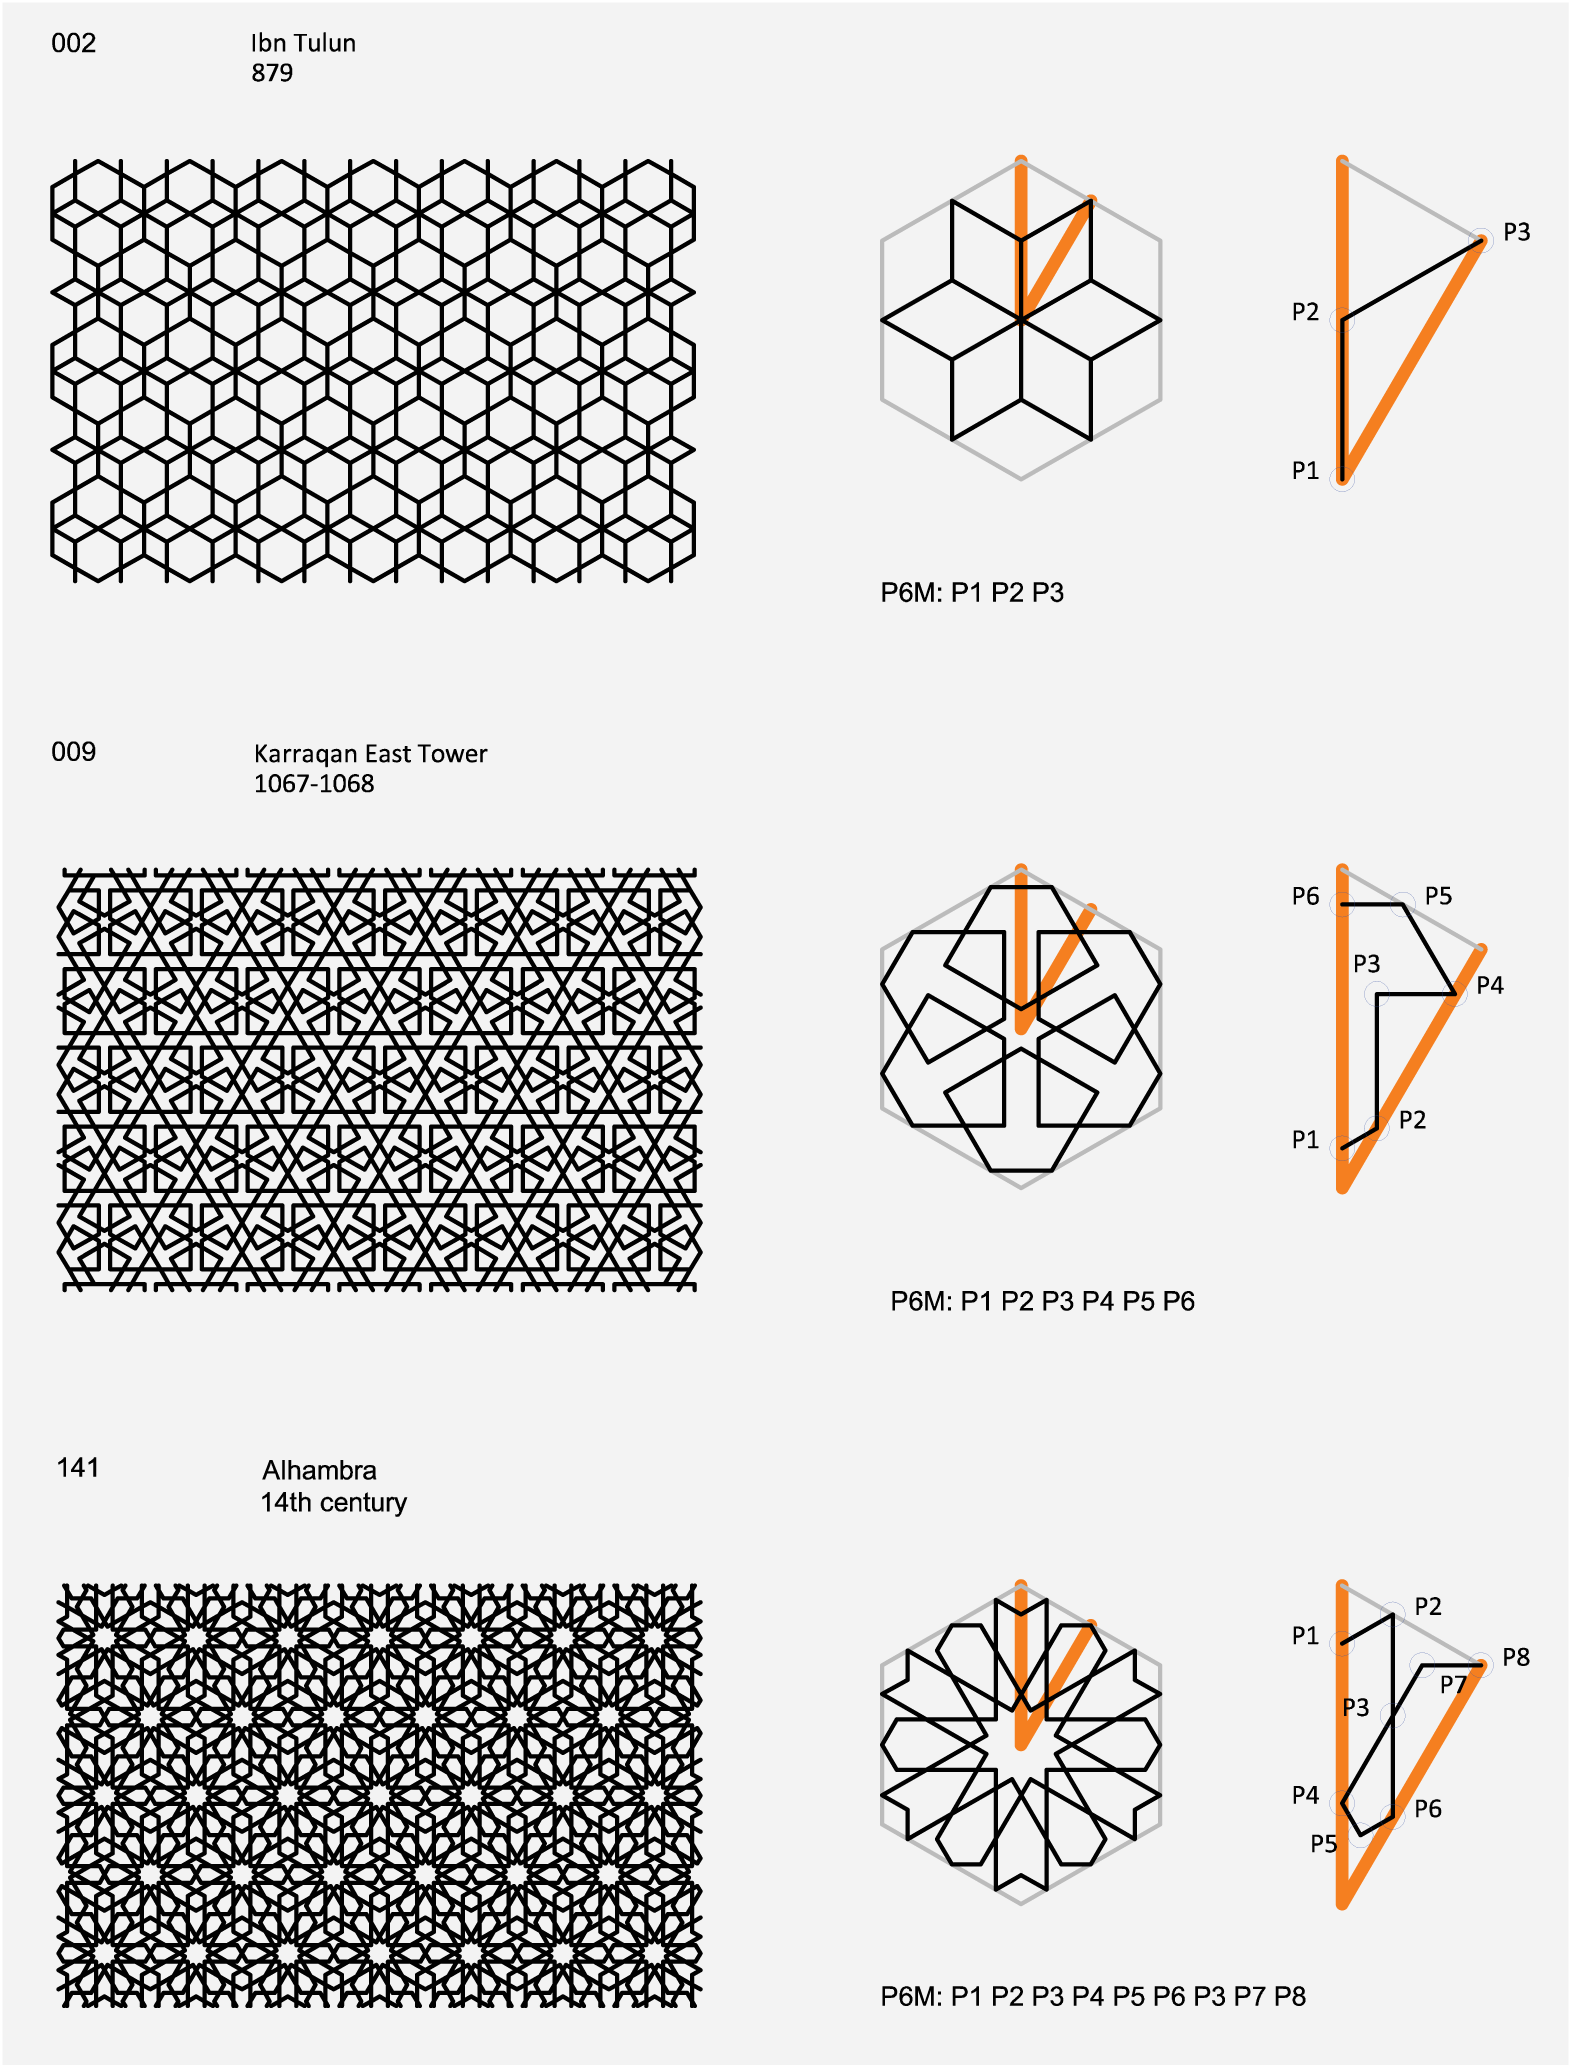
The top shows geometry from Ibn Tulun mosque, and the middle shows geometry from the Karraqan East Tower. Bottom shows single polyline that closes on itself in a quadruple connection point. All geometries are shown in terms of the whole pattern, the repeated unit, the fundamental unit, and the representational code.
However, the single polyline scenario accounts for only 61.5% of the collected historical data. To represent designs with multiple polylines within the FU, each polyline is described by listing all points in a sequenced manner. If a shared point exists between two polylines, the point is addressed in each list. For instance, the geometry shown in Figure 4 (top) can be described as

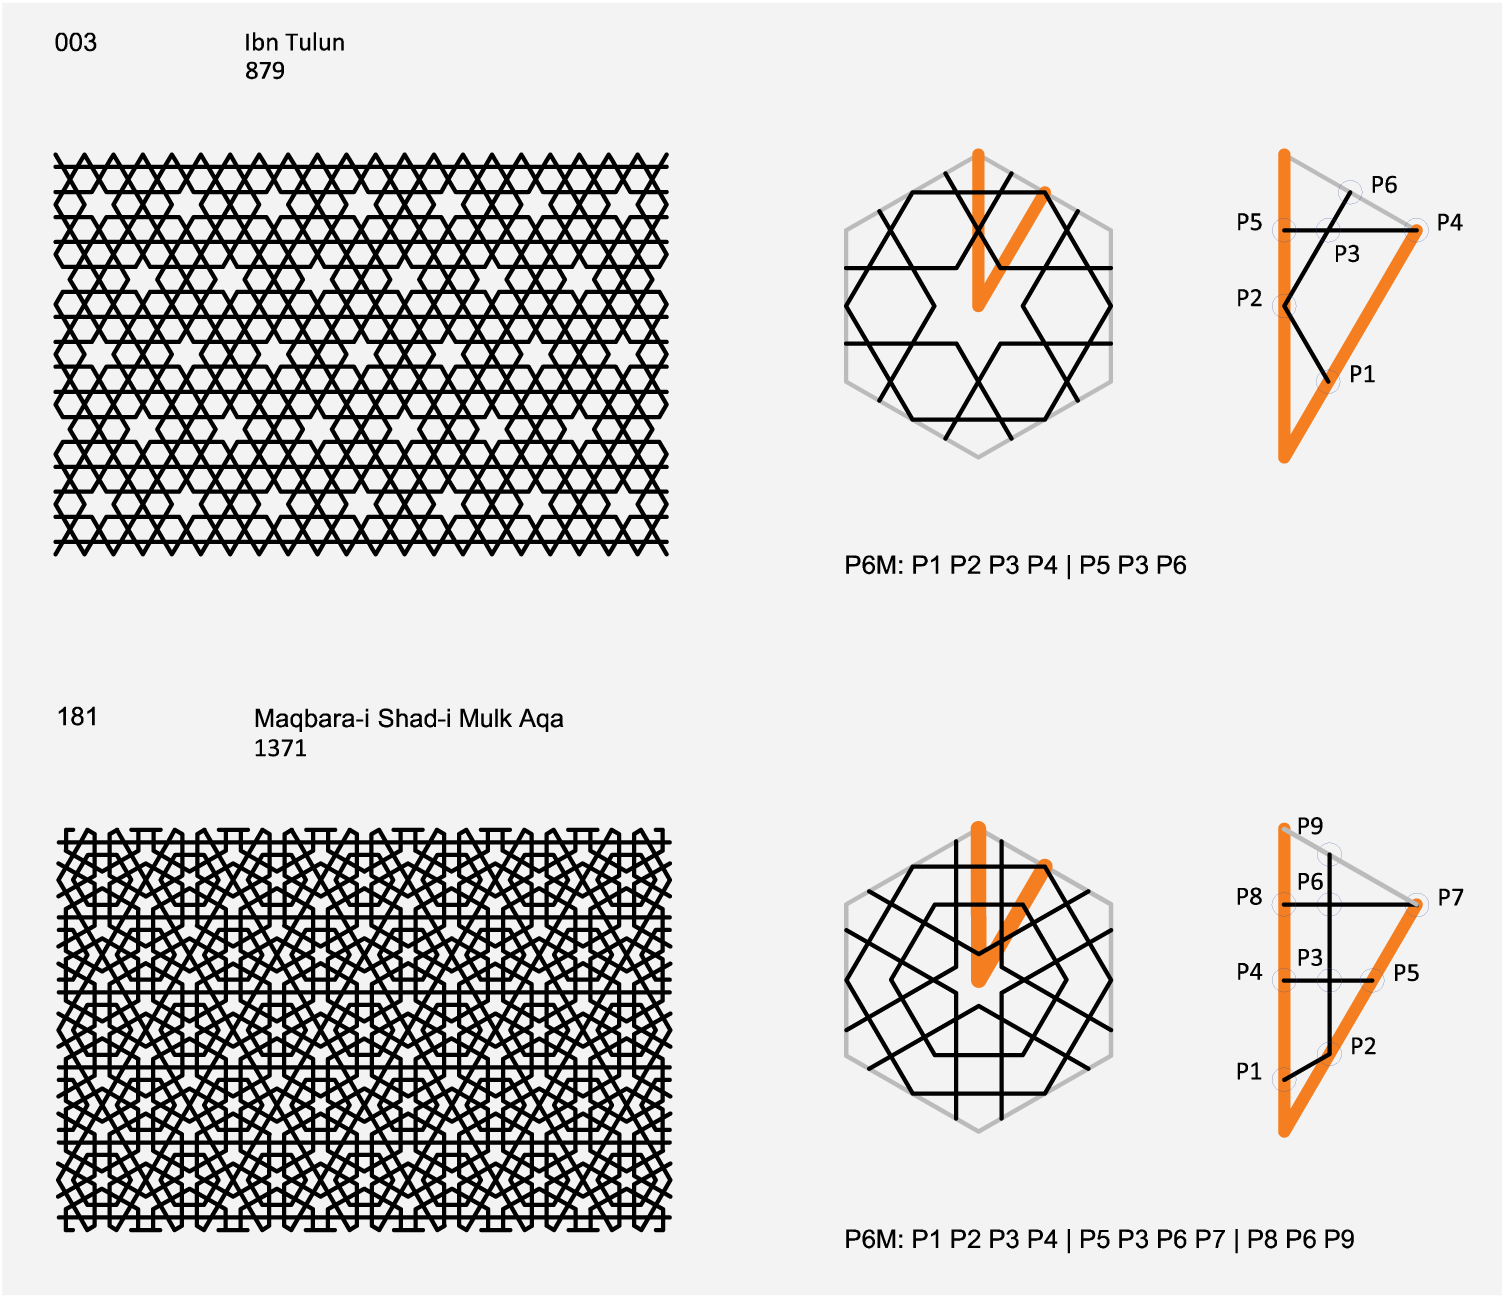
Multiple polyline scenarios. The top shows a design with two polylines within the FU, and the bottom shows a design with three polylines within the FU.
Furthermore, the actualization of the design requires clearly defining the exact location of the constructional points. These points can be defined using their polar coordinates. Therefore, the code for the design in Figure 3 (top) can be expressed as

Similarly, the design in Figure 4 (top) can be expressed as

In this code,
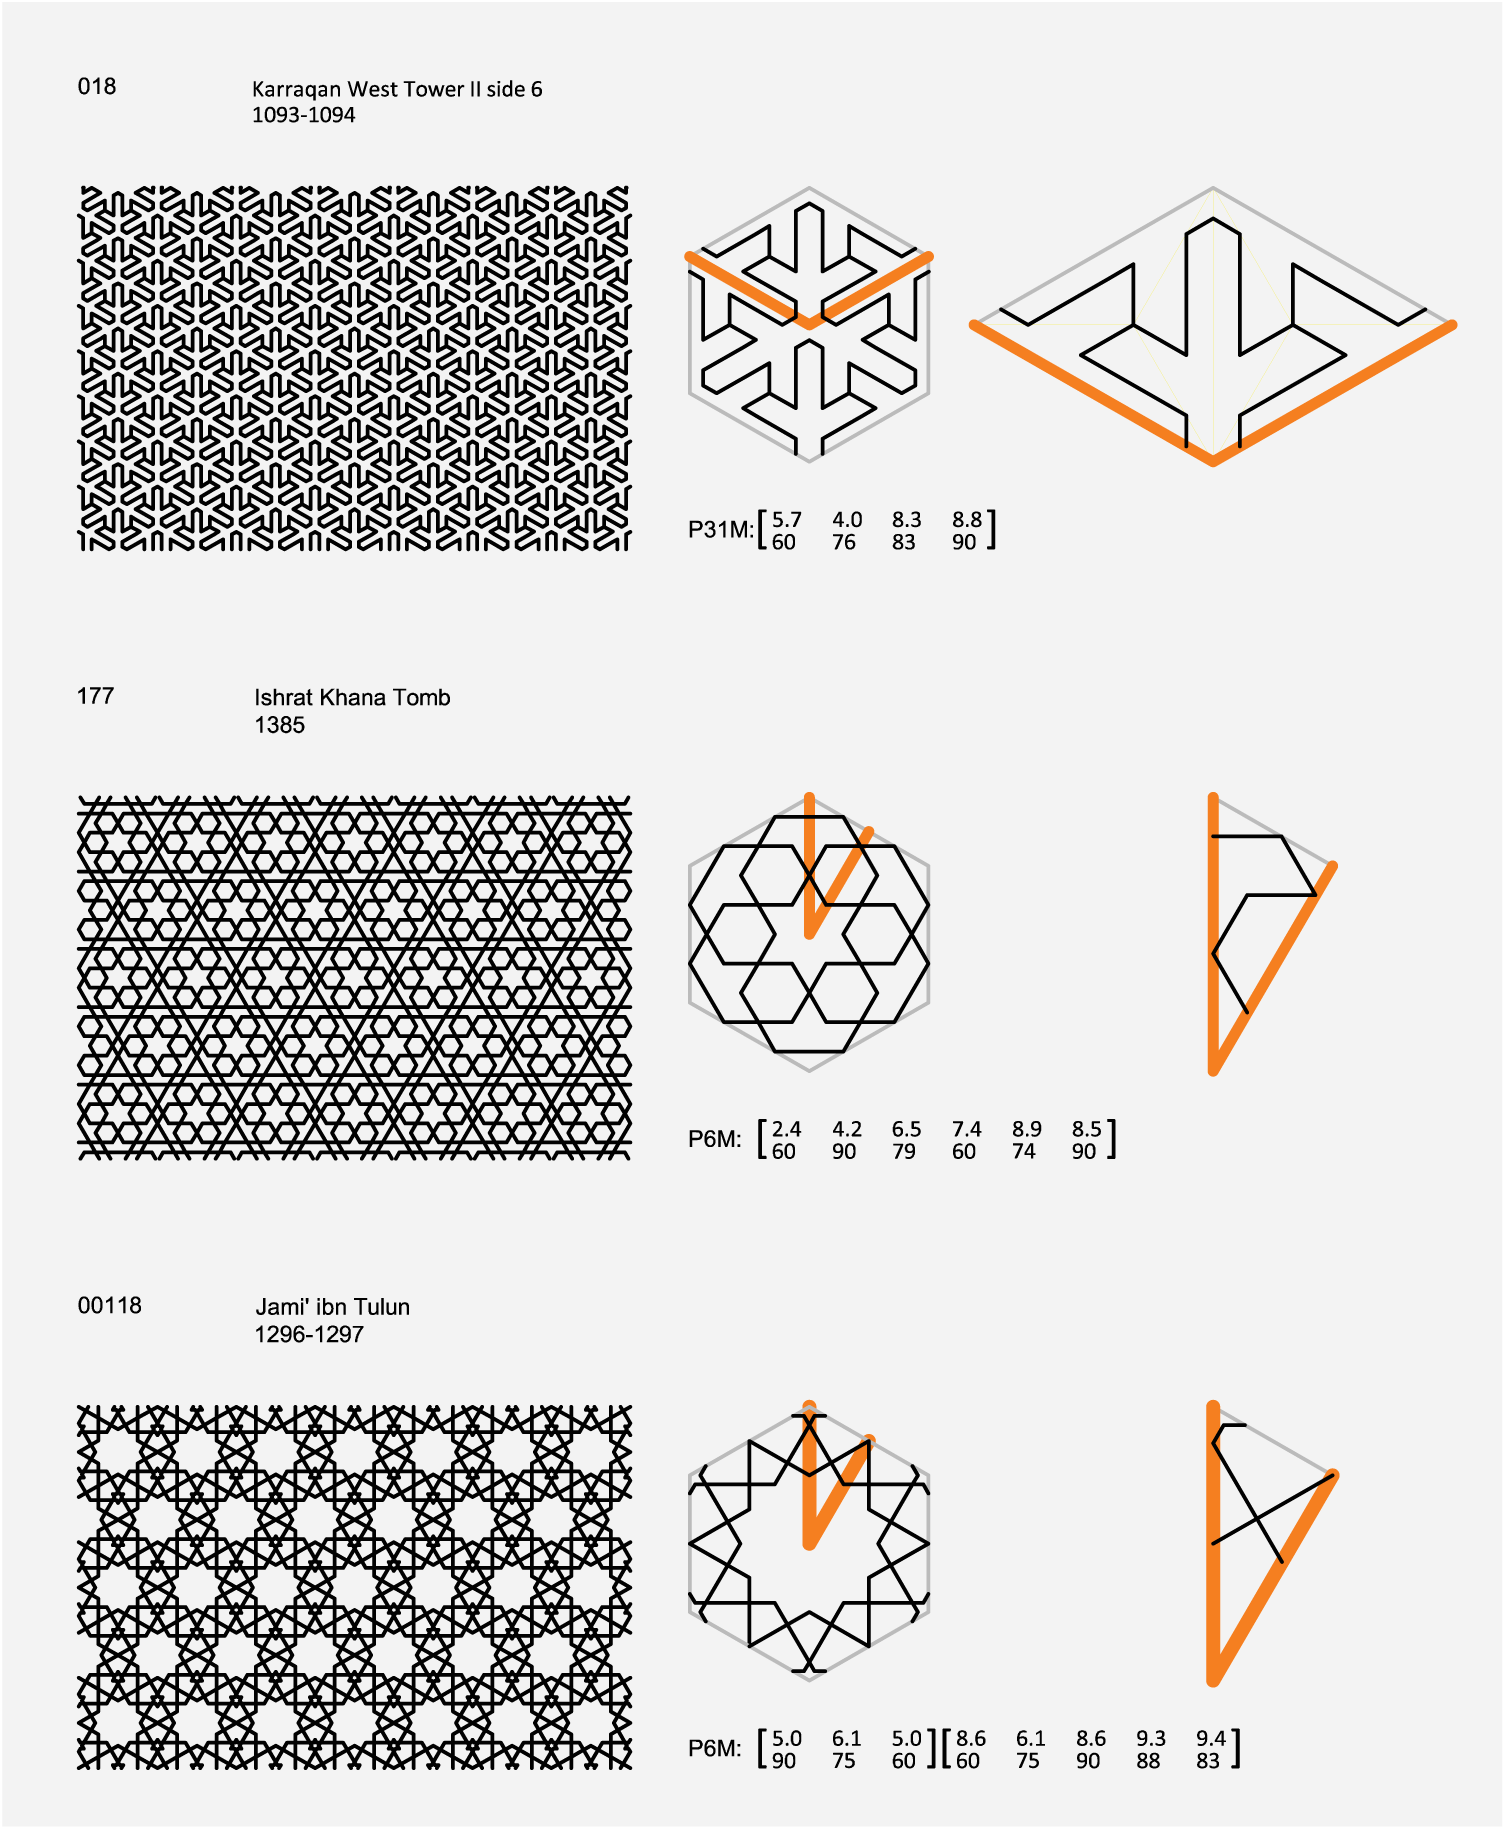
The pattern on left can be generated using the representational codes on the bottom right of each design.
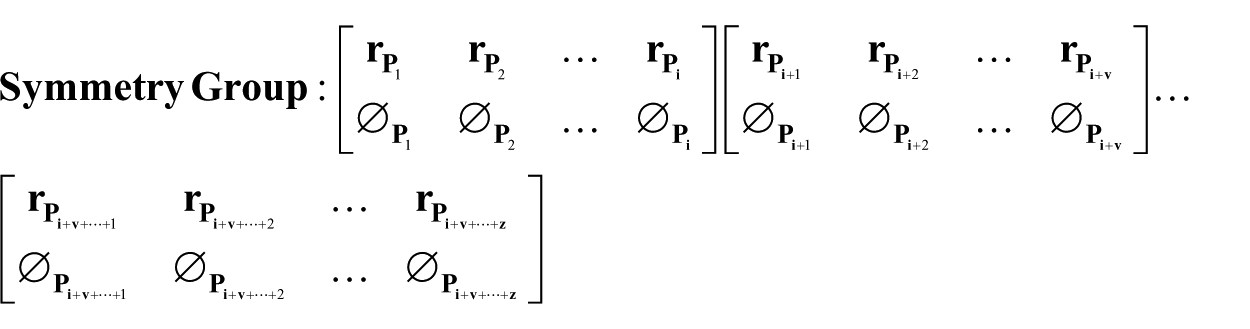
To develop a description model that represents the virtual space of IGP, the derivation process of the description model moves from the actualized designs to construction of a model that encompass all IGP possibilities. This also aligns with the philosophical argument of Gilles Deleuze, who argued that actualized designs still carry “morphogenetic possibilities” within them. Thus, the coding process was carried out for all of the 273 collected designs to extract a description model that captures the virtual morphological design space of an IGP can be expressed as
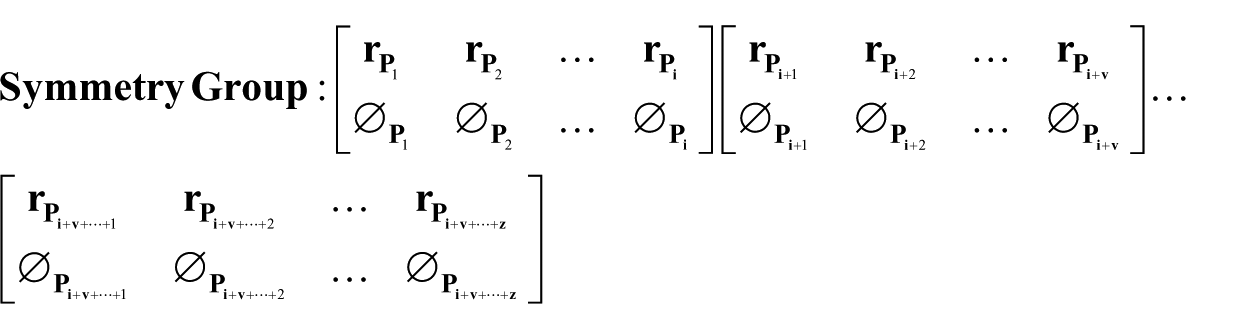
where
The simulation program
The quality of a description is determined by its ability to reflect reality. Therefore, to verify the ability of the code to describe the IGP, the researcher specifically developed a simulation program that reads the representational code and visualizes the design (Figure 6). The inputs to the program are the representational code, and the outputs are the visual images in the Processing “display window.”
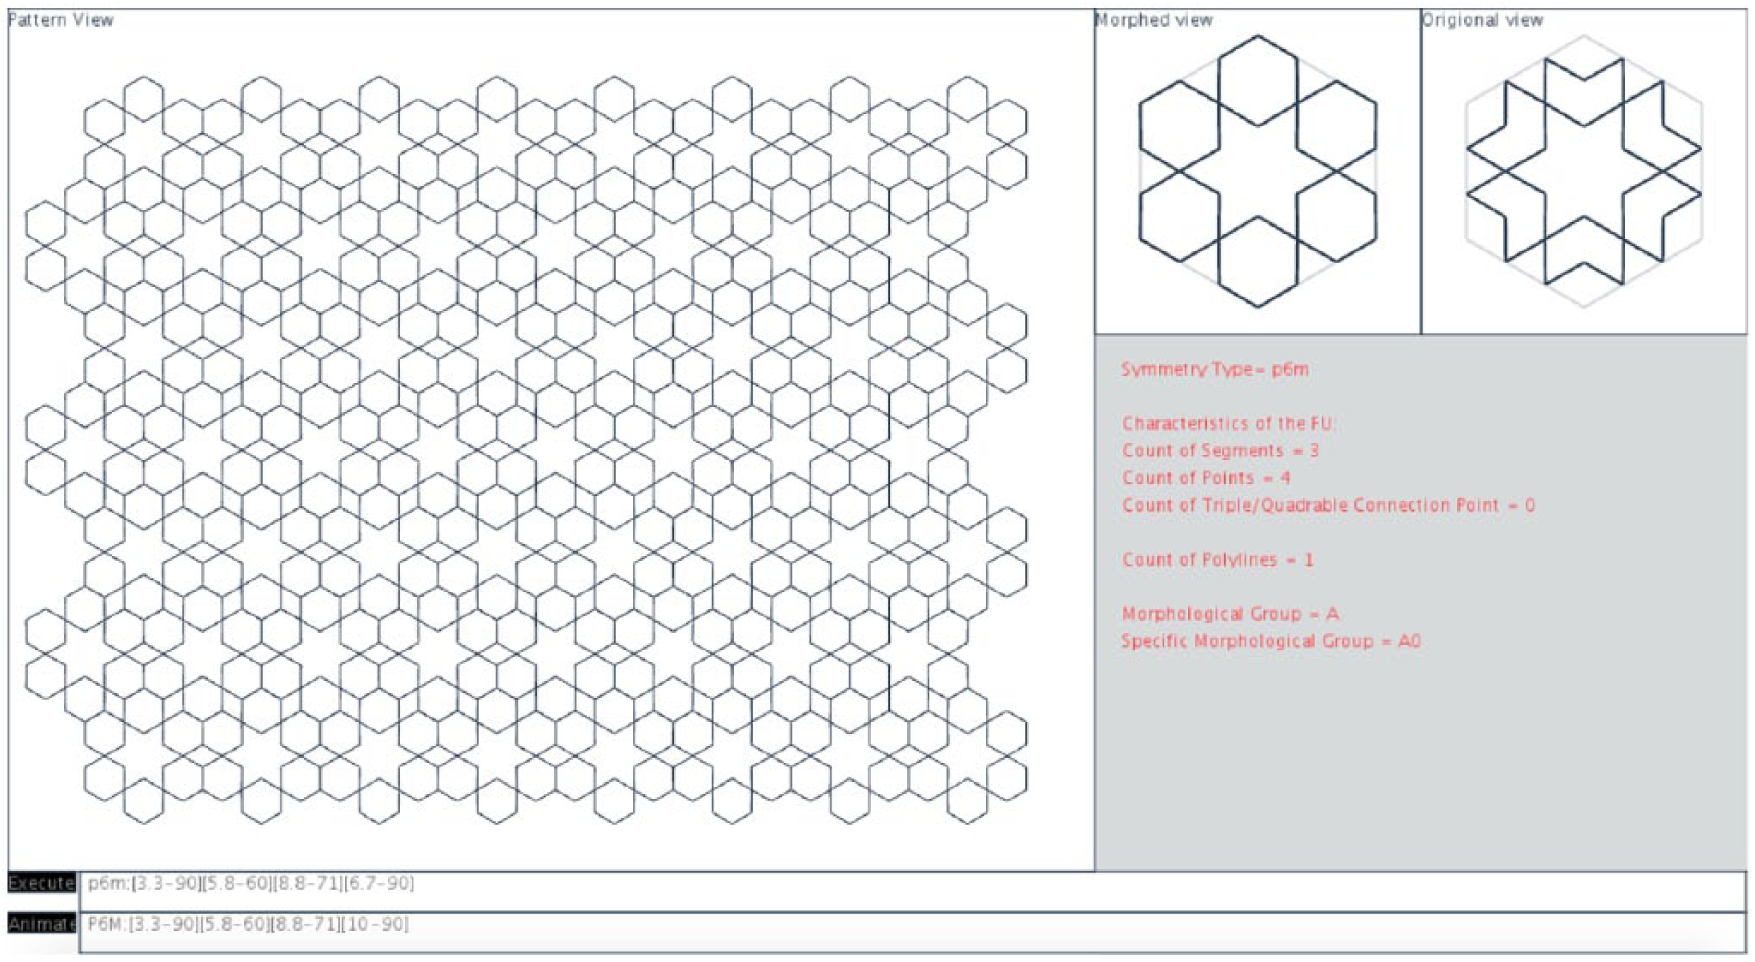
Explanation of the interface of the IGP explorer (the simulation program). The program implemented using Processing programming language.
The program provides additional morphing functionality that performed through changing the values of the representational code and redrawing the design as Figure 6 shows. When the results of the morphing process were compared with the representational codes of historic IGP, it was found that some of the newly derived codes exactly matched historic designs in other regions. 33 Therefore, two types of morphological correlations between the historic designs were identified: identical designs and structurally equivalent designs, which the study further investigates in the following sections.
The morphological correlations
This section utilizes the developed representational code and begins establishes the content category, discusses the search algorithms employed to investigate the representational codes, and presents the results of each content category. Finally, the section discusses the identified morphological correlations.
The content categories
The identification of the content category is driven by the following questions: What is the frequency of the replicated designs in the collected historical IGP? Furthermore, does a structurally equivalent design exist? If yes, what is the frequency of such designs? Consequently, two main categories based on the Deleuzian’s actual–virtual conceptual framework were established: identical and structural equivalency. The identical category is concerned with identifying replicated designs; therefore, the recording unit in this category is the full match of the representational codes between the compared designs.
The structural equivalency category is concerned with identifying the existence of shared morphological configurations among historical designs. This category is further subdivided into four levels that each has its own recording unit. The representational codes of the actualized designs were examined on several levels in this category, moving gradually from the actual dimension toward the virtual design dimension. At each level, the comparison between the representational codes considered specific variables that have connections to the actualized dimension; in the subsequent level, fewer connections to the actualized dimensions were considered, moving gradually toward the virtual dimension (Table 1).
Variables considered in each content category. The check marks refer to the considered variables when comparing the recording units of the investigated designs. Note in the structural equivalency’ first level, the comparison considers only angles while discarding distances, and not the other way around. This allows for searching for designs that share the same polyline flow. Such designs are morphologically closest to the actual dimension.

The search algorithms
A search algorithm was developed for each of the above content categories that compares an input of representational code with the database of the historically existing hexagonal IGP and output types of existing correlations. However, before the comparison process can take place, the representational codes must be sorted. Although each representational code always refers to a single output, a single IGP design can have more than one possible representational code that describes the design depending on the possible ways to sort the sequence of the constructional components. Therefore, before comparing the codes using the matching algorithm, all possible representational codes must be identified.
Searching for identical designs or designs that are structurally equivalent of level 1 or 2 requires the comparison of value and sequence of points information (Table 1). Therefore, a sorting algorithm was developed. The sorting algorithm depends on the number of polylines and internal intersections within the FUs. IGPs that share the same segment count the total number of polyline(s) and intersection points can be considered candidates for an identical or level 1 or 2 structural equivalency categories and, therefore, require sorting. Figure 7 shows a design that consists from of a single polyline within the FU. In this particular case, there are only two possible ways to sort the representational code: (1) starting from “P1” all the way to “Pn,” where “n” refers to the last point in the description; (2) the reverse of the first code, which is starting from “Pn” all the way to “P1” (Figure 7, top). In the case of a single polyline with single intersection, the sorting algorithm determines the possible paths that the polyline can take through the identification of the triple or quadruple connection point (T/QP) and reverses the order of the constructional points that fall in between the T/QP. Afterward, the first algorithm (i.e. single polyline with no intersection) can be used for each possible path (Figure 7, bottom). If multiple polylines exist, the algorithms above can be used interchangeably to determine possible polylines paths. A sorting step is important to control any coding inconsistencies caused by the researcher in regard to coding similar designs in a reverse order or the identification of polyline paths.

Explaining the sorting algorithm for the single polyline case. The input code refers to code inputted by the researcher. Partial reverse refers to the process of partially flipping the highlighted point sequence (colored boxes).
Matching algorithms, however, compare two representational codes and return the type of the morphological correlations that exists between the two compared designs. All possible codes from previous section were considered in the comparison. A matching algorithm was developed for each of the content categories. The following sections present the matching algorithms and the result for each category in terms of frequency of occurrence.
Identical match
This category determines the frequency of occurrence of the replicated hexagonal IGP. The recording unit in this category is the full match of the representational code of the compared designs. The code of each IGP in the collected data is compared with the other 272 designs. If the code matches another design, the two designs are labeled as identical.
Based on the examination of 273 designs, 181 were found to share their representational codes with at least one other design while 92 designs were not replicated. To find the percentage of designs that share representational code, the identical designs were grouped together, and each group was counted as one design. Therefore, the total number of unique designs becomes 138, and the percentage of replicated designs becomes 33.33% (46 designs) (Table 2).
Unique (grouped) designs versus ungrouped designs.

The earliest identified copied designs found in Karraqan East Tower from 1067 CE in Iran (Figure 8, top). The design was copied from an earlier design that existed in 977 at the Ata Arab from in Uzbekistan. This design was found later in three other monuments: Rasd-khaneh-i Ulugh Beg in Uzbekistan (1420 CE), Aramgah-i Shah-i Zindeh in Transoxiana (1434 CE), and Ishrat Khana Tomb in Uzbekistan (1464 CE).
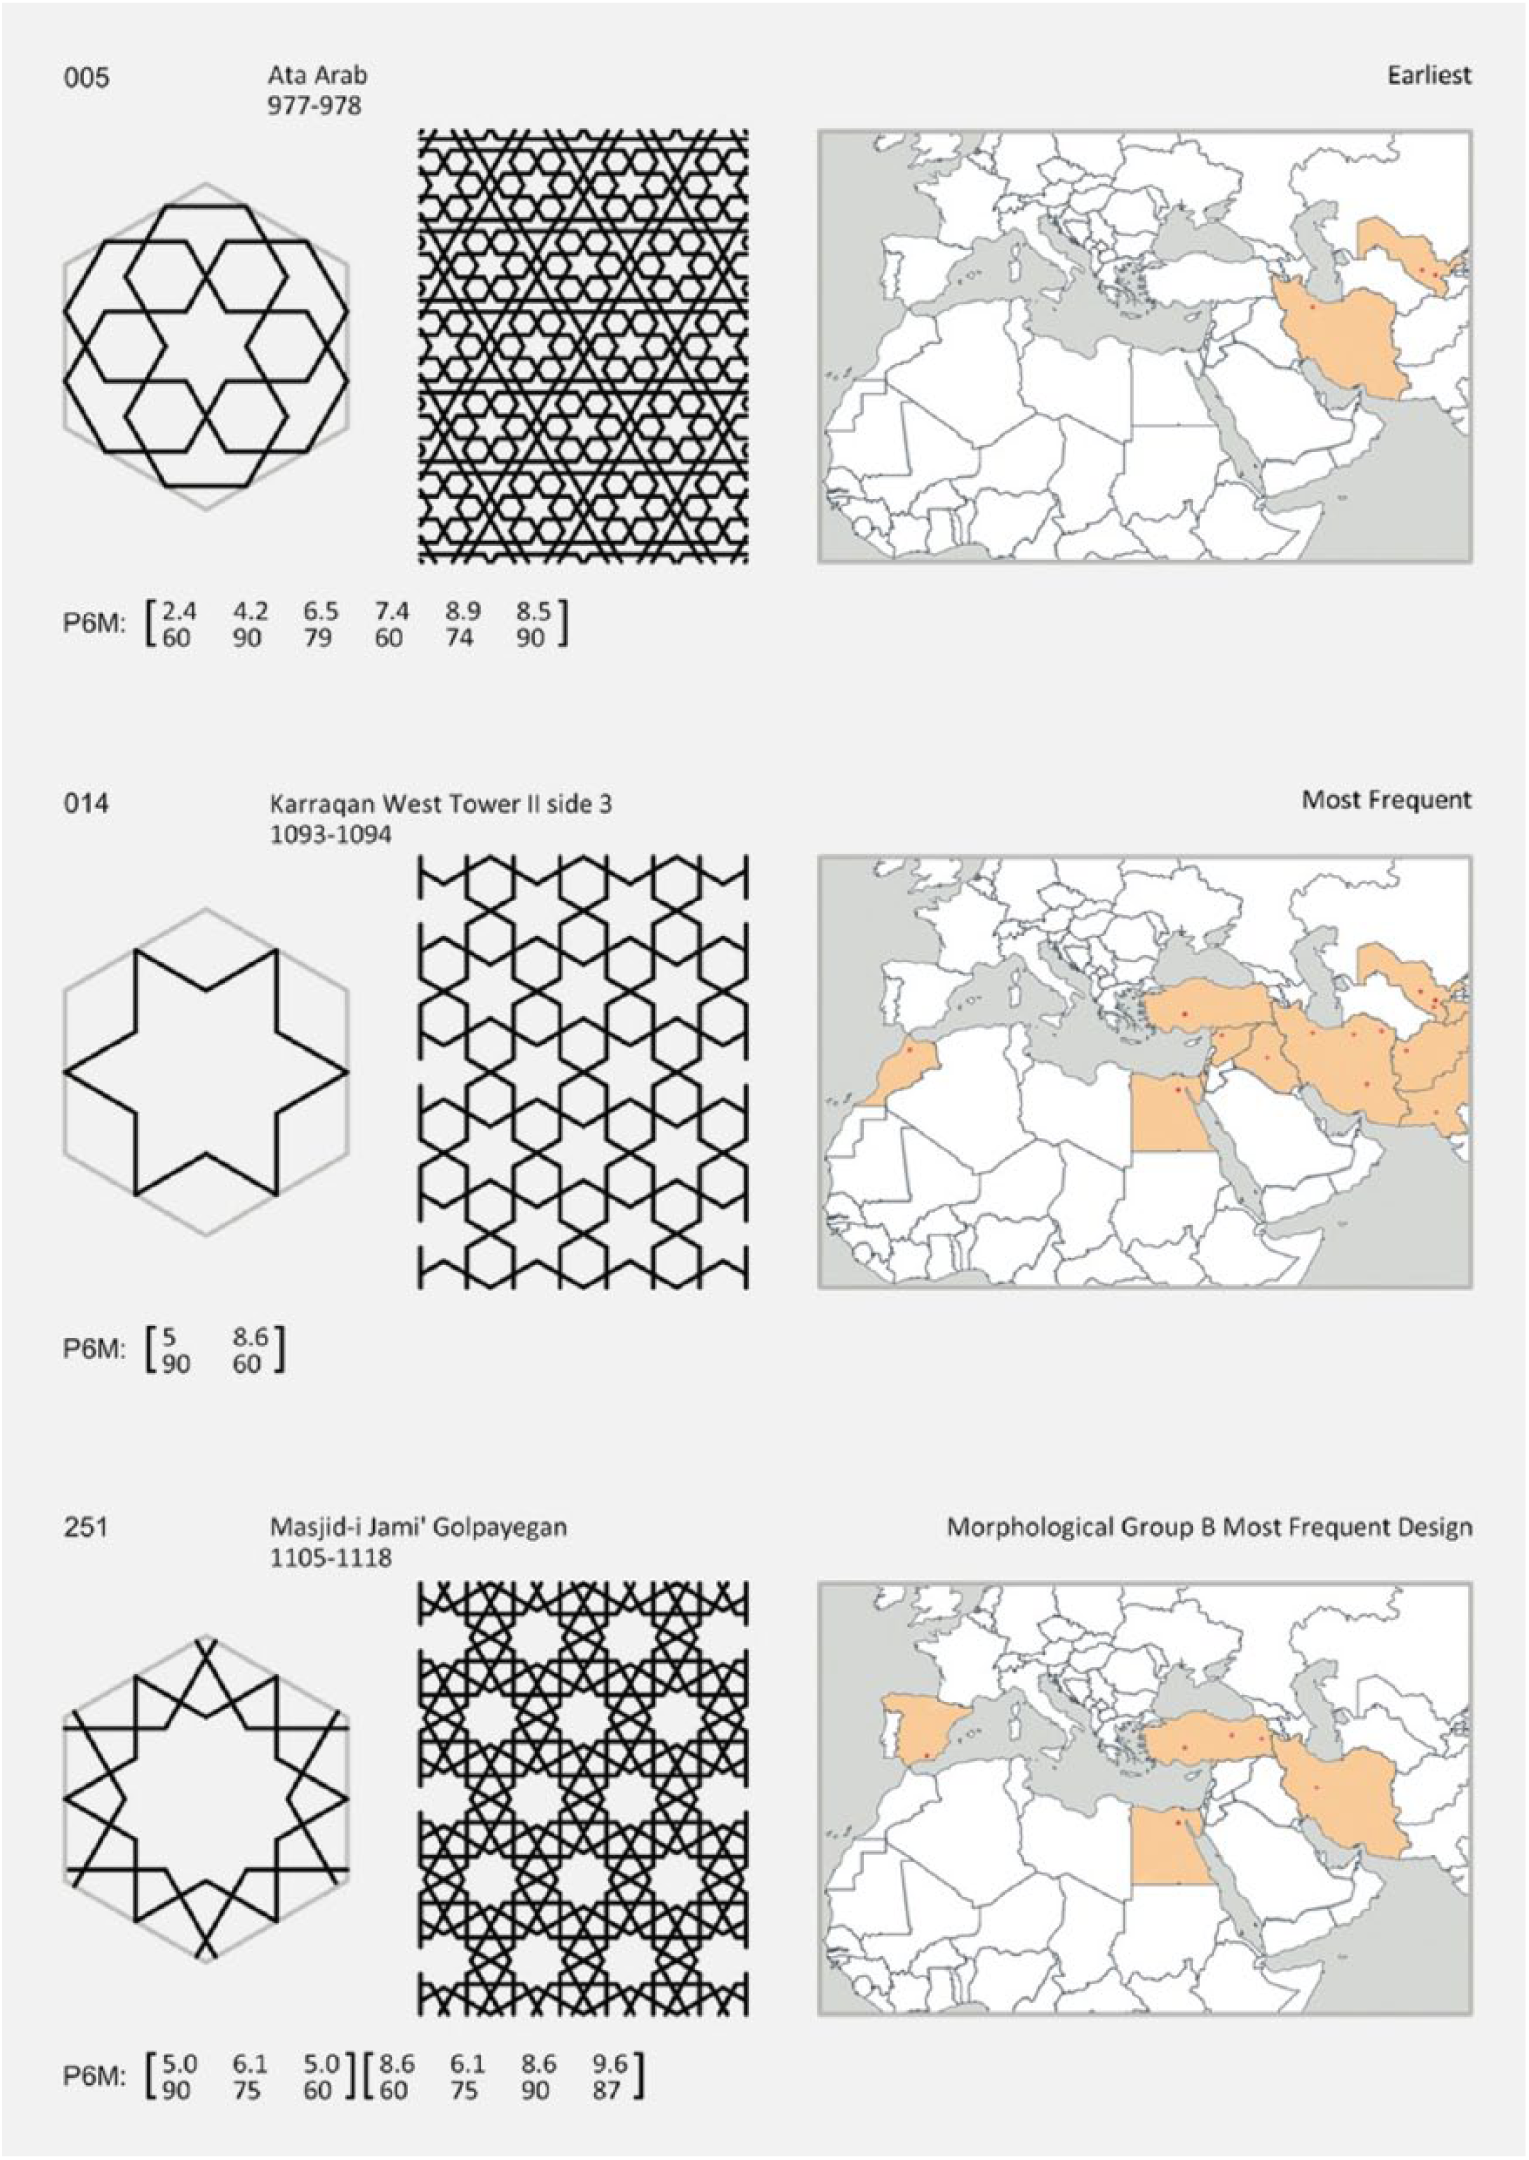
The top shows the earliest copied design, the middle the most frequently copied design, and the bottom the most frequently copied design in B1 group.
The most frequently copied design, however, is the star design, which originally existed in the West Karraqan Tower (1093 CE) and was then replicated in 23 locations between the 12th and 17th centuries in various regions (Figure 8, middle). The most frequent design in B1 group is a design that first existed at Masjid-i Jami’ Golpayegan in Iran (1105 CE) and was later found in 11 other locations between the 12th and 15th centuries (Figure 8, bottom).
Structural equivalency
In this category, the search for morphological correlations departs from the identification of identical forms to the search for matches in the internal arrangements of the constructional components of the compared historical designs.
The matching process is implemented in four levels. The levels are ordinal in nature and span Deleuzian’s actual–virtual extremes. In each level, the search is constrained by specific conditions that make connections to the actualized dimension; in each following level, fewer connections to the actualized dimensions were considered, moving gradually toward the virtual dimension (Table 1 shows the considered variables in each level). The levels are discussed in the following.
Level 1
The representational code of the historic designs is examined to compare the value and sequence of the angle parameter while discarding the actualized values of distances (shown in light gray in the below description model)

Of the 138 unique designs, 23.19% fall into this level because they share the values and sequence of angles in their representational codes with at least one other design and were identified as structurally equivalent (LV1). The most frequent structure in level 1 is the following

The above structure exists in six different arrangements (Figure 9). The earliest existing design within this structure dates to the 9th century and was discovered by Ernest Hartsfield during the Samara excavations. However, if being extra cautious and considering only designs that are purely geometric (the Samara design contains floral designs), the earliest frequent structure can be dated to the Karraqan East Tower (1067 CE).
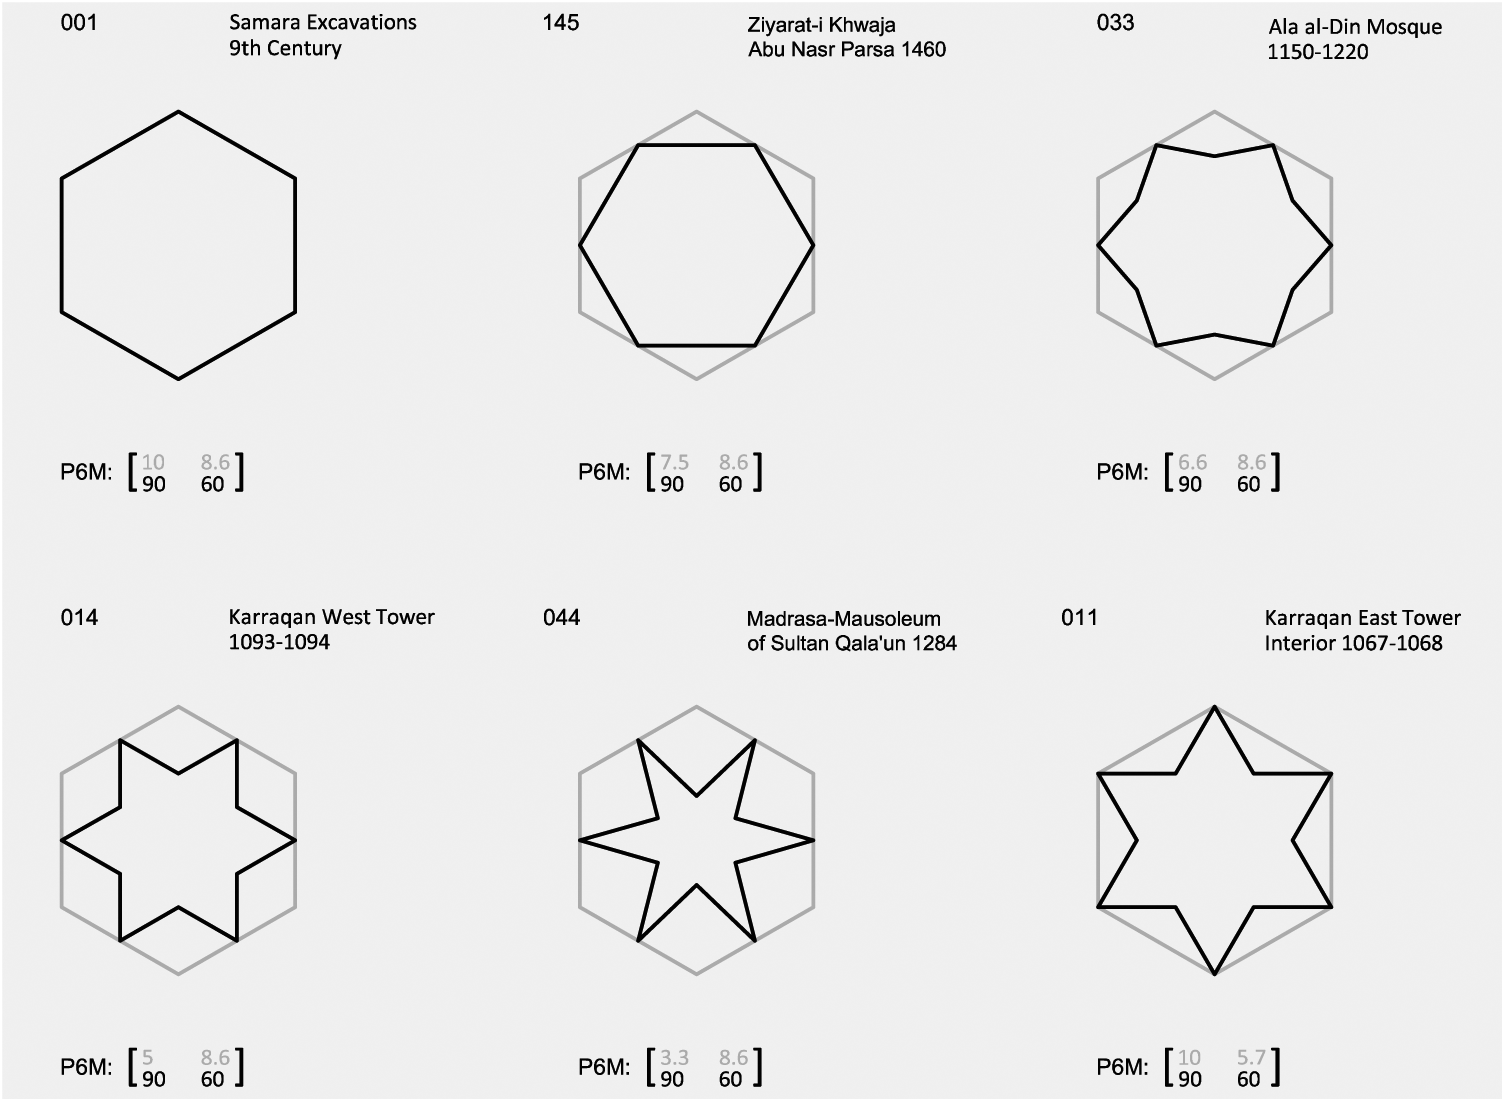
The most frequent structures in LV1 structural equivalency.
The algorithm used in the search within this level is more conservative in preserving the flow characteristics, as it requires an entire value and sequence match of all angles. However, it is also possible to examine the representational code of the historic designs to compare the value and sequence of only angles that lay at the internal boundaries of the FU—as only these points determine the general flow layout of the designs—while discarding the actualized values of all distances and the values of angles of the constructional points that do not lay at the internal boundaries of the FU (Figure 10).

The internal boundaries of the FU and the control of the points that lay on these boundaries. The dark black variable in the representational code represents the considered variable in the comparison.
In doing so, this level identifies designs that share a flow in a more flexible manner, regardless of the actualized measurements of the distances of the constructional points. Therefore, the recording unit in this category is the value and sequence match of 30°, 60°, 90°, and 120° angles in the representational codes of the compared designs. It is important to highlight that in this level, the sequence of the discarded angles is still considered. For example, the sequence of 90°, 43°, 60°, and 90° angles matches the sequence of 90°, 73°, 60°, and 90° angles, but does not match the sequence of 90°, 60°, and 90° angles.
The results of the new algorithm indicate that 44.20% of the 138 unique designs have at least a structural equivalence with one or more designs (Figure 11). The most frequent structure is the following

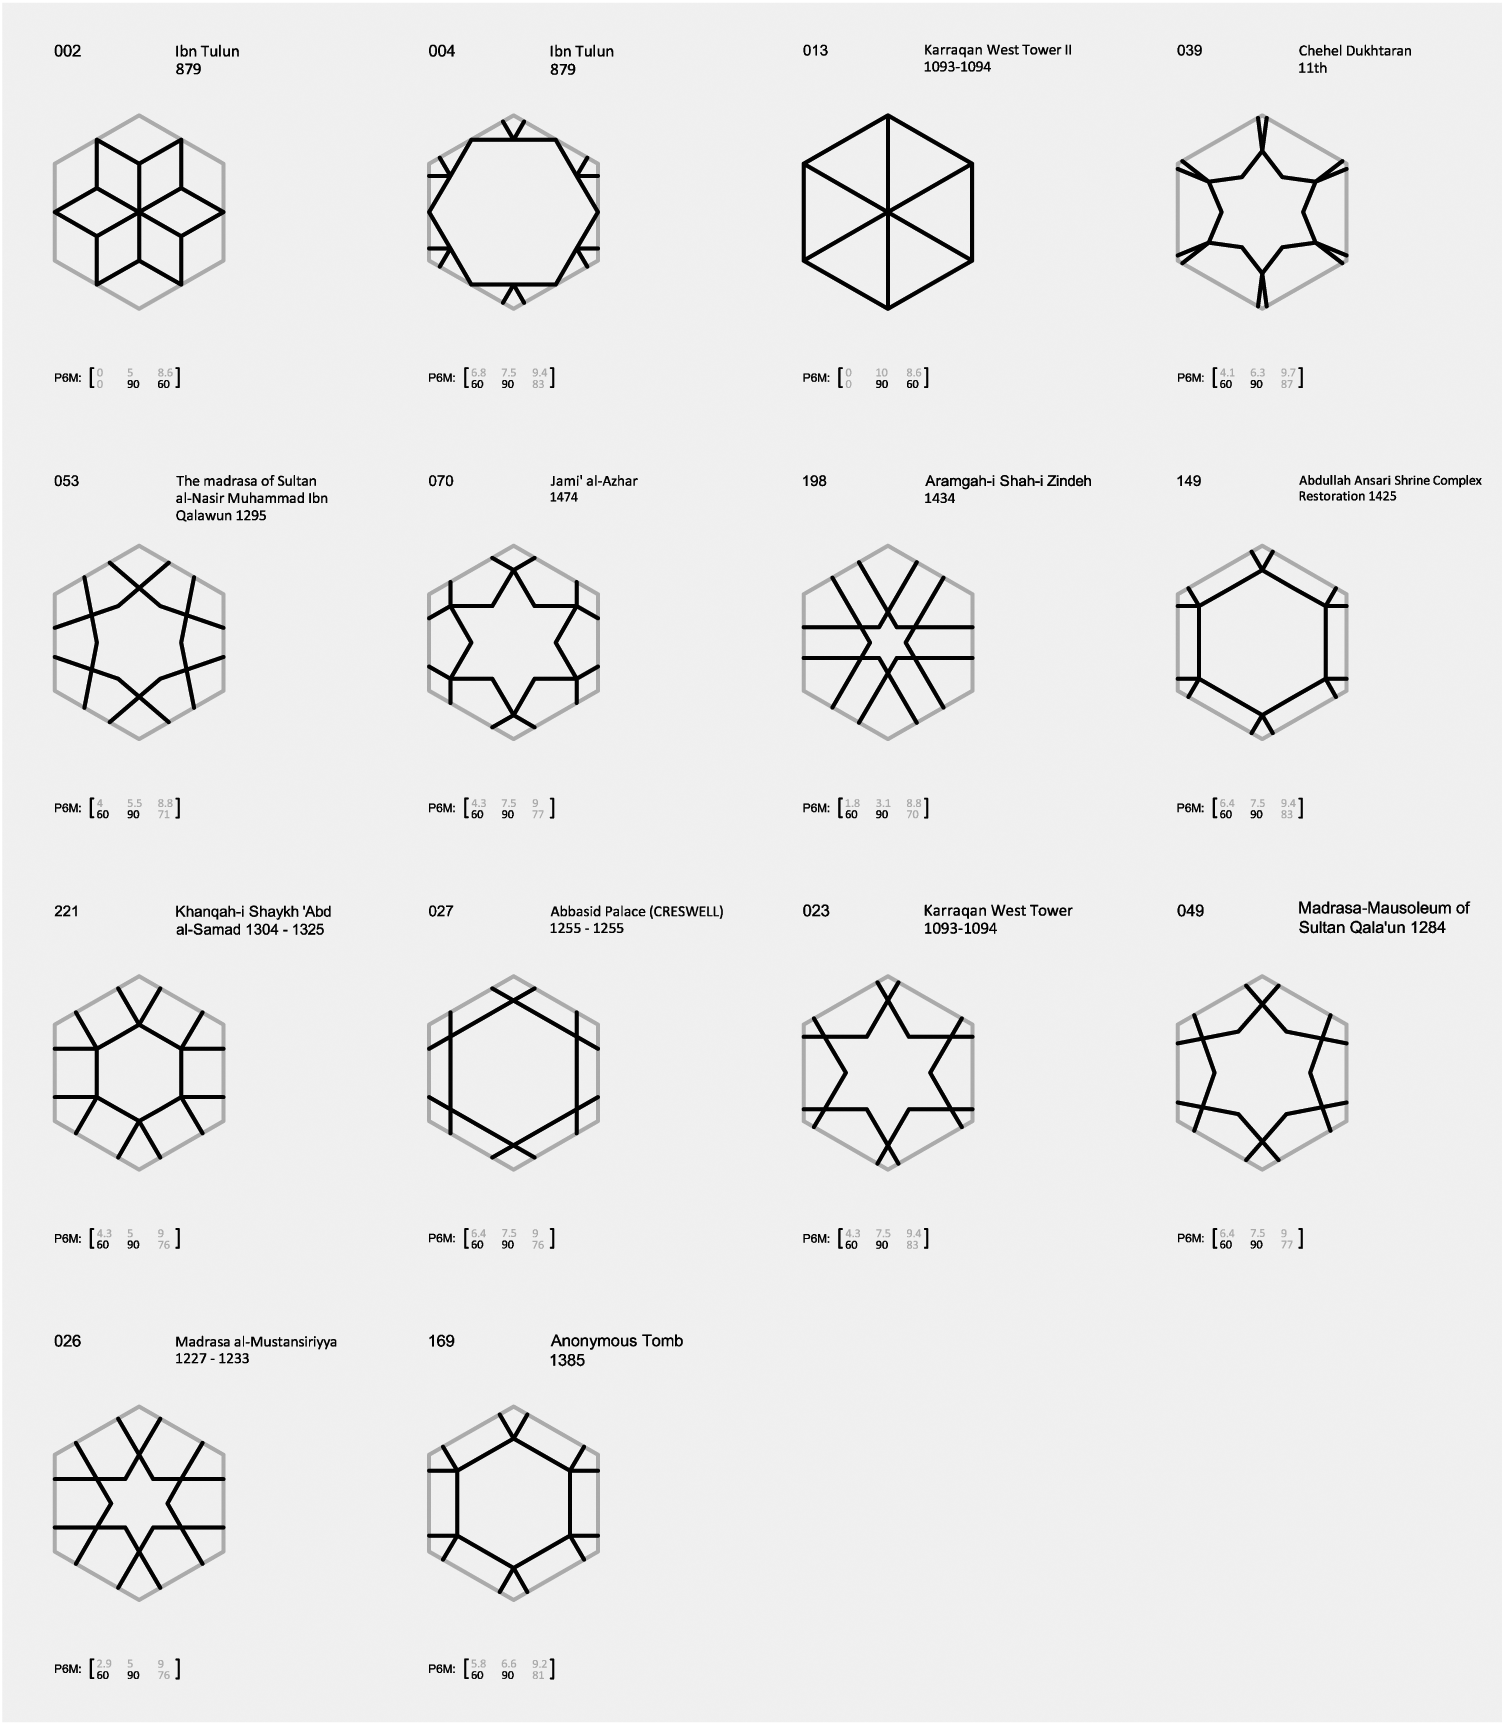
The most frequent structure in LV1 structural equivalency when identifying the flow based on points that lay on the internal boundaries of the FU.
Level 2
In this level, the representational code of the historic designs is compared by searching for similar sequences of constructional points while discarding the values of distances and angles (shown in light gray in the description model below)
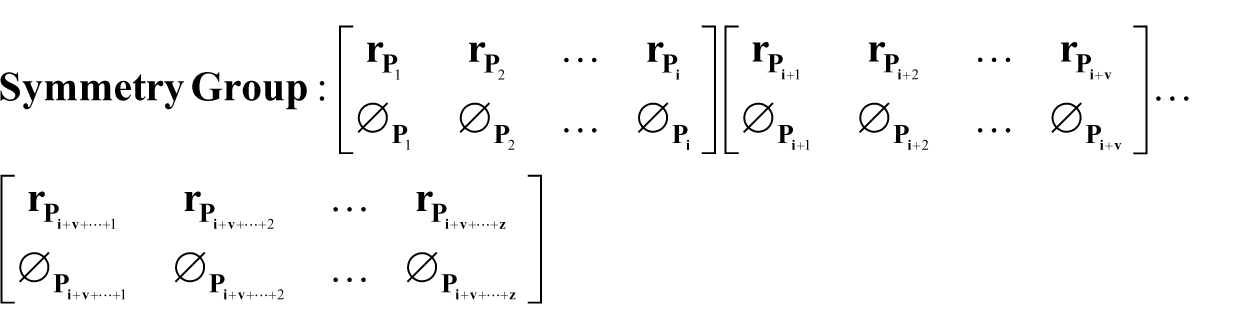
In doing so, this level identifies designs that share the same number of segments and specific morphological groups (SMGs), regardless of the actualized measurements or the flow of the polyline (Figure 12). Therefore, the recording unit is the match of the sequence of constructional points in polylines between the compared codes.
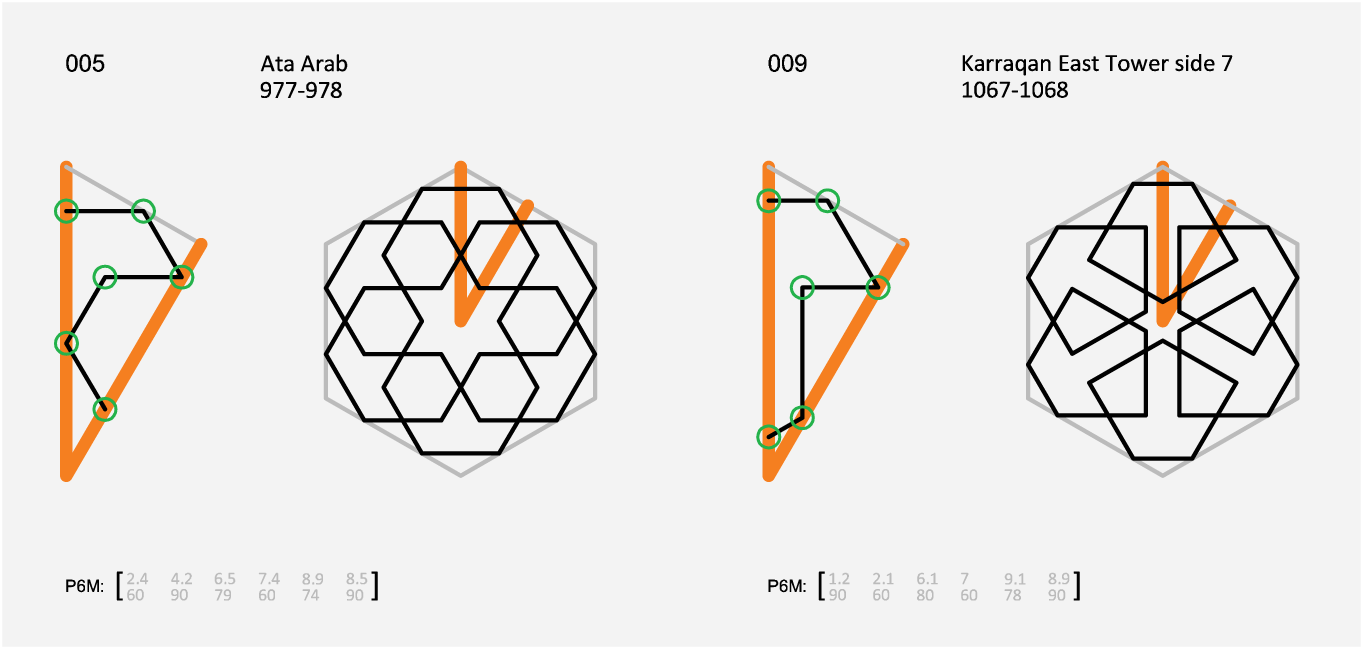
Different polyline flows with similar segment counts (five segments each) and similar specific morphological case (A0).
Of the 138 designs, 76.09% share the same structure with at least one other design. The following structure code represents the most frequent structure (identified design variations are shown in Figure 13)
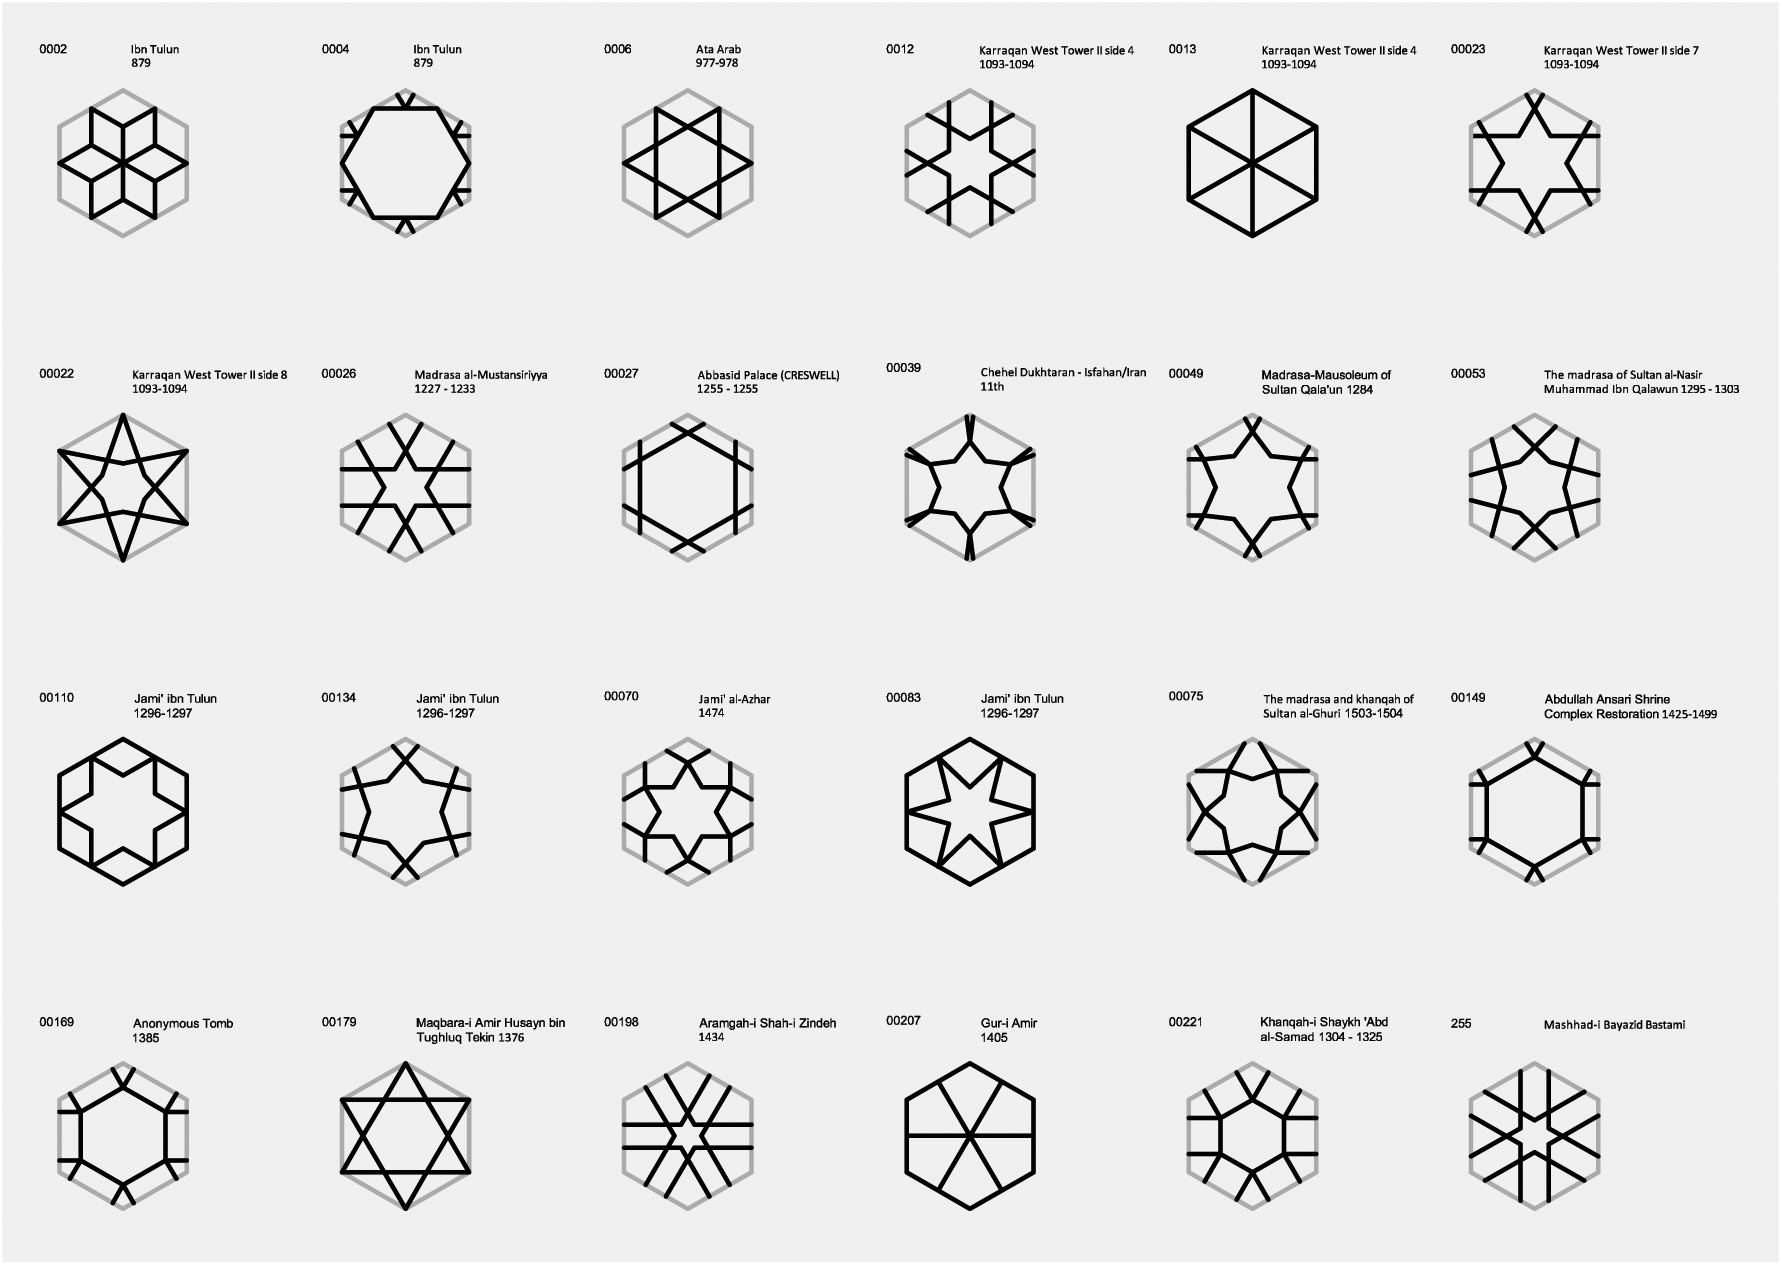
The most frequent structures in LV2 structural equivalency. Designs that are structurally equivalent of LV1 and LV2 looks more similar to each other as a correlation exists in a level closer to the actual dimension, that is, LV1.

Level 3
In this level, the representational code of the historic designs is compared by searching for designs that share the same number of polylines and the counts of the T/QP regardless of the segment count, flow of polylines, or the actualized measurements of the polylines within the FU. Therefore, the recording unit is the match of the SMGs.
Of the 138 designs, 86.96% share the level of their structures with at least one other design. The most frequent structure is designs composed form a single polyline with no T/QP (Figure 14).
Example of LV3 structural equivalency.
Level 4
The representational code of the historic designs is compared by searching for similar polyline counts while discarding the existence of T/QP, segment counts, and the values and sequences of the actualized distances and angles of all the constructional points (Figure 15)

Example of LV4 structural equivalency. Simple design versus complex designs in terms of segment count and specific morphological case. All designs are considered equal in terms of LV4 as they are composed from a single polyline.
Of the 138 unique designs, 94.20% share level 4 structures with at least one other design. The most frequent structure is the single sequence of points (single polyline).
The morphological correlations
The results from the previous section show that similarities between the hexagon-based designs become more frequent as the virtual dimension is approached. Figure 16 shows the identical category and the four levels of structural equivalency categories arranged in an ordinal fashion starting from the actual dimension, which is represented by the frequency of identical designs, followed by the closest level of structural equivalency category to the actual dimension, moving toward the virtual dimension (right of the figure).

Line graph shows the frequency of identical and the four levels of structural equivalency categories.
Figure 15 shows how a simple design (in terms of segment count and type of connection points) can be structurally equivalent to another more complex design. To identify such morphological correlations in a holistic manner, connections between the content categories and design segment must be established. Figure 17 shows the flowchart for each of the five symmetry groups, with the morphological groups on the x-axis. The morphological groups further subdivided based on the number of T/QP within the FU into SMG. The y-axis shows the segment count. Each circle in the figure represents a single or group of actualized designs (further explained in the subsequent enlarged views).
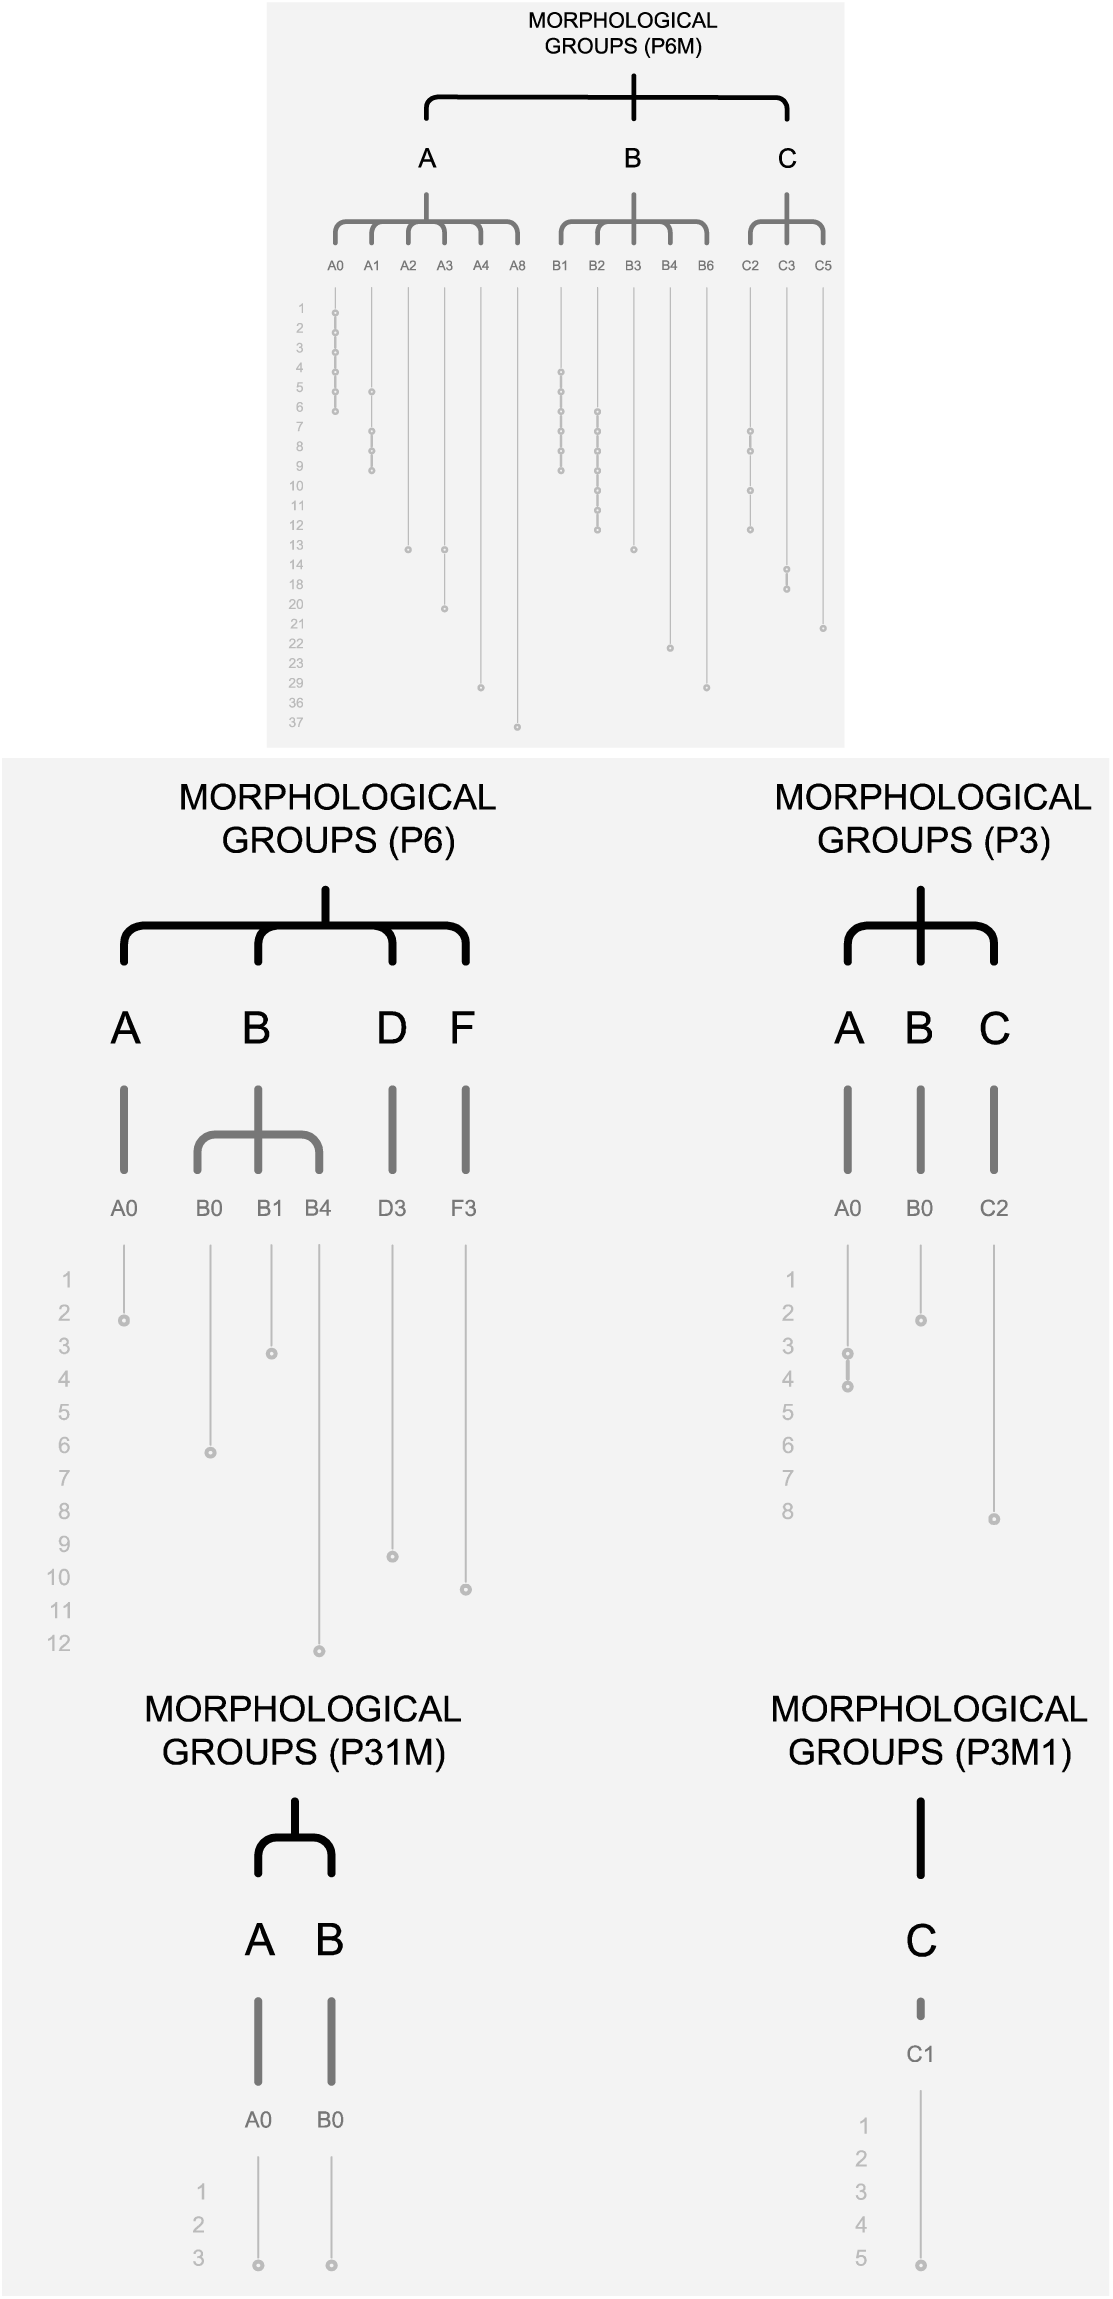
Morphological groups that exist within each symmetry type. Each morphological group is broken down by its specific morphological groups on the x-axis, and the segment count on the y-axis.
This figure shows the existence of a minimum of single polyline (Morphological Group A) in symmetry groups P6M, P6, P3, and P31M and the existence of a maximum of six polylines (Morphological Group F) in symmetry group of P6 only. In addition, the figure shows the existence of a single segment design as well as a design with a maximum of 37 segments (SMG A8).
Figure 18 shows an enlarged view of SMG B2 from the P6M symmetry group. This figure shows how the actualized designs relate to each other on multiple structural levels. For instance, if we look at designs that contain 11 segments, we can see four designs, as each two designs are structurally equivalent at level 1, as indicated by the underlined labeled LV1, since the designs share the same flow of polylines, the same number of segments, and the same SMGs. However, the four designs within 11 segments are structurally equivalent at level 2 as these designs share the same number of segments and the same SMGs. These designs (i.e. all those containing 11 segments) share the same SMG with the entire branch shown in the figure. All the branches include designs with two polylines (indicated in the figure by different colors for each polyline) and two T/QPs. However, when comparing this branch to another branch within the B morphological group, the two branches have designs with two polylines but differ in the number of T/QP. Figure 18 explains this using morphological group C as an example.
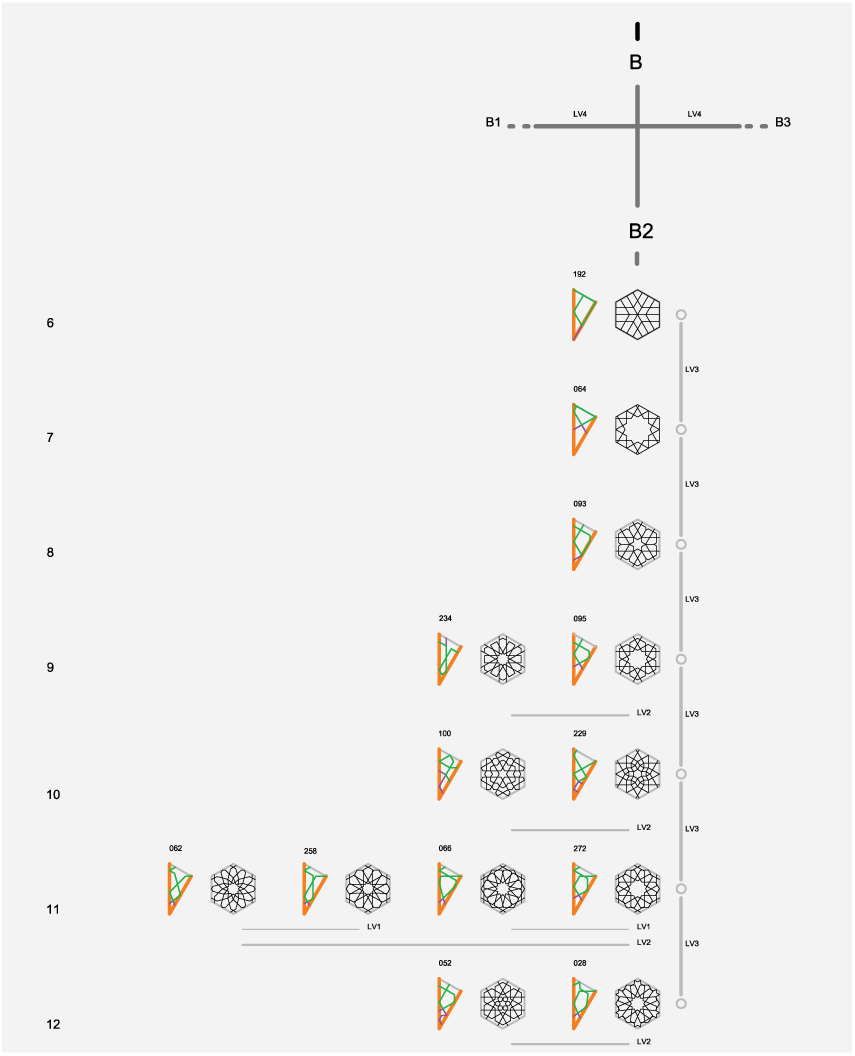
Enlarged view of the specific morphological case B2 within the P6M symmetry group.
Figure 19 shows how designs that fall within the same morphological group can be related to each other. For instance, the figure explains how designs that fall within SMG C5 correlate to designs that fall within SMG C3, that is, both designs contain three polylines (structurally equivalent at level 4).
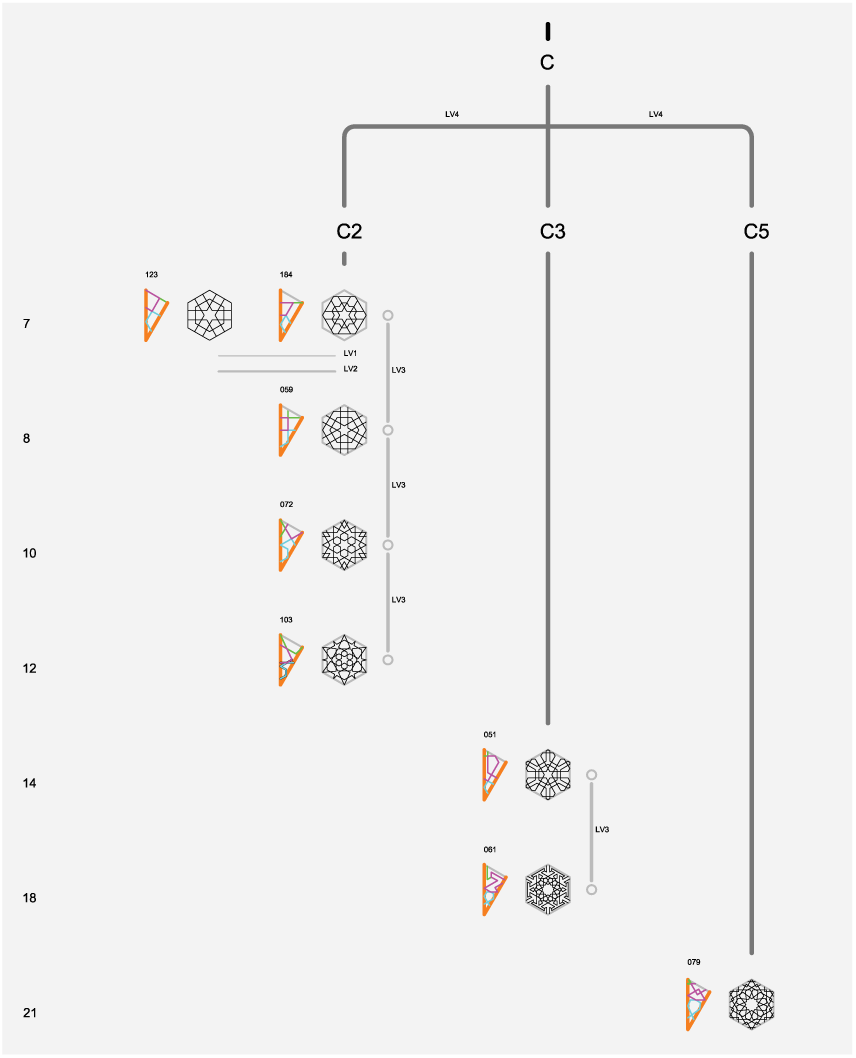
Enlarged view from the morphological group C within the P6M symmetry group. Three polylines are indicated in different colors.
Toward morphological understanding of hexagonal-based IGPs
The morphological groups are used as a categorization system for patterns that incorporate designs that share basic “morphogenetic” characteristics. Five morphological groups were established: morphological group A, morphological group B, morphological group C, morphological group D, and morphological group F. This system, because it considers both the actual and the virtual dimensions, represents not only what exists but also what could exist. As this grouping system is parametrically expandable and capable to accommodate designs that go beyond the identified historic ones. For instance, if a design contains more than six polylines, or more that 37 segments, such a design will still fit within the same flowchart, and morphological correlations with historical designs can be established.
Moreover, this system of categorization does not contradict with previous systems developed by other scientific studies of IGP such as Abas and Salman’s symmetry classification, nor is it intended to replace those systems. In contrast, this system further considers the details of each symmetry group to further relate or differentiate the designs within each symmetry group based on the internal relationships of the design components.
Footnotes
Declaration of conflicting interests
The author(s) declared no potential conflicts of interest with respect to the research, authorship, and/or publication of this article.
Funding
The author(s) disclosed receipt of the following financial support for the research, authorship, and/or publication of this article: the researcher received financial support from the Higher committee of education development in Iraq (HCED). This research received the Graduate Student Research Program fund from the college of Architecture, Art, and Humanities at Clemson University that supported the data collection process.