



Abstract
Background:
Rebound hyperglycemia (RHyper), rebound hypoglycemia (RHypo), extended hyperglycemia (EHyper), and extended hypoglycemia (EHypo) are newly defined continuous glucose monitoring (CGM) metrics. Here, we investigated the characteristics of these new metrics and the relationship between new CGM metrics and standard metrics.
Materials and Methods:
In this retrospective cohort study, 30,000 CGM users with at least 90 days of CGM data were randomly selected from Dexcom Clarity database. Standard and new CGM metrics were calculated for each user. Four different cutoffs were used to define RHyper and RHypo, and two cutoffs were used to define EHyper and EHypo events. The number of RHyper, RHypo, EHyper, and EHypo events per week, mean duration of events, and mean area under the curve of events were calculated. For rebound events, the rate of change (ROC) was calculated. Pearson correlation and simple linear regression were used to analyze the data.
Results:
Mean time in 70–180 mg/dL was 61.8 ± 20.7%, mean glucose was 173 ± 37.1 mg/dL, and coefficient of variation (CV) was 32.1 ± 7.2%. RHyper, RHypo, and EHyper were more frequent during daytime and increased throughout the day. EHypo mostly occurred during nighttime. CV correlated strongly with RHyper (70–180 mg/dL) events/week (r = 0.67) and RHypo (180 to 70 mg/dL) events/week (r = 0.64). Time in range had the strongest correlation with EHyper events/week (r = −0.88) among new metrics. RHyper events and RHypo events were strongly correlated with each other (r = 0.92). RHyper and RHypo ROC have a stronger correlation with CV than the correlation between CV and time below range (TBR) metrics.
Conclusions:
For rebound and extended metrics, the most important metric was the number of events/week. RHyper and RHypo had a stronger correlation with CV and hypoglycemia metrics (TBR) than the correlation between CV and TBR. Thus, rebound events have the potential to detect hypoglycemia events caused by glycemic variability.
This is a visual representation of the abstract.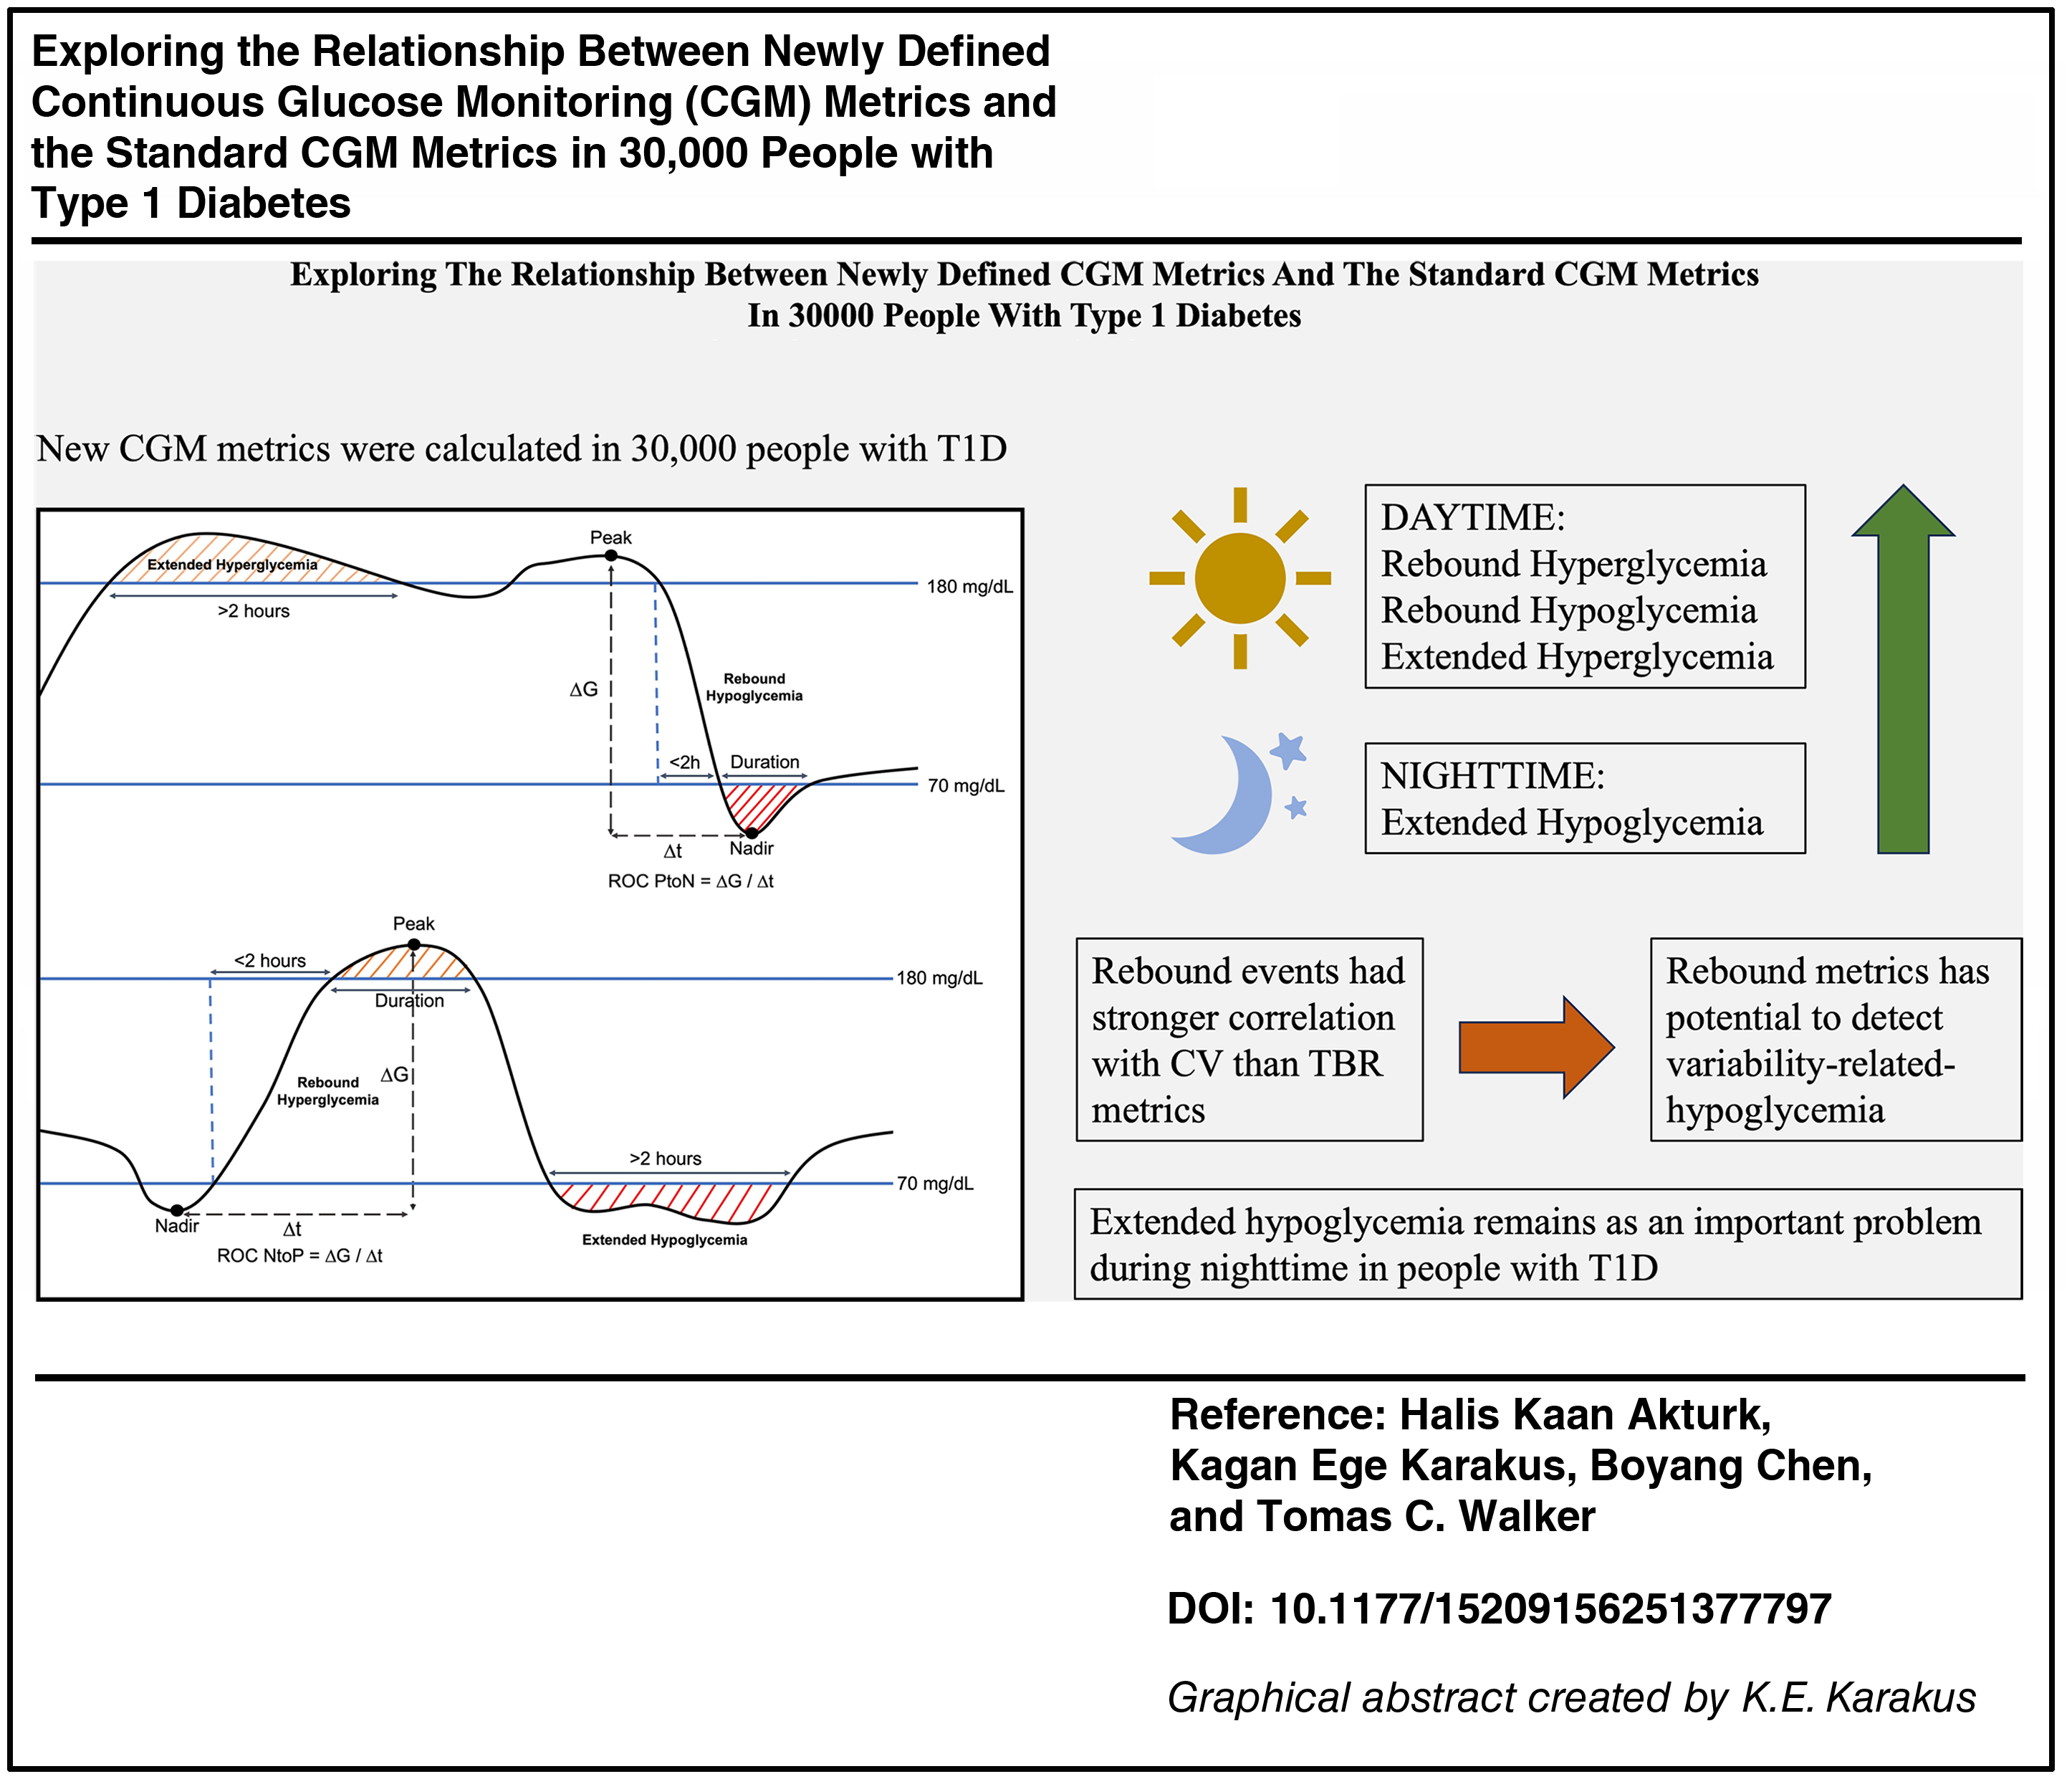
Keywords
Introduction
Continuous glucose monitoring (CGM) has been the standard of care among people with diabetes requiring insulin. 1 The International CGM Consensus defined and established targets for the commonly used CGM metrics for clinical care.2,3 In addition to these metrics, Dexcom Clarity can report unique CGM metrics such as rebound hyperglycemia (RHyper), rebound hypoglycemia (RHypo), extended hyperglycemia (EHyper), and extended hypoglycemia (EHypo). In 2023, the International CGM Consensus suggested using EHyper and EHypo as secondary endpoints in clinical trials. 4 However, the importance of these new metrics is yet to be determined. We explored the relationship between the newly defined CGM metrics (RHyper, RHypo, EHyper, and EHypo) and the standard CGM metrics.
Methods
In this retrospective cohort study, Dexcom G6 and Dexcom G7 users with type 1 diabetes (T1D) (diabetes type was self-reported) were recruited from Dexcom Clarity US database if they consented their data to be used for research purposes. CGM users with at least 90 days of available data between 01/01/2023 and 09/01/2024 were included if they had CGM data for >70% of the days. For this analysis, 30,000 users were selected randomly who met the inclusion criteria.
Mean glucose, glucose management indicator (GMI), percent time spent in 70–180 mg/dL (time in range [TIR]), percent time spent in 70–140 mg/dL (TITR), time below 70 mg/dL (time below range [TBR]), time below 54 mg/dL (TBR2), time above 180 mg/dL (time above range [TAR]), time above 250 mg/dL (TAR2), and coefficient of variation (CV) were calculated.
RHyper (Dexcom Clarity defines as rebound highs) event is defined as any series of sensor glucose values (SGVs) >180 mg/dL lasting 15 min or more (>3 consecutive SGV) preceded by any series of one or more SGVs <70 mg/dL, with the condition that the first SGV in the hyperglycemic series occurred within 2 h of the last value in the hypoglycemic series. To explore rebound metrics further, we calculated RHyper events according to 55–180, 55–250, 70–180, and 70–250 mg/dL cutoffs. Similarly, RHypo (Dexcom Clarity defines as rebound lows) is defined as any series of SGVs <70 mg/dL lasting 15 min or more preceded by any series of one or more SGVs >180 mg/dL, with the condition that the first SGV in the hypoglycemic series occurred within 2 h of the last value in the hyperglycemic series. We calculated RHypo events according to 180 to 55, 180 to 70, 250 to 55, and 250 to 70 mg/dL cutoffs.
EHypo (a.k.a. Sustained Hypoglycemia, Dexcom Clarity defines as sustained lows) and EHyper (a.k.a. Sustained Hyperglycemia, Dexcom Clarity defines as sustained highs) are defined as any series of one or more SGVs <70 mg/dL and SGVs >250 mg/dL for 2 h or more, respectively. We computed EHypo with <55 mg/dL and <70 mg/dL cutoffs and EHyper with >180 mg/dL and >250 mg/dL cutoffs.
The number of RHyper, RHypo, EHyper, and EHypo events per week, mean duration of events, and mean area under the curve of events (AUC) were calculated. For RHyper events, the rate of change (ROC) was calculated in two different approaches: (1) from nadir point of hypoglycemia period to peak of the following hyperglycemia (ROC-NtoP), (2) from nadir of the hypoglycemia period to the first SGV above 180 mg/dL (ROC-NtoF). Similarly, for RHypo events, ROC was also computed from peak to nadir (ROC-PtoN) and from peak to the first SGV below 70 mg/dL (ROC-PtoF). Rebound and extended events and their metrics are illustrated in Figure 1.

Illustration of new CGM metrics (EHyper, EHypo, RHyper, RHypo, and ROC). EHyper, extended hyperglycemia; EHypo, extended hypoglycemia; RHyper, rebound hyperglycemia; RHypo, rebound hypoglycemia; ROC-PtoN, rate of change peak to nadir; ROC-NtoP, rate of change nadir to peak.
CGM metrics were computed for each patient-day and aggregated to calculate patient average metrics. Metrics were reported as mean ± standard deviation and median (interquartile range). Pearson correlation and simple linear regression were used to analyze the relationship between metrics, and SciPy 1.15.0 software was used for statistical analysis.
Results
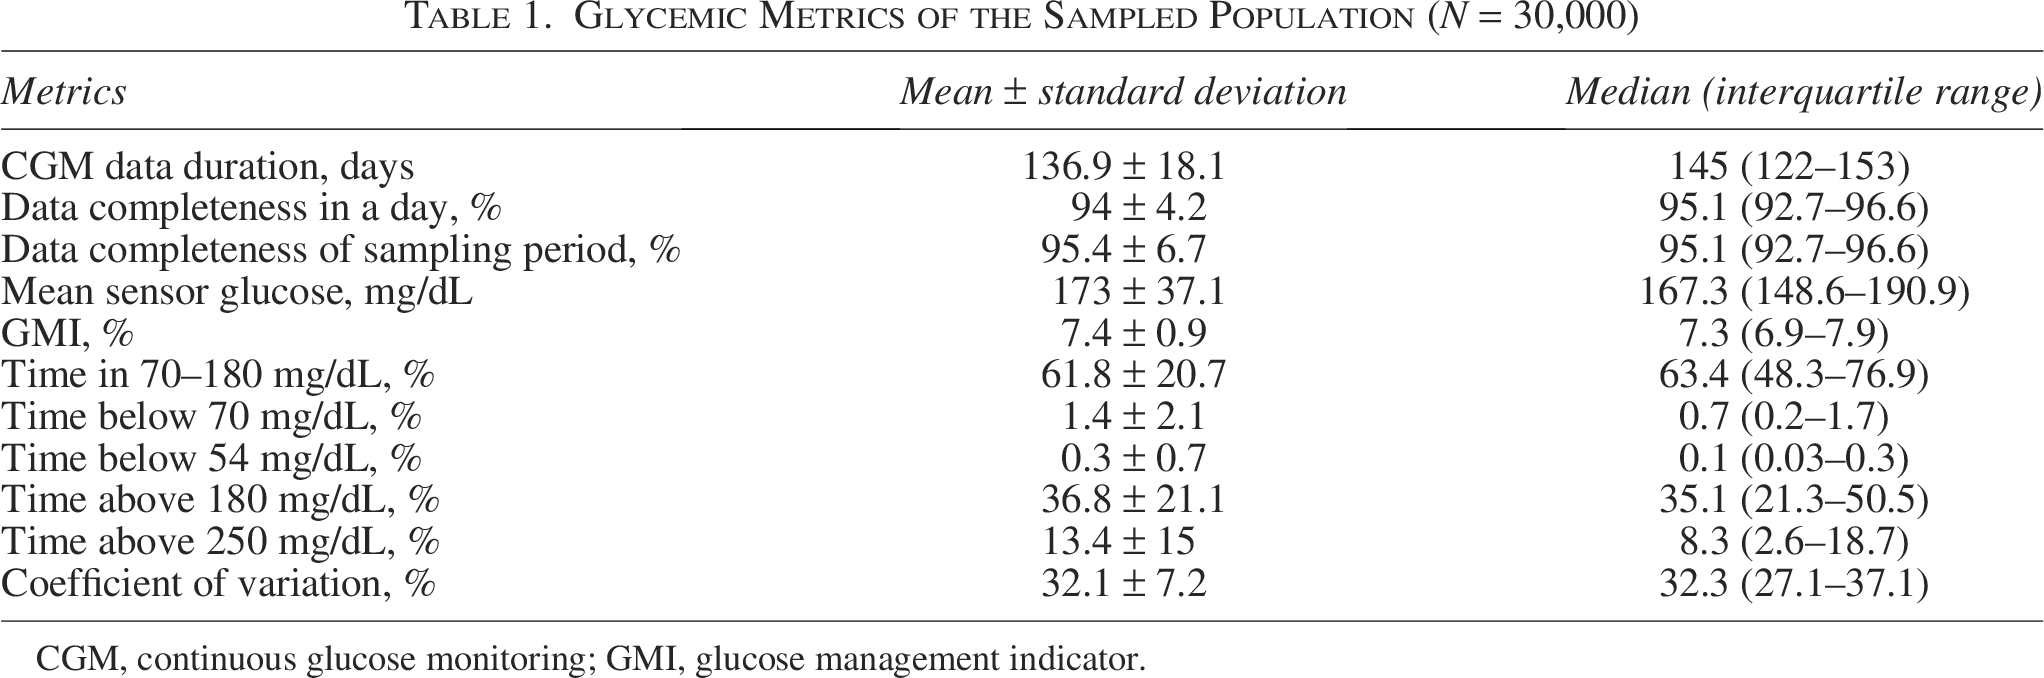
Of 30,000 randomly selected CGM users, 136.9 ± 18.1 days of CGM data with 95.4 ± 6.7% completeness was included in this analysis. Glycemic metrics of the cohort are shown in Table 1, with mean TIR of 61.8 ± 20.7%, mean glucose of 173 ± 37.1 mg/dL, CV of 32.1 ± 7.2%, and GMI of 7.4 ± 0.9%.
Glycemic Metrics of the Sampled Population (N = 30,000)
CGM, continuous glucose monitoring; GMI, glucose management indicator.
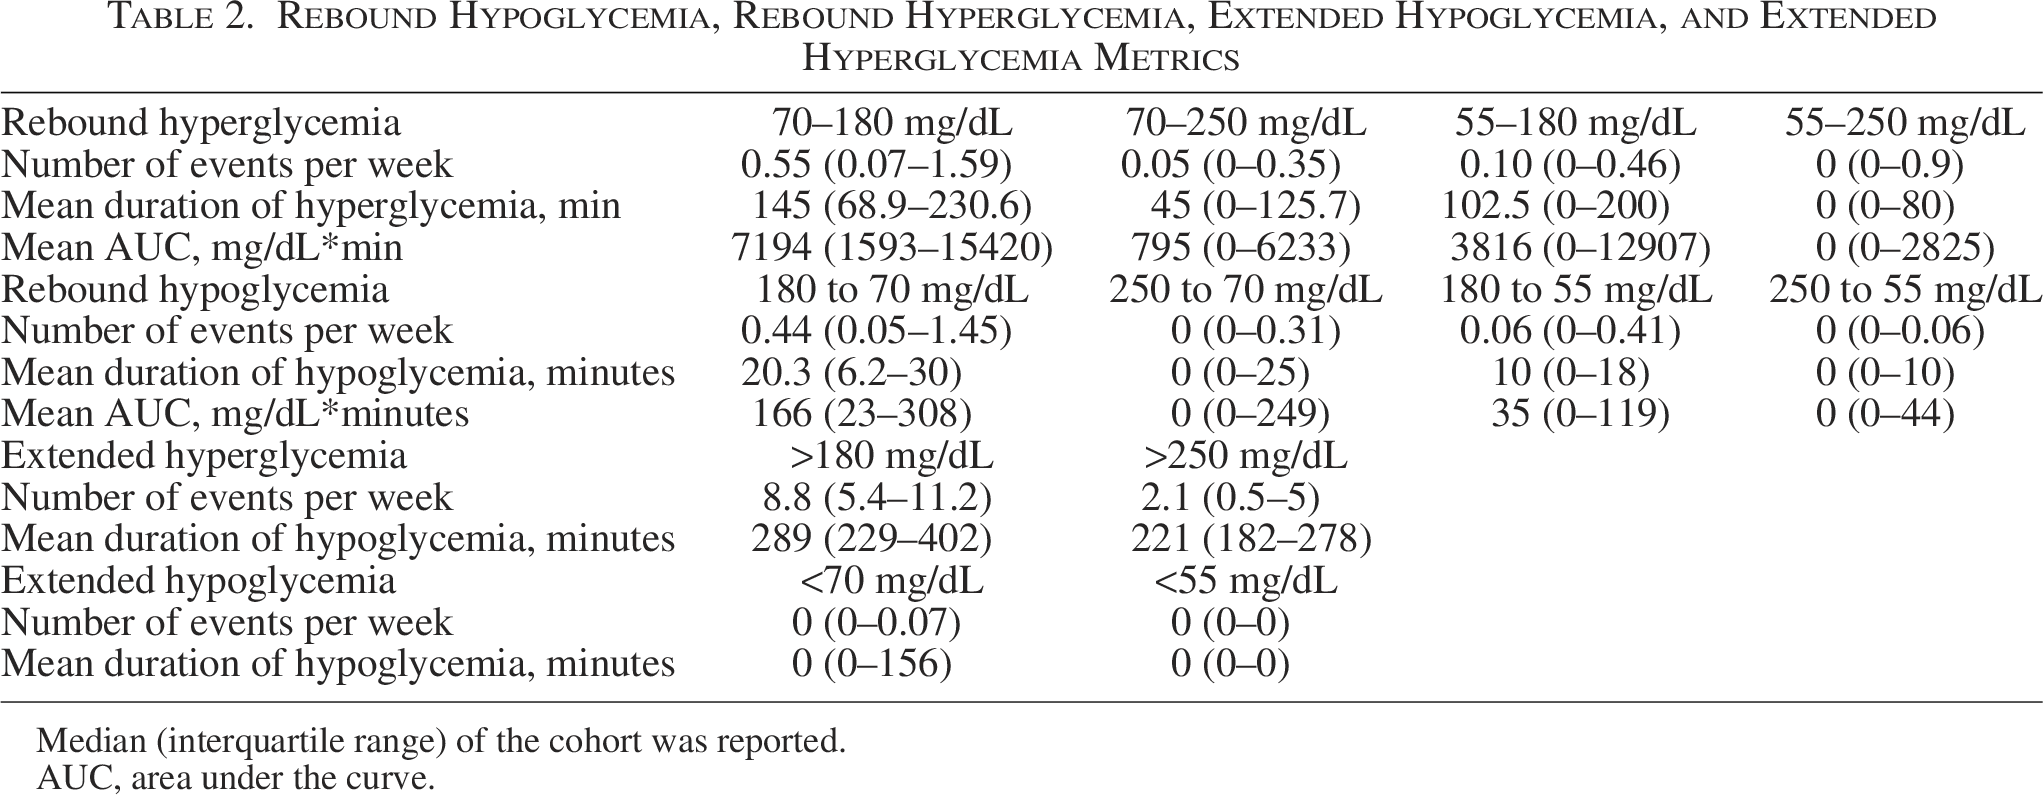
Rebound and extended events were computed with different cutoffs (Table 2). For RHyper, most events were observed when cutoffs were from 70 to 180 mg/dL with a median of 0.55 (0.07–1.59) events/week, whereas the least events occurred for cutoffs of 55–250 mg/dL with 0 (0–0.9) events/week. The mean duration of hyperglycemia was longer with 180 mg/dL upper cutoff, where it was 145 (68.9–230.6) min for 70–180 mg/dL, and 102.5 (0–200) min for 55–180 mg/dL. The mean duration was 45 (0–125.7) min for 70–250 mg/dL and 0 (0–80) min for 55–250 mg/dL cutoffs. A similar pattern was observed for the mean AUC of RHyper.
Rebound Hypoglycemia, Rebound Hyperglycemia, Extended Hypoglycemia, and Extended Hyperglycemia Metrics
Median (interquartile range) of the cohort was reported.
AUC, area under the curve.
For RHypo, more events were observed when the upper cutoff was 180 mg/dL. There were 0.44 (0.05–1.45) events/week for 180 to 70 mg/dL cutoffs, 0.06 (0–0.41) events/week for 180 to 55 mg/dL, 0 (0–0.31) events/week for 250 to 70 mg/dL, and 0 (0–0.06) events/week for 250 to 55 mg/dL. A similar pattern was observed for the mean AUC of RHypo events (Table 2).
There were 8.8 (5.4–11.2) EHyper events/week with a mean duration of 289 (229–402) min for 180 mg/dL cutoff. It was 2.1 (0.5–5) events/week with 221 (182–278) min of mean duration for 250 mg/dL cutoff. EHypo was the least prevalent event. There were 0 (0–0.07) events/week with 0 (0–156) min of mean duration for 70 mg/dL cutoff. Even the 75th percentile of the cohort did not have EHypo events for 55 mg/dL cutoff (Table 2).
Correlation between metrics
RHyper events/week correlated strongly with CV (r = 0.67 for 70–180 mg/dL, r = 0.61 for 70–250 mg/dL, r = 0.60 for 55–180 mg/dL) and TBR (r = 0.58 for 55–180 mg/dL, r = 0.53 for 70–180 mg/dL). RHyper mean duration correlated with TIR negatively (r = −0.40 for 70–250 mg/dL, r = −0.30 for 70–180 mg/dL, r = −0.29 for 55–180 mg/dL, and r = −0.29 for 55–250 mg/dL) and TAR2 positively (r = 0.47 for 70–250 mg/dL, r = 0.34 for 70–180 mg/dL, r = 0.32 for 55–180 mg/dL, and r = 0.34 for 55–250 mg/dL). RHyper AUC had similar correlations with these metrics (Supplementary Fig. S1).
RHypo events/week correlated strongly with CV (r = 0.64 for 180 to 70 mg/dL, r = 0.58 for 250 to 70 mg/dL, and r = 0.56 for 180 to 55 mg/dL) and TBR (r = 0.61 for 180 to 55 mg/dL, r = 0.56 for 180 to 70 mg/dL). RHypo duration and AUC metrics had similar correlations with these metrics, and all RHypo metrics weakly correlated with TIR, TAR, and TAR2 (Supplementary Fig. S2).
EHyper events/week had stronger correlation with TIR, TAR, and TAR2 with >250 mg/dL cutoff (>250 mg/dL cutoff: TIR r = −0.88, TAR r = 0.87, TAR2 r = 0.90; >180 mg/dL cutoff: TIR r = −0.69, TAR r = 0.69, TAR2 r = 0.42). EHyper mean duration had weaker correlations with all metrics compared with EHyper event/week (Supplementary Fig. S3).
EHypo event/week correlated strongly with TBR (EHypo <70 mg/dL r = 0.85; EHypo <55 mg/dL r = 0.66), and TBR2 (EHypo <70 mg/dL r = 0.90; EHypo <55 mg/dL r = 0.84). It had a weak correlation with TIR, TAR, and TAR2 (Supplementary Fig. S4).
Characteristics of selected metrics
Since there were more events with longer durations and similar or stronger correlations compared with other cutoffs, 70–180 mg/dL cutoffs were selected for RHyper and 180 to 70 mg/dL cutoffs for RHypo in the subsequent analysis. Mean AUC had similar correlation performance compared with mean duration; thus, we proceeded with mean duration of rebound metrics. Consensus cutoffs of 70 mg/dL for EHypo and 250 mg/dL for EHyper performed better than other cutoffs and were used as consensus cutoffs in the further analysis.
Among the cohort, 80.7% had at least one RHyper (70–180 mg/dL), and 77.5% had at least one RHypo (180 to 70 mg/dL) event, whereas 90.2% had at least one EHyper and only 38.4% had at least one EHypo event. The number of events per week is shown in Supplementary Figure S5.
Among rebound and extended metrics, TIR had the strongest correlation (negative) with EHyper events/week (r = −0.88). TBR correlated similarly with RHypo events/week (r = 0.56) and with RHyper events/week (r = 0.53; Fig. 2). CV had the strongest correlation with RHyper events/week (r = 0.67) and RHypo events/week (r = 0.64), notably stronger than CV-TBR (r = 0.48) and CV-TBR2 (r = 0.42; Fig. 2). RHypo events/week and RHyper events/week correlated strongly (r = 0.92), and simple linear regression models showed similar distributions between CV-RHyper events/week and CV-RHypo events/week (Supplementary Fig. S6).
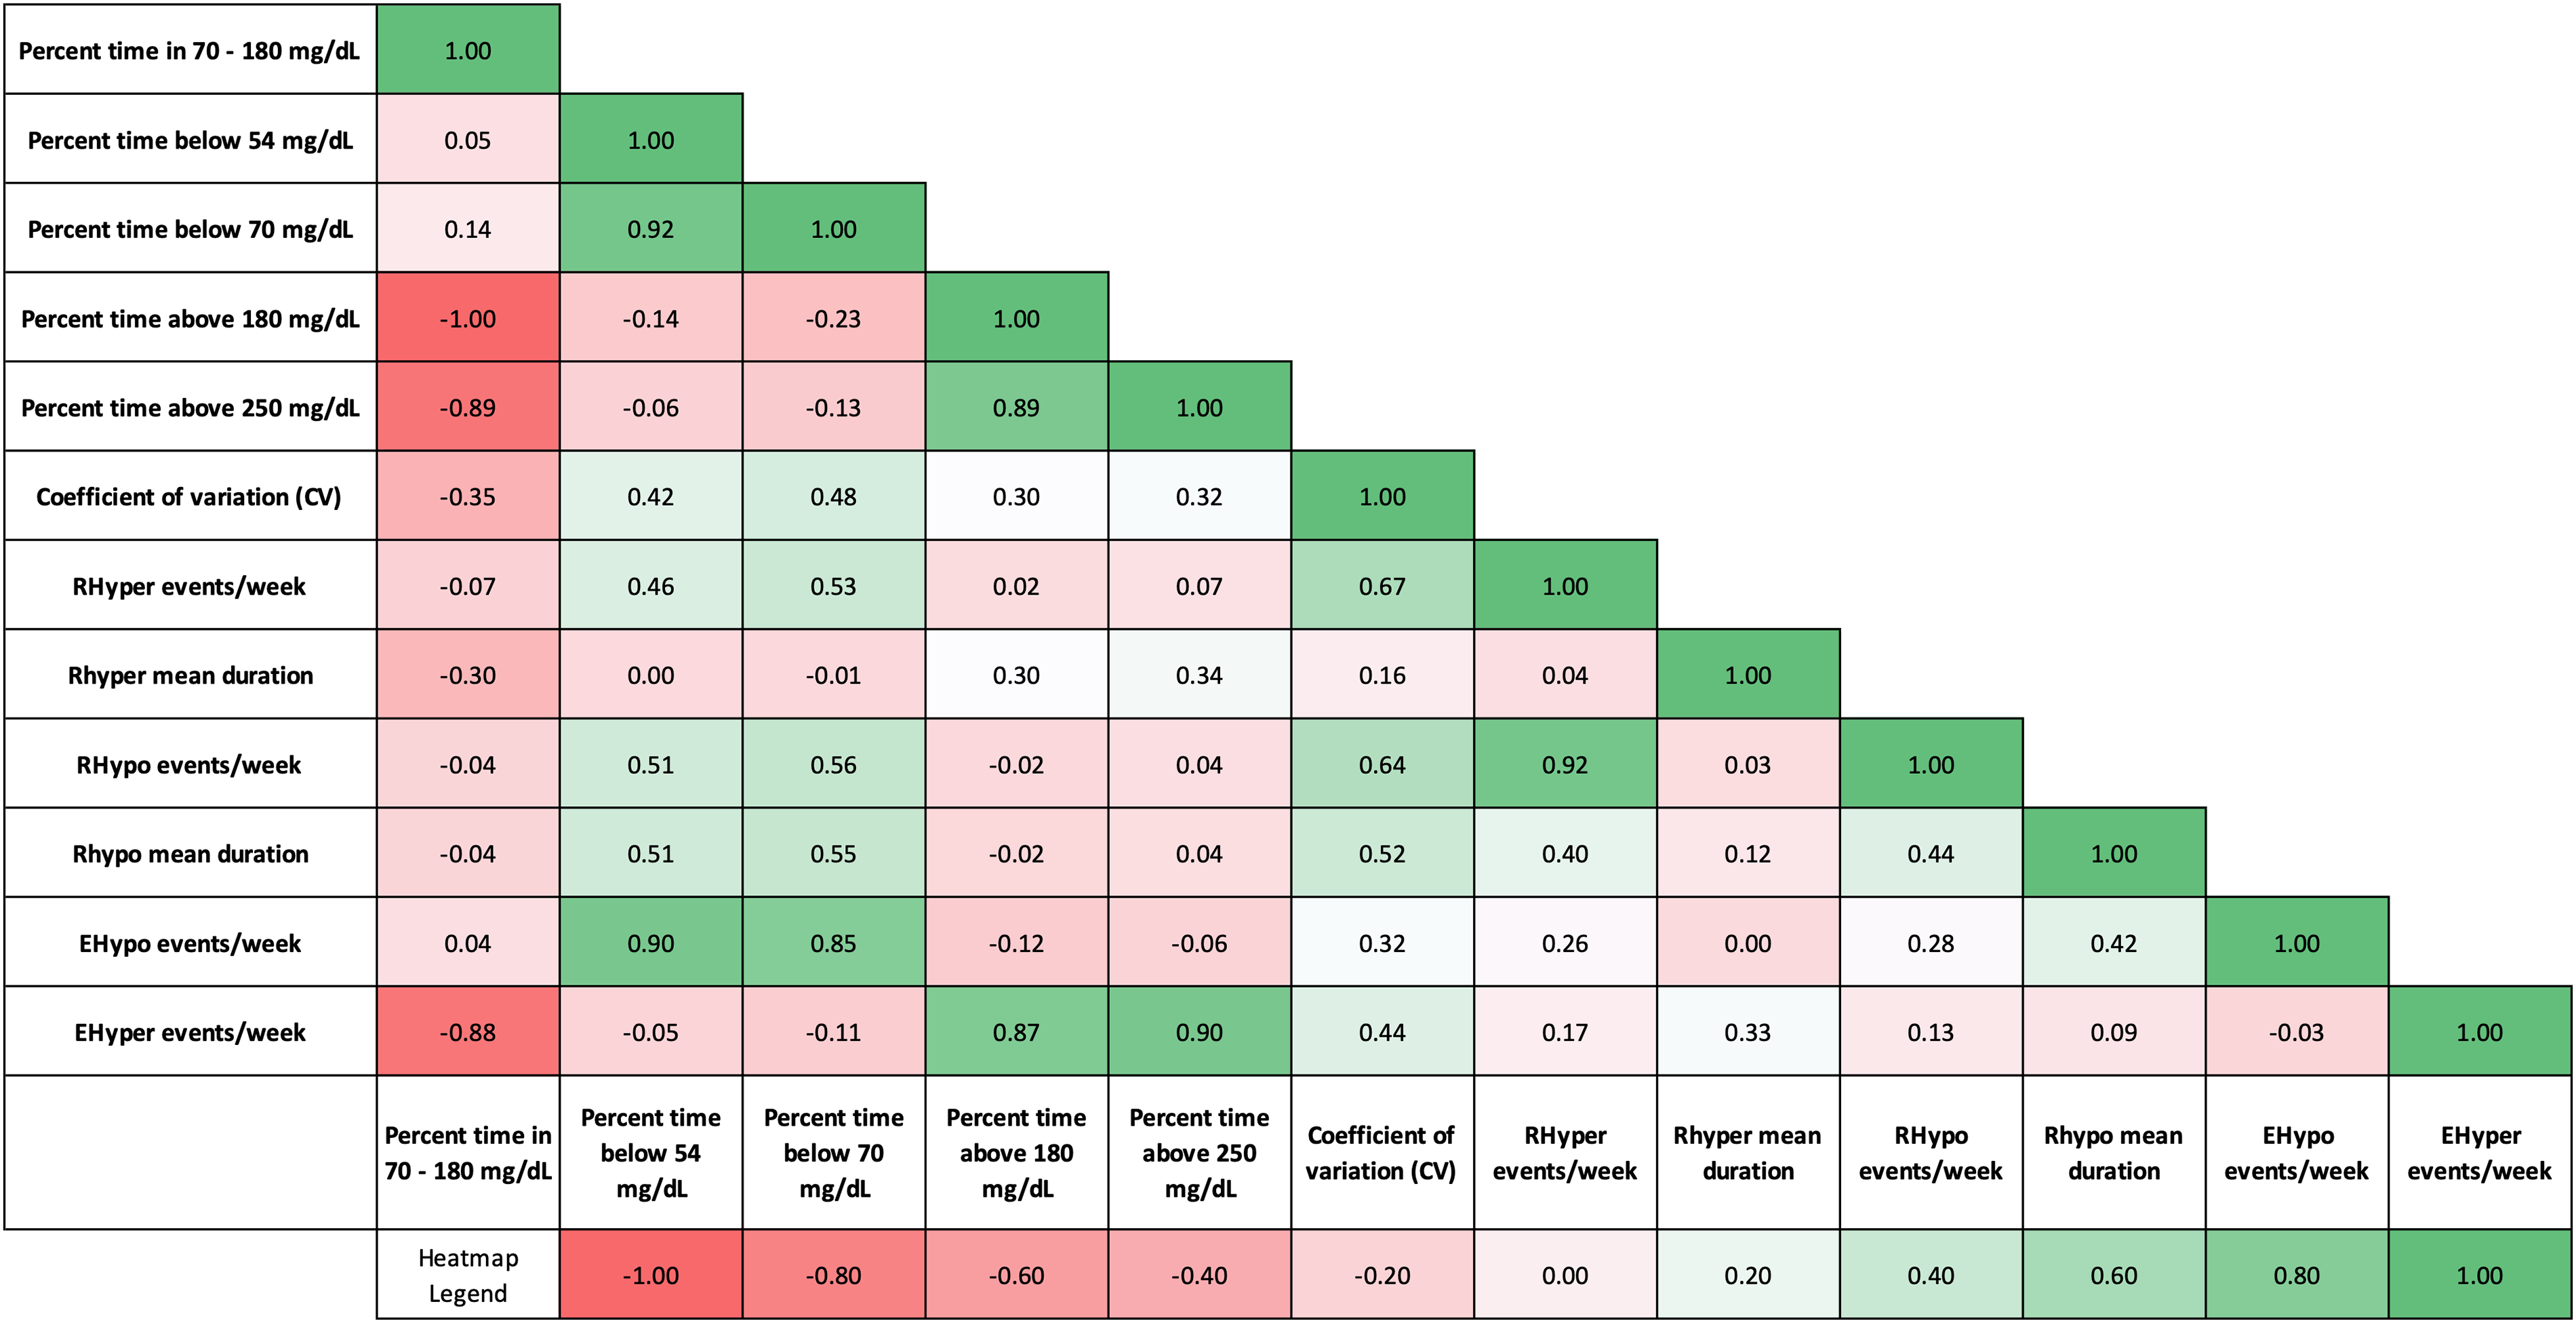
Correlation matrix for selected metrics. Pearson correlation r values are shown with a heatmap where green color represents positive correlation, and red color represents inverse correlation.
The onset of RHyper was more common during daytime, increased throughout the day, and peaked at 18.00 (Fig. 3A). RHypo followed a similar pattern with an earlier peak at 17.00 (Fig. 3B). EHyper had two peaks during the day, around 13.00 and 19.00 (Fig. 3C), and EHypo mostly occurred during nighttime, peaking around 01.00 (Fig. 3D).
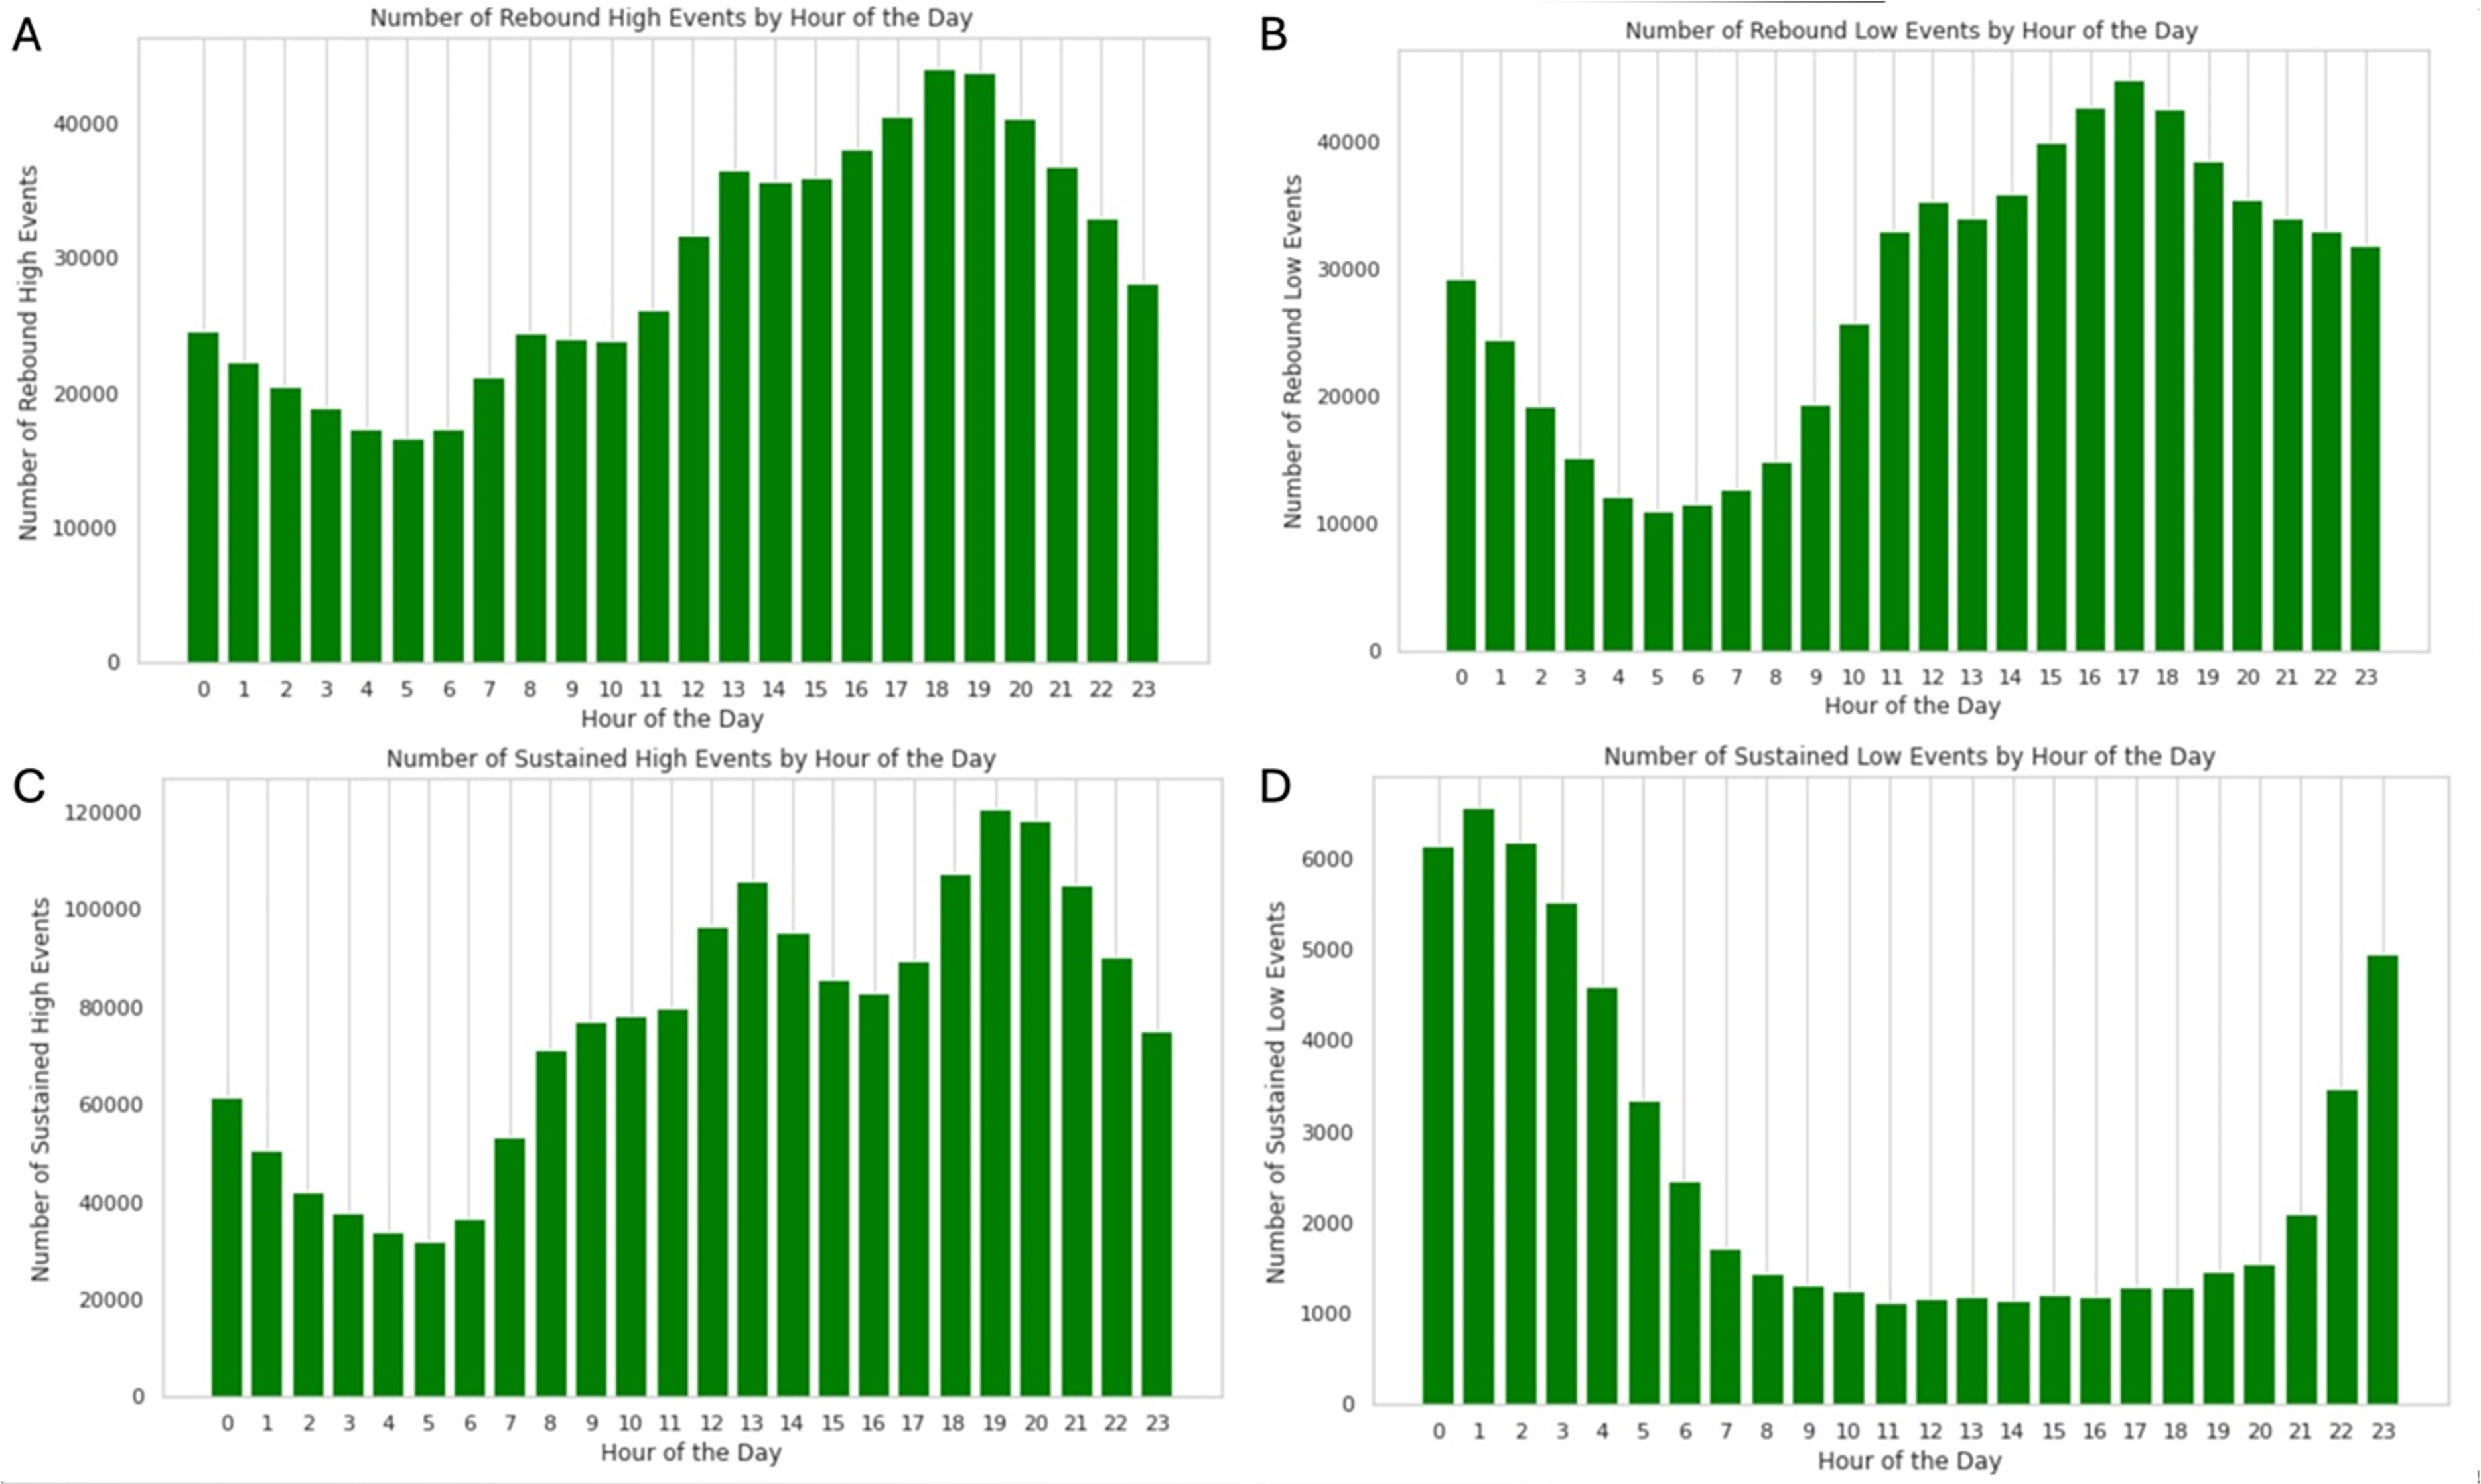
Distribution of onsets of rebound hyperglycemia
ROC in rebound metrics
ROC of RHyper and RHypo correlated with CV, similar to or stronger than TBR and TBR2 (Supplementary Fig. S7). RHyper ROC-NtoP and RHyper ROC-NtoF correlated moderately with CV (r = 0.48 for both) and weakly with TIR, TAR, TAR2, TBR, and TBR2 (r < 0.22 for all). RHyper duration from nadir to 180 mg/dL correlated with CV (r = 0.54). CV also correlated negatively with RHypo ROC-PtoN (r = −0.49) and RHypo ROC-PtoF (r = −0.50) (Supplementary Fig. S7).
Supplementary Table S1 compares the mean and median number of events per week for all subjects and for those subjects who had one or more of these events.
Discussion
In this study, we showed characteristics of new CGM metrics in a large population, with exploratory cutoff values. New CGM metrics are needed in diabetes research and, to a lesser extent, in clinical practice. There are several reasons, such as lack of glucose variability metrics that can predict hypoglycemia events and lack of evidence for the relationship between diabetes complications and CGM metrics. First, glucose variability is usually represented with CV; however, CV is influenced by the ROC, and the frequency of fluctuations has minimal effect on CV. Although other variability metrics, such as mean absolute glucose change and continuous overlapping net glycemic action, represent the frequency of fluctuations better than CV, their uses are limited in the real-world settings. 5 While these metrics provide a general assessment for variability, rebound metrics focus on specific fluctuations, with predetermined cutoffs and time intervals. Thus, rebound metrics may represent behavioral patterns in insulin treatment and may show clinically relevant fluctuations. 6
Second, there is a lack of strong evidence for the relationship between CGM metrics and diabetes complications, unlike HbA1c. Growing evidence showed that CGM metrics such as TIR and TITR are associated with long-term complications. 7 Recently, it was shown that TIR and TITR are correlated with the development of incident diabetic retinopathy. 8 That was a step forward in using CGM metrics to predict outcomes in diabetes complications. However, the prediction of severe hypoglycemia using CGM metrics is far more complicated. Although the International Consensus suggested CGM targets such as TBR <4% and CV ≤36% to prevent severe hypoglycemia, 2 there is insufficient evidence for sensitivity and specificity for these cutoffs to distinguish severe hypoglycemia. Several experts reported their concerns that these targets may not be enough to identify those at risk for severe hypoglycemia.9,10 In addition, recent studies showed that reporting of 14-day CGM sampling does not reflect 90-day CGM sampling for hypoglycemia metrics.11,12 Therefore, there is a need to use a longer duration for sampling or to explore new CGM metrics to predict hypoglycemia. Previous studies showed a strong correlation between RHyper, RHypo, and CV using real-time and intermittently scanned CGM data.6,13 A recent study showed improvement in EHyper and EHypo metrics with automated insulin delivery initiation in people with T1D. 14 In this study, we investigated these new CGM metrics’ correlation to standard CGM metrics and explored their relationships with new cutoffs.
For the rebound metrics, the most important metric was the number of events/week. Rebound mean duration and AUC had similar correlations with other metrics; however, duration may be easier to interpret than AUC in clinical practice. RHypo and RHyper event/week can be a good glycemic variability metric since they had strong correlations with CV (r > 0.6). CV had the strongest correlations with rebound metrics among all CGM metrics. Our study showed that the optimal cutoffs for RHyper and RHypo should be 70–180 mg/dL and 180 to 70 mg/dL, respectively, because these cutoffs had more events, longer duration, and a strong correlation with other metrics. RHyper events and RHypo events were strongly correlated with each other (r = 0.92). It can be interpreted as follows: in patients with high glycemic variability, RHyper and RHypo events are common and often occur in succession.
For extended metrics, the most important metric was the number of events/week. Since an event must last >120 min to count as extended metrics according to the International Consensus, 4 there were few events detected. Especially, EHypo was not present in >75% of the cohort. Our results suggest that EHypo definition in the International Consensus should consider revising with a shorter duration to include more events and to make the EHypo a practical metric.
We noticed EHypo during nighttime and EHyper after meals in our study. RHyper, RHypo, and EHyper events were more frequent during mealtimes; in contrast, EHypo events were more frequent at night during sleep time. After meals, getting not enough or late insulin can cause EHyper events, and overcorrection of EHyper events can trigger RHypo events. RHyper events are also common in mealtimes as they can be seen with over-replacing insulin with meals. Higher EHypo events at night can be explained by the increased risk of hypoglycemia overnight or pressure lows with the CGM.
CV has been shown to have a stronger correlation with time in hypoglycemia rather than hyperglycemia, indicating that higher glucose variability increases risk for hypoglycemia. Here, rebound metrics (RHyper and RHypo) had a stronger correlation with CV and hypoglycemia metrics (TBR) than the relationship between CV and TBR. Thus, rebound events have high potential to detect the increased hypoglycemia caused by high variability. Therefore, rebound metrics may have a better role in the prediction of severe hypoglycemia compared with TBR metrics, and further studies should investigate this relationship among people with severe hypoglycemia.
The strength of this study was using robust data from 30,000 people with >70% CGM use. The limitations were using CGM systems from a single manufacturer and data from the United States, and results might not be generalized to other CGMs and regions of the world. Diabetes type was self-reported. Use of insulin, concomitant medications, and automated insulin delivery systems may vary. No demographic or laboratory data were available. Predictive alerts and alarms may have affected the results. There was no clinical information about diabetic ketoacidosis or severe hypoglycemia. Results may vary in people with higher GMI. Insulin doses, exercise and diet regimens, and behavioral factors may affect the results. A previous study showed that higher engagement with Dexcom Clarity is associated with improved glycemic outcomes. 15 Dexcom Clarity is the only system to report these new CGM metrics. Further research is required if using these new metrics at the patient level would change glycemic control and prevent severe hypoglycemia or hyperglycemia.
Further studies are needed to investigate the importance of these metrics in relation to acute and chronic diabetes complications. It is imperative to research the effect of an automated insulin delivery system’s suspension features, predictive alerts of CGMs, and behaviors of people with diabetes in response to hypoglycemia and hyperglycemia.
To summarize, RHyper with 70–180 mg/dL, RHypo with 180 to 70 mg/dL, EHyper >250 mg/dL, and EHypo <70 mg/dL cutoffs may perform better than other cutoffs, while needed event duration of EHypo limits its practical use. RHyper and RHypo events/week had a strong correlation with CV and TBR, indicating these metrics have the potential to explain hypoglycemia events caused by glucose fluctuations. Further studies are needed to understand the predictive value of these new metrics in severe hypoglycemia and other acute diabetes complications.
Authors’ Contributions
H.K.A. and K.E.K. conceptualized the study, developed the study protocol, and wrote the initial draft of the article. B.C. and T.C.W. contributed to the acquisition, analysis, and interpretation of data.
Footnotes
Acknowledgments
The authors appreciate the Dexcom data analysis team.
Author Disclosure Statement
H.K.A. reports receiving research funding from Dexcom, Abbott, Roche, Medtronic, and Tandem and receiving honorarium for consulting from Dexcom, Medtronic, Tandem, Roche. K.E.K. has no conflict of interest. B.C. and T.C.W. are Dexcom employees.
Funding Information
There is no funding for this study. This is an investigator-initiated study by H.K.A.
Supplemental Material
References
Supplementary Material
Please find the following supplemental material available below.
For Open Access articles published under a Creative Commons License, all supplemental material carries the same license as the article it is associated with.
For non-Open Access articles published, all supplemental material carries a non-exclusive license, and permission requests for re-use of supplemental material or any part of supplemental material shall be sent directly to the copyright owner as specified in the copyright notice associated with the article.
