
Abstract
Objective:
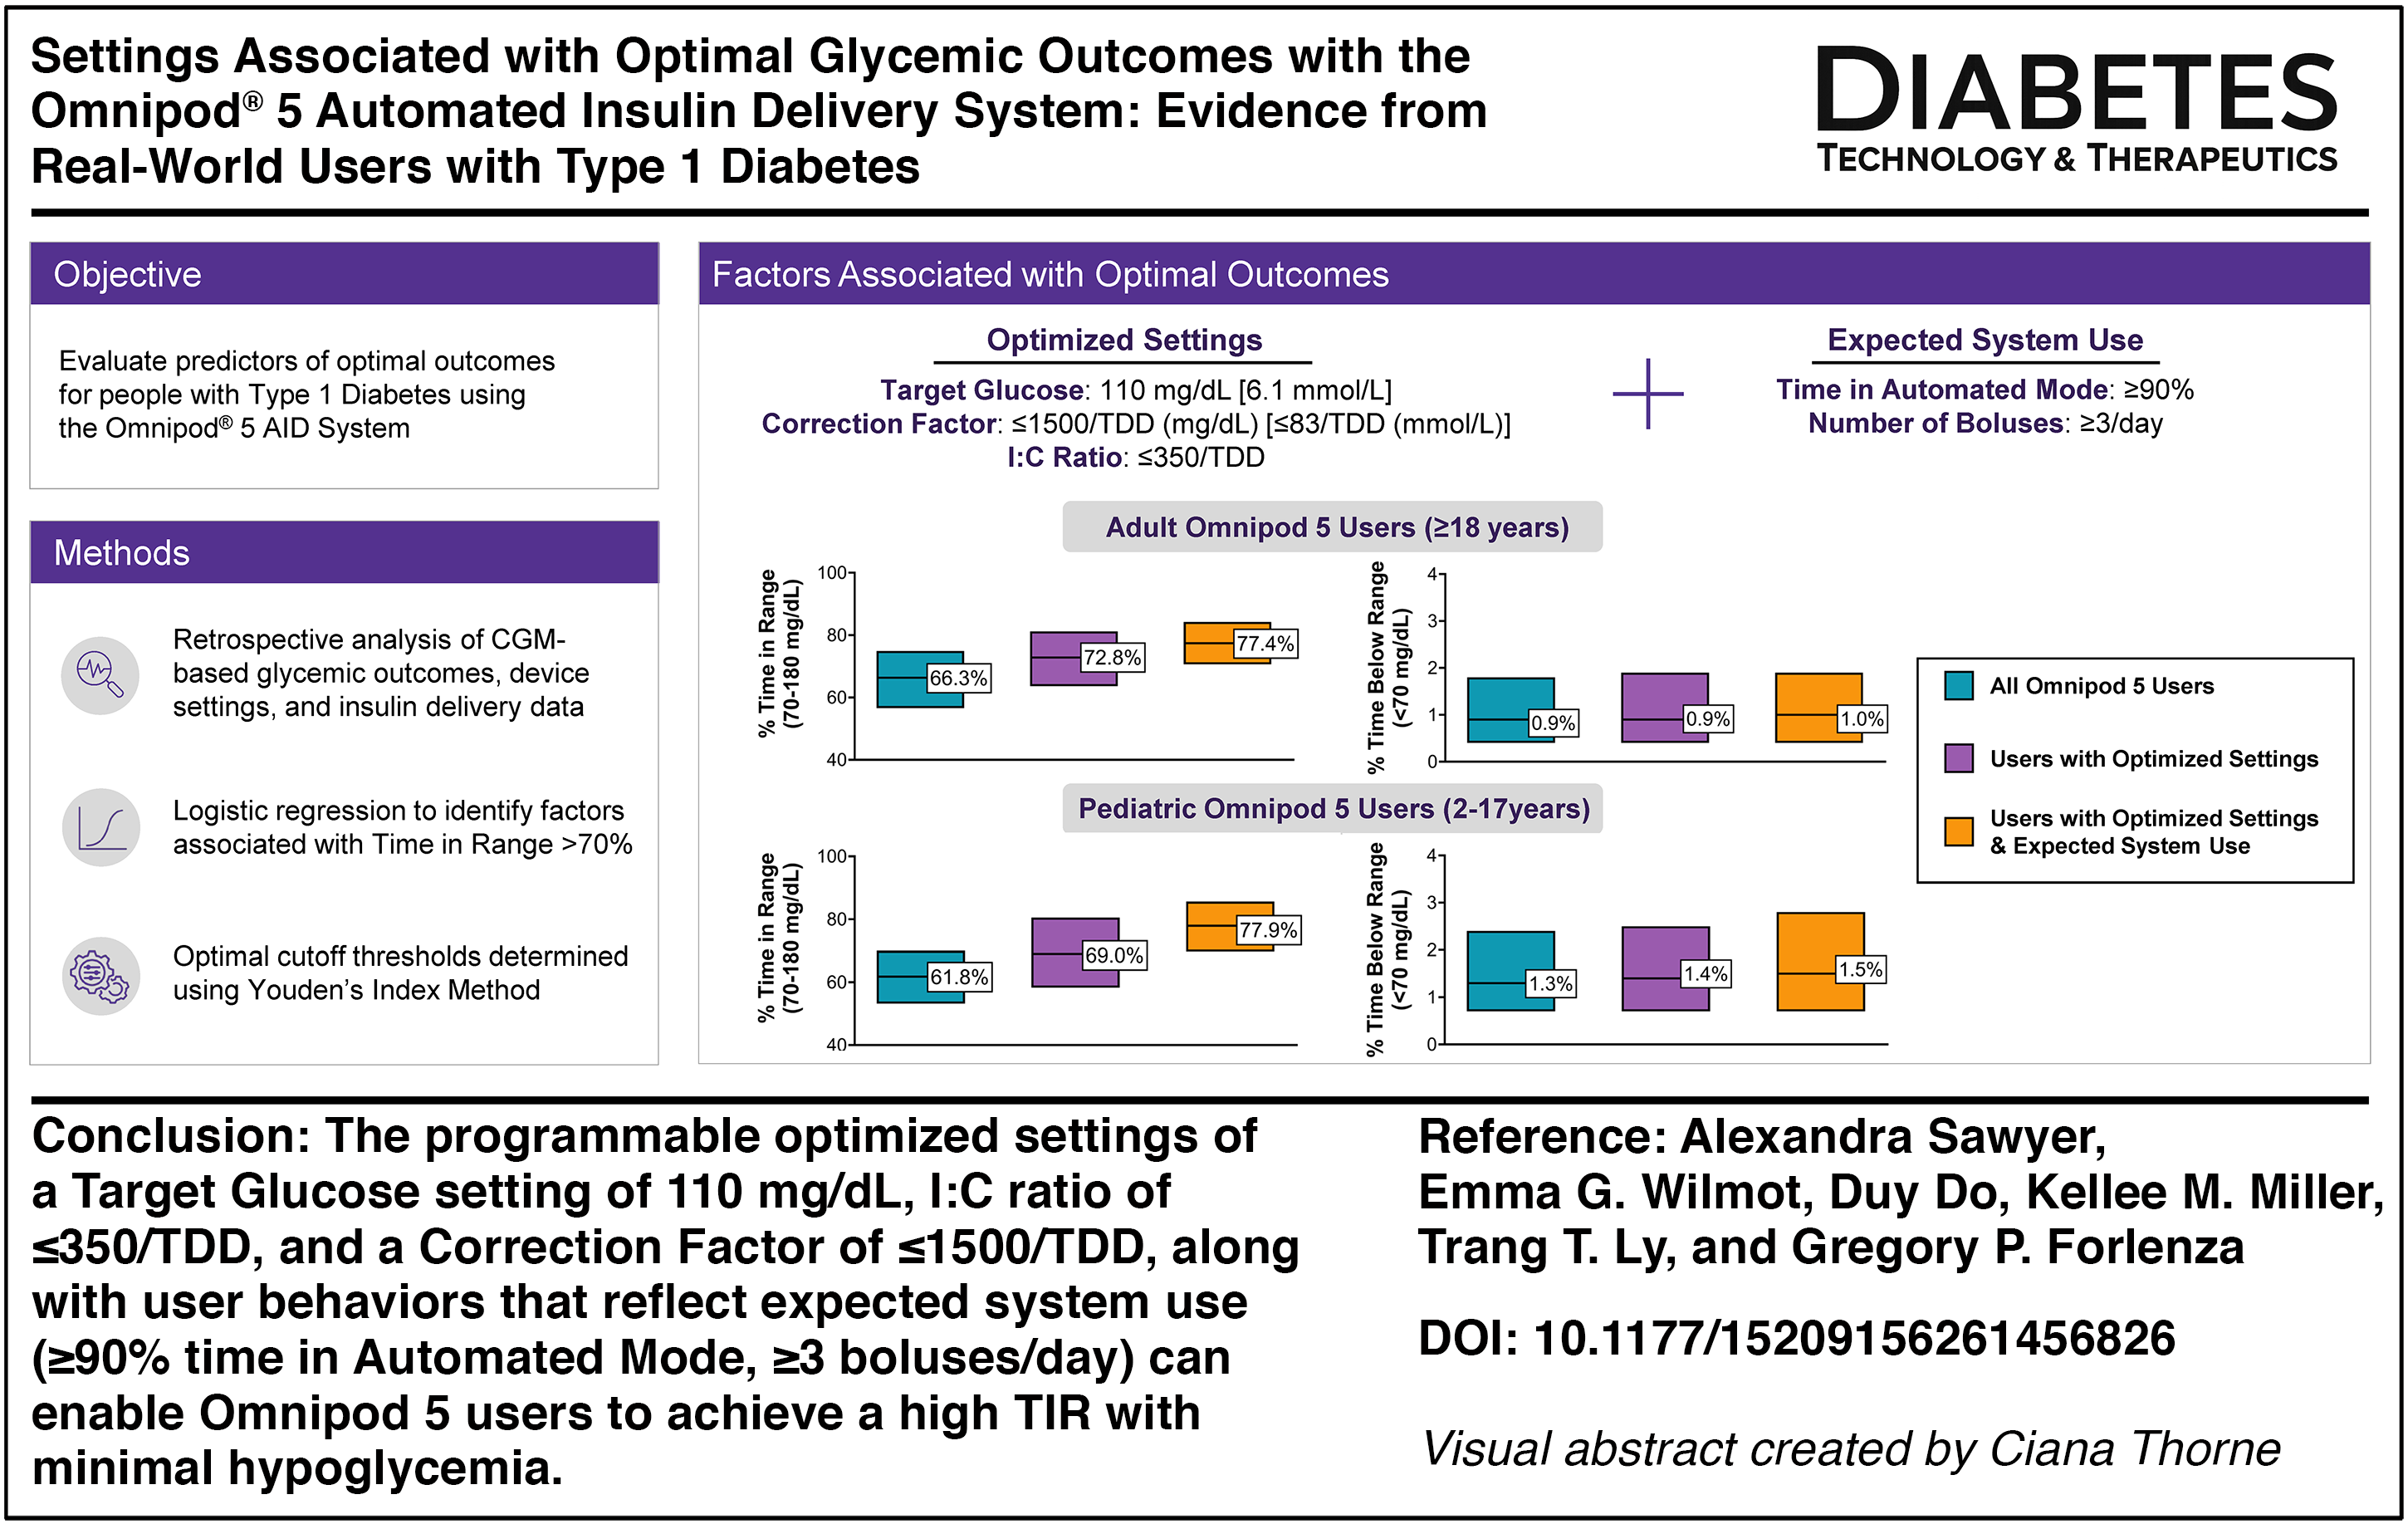
Identifying programmable device settings and user behaviors associated with achieving glycemic targets is critical for informing clinical practice and improving outcomes with automated insulin delivery (AID) systems. This real-world analysis aimed to identify predictors of achieving optimal glycemic outcomes for people with type 1 diabetes (T1D) using the Omnipod® 5 AID System.
Methods:
This retrospective analysis included real-world data from Omnipod 5 users aged ≥ 2 years with T1D in the United States and Europe who had sufficient continuous glucose monitor data (≥30 days with ≥1 reading; ≥75% of days with ≥220 readings) available in Insulet’s device and person-reported datasets between January 1 and March 31, 2025. Logistic regression was used to identify programmable settings and user behaviors associated with achieving >70% time in range (TIR; 70–180 mg/dL [3.9–10.0 mmol/L]). Optimal thresholds for the top modifiable predictors were determined using Youden’s J statistic, and their impact on glycemic outcomes was explored.
Results:
Data from 176,405 users were analyzed. Predictors of achieving >70% TIR included the following: a higher number of user-initiated boluses/day, greater time in Automated Mode, use of lower glucose targets, and a more aggressive correction factor (CF) and insulin-to-carbohydrate (I:C) ratio (all P < 0.001). Use of optimized device settings (110 mg/dL [6.1 mmol/L] target, I:C ratio ≤350/total daily insulin dose [TDD], and CF ≤1500/TDD [mg/dL] or ≤83/TDD [mmol/L]) with user behaviors that reflect expected system use (≥90% time in Automated Mode, ≥3 boluses/day), used by 7.9% and 1.4% of adult and pediatric users, respectively, resulted in a higher median TIR compared with users overall (77% vs. 66% in adult and 78% vs. 62% in pediatric users, respectively), and time spent in hypoglycemia remained low across age groups. Findings were consistent across geographic regions and prior insulin regimen.
Conclusions:
These results provide actionable guidance for clinicians to optimize outcomes for people with T1D using the Omnipod 5 System.
Introduction
Automated insulin delivery (AID) systems consist of a continuous glucose monitor (CGM), an insulin pump, and an algorithm that uses CGM data to automatically modulate insulin delivery. AID has consistently been shown to improve glycemia, reduce the risk of hypoglycemia, enhance quality of life, and lessen treatment burden for individuals with diabetes.1–5 The American Diabetes Association (ADA) recommends that AID should be the preferred insulin delivery method for individuals with type 1 diabetes (T1D) and type 2 diabetes (T2D) as Grade A recommendations. 6 Additionally, the International Society for Pediatric and Adolescent Diabetes guidelines strongly recommend AID for youth with T1D as a Grade A recommendation. 7 There are several commercially available AID systems, and the choice of specific AID system should be individualized based on user preferences and clinical needs. 6
There has been substantial growth in AID adoption over the past 15 years.8,9 As adoption continues to expand, health care providers will increasingly encounter patients using different AID systems with unique management considerations, emphasizing the need for evidence-based guidance to optimize care. Notably, training on system-specific optimization strategies with AID has been identified as an educational need by health care professionals. 10 Additionally, the ADA Standards of Care emphasize the importance of educating people with diabetes who are prescribed diabetes technology on effective data interpretation and therapy adjustment. 6 It has also been shown that user engagement with pump setting adjustments is associated with improved HbA1c. 11 Thus, offering evidence-based recommendations to inform both clinical decision making and user self-management may facilitate better glycemic outcomes.
Maximizing time spent in automation and actively engaging with AID systems through user-initiated boluses are key behaviors for achieving optimal outcomes across systems. In addition to supporting these user behaviors, clinical guidelines emphasize the importance of health care providers maintaining familiarity with the distinct features of each system and regularly reviewing patient data to adjust settings as needed to improve glycemia.6,12–16 AID systems employ distinct algorithms that vary in their adjustable parameters and the settings most strongly associated with optimal performance.17,18 Although health care providers are expected to tailor insulin dosing, conventional dosing guidelines were developed before AID systems and may not fully apply. While newer guidelines have recognized that AID systems may benefit from more aggressive dosing compared with traditional multiple daily injection (MDI) or sensor-augmented pump therapy, limited data exist to inform system-specific dosing strategies. 12
The Omnipod® 5 AID System is a tubeless AID system that has been shown to be safe and effective in people with T1D ages 2 years and older and in people with T2D ages 18 years and older, with evidence from randomized controlled trials, single-arm studies, and real-world observational data demonstrating positive impacts of system use on glycemic outcomes.19–25 Prior studies have shown that using the lowest target glucose setting of 110 mg/dL (6.1 mmol/L) is associated with higher time in range (TIR; 70–180 mg/dL [3.9–10.0 mmol/L]); 19 however, the effects of other programmable settings and user behaviors remain underexplored. This study evaluated both programmable settings and user behaviors among Omnipod 5 users to identify those most strongly associated with achieving the clinical target of >70% TIR. By identifying specific modifiable settings and behaviors that improve glycemic outcomes, this study provides actionable evidence to guide health care providers in clinical decision making and counseling.
Materials and Methods
Study design and population
This retrospective study used de-identified data from Omnipod 5 System users in the United States, United Kingdom, Germany, and France, collected from Insulet’s electronic device usage datasets between January 1, 2025, and March 31, 2025. The Omnipod 5 System consists of a tubeless on-body insulin pump (“Pod”) with an embedded AID algorithm and the Omnipod 5 App, which controls the Pod via Bluetooth wireless technology. When used in Automated Mode with an interoperable CGM, the AID algorithm modulates insulin delivery every 5 minutes based on CGM glucose values to maintain glucose near the user-configurable target ranging from 110 mg/dL to 150 mg/dL (6.1–8.3 mmol/L) in 10 mg/dL (0.55 mmol/L) increments, adjustable by time of day. 26
Users (or a parent or guardian for users aged <18 years) who provided consent at onboarding to the use of their anonymized and aggregated data for research purposes were included in the study. Data were automatically and securely uploaded from the Omnipod 5 Controller or compatible personal smartphone (United States only) with the Omnipod 5 App via SIM card or wireless internet. Device data were linked to a dataset of self-reported demographic information (type of diabetes, gender, age, prior therapy, etc.) collected as part of the onboarding process. The Western Institutional Review Board—Copernicus Group (WCG) Institutional Review Board (IRB) approved a request for a waiver of authorization for use and disclosure of protected health information for this study (United States only) and found the protocol to be exempt under 45 CFR § 46.104(d)(4) on January 4, 2022. To comply with the General Data Protection Regulation (GDPR), only users in the United Kingdom, France, and Germany who provided GDPR-compliant consent were included in the analysis.
The primary analysis included users aged ≥2 years at the start of the study period with self-reported T1D who used ≥5 units of insulin per day on average and met the following criteria during the study period to ensure representative, reliable glycemic metrics: ≥50% of time in Automated Mode, ≥30 days (either consecutive or nonconsecutive) with at least one CGM reading, with ≥75% of those days containing ≥220 CGM readings. These thresholds for inclusion were selected to ensure data quality and represent typical device use. A minimum of 50% time in Automated Mode was required to reflect meaningful exposure to the algorithm. To mitigate potential transitional effects, users were required to have ≥30 days of CGM data prior to January 1, 2025. To reduce the influence of extreme or implausible values, users with correction factors (CFs) or insulin:carbohydrate (I:C) ratios in the <1st or >99th percentile were excluded. Additionally, users with missing data for device use or device setting covariates included in the analysis (<1%) were excluded to ensure complete data availability for covariate adjustment.
Statistical analysis
Descriptive statistics were used to summarize the data. For continuous variables, mean, median, and interquartile range were reported; for categorical variables, frequencies and percentages were presented.
To analyze the relationship between programmable settings, user behaviors, demographic factors, and glycemic outcomes, logistic regression modeling with backward stepwise selection was used to quantify the relationship between each covariate and the likelihood of achieving >70% TIR. Demographic factors included age group, gender, and country of residence. Programmable settings included programmed target glucose and correct above settings (calculated as the time-weighted average per user, grouped by rounding to the nearest available setting values), duration of insulin action (DIA), I:C ratio, and CF. User behaviors included the percentage of time spent in Automated Mode, percentage of time using Activity feature, and the number of user-initiated boluses per day. To enable comparison across users, pump settings (I:C ratio and CF) were standardized by multiplying each user’s average value by their total daily insulin dose (TDD).
The dataset was first randomly partitioned into a training set (70%) and a test set (30%). To address class imbalance in the binary outcome (approximately 35% of users achieving >70% TIR), the Random OverSampling Examples (ROSE) method was applied to the training dataset to balance classes.27,28 The logistic regression model was trained using the balanced training data. ROSE generates synthetic examples for the minority class using smoothed bootstrapping, which reduces overfitting compared to simple duplication and creates more realistic observations. Oversampling was chosen over undersampling because it preserves information from the majority class, avoiding the loss of statistical power and model stability that occurs when discarding data. Model performance and the derivation of optimal cutoff values for the top five most important covariates were conducted using the test data. Predictor selection was guided by backward stepwise selection, starting with a full set of candidate variables and iteratively removing those with P-values ≥0.05. All continuous variables were standardized using Z-scores prior to modeling to ensure comparability across scales. Following convention, P-values <0.05 were considered statistically significant. No formal correction for multiple comparisons was applied due to the exploratory, observational nature of this study.
From the final set of statistically significant covariates identified in the logistic regression model, only those considered modifiable by the individual user or their health care provider were selected for further evaluation. The top five most important modifiable factors of predicting >70% TIR were determined based on their clinical relevance (e.g., absolute value of the log odds). For each predictor, the optimal threshold was derived using Youden’s J statistic, which identified the point that maximized (sensitivity + specificity − 1) on the receiver operating characteristic (ROC) curve. This approach is widely used for threshold selection and provides a transparent balance between sensitivity and specificity. Given the moderate prevalence of the >70% TIR outcome and the optimization (rather than diagnostic) focus of this analysis, Youden’s J was considered appropriate. To enhance clinical applicability and safety, mathematically precise cut points were rounded to practical values consistent with guidance that emphasizes interpretability and feasibility in routine care.
To confirm robustness, sensitivity analyses were performed using two alternative methods: the Euclidean distance criterion and kernel-smoothed ROC curves. The Euclidean method selects the threshold closest to the ideal point (sensitivity = 1, specificity = 1), emphasizing overall classification accuracy, while kernel smoothing applies a nonparametric technique to reduce sampling variability and irregularities in ROC estimation.28,29 Both approaches produced operating points and performance metrics highly similar to those obtained with Youden’s J, reinforcing that the chosen cutoffs are stable across different threshold-selection strategies and not artifacts of a single method.
To evaluate these optimal cutoff values and their associated glycemic outcomes, users were stratified according to whether their programmable settings and user behaviors were above or below each threshold. Glycemic outcomes, including percentage of time <54 mg/dL (<3.0 mmol/L), time <70 mg/dL (<3.9 mmol/L), time >180 mg/dL (>10.0 mmol/L), time >250 mg/dL (>13.9 mmol/L), TIR, time in tight range (TITR; 70–140 mg/dL [3.9–7.8 mmol/L]), and Glycemia Risk Index 30 were evaluated by sequential addition of factors, starting with the programmable settings that can be modified by health care providers (target glucose, CF, and I:C ratio), followed by user behaviors (time in Automated Mode and bolus frequency). Additional analyses were stratified by time of day (daytime [6:00 AM to 11:59 PM] and nighttime [12:00 AM to 5:59 AM]) and by baseline characteristics including age group, country of residence, and prior therapy.
Analyses were only conducted if the sample size for a particular characteristic was sufficient (n ≥ 10). All analyses were conducted using R version 4.5.1.
Results
Characteristics of the study population
There were 176,405 users with T1D meeting the inclusion criteria at the time of analysis. Of these, 29% were children and adolescents aged 2–17 years, and 71% were adults aged ≥18 years (Table 1). Seventy eight percent of users were from the United States, 13% were from the United Kingdom, 6% were from Germany, and 2% were from France. Logistic regression modeling of demographic factors associated with achieving >70% TIR are presented in Supplementary Table S1. Both older age and residing in Europe were associated with a greater likelihood of meeting the clinical target for TIR.
Characteristics of the 176,405 Omnipod 5 System Users Included in the Analysis
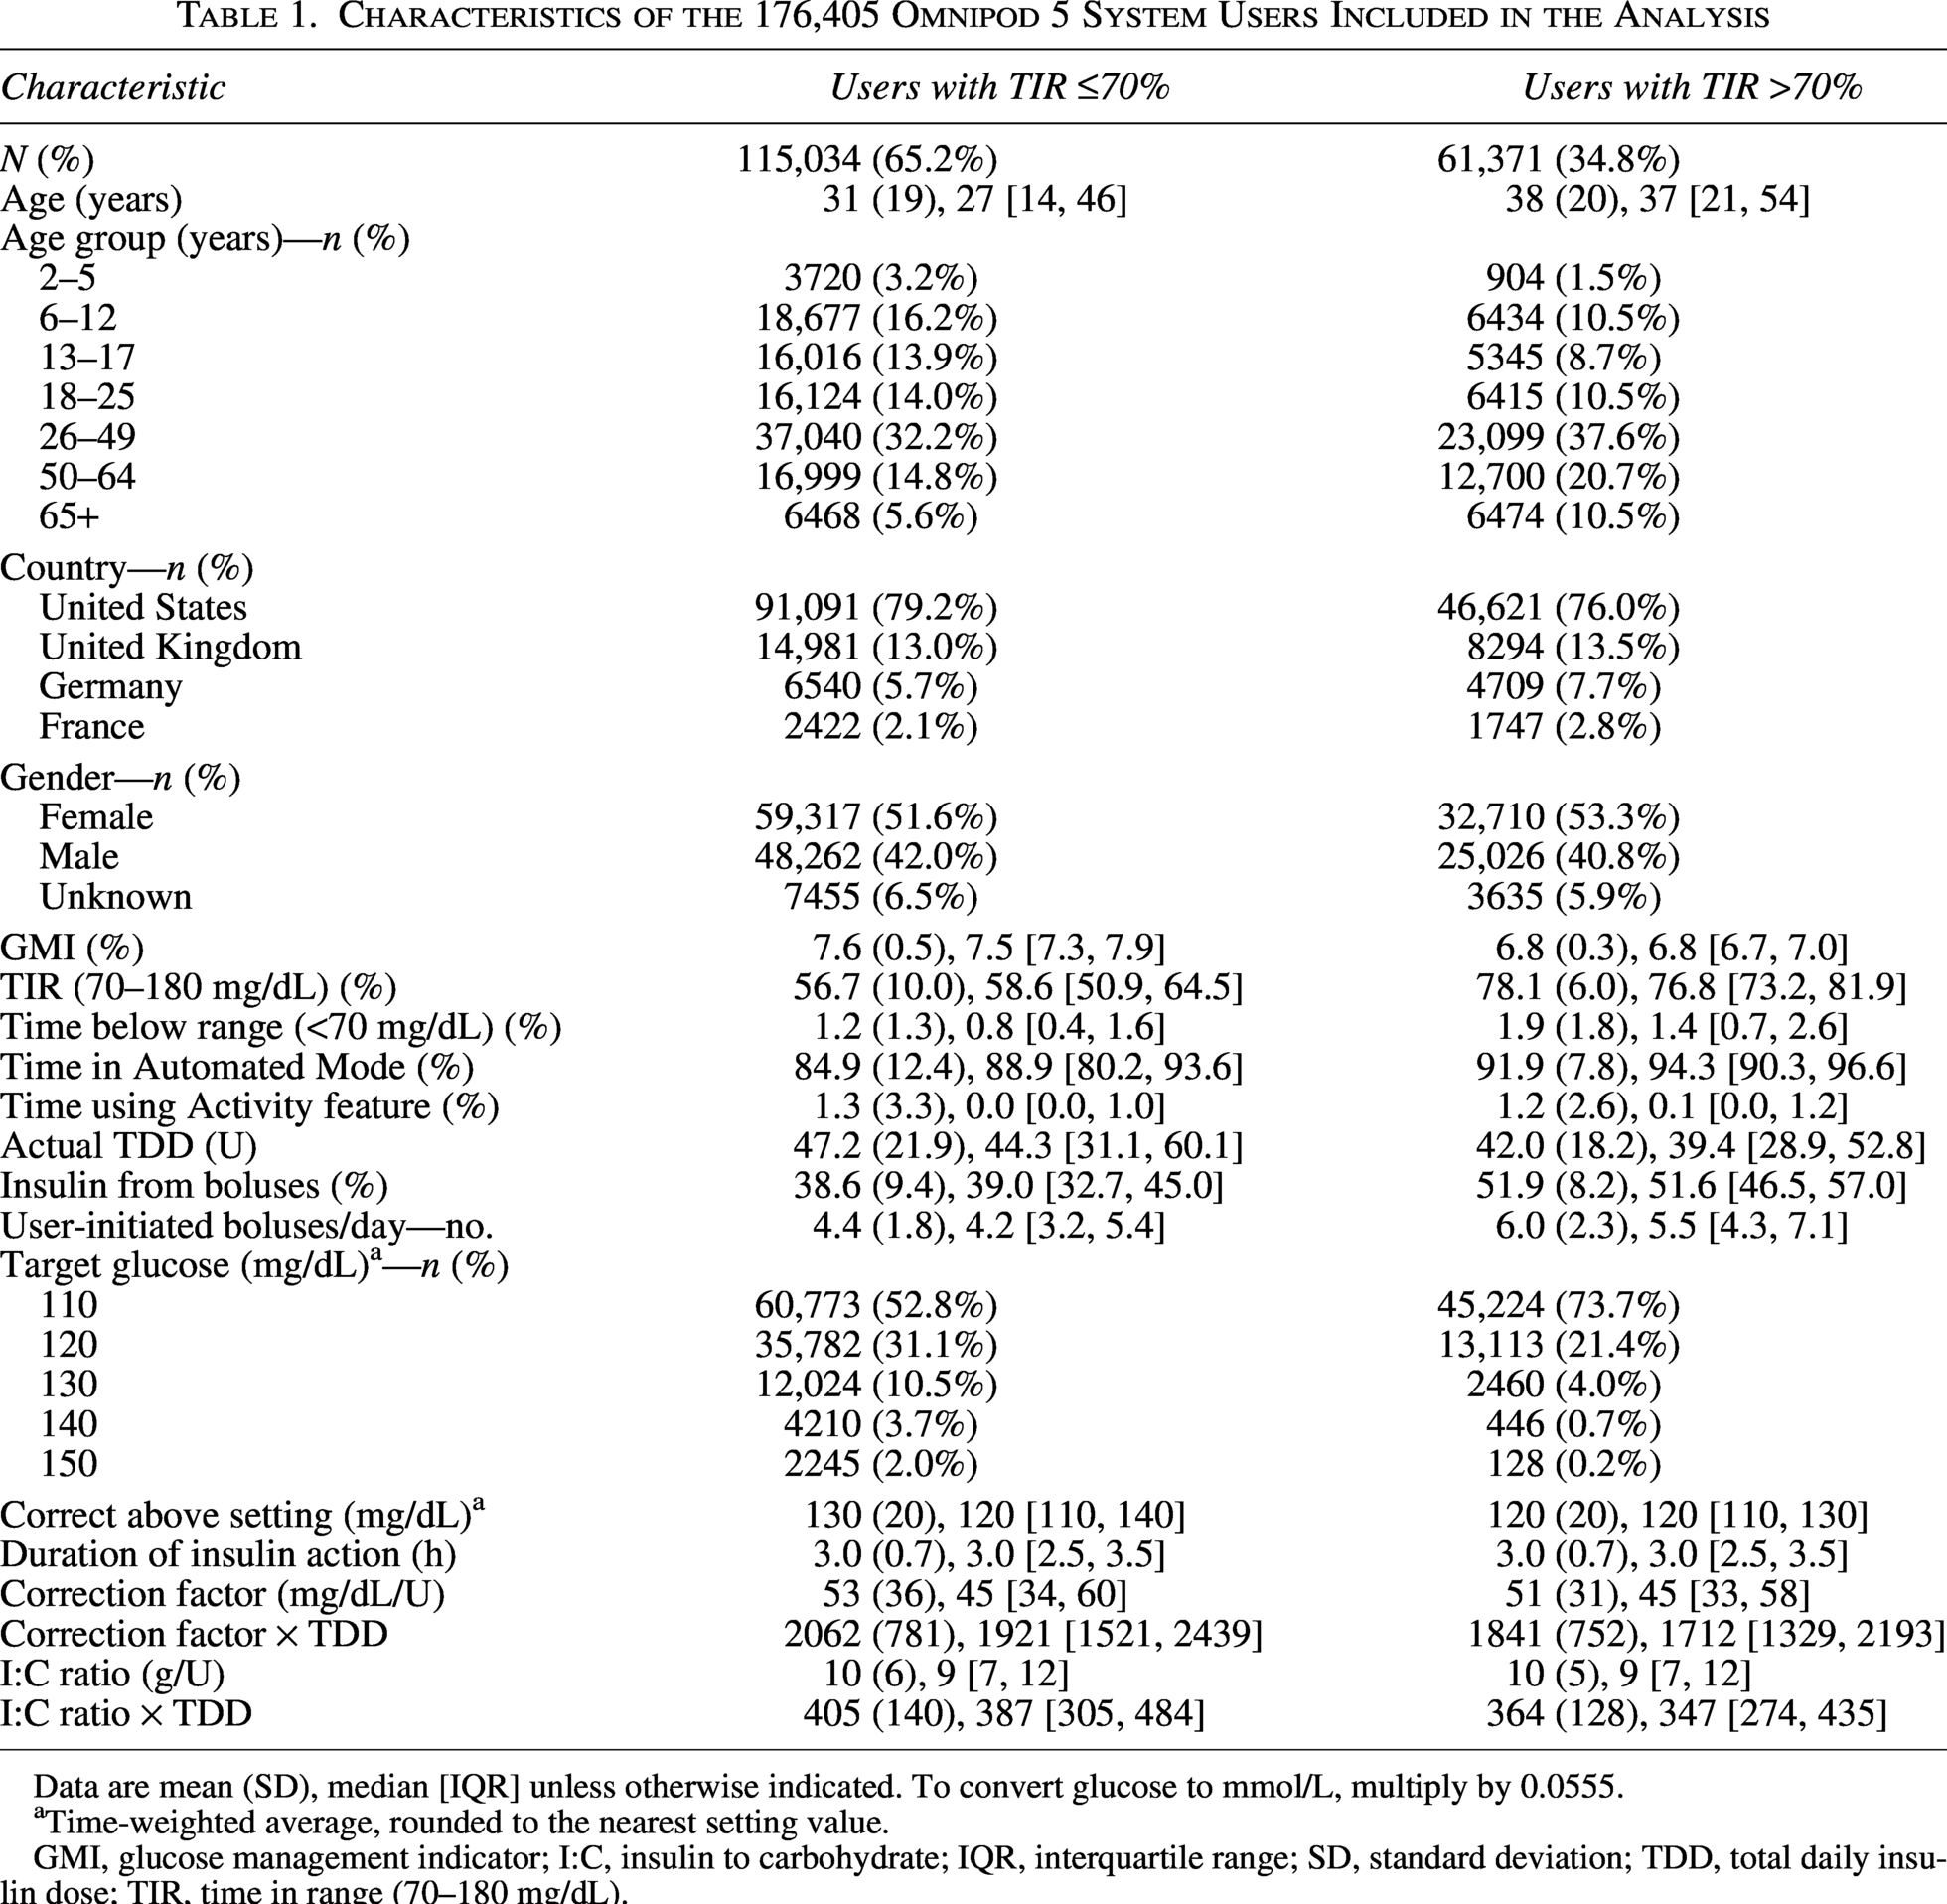
Data are mean (SD), median [IQR] unless otherwise indicated. To convert glucose to mmol/L, multiply by 0.0555.
Time-weighted average, rounded to the nearest setting value.
GMI, glucose management indicator; I:C, insulin to carbohydrate; IQR, interquartile range; SD, standard deviation; TDD, total daily insulin dose; TIR, time in range (70–180 mg/dL).
Device use and settings associated with higher TIR
Across all programmable settings evaluated in this analysis, users had an average of 2.4 setting adjustment events over the 3-month study period, with some variability in the frequency of which settings were adjusted (mean number of setting adjustment events during the study period—target glucose: 0.4; correct above: 0.4; I:C ratio: 1.0; CF: 0.5; DIA: 0.2). The directionality of adjustments for each setting (i.e., strengthening vs. de-intensification) was largely similar in frequency (target glucose: 0.2 vs. 0.2; correct above: 0.2 vs. 0.2; I:C ratio: 0.6 vs. 0.4; CF: 0.3 vs. 0.2; DIA: 0.1 vs. 0.1).
The top five modifiable programmable settings and user behaviors associated with achieving >70% TIR, identified by the log odds from the logistic regression model for all users, are presented in Table 2 and Figure 1. Both a higher number of user-initiated boluses per day (≥5) and a greater percentage of time spent in Automated Mode (≥90%) were significantly associated with achieving >70% TIR, with an odds ratio (OR) [95% confidence interval (CI)]: 8.76 [8.18, 9.38] and 4.92 [4.37, 5.55], respectively (both P < 0.001). Use of the lowest target glucose setting was also associated with a higher likelihood of achieving >70% TIR (OR [95% CI]: 3.99 [3.65, 4.37], P < 0.001). A more aggressive CF of <1500/TDD (mg/dL; <83/TDD [mmol/L]) and I:C ratio of <350/TDD were associated with increased odds of achieving >70% TIR (OR [95% CI]: 1.79 [1.70, 1.88] and 1.95 [1.86, 2.02], respectively) (both P < 0.001). Regression modeling results were similar among the subset of 84,859 users (48% of the total sample) included in the analysis who had no setting adjustments during the 3-month study period (Supplementary Table S2).
Multivariate Logistic Regression Analysis of User Behaviors and Programmable Settings Associated with >70% Time in Range Among Omnipod 5 System Users
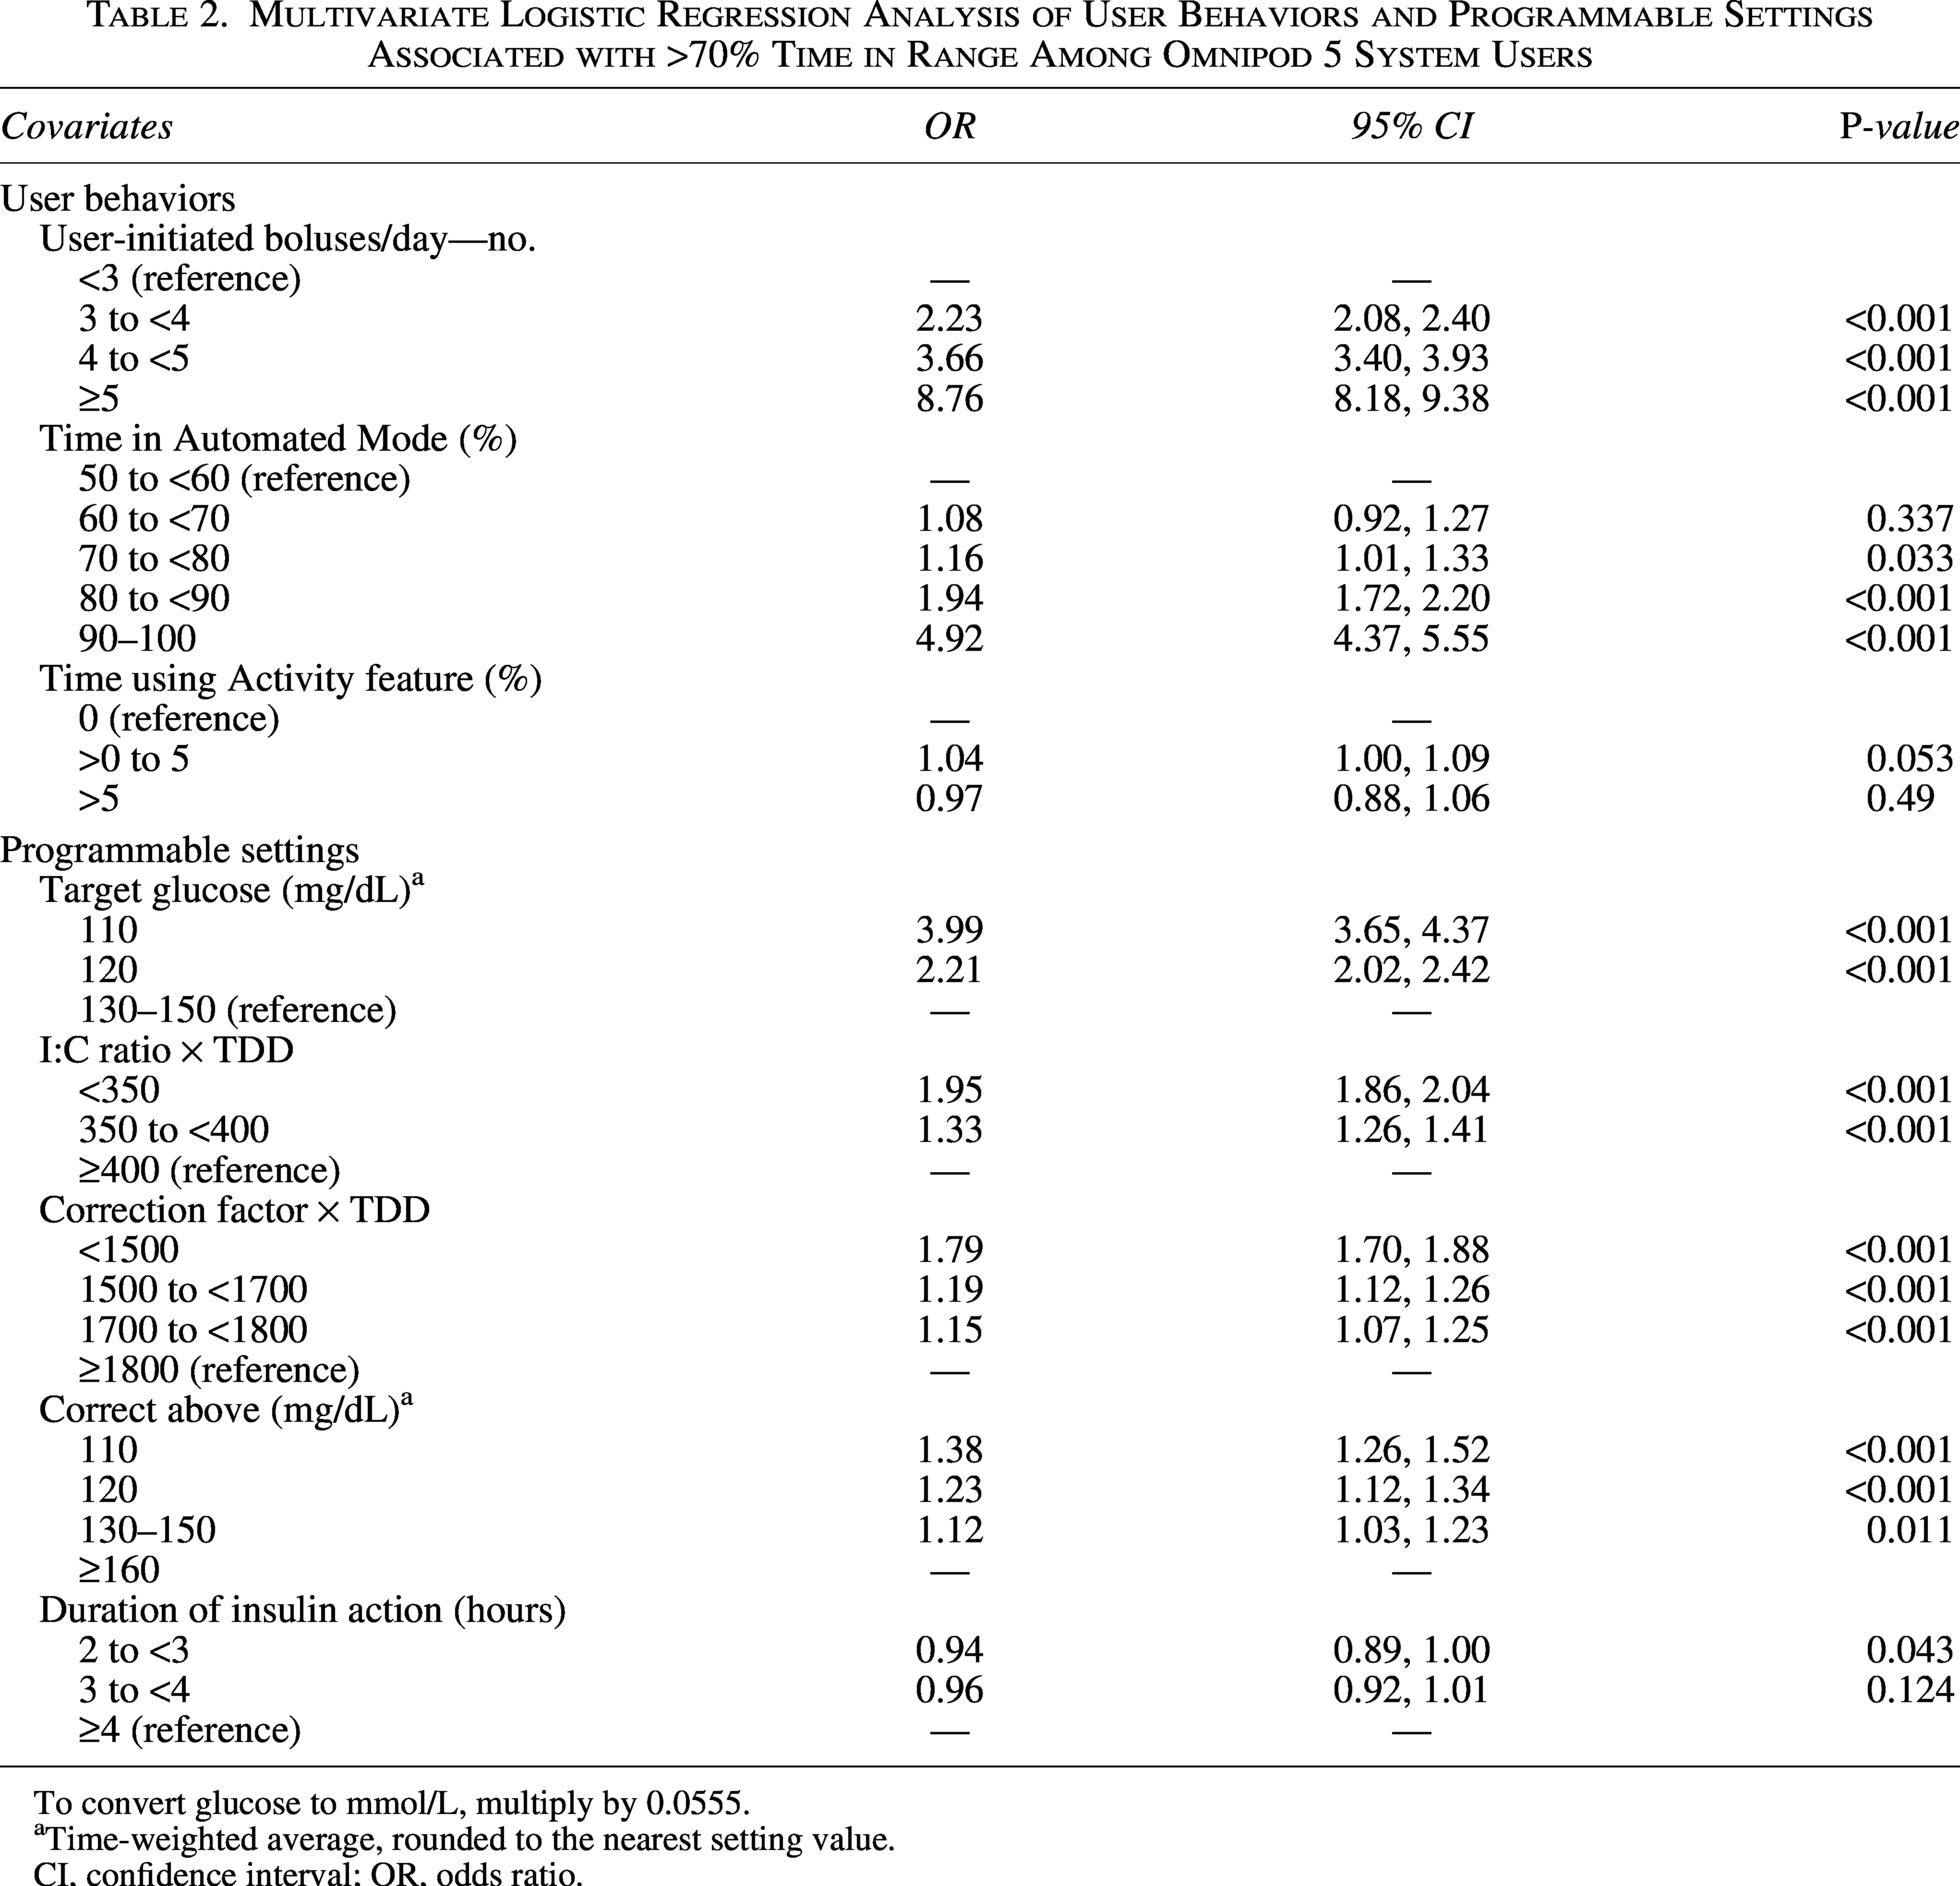
To convert glucose to mmol/L, multiply by 0.0555.
Time-weighted average, rounded to the nearest setting value.
CI, confidence interval; OR, odds ratio.
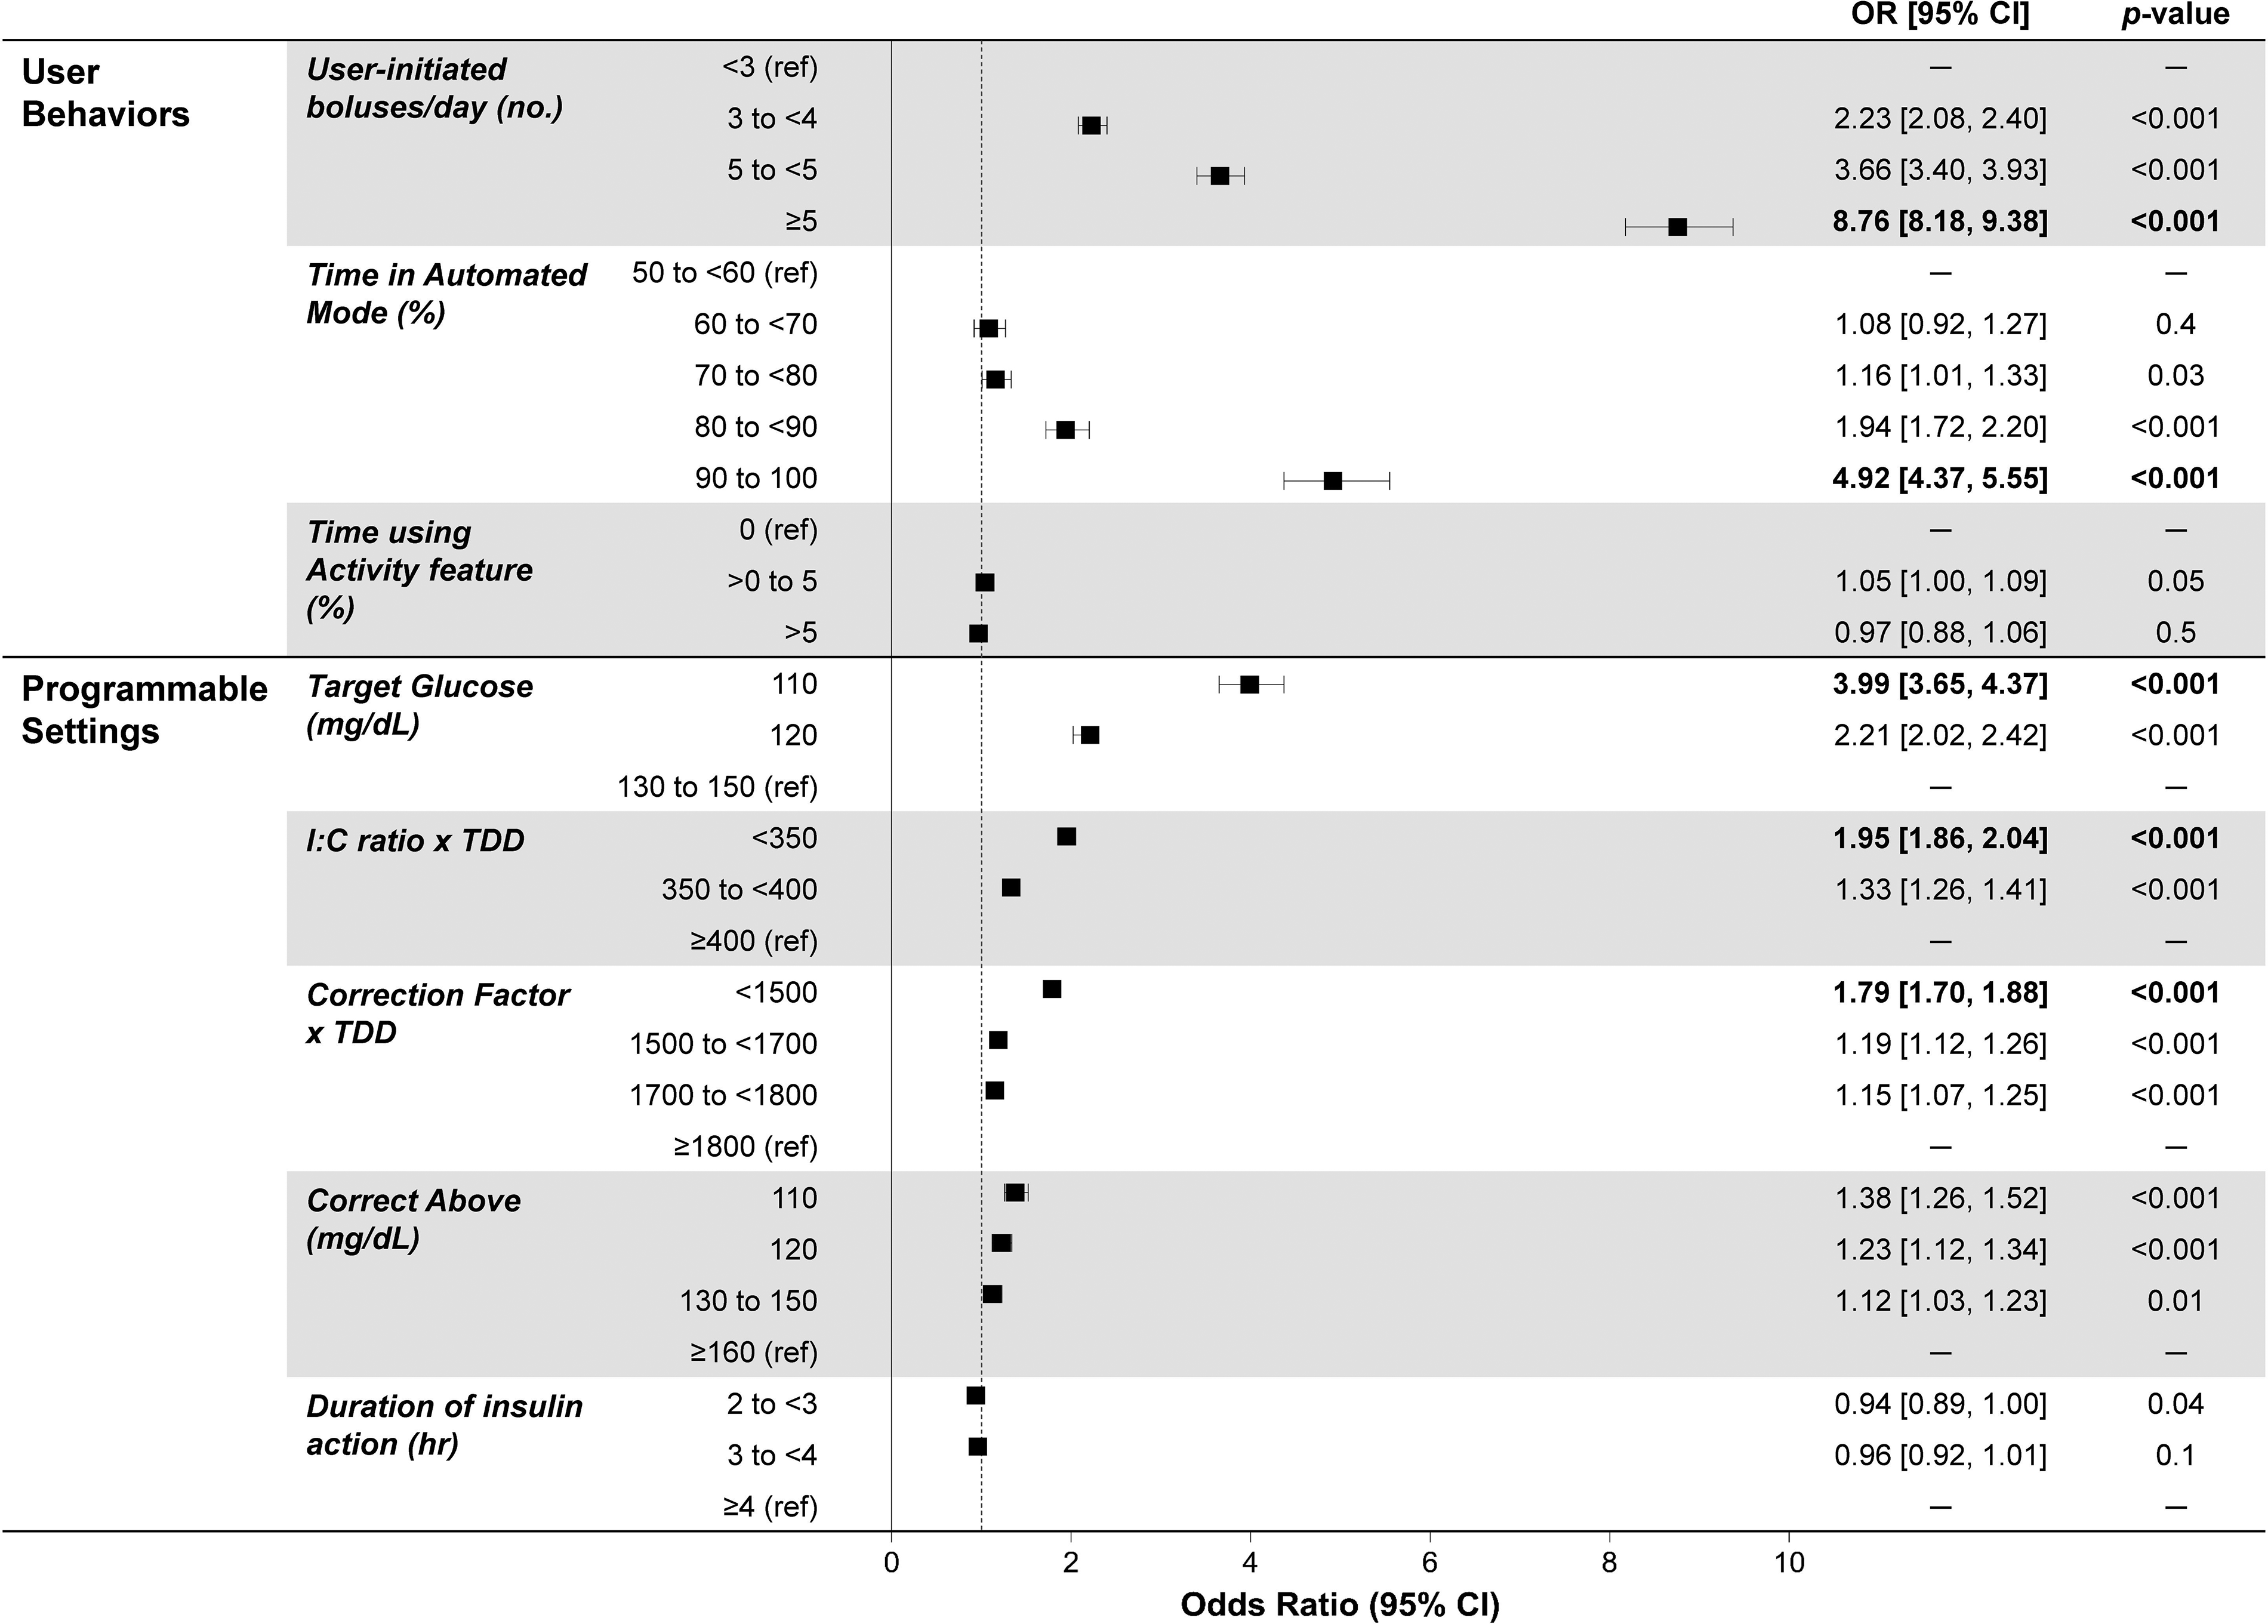
Multivariate logistic regression analysis of user behaviors and programmable setting factors associated with achieving >70% time in range among Omnipod 5 System users. Bolded values represent the top five most important factors based on their log odds from the model. To convert glucose to mmol/L, multiply by 0.0555. CI, confidence interval; I:C, insulin to carbohydrate; OR, odds ratio; TDD, total daily insulin dose.
Optimal cutoff values for these modifiable factors were determined using Youden’s J statistic to maximize sensitivity and specificity (Table 3). For clinical applicability, the following thresholds were selected for further analysis: ≥3 and ≥5 boluses/day, ≥90% of time spent in Automated Mode, use of the 110 mg/dL (6.1 mmol/L) target glucose setting, I:C ratio of ≤350/TDD, and a CF of ≤1500/TDD (mg/dL; ≤83/TDD [mmol/L]) (Table 3).
Optimal and Adjusted Cutoff Values and Diagnostic Performance of the Top Modifiable Covariates Associated with >70% Time in Range Among Omnipod 5 Users
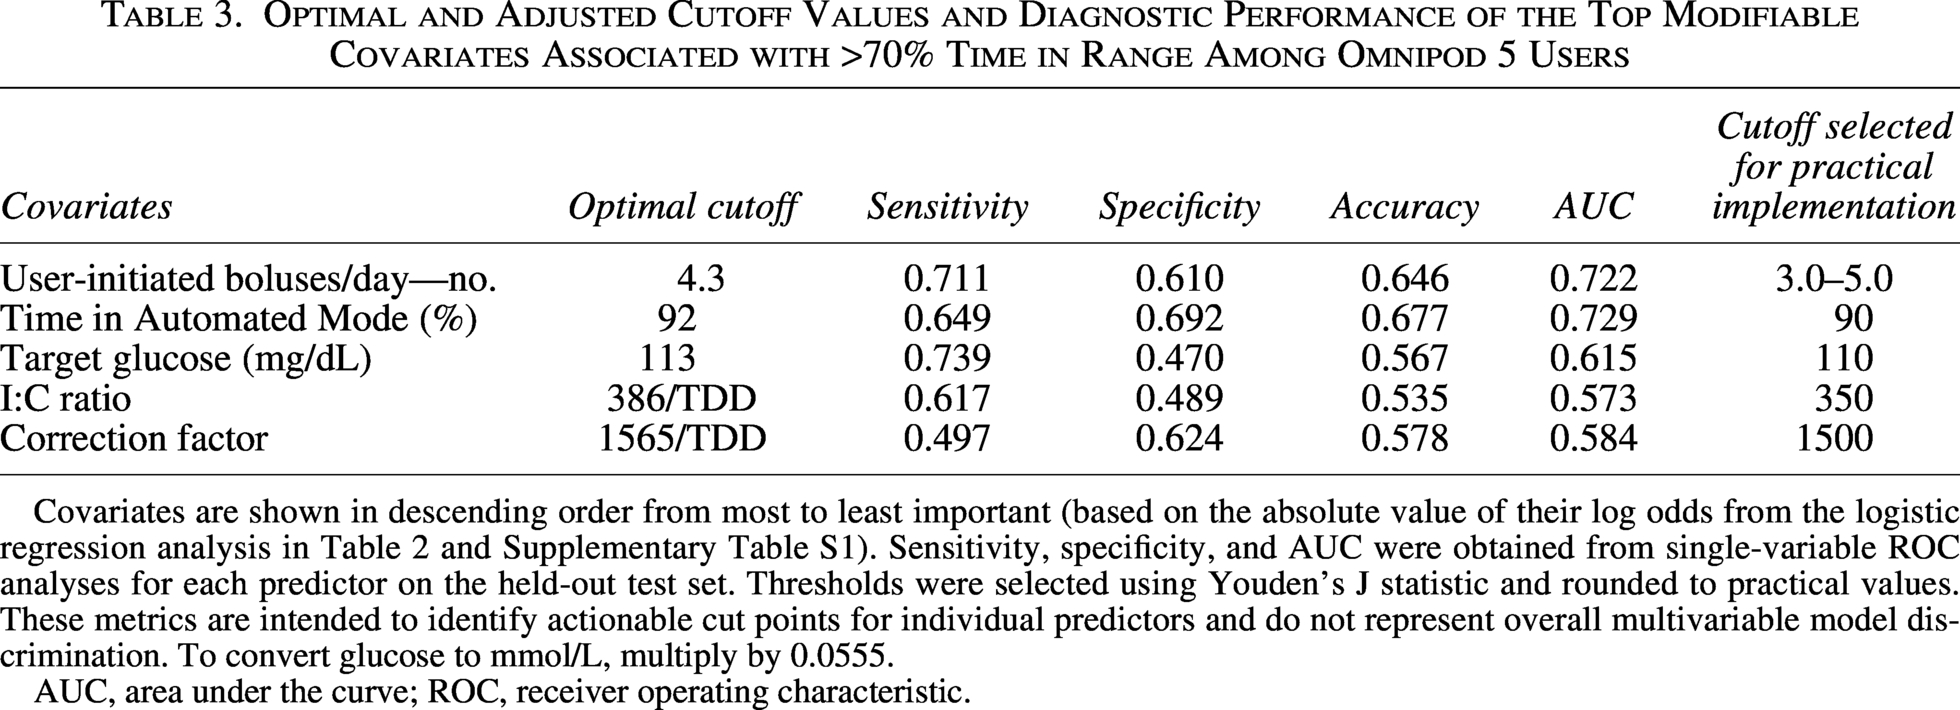
Covariates are shown in descending order from most to least important (based on the absolute value of their log odds from the logistic regression analysis in Table 2 and Supplementary Table S1). Sensitivity, specificity, and AUC were obtained from single-variable ROC analyses for each predictor on the held-out test set. Thresholds were selected using Youden’s J statistic and rounded to practical values. These metrics are intended to identify actionable cut points for individual predictors and do not represent overall multivariable model discrimination. To convert glucose to mmol/L, multiply by 0.0555.
AUC, area under the curve; ROC, receiver operating characteristic.
Impact of optimized settings and user behaviors on glycemic outcomes
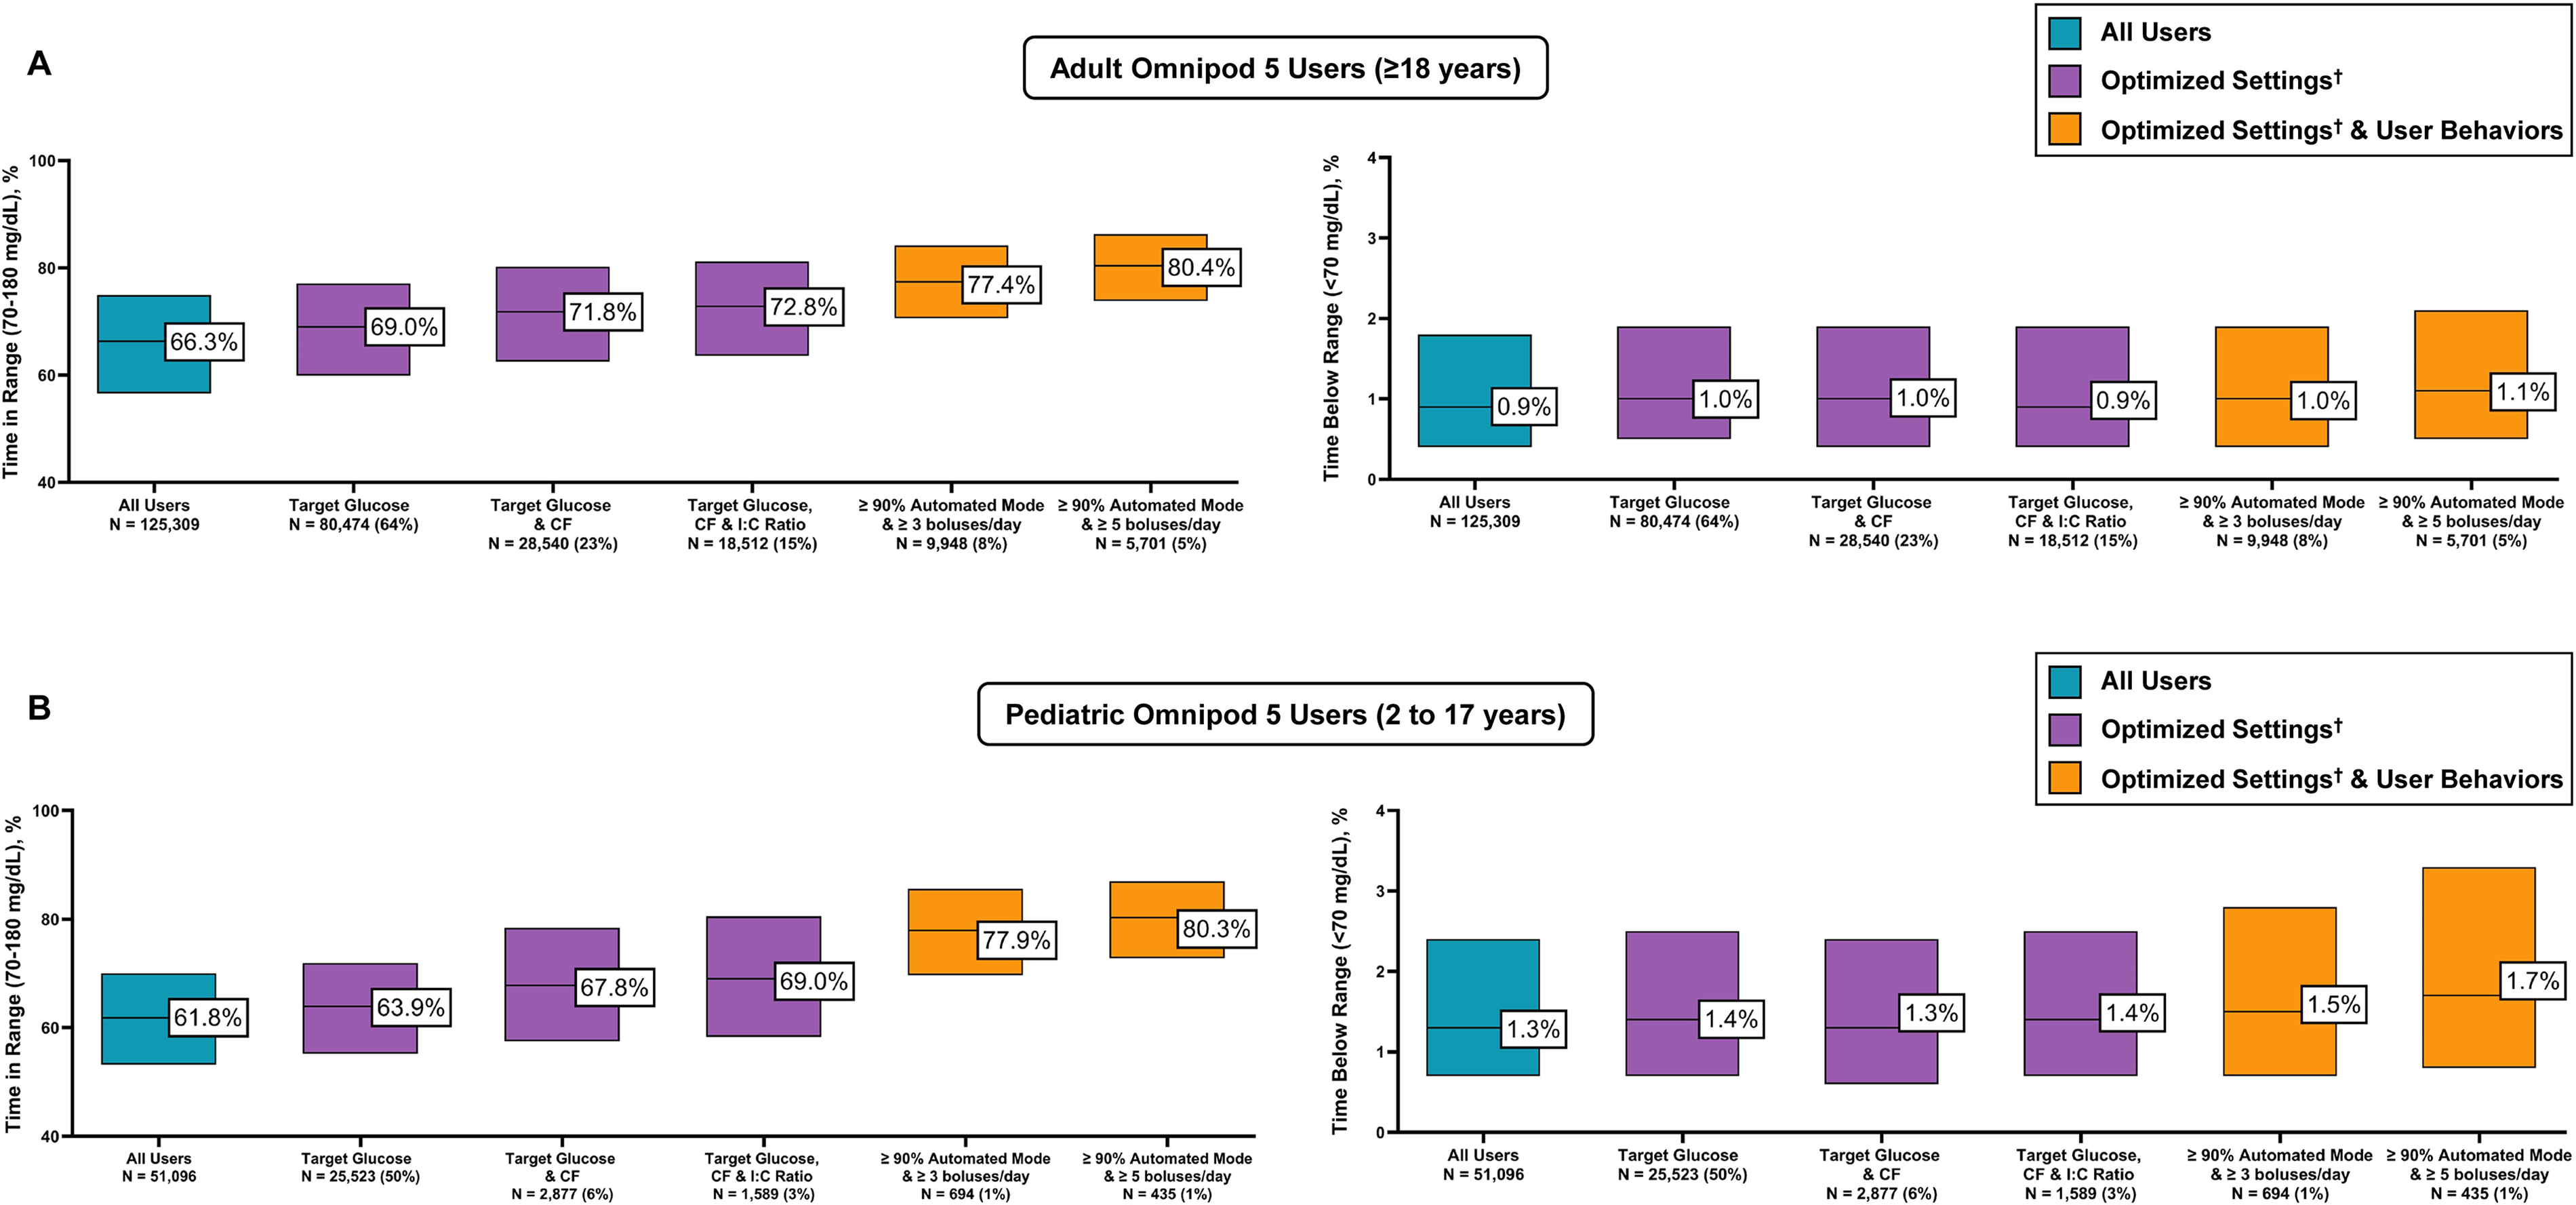
Among adult users, sequential application of individual optimized device settings and user behaviors was associated with progressively higher median TIR without a meaningful increase in time spent in hypoglycemia (both time <54 mg/dL [<3.0 mmol/L] and time <70mg/dL [<3.9 mmol/L]) (Table 4, Fig. 2A). Median TIR increased from 66% for adult users overall to 69% with use of the lowest target glucose setting, and further addition of both a CF of ≤1500/TDD (mg/dL; ≤83/TDD [mmol/L]) and I:C ratio of ≤350/TDD increased the median TIR to 73%. Adults who used optimized settings and maintained ≥90% time in Automated Mode achieved a median TIR of 77% and 80% with ≥3 or ≥5 boluses per day, respectively (Table 4). Results stratified by daytime and nighttime for adult users overall are presented in Supplementary Table S3, with users achieving a median TIR overnight of up to 87%. Glycemic outcomes among adult users in the United States and Europe stratified by country are presented in Supplementary Table S4, with similar outcomes observed across regions. Similar results were also observed among adult users previously treated with MDI (Supplementary Table S5).
Glycemic Outcomes for Adult Omnipod 5 Users (≥18 Years) in the United States and Europe with Type 1 Diabetes According to Optimized Device Settings and User Behaviors
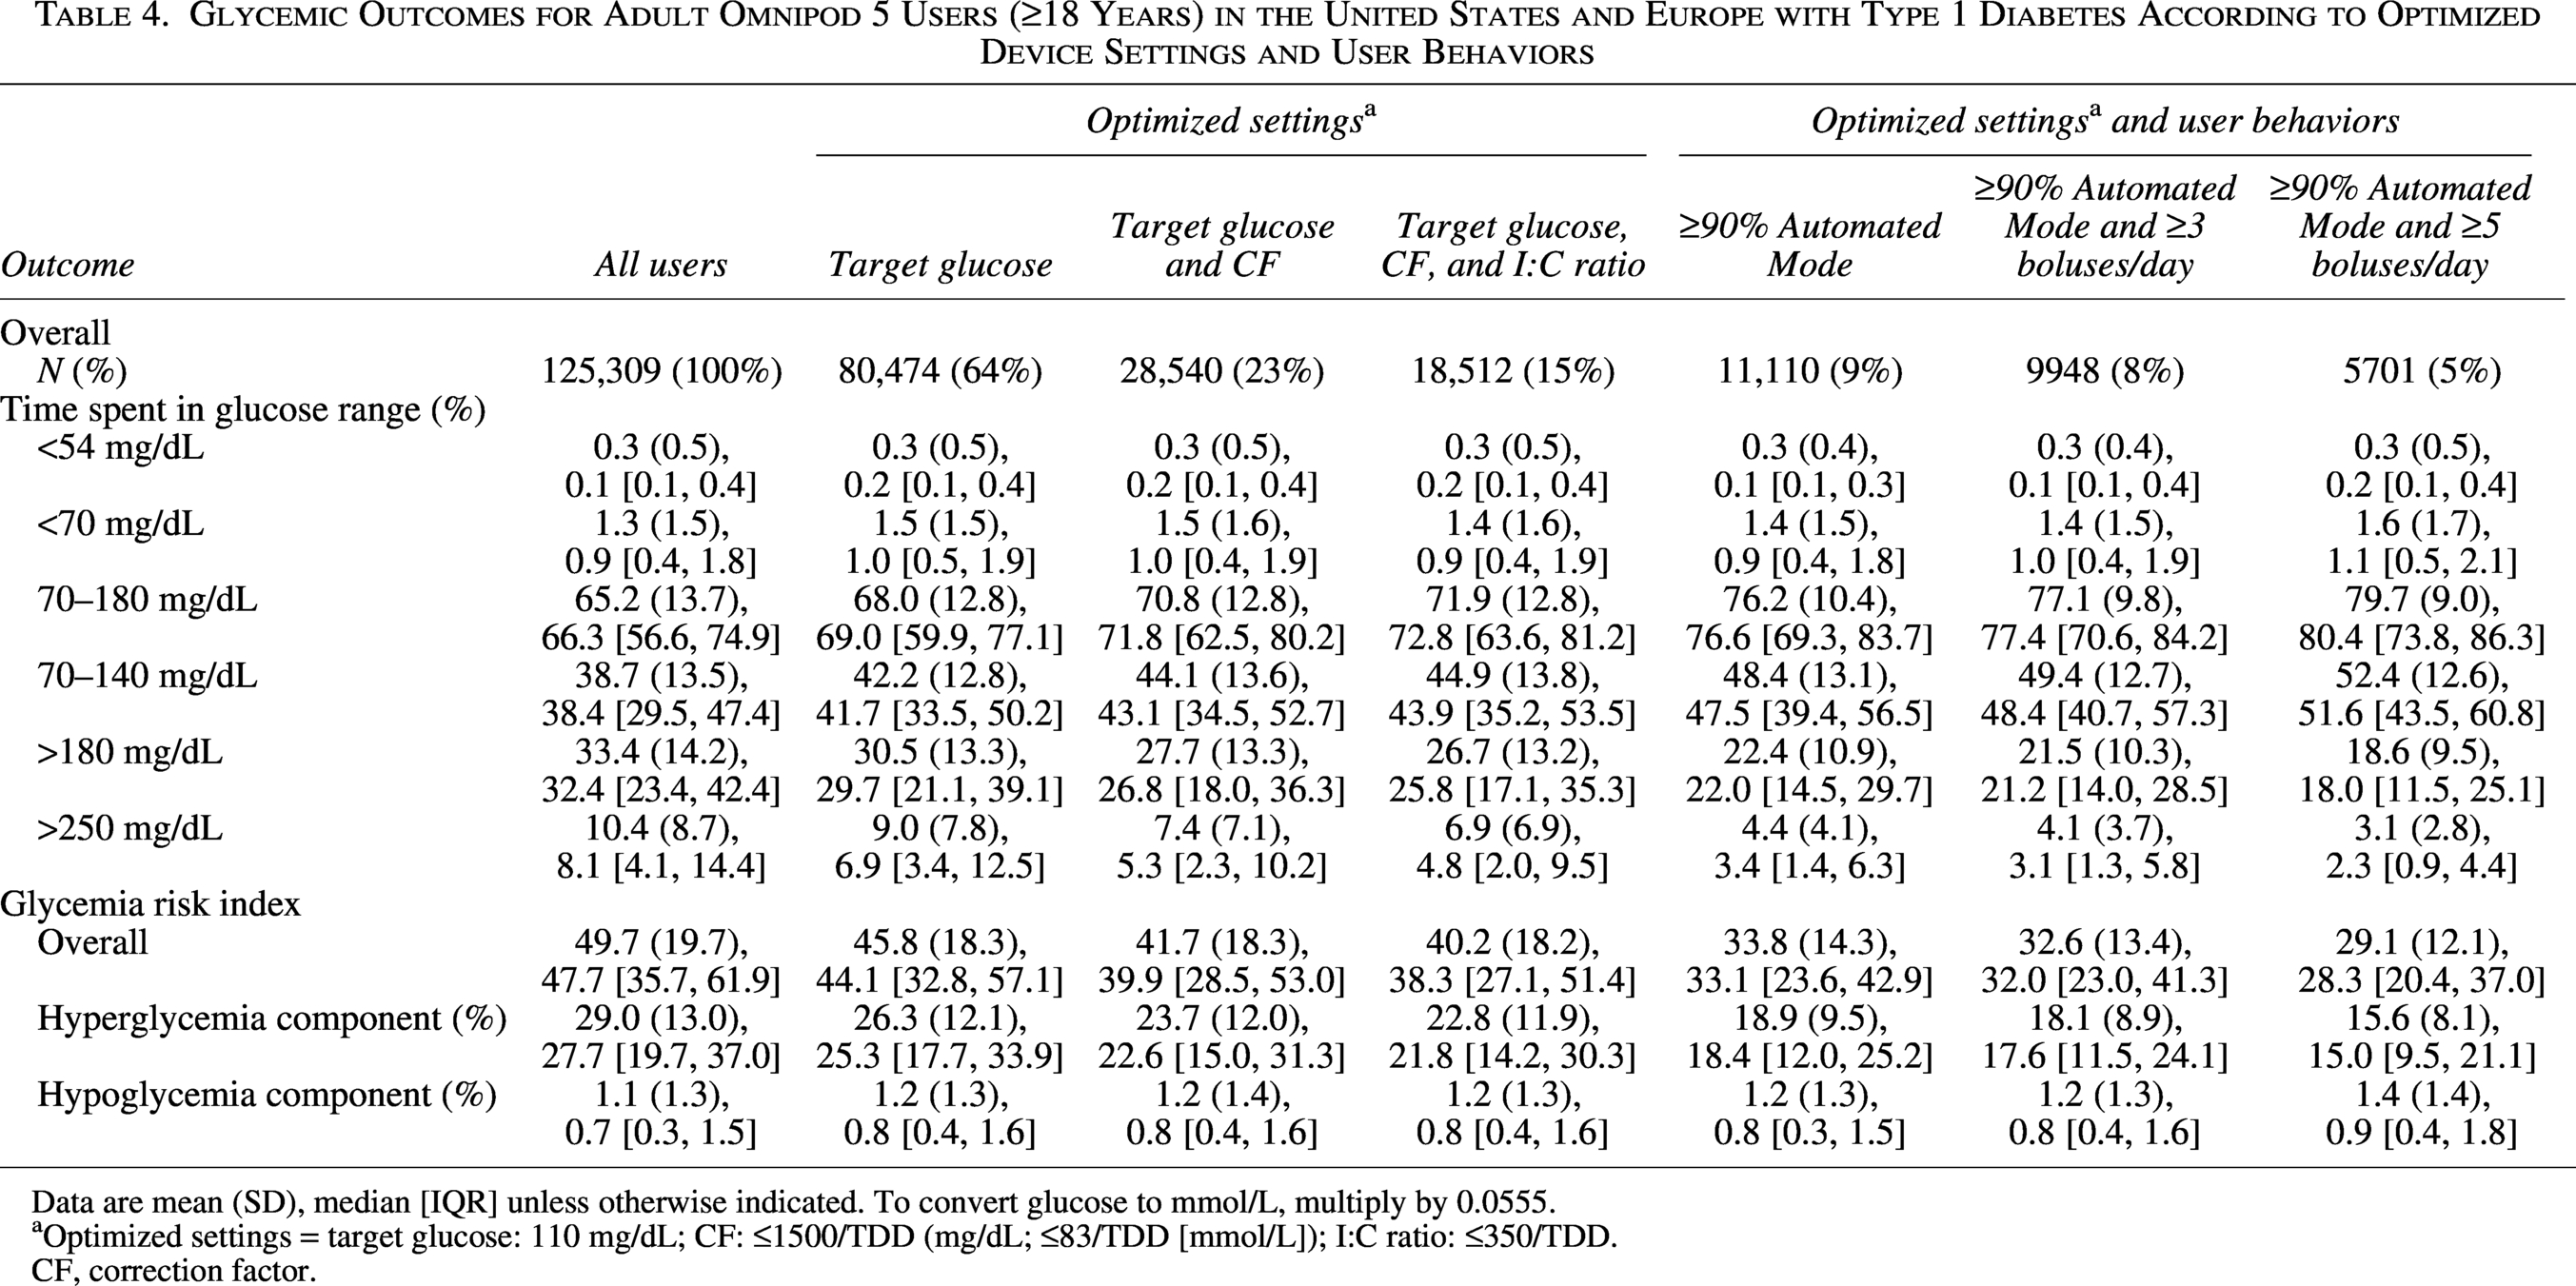
Data are mean (SD), median [IQR] unless otherwise indicated. To convert glucose to mmol/L, multiply by 0.0555.
Optimized settings = target glucose: 110 mg/dL; CF: ≤1500/TDD (mg/dL; ≤83/TDD [mmol/L]); I:C ratio: ≤350/TDD.
CF, correction factor.
Glycemic outcomes for
A similar trend was observed among pediatric users (ages 2–17 years), wherein median TIR increased from 62% for users overall to 64% with the use of lowest target glucose setting and further increased to 69% with a CF of ≤1500/TDD (mg/dL; ≤83/TDD [mmol/L]) and I:C ratio of ≤350/TDD (Table 5, Fig. 2B). Pediatric users who used optimized settings and maintained ≥90% time in Automated Mode achieved a median TIR of 78% and 80% with ≥3 or ≥5 boluses per day, respectively, with a median time <70 mg/dL (<3.9 mmol/L) of 1.5% and 1.7%. Results stratified by daytime and nighttime for pediatric users overall are presented in Supplementary Table S6, with users achieving a median overnight TIR of up to 89%. Glycemic outcomes among pediatric users in the United States and Europe stratified by country are presented in Supplementary Table S7, with similar outcomes observed across regions. Similar results were also observed among pediatric users previously treated with MDI (Supplementary Table S8).
Glycemic Outcomes for Pediatric Omnipod 5 Users (2–17 Years) in the United States and Europe with Type 1 Diabetes According to Use of Optimized Device Settings and User Behaviors
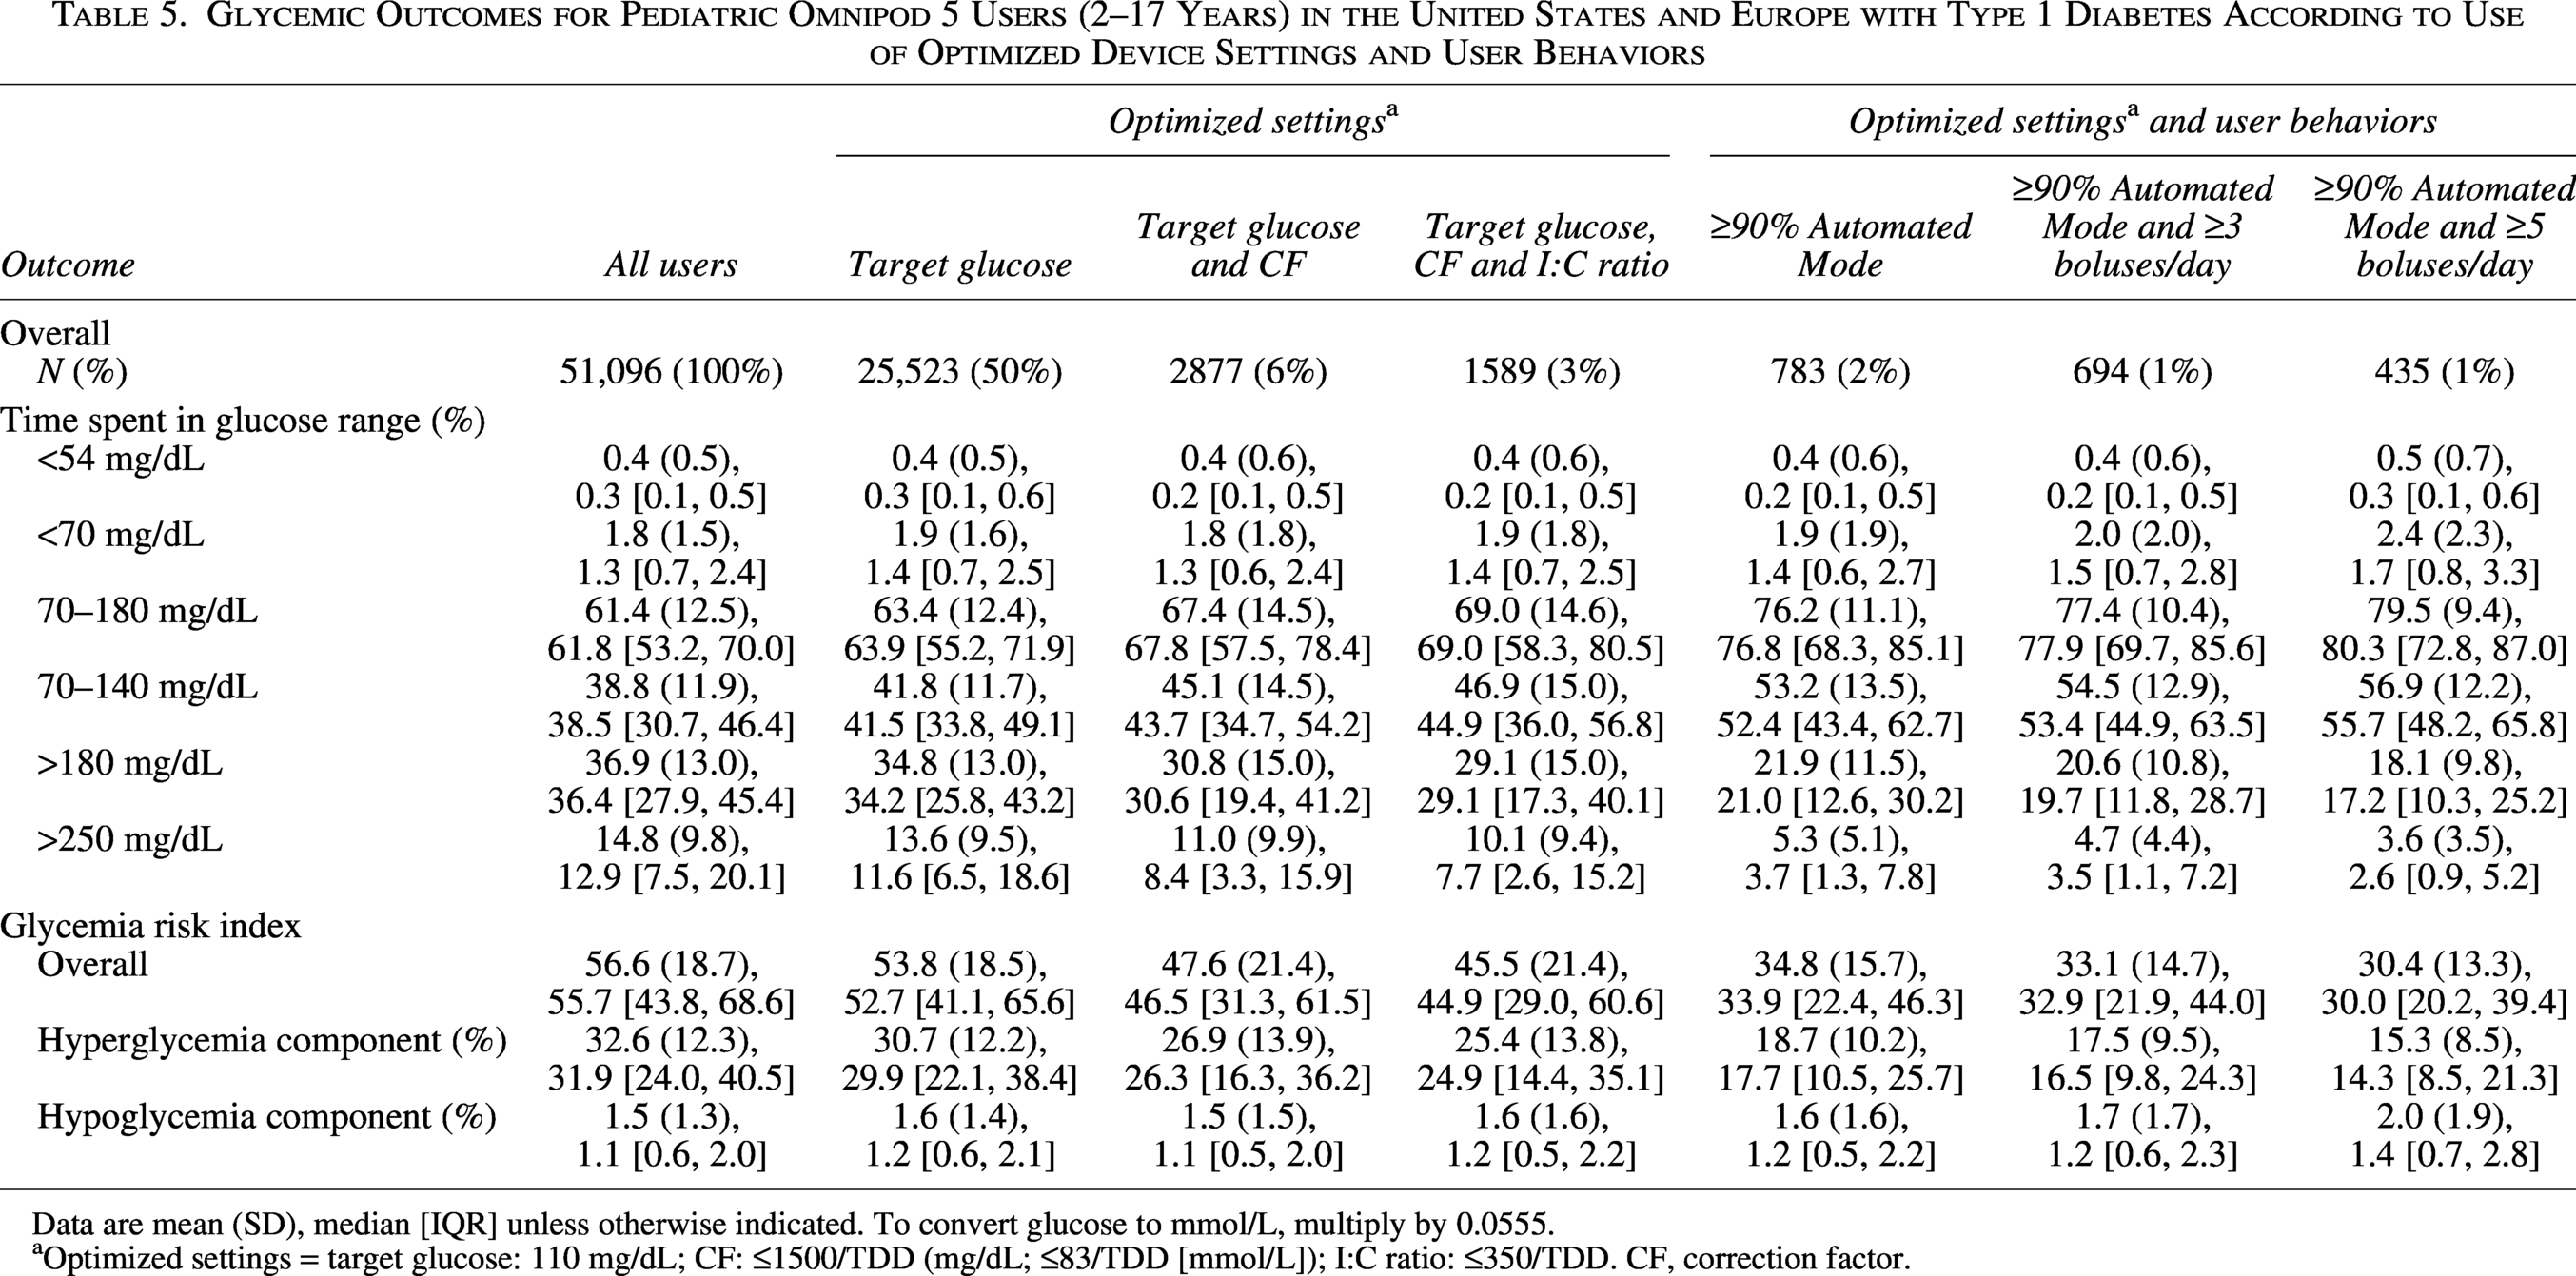
Data are mean (SD), median [IQR] unless otherwise indicated. To convert glucose to mmol/L, multiply by 0.0555.
aOptimized settings = target glucose: 110 mg/dL; CF: ≤1500/TDD (mg/dL; ≤83/TDD [mmol/L]); I:C ratio: ≤350/TDD. CF, correction factor.
Glycemic outcomes stratified by more granular age groups for pediatric users are presented in Supplementary Table S9. Median TIR values among those using optimized settings, ≥90% of time spent in Automated Mode, and bolusing ≥3 times per day showed age-related variability as expected, with a median TIR of 73%, 80%, and 76% for users aged 2–5, 6–12, and 13–17 years, respectively. Age-related variability in time <70 mg/dL (<3.9 mmol/L) was also observed in these user subgroups, with median values of 2.3%, 1.6%, and 1.2%, respectively. In those bolusing ≥5 times per day and meeting all other criteria, TIR increased to 81% and 80% for users aged 6–12 and 13–17 years, respectively, but remained unchanged in the youngest age group of 2–5 years (median TIR of 73%), and time <70 mg/dL (<3.9 mmol/L) remained low (median 2.3%, 1.8%, and 1.3% for users aged 2–5, 6–12, and 13–17 years, respectively). As use of the 110 mg/dL (6.1 mmol/L) target glucose setting was low among users aged 2–5 years (used by 14% of users in this age group overall), a similar analysis was conducted for those using either the 110 or 120 mg/dL (6.1 or 6.7 mmol/L) target glucose settings with results presented in Supplementary Table S10.
Discussion
This retrospective analysis of glucose sensor and device use data from 176,405 Omnipod 5 users from the United States, United Kingdom, Germany, and France is the first to comprehensively examine the programmable settings and user behaviors associated with meeting the clinical target for TIR with the Omnipod 5 System. Three programmable settings including the use of the 110 mg/dL (6.1 mmol/L) target glucose setting and the more aggressive I:C ratio of ≤350/TDD and CF of ≤1500/TDD (mg/dL; ≤83/TDD [mmol/L]), along with specific user behaviors including a greater number of daily user-initiated boluses and higher percentage of time in Automated Mode, were identified as key predictors of achieving TIR clinical target, while other factors such as DIA had no predictive value on TIR outcomes. This was consistent across all age groups and in both the United States and Europe. Overall, these findings suggest that prioritizing these five health care provider-modifiable and user-modifiable factors can support achievement of optimal glycemic outcomes with the Omnipod 5 System.
Previous studies have established that the Omnipod 5 System is safe and effective in improving glycemic outcomes in individuals with T1D as young as 2 years old.19–25 It has also been demonstrated that the use of different target glucose settings is both safe and effective, with use of the system’s 110 mg/dL (6.1 mmol/L) target glucose setting being associated with higher TIR and minimal hypoglycemia. 19 Consistent with these findings, using the lowest target glucose setting in this analysis was associated with a higher TIR compared with users overall for both adult and pediatric user subgroups. However, the present study also revealed that both the time spent in Automated Mode and the number of user-initiated boluses per day had a greater impact on TIR than the programmable device settings, underscoring the importance of education on user engagement and mealtime bolusing with AID systems. Across all user subgroups, Omnipod 5 users who utilized optimized device settings (110 mg/dL [6.1 mmol/L] target glucose setting, I:C ratio of ≤350/TDD, and a CF of ≤1500/TDD [mg/dL] or ≤83/TDD [mmol/L]) and maintained a high percentage of time in Automated Mode (≥90%) were able to achieve a high TIR whether they were bolusing ≥3 or ≥5 times per day, with minimal impact on hypoglycemia. As modifying user behaviors such as bolus frequency can be challenging, identifying programmable system settings that are readily adjustable during routine clinic visits represents an actionable opportunity for health care providers. Notably, among the >61,300 Omnipod 5 users achieving the TIR clinical target included in this analysis, the median CF and I:C ratios utilized by this cohort were higher, and thus less aggressive, than the thresholds suggested by our analysis, indicating that real-world settings tend to be less aggressive than what may be needed to achieve optimal glycemic outcomes at the population level. Furthermore, while many users in this group were able to reach glycemic targets with their current settings, the model-derived cutoffs represent settings most strongly associated with achieving optimal glycemic outcomes based on predictive performance for each factor.
The logistic regression modeling used in this study also revealed older age and residing in Europe as greater predictors of achieving >70% TIR. This is not surprising given that national registry data have demonstrated at the population level that people with T1D in the United States have higher HbA1c levels than people with T1D in Europe31,32 and HbA1c levels are higher among children and adolescents than older age groups across the lifespan.33,34 While the modeling results for demographic factors in this study are consistent with published registry findings, additional subgroup analyses revealed that strong glycemic outcomes were achieved with the use of optimized settings among Omnipod 5 users in the United States and Europe and across age groups, with median TIR values above the clinical target for this metric. Optimizing glycemic outcomes in children and adolescents with T1D presents numerous challenges, including variations in insulin sensitivity and a higher risk of hypoglycemia, particularly in very young children. Traditionally, a stronger I:C ratio and weaker CF are often utilized in this age group; however, this analysis supports that a more aggressive CF of ≤1500/TDD (mg/dL; ≤83/TDD [mmol/L]) along with a stronger I:C ratio is still associated with a higher TIR while maintaining a low time spent in hypoglycemia even in users from this vulnerable population.
Common insulin dosing conventions originated before the advent of AID systems and have historically been less aggressive than what our analysis suggests may be optimal for Omnipod 5 users. Over the years, various formulas for insulin dosing have been suggested. 35 For example, the 2022 American Association of Clinical Endocrinology Clinical Practice Guideline: Developing a Diabetes Mellitus Comprehensive Care Plan suggests initiating insulin therapy with an I:C ratio of 500/TDD and CF of 1800/TDD (mg/dL; 100/TDD [mmol/L]). 14 These formulas are commonly used but do not distinguish different dosing strategies based on insulin delivery modality (e.g., MDI vs. pump therapy). The Consensus Recommendations for the Use of Automated Insulin Delivery Technologies in Clinical Practice offers some recommendations for several AID systems. 12 For Medtronic AID systems, it is suggested to strengthen I:C ratios by 10% and select an active insulin time of 2–4 h. For Tandem Control-IQ users, it is recommended that basal insulin delivery total 50% of a user’s TDD and to utilize sleep mode. Basal insulin delivery totaling 50% of a user’s TDD is also recommended for the CamAPS FX system, along with a maximum bolus of 50% of a user’s TDD and a daily maximum of three times a user’s TDD. Finally, for the Omnipod 5 System, it is recommended to reduce the user’s basal rate if it is higher than 50% of a user’s TDD while in Manual Mode, with no specific guidance for Automated Mode as programmed basal rates do not influence insulin delivery when in Automated Mode. While these clinical guidelines acknowledge that there are system-specific nuances to insulin dosing, additional evidence is needed to refine system-specific guidance and move beyond the traditional insulin dosing conventions.
Several studies have started to examine optimal device settings for other AID systems. Real-world data from Control-IQ users demonstrated that more aggressive CF, I:C ratios, and basal rates were associated with a higher TIR. 35 Higher basal rates and more aggressive I:C ratios were also linked to a small increase in hypoglycemia, whereas more aggressive CF were associated with improved TIR without a corresponding rise in hypoglycemia. 35 In an observational study of the same system, CF were found to be the least aggressive in adolescents (2380/TDD in users aged 14–18) and most aggressive in adults aged ≥65 (1647/TDD). I:C ratios were most aggressive in the youngest age group (360/TDD in children aged 6–9 years) and the oldest age group (387/TDD in adults aged ≥65 years). 36 In real-world data from MiniMed 780G users, the use of a 100 mg/dL (5.6 mmol/L) glucose target and active insulin time of 2 h predicted higher TIR and TITR.37,38 Collectively, the observation that more aggressive settings (such as lower glucose targets and more aggressive I:C ratios) are associated with improved TIR is consistent with our findings for the Omnipod 5 System. However, these studies also highlight key algorithmic differences. For example, active insulin time, which is important for the MiniMed 780G system, was not a significant predictor of achieving the TIR clinical target with Omnipod 5 and may be in part due to differences in how this setting impacts insulin delivery between systems. With the Omnipod 5 System, the SmartBolus Calculator uses DIA to calculate insulin on board from past user-initiated meal and correction boluses; however, DIA does not impact insulin delivered by the algorithm. 39 Conversely, the MiniMed 780G system uses active insulin time to calculate insulin on board and adjust algorithm-delivered autocorrections accordingly. Similarly, programmed basal rates have an important role in insulin delivery with Control-IQ but do not influence insulin delivery with Omnipod 5 when the system is in Automated Mode. These differences highlight the added value of the present analysis to guide health care providers in optimizing outcomes specifically with the Omnipod 5 System.
Strengths of this analysis include its robust study population of over 176,000 real-world Omnipod 5 users across a broad range of ages and user characteristics, including data from both U.S. and international users. Another important aspect of the dataset used in this analysis is the automatic upload of device data for Omnipod 5 users, which eliminates the need for manual data uploads, minimizing the risk of omitting data from those who are less engaged in their care and/or attend clinic visits infrequently. Notably, median TIR values for the overall cohort of Omnipod 5 users meeting the inclusion criteria in this study are similar to those reported in several independent real-world studies of Omnipod 5 System use, supporting the generalizability of the findings.41–43 The present work is also novel in that it addresses a clear knowledge gap in the literature and provides actionable guidance for both health care providers and individuals with diabetes on setting optimization strategies to improve glycemic outcomes with the Omnipod 5 System. Adoption of optimized settings over time among Omnipod 5 users and their associated impact on glycemic outcomes is an important area for future research.
There are limitations to this analysis. Due to the nature of this user data, users’ age, type of diabetes, and demographic data are self-reported, and other demographic data are limited, with no information regarding users’ diet, exercise or physical activity, or other behaviors were available. These behaviors can impact glycemia and may influence which programmable settings are recommended to or utilized by an individual and how frequently setting adjustments are needed. Additionally, the logistic regression analysis was not conducted based on time of day, and some users may have programmable settings that differ throughout the day to account for varying insulin needs over a 24-h period. We also do not know the duration of diabetes in the users, which may have an impact on insulin needs given the impact of residual C-peptide on insulin sensitivity. Notably, this analysis did not address the reverse correction feature, which adjusts insulin delivery based on the user’s current glucose levels, as there are many factors that may contribute to how impactful this feature of the Omnipod 5 System may be on glycemia, particularly with respect to mealtime bolusing. Currently, the general recommendation is that this setting can be turned off, 39 and future work may more thoroughly evaluate the impact of reverse correction use on glycemic outcomes. Importantly, the optimized settings thresholds for CF and I:C ratio were defined based on the user’s TDD. These criteria tend to exclude highly insulin-sensitive users, who typically have higher CF and I:C ratios and lower TDD. As a result, this subset may have a lower risk of hypoglycemia and an inflated apparent TIR compared with the full cohort, which should be considered when interpreting generalizability. Finally, this was a population-level, retrospective, observational analysis and did not evaluate the impact of adjusting an individual user’s programmable settings, and it is important to note that setting adjustments should be done under the guidance of a health care provider on an individualized basis and must consider the context of each user’s schedule, behaviors, and unique needs.
Conclusions
This real-world analysis provides the first comprehensive evaluation of programmable settings and user behaviors associated with optimal glycemic outcomes in a large and diverse cohort of Omnipod 5 users with T1D. Maximizing time in Automated Mode and frequent user-initiated boluses were the two user behaviors that were the strongest predictors of reaching the clinical target for TIR, while use of the lowest target glucose setting and more aggressive I:C ratios and CF can further improve TIR with minimal hypoglycemia. In conclusion, the programmable optimized settings of a target glucose setting of 110 mg/dL (6.1 mmol/L), I:C ratio of ≤350/TDD, and a CF of ≤1500/TDD (mg/dL; ≤83/TDD [mmol/L]), along with user behaviors that reflect expected system use (≥90% time in Automated Mode, ≥3 boluses/day), can enable Omnipod 5 users to achieve a high TIR with minimal hypoglycemia.
Authors’ Contributions
A.S.: Conceptualization and writing—original draft. E.G.W. and T.T.L.: Conceptualization and writing—review and editing. D.D.: Formal analysis, methodology, and writing—review and editing. K.M.M. and G.P.F.: Conceptualization, methodology, supervision, and writing—review and editing. D.D. and K.M.M. had full access to the data in the study and took responsibility for the integrity of the data and the accuracy of the data analysis. All authors made the decision to submit this article for publication.
Ethical Considerations
The WCG IRB approved a request for a waiver of authorization for use and disclosure of protected health information for this study (U.S. users) and found the protocol to be exempt under 45 CFR § 46.104(d)(4) on January 4, 2022. To comply with the GDPR, only users in the United Kingdom, France, and Germany who provided GDPR-compliant consent were included in the analysis.
Consent to Participate
Users (or a parent or guardian for users aged <18 years) who provided consent at onboarding to the use of their anonymized and aggregated data for research purposes were included in the study. Device data were linked to a dataset of self-reported demographic information (type of diabetes, gender, age, prior therapy, etc.) collected as part of the onboarding process. All results are aggregated and anonymized, ensuring that no individual user can be identified.
Data Availability
The datasets generated and/or analyzed during the current study are not publicly available.
Footnotes
Acknowledgments
The authors extend their sincere thanks to the Omnipod 5 users whose data were included in this study. They thank Lindsey Conroy, PhD, and Maria Lee, MS, employees of Insulet Corporation, for medical writing and editorial services and article submission support, and Ciana Thorne, BS, an employee of Insulet Corporation, for preparing the graphical abstract. The authors are grateful to Lauren Huyett, PhD, an employee of Insulet Corporation, for providing advice on the data analysis and interpretation, and providing feedback on the article draft.
Author Disclosure Statement
D.D., K.M.M., and T.T.L. are full-time employees of and own stock in Insulet Corporation. E.G.W. reports research support from Abbott, Embecta, Insulet Corporation, Novo Nordisk, and Sanofi; has been a speaker for Abbott, AstraZeneca, Dexcom, Inc., Eli Lilly and Company, Insulet Corporation, Novo Nordisk, Sanofi, and Ypsomed AG; and served on the advisory panel for Abbott, Dexcom, Inc., Eli Lilly and Company, Embecta, Insulet Corporation, Medtronic, Novo Nordisk, Roche Diabetes Care, Sanofi, Sinocare Inc., and Tandem. G.P.F. conducts research sponsored by Medtronic, Dexcom, Abbott, Tandem, Insulet, Beta Bionics, MannKind, Sequel, and Lilly and has been a speaker/consultant/ad board member for Medtronic, Dexcom, Abbott, Tandem, Insulet, Beta Bionics, MannKind, Sequel, and Lilly. A.S. has nothing to disclose.
Funding Information
This study was funded by the
Supplemental Material
References
Supplementary Material
Please find the following supplemental material available below.
For Open Access articles published under a Creative Commons License, all supplemental material carries the same license as the article it is associated with.
For non-Open Access articles published, all supplemental material carries a non-exclusive license, and permission requests for re-use of supplemental material or any part of supplemental material shall be sent directly to the copyright owner as specified in the copyright notice associated with the article.