



Abstract
Despite the importance of obtaining a university degree, retention rates remain a concern for many universities. This longitudinal study provides a multi-domain examination of first-year student characteristics and behaviors that best predict which students graduate. Graduation status was assessed seven years after students entered university. Participants (N = 1017; 71% female; mean age in Year 1 was 19 years) enrolled in a Canadian mid-sized university completed a survey, provided their enrollment status over the next 6 years (regardless of whether they left university), and consented to have their grades and status provided by the Registrar. Overall, 79% of students graduated by Year 7 (44% in 4 years). The strongest predictor of graduation was first-year grades. Social engagement in the university also predicted graduation. Surprisingly, mental health was not a significant predictor of graduation. Only a minority of students may experience mental health difficulties to such an extent that it affects their ability to succeed at university.
Higher education is linked to societal economic growth and psychological adjustment (e.g., UNESCO; Valero & Van Reenen, 2019) and demand for postsecondary education in the workforce is increasing. In fact, in Canada, the number of jobs filled by individuals with a university degree increased from 1.9 million in 1990 to 4.4 million in 2010; during the same time frame, the number of jobs filled by individuals with high school or less declined by 1.2 million (Association of Universities & Colleges of Canada, 2011). Further, university graduates in the United States on average earned 56% more than high school graduates in 2015 (A. Davis et al., 2015). The increasing importance of postsecondary education has resulted in higher education becoming a standard experience for many young adults (Statistics Canada, 2011). Yet approximately 15% to 40% of Canadian students drop out of university prior to graduation and many are left with substantial debt (Nguyen, 2012; Statistics Canada, 2007; Wei & Horn, 2013). In the United States, only 62% of students who began their post-secondary education in 2012 completed their degree by 2018 (National Center for Education Statistics, 2020). More longitudinal research is needed to address the factors that contribute to low retention rates, particularly long-term studies that take into account students who take more than 4 or 5 years to graduate, and which include a comprehensive multi-domain set of factors to predict which students ultimately graduate or drop out of university. The aim of the present seven-year study is to address this gap.
Theories of Retention
Several theories of retention highlight that academic engagement, personal characteristics, and lack of social engagement in the institution are critical components in predicting retention [see Tinto’s (1975) Student Integration Theory; Bean’s (1980, 1983) Student Attrition Model; Astin’s (1999) Theory of Involvement; also Pascarella & Terenzini, 2005]. Bean’s Model also highlights that behavioral indicators can serve as proxies for student integration and lack of involvement (e.g., hours spent at off-campus jobs). Thus, students who are integrated into the social fabric of the university and feel a sense of belonging may have more commitment to their school, perhaps fostering retention (Strayhorn, 2018). Psychological adjustment (e.g., depression, anxiety, stress; see Gruttadaro et al., 2012; Wintre & Bowers, 2007) and demographic characteristics (e.g., parental education; Robbins et al., 2004) may also play a role in student retention. Thus, a full understanding of retention requires the consideration of a variety of indicators across multiple domains: academic engagement, social engagement at university, social support, student behaviors, and psychological adjustment.
Academic Engagement
Academic engagement consistently is associated with retention (e.g., Robbins et al., 2004). Not surprisingly, students with higher grades in high school and first year university are more likely to graduate from university (e.g., DeBerard et al., 2004; Galla et al., 2019; Pike & Saupe, 2002). Only a few studies, however, have examined whether the type of courses taken in the senior high school years affect university retention. High school classes can vary in the expectations of learning goals (e.g., Long et al., 2012). Advanced high school courses (e.g., Advanced Placement) are designed to provide a more challenging curriculum and prepare students for university (e.g., Adelman, 2006), and students who take these courses are more likely to complete their university degree than those who take less demanding courses (e.g., Adelman, 2006; Long et al., 2009, 2012). In Ontario, Canada (the location of the present study), high school students can choose to take a varying proportion of University (U) or University/College (mixed or M) courses (note that in Ontario, college is distinguished from university, with college typically referring to a technical, trades, applied arts, or applied technology school). Like Advanced Placement courses, U courses are designed to prepare students for university by placing an emphasis on theory, research, and independent learning (Ontario Ministry of Education, 1999). Despite this, students may also take a proportion of M courses which provide students with both theoretical and practical, applied knowledge. Students who take a higher proportion of courses that are designed to prepare students for university courses, however, may be better prepared to succeed in university.
Other relevant aspects of academic engagement are academic goal setting, class attendance, and time management (Robbins et al., 2004). Those who set higher academic goals are more likely to persist beyond the first year of university (e.g., Ishitani & DesJardins, 2002; Mutter, 1992; Robbins et al., 2006). Less attention has been paid to time management and attendance as predictors of retention; however, these factors have been found to be associated with higher academic achievement (e.g., Bowman et al., 2019; Richardson et al., 2012). Of concern, van der Meer et al. (2010) found that many students struggle with managing their course work; thus, time management may be an important skill underlying student success that could be targeted to improve students’ ability to persist throughout their degree. Additionally, regularly attending classes is a predictor of higher grades (Credé et al., 2010) and retention (Arria et al., 2015). Thus, students’ academic engagement appears to be essential for successfully completing university.
Social Engagement at University
Social engagement is a domain that captures the extent of students’ integration into the social aspects of university (e.g., making new friends on campus, engagement in school clubs; Robbins et al., 2004). Indeed, when individuals are integrated into the school environment, such as through club involvement, they may be more likely to feel a sense of belonging and commitment to the university (Astin, 1975; Foubert & Urbanski, 2006), which could contribute to social integration and retention (Gallagher & Gilmore, 2013; Strayhorn, 2018).
Creating meaningful social ties and friendships specifically at university may be particularly important to foster a sense of belonging at school (Strayhorn, 2018). For example, students with more campus friends (Bronkema & Bowman, 2019) and students with stronger relationships at university were less likely to drop out after one year (Bers & Smith, 1991; Napoli & Wortman, 1998; Nora et al., 1996) and after three years (Allen et al., 2008) than those with poorer relationships at university (see also Robbins et al., 2006). At the same time, however, a high frequency of time spent socializing with friends has been associated with lower grades (Astin, 1993), a concern given that academic grades are a strong predictor of retention (e.g., DeBerard et al., 2004; Galla et al., 2019.An assessment of social ties, therefore, is critical to any study of retention.
Interactions with professors also are an important aspect of student engagement within the university environment. Students value professors who are approachable, responsive, and supportive (Faranda & Clarke, 2004), as they encourage student attendance, classroom participation, and motivation (Benson et al., 2005
Social Support
While social engagement at university is thought to be an important domain involved in retention, the role of social support (e.g., general friendship quality) in general (not necessarily in university) is less clear. Tinto (1975) suggests that successful social integration in university involves less reliance on previous relationships (e.g., high school friends). Goguen et al. (2010) found that friendship quality with a new friend at university predicted persistence to second year while friendship quality outside of university did not (see also Swenson et al., 2008). Success in university may not just be about having friends in general, but rather about being socially engaged at the university. Given this, it is important to examine both social ties at university and general friendship quality together in retention analyses to understand their unique contribution to student retention.
Psychological Adjustment
The importance of psychological adjustment for retention also has been highlighted (e.g., depressive symptoms, anxiety, stress; Boehm et al., 2016; Wintre & Bowers, 2007). Notably, Gruttadaro et al. (2012) found that students who dropped out of university reported that poor psychological adjustment was an important factor in their decision to leave university (see also Arria et al., 2013; Faas et al., 2018; Hunt et al., 2010).
Additionally, sleep problems have been found to predict depression and anxiety (Dinis & Bragança, 2018; Doane et al., 2015), poor academic performance and lower odds of graduation (Chen & Chen, 2019; Gaultney, 2016). Gaultney, however, reported inconclusive findings. Risk for a sleep disorder significantly predicted three-year attrition when considered alone, but only approached significance in the presence of other variables. Thus, it is unclear whether sleep problems are an important predictor of retention when considered among a comprehensive set of predictors.
Student Behaviors
While it is important to assess students' perceptions (e.g., perceptions of sleep problems), behaviors that students engage in also could impact university success. For instance, students who stay up late (i.e., have later bedtimes) have poorer academic performance (e.g., Galambos et al., 2013; Taylor et al., 2013; Trockel et al., 2000), although bedtimes have not been directly tied to retention. Another behavior that is common among university students is substance use (e.g., Schulenberg & Maggs, 2002). Arria and colleagues found that students who engaged in greater substance use were more likely than their peers to leave university prior to graduation (see also Patrick et al., 2016). Therefore, high substance use also may be a risk factor for student retention.
Working at a job during university might also play a role in university success, although the findings are inconsistent. Some researchers have found that students who work long hours during university take longer to graduate or have lower academic grades than those who work less hours or do not work (Bozick, 2007; Miller et al., 2008). Curtis and Shani (2002) also found that students who work during university indicated that they have less time to study, miss more classes, and believe they could do better in their classes if they were not working (see also Greene & Maggs, 2015). Other researchers, however, have found that having a job during university does not impact grades or actually improved grades compared to those who do not have a job (e.g., Dundes & Marx, 2006; Mounsey et al., 2013). Thus, it is not clear whether working a job will impact retention; however, given that a large percentage of university students decide to work during the academic term (Curtis & Shani, 2002; J. W. Davis, 2012), it is important to identify whether this behavior plays a role in university success.
The Current Study
The current study investigated university retention using a comprehensive set of predictor variables from a wide variety of domains. Previous research often has been hindered by a focus on only a few domains or by only capturing a limited scope of students' time at university. Longitudinal research following students until time of graduation is rare, as most studies focus on success within the first two years of postsecondary study (e.g., Bowman et al., 2019; Morrow & Ackermann, 2012). Of the longitudinal studies which go beyond first-year retention, length of time to graduate often is not examined beyond the expected time of graduation. Failure to follow students beyond the fourth year of study does not capture the total population of students who graduate, including those who take longer to complete their program (see Wintre & Bowers, 2007, for a six-year study of retention, although predictors of retention primarily were assessed only in the first month of university). Additionally, for students who leave university prior to graduation, it is important to assess when they leave university. The current study addresses these gaps by following students’ enrollment status for seven years (including if they left university). This allowed us to distinguish between students who truly dropped out of university versus those who eventually graduated but took time off, took longer to finish their degree, or transferred to another university. We also assessed student characteristics and behaviors in the winter term of their first year in order to assess their adjustment to university.
The first goal of our study was to investigate which first-year student characteristics and behaviors best predict graduating versus leaving prior to graduation. Theories and past research identify that academic engagement, social engagement, and psychological adjustment (i.e., mental health) may be critical indicators of retention. Including this comprehensive set of variables in one analysis, however, is critical in order to examine which factors uniquely predict retention when put in the context of the other variables.
The second goal of this study was to examine predictors of the student characteristics and behaviors that were found to predict graduating versus leaving prior to graduation in our first question. For example, if academic grades in first-year university is the best predictor of retention, then what student characteristics and behaviors best predict higher grades? Finally, for students who leave university prior to graduation, we also were interested in what characteristics and behaviors best predict the length of time they spend in university. Findings from this study will help provide recommendations to both students and universities on what factors best predict retention.
Method
Participants
Participants were 1095 undergraduate students (71.1% female; note that the percentage of females for the university was 58%) enrolled at a mid-sized university in southern Ontario, Canada, who completed a survey annually for 7 years, regardless of whether they continued to enroll as students. For the present study, we focused specifically on the student characteristics and behavior survey data from the first year of the study as all of the participants were enrolled in the university and completed the survey that year (in contrast to later years, when participants who dropped out of university no longer could answer school-related questions when they filled out our survey). At the time of entry to the study, all participants were in the winter term of their first year of university (Mage = 19 years, SD = .93). Data on socioeconomic status indicated that mean levels of education for mothers and fathers (or guardians) fell between “some college, university, or apprenticeship program” and “completed a college/apprenticeship and/or technical diploma.” The sample was comprised predominantly of domestic Canadian students (88%), and common ethnic backgrounds of these students other than Canadian were British (19%), Italian (16.8%), French (9.5%), and German (9%), consistent with the broader demographics for the region (Statistics Canada, 2006). The majority of international students were from Asia (36.1%), European Union (15.7%), the Caribbean (10.2%), and Africa (10.2%).
Of the 1095 study participants, 38 (3.4%) transferred to a community college prior to graduation, 13 (1.19%) were still registered as students at the university in Year 7, 12 (1%) were registered for 6 years but had not graduated as of Year 7, and 15 (1.37%) transferred to another university prior to graduation but whether they graduated was unknown. These 78 students were not included in the analyses, leaving a final sample of 1017 participants in the study.
Procedure
Students in first-year university were invited to complete a survey examining stress and coping in university through posters, classroom announcements, website postings, and residence visits. Any student enrolled in first-year university was eligible to participate in the present study regardless of academic discipline. The sample was generally representative of the university population (i.e., proportion of students in the various academic departments, etc.). Participants were given either monetary compensation or course credit for their participation. The study was approved by the University Research Ethics board prior to survey administration, and active informed consent was obtained from all participants. Participants also provided active consent to have their university grades and enrollment status (graduated, dropped out, etc.) accessed from the Registrar (98% gave consent).
Missing Data
Missing data for the Year 1 variables were assessed prior to analyses. The average missing data was low (4.05%) and occurred because some participants did not complete the entire survey in Year 1. Missing data were imputed using the expectation-maximization (EM) algorithm, with all study variables and demographics included in the analyses. EM retains cases that have missing data, thus avoiding the biased parameter estimates that can occur with pairwise or listwise deletion (Schafer & Graham, 2002).
Measures
All measures were assessed at Time 1 with the exception of high school course and grade information, first-year university grades, and enrollment status.
Enrollment Status
Whether participants graduated or dropped out of university was accessed from the Registrar at Year 7 or from survey data in the case of students who left the university prior to graduation.
Demographics
A demographic questionnaire was administered to assess sex (1 = male, 2 = female) and parental education. Parental education was assessed with one item per parent, on a scale of 1 = did not finish high school to 6 = professional degree, which was averaged for participants reporting on both parents (r = .42). Unfortunately, race was not assessed in the study.
Academic Engagement
Admitting Average
The six high school course grades that were used for calculating the admitting average were accessed from the university’s Registrar’s Office with permission from the participants.
Type of High School Courses
Information about the number of senior high school courses taken at the “college or university” versus “university” level were accessed from the university’s Registrar’s Office with permission from the participants. We calculated the proportion of “university” to “university or college” high school courses for each participant. Higher scores indicated a higher proportion of “university” level courses.
First-Year Academic Average
Students’ grade point average across all the courses they took in first year of university was accessed from the university’s Registrar’s Office with permission from the participants.
Goals for University
Assessment of participants’ goals for university was compiled from two questions on the Student Adaptation to College Questionnaire (SACQ, Baker & Siryk, 1999; “I have well-defined goals in terms of what I want to accomplish in school”, “I know why I’m in university and what I want out of it”; -see Dahmus et al., 1992 for information on SACQ reliability and validity). The questions were measured on a 5-point Likert scale ranging from 1 = not at all like me to 5 = completely like me (r = .50). Responses to the two questions were averaged, with higher scores indicating more well-defined goals.
Time Management
Time management was assessed with six items from the SACQ (Baker & Siryk, 1999; “I have been keeping up to date on my academic work”, “I have trouble concentrating when studying”, “I start my assignments and studying for tests early”, “I think my time-management skills are good when it comes to schoolwork”, “I have trouble getting started on homework”, “I do not work as hard as I should”), measured on a 5-point Likert scale ranging from 1 = not at all like me to 5 = completely like me (α = .86). A principal components analysis indicated that these items formed one factor (with factor loadings ranging from .73 to .83). Items were recoded as appropriate and averaged such that higher scores indicated better time management.
Skipping Class
The frequency of skipping class was assessed with the question
Social Engagement
Social Ties at University
The social ties construct was compiled from three questions on the SACQ (Baker & Siryk, 1999; ‘‘I have several close social ties at university’’, ‘‘I am satisfied with how much I am participating in social activities at university’’, and ‘‘I am meeting people and making friends at university”), assessed on a 5-point Likert scale ranging from 1 = not at all like me to 5 = completely like me (α = .68). A principal components analysis indicated that these items formed one factor (with factor loadings ranging from .74 to .82). Responses were averaged, with higher scores representing greater university social ties.
Club Activities
The frequency of engaging in clubs during the first year of university was based on the question: “Since the previous September, how often have you participated in school or community clubs that are not sports clubs?” Responses were recorded on a 6-point Likert Scale ranging from 1 = never to 6 = several times a week. Higher scores indicating greater frequency of participation in club activities.
Professor/Student Interaction
Level of satisfaction with the amount of professor/student interaction was created with the question: “I was satisfied with the level of student-professor interaction that I experienced during my first year of university.” It was coded on a Likert scale, ranging from 1 = strongly agree to 5 = strongly disagree. Scores were recoded such that higher scores indicated greater satisfaction with professor/student interaction.
Social Support
General Friendship Quality
This assessment was based on the peer component of the well-validated Inventory of Parent and Peer Attachment (Armsden & Greenberg, 1987). Peer attachment was assessed using 18 items (e.g., “My friends are concerned about my well-being”, “My friends listen to what I have to say”, “I can count on my friends when I need to get something off my chest”, “I trust my friends”) measured on a 4-point Likert scale ranging from 1 = almost always or always to 4 = almost never or never (α = .91). Responses were averaged such that higher scores represented higher general friendship quality.
Behaviors
Bedtime During the Week
Participants were asked to indicate what time they “normally fall asleep.” Higher scores indicated later bedtime.
Substance Use
Substance use was measured by combining responses to three questions related to alcohol and marijuana use. Frequency of past year alcohol use was assessed on an 8-point Likert scale ranging from 1 = never to 8 = every day, and “average consumption per alcohol use event” was scored on a 6-point Likert scale ranging from 1 = less than 1 drink to 6 = over 10 drinks. Participants also were asked whether “In the past twelve months, how often did you use hash, marijuana (weed, joint)”, coded on a 6-point Likert scale ranging from 1 = never to 6 = every day. The questions were averaged together (with frequency of alcohol recoded to a 6-point scale) to form a substance use composite. Higher scores indicated higher levels of substance use (α = .79).
Paying Job
Prevalence of working at a paying job during Year 1 was assessed with the question “Did you work at a paying job during the first year of university”. Responses were scored as 1 = no and 2 = yes. The frequency of hours worked also was assessed with the question: If yes to working at a paying job, “on average, how many hours do you work each week?”
Adjustment
Depressive Symptoms
Depressive symptoms were assessed using the well-validated Center for Epidemiologic Studies Depression Scale – CES-D (Radloff, 1977). The 20-item scale (e.g., “I felt depressed”, “I felt sad”, “I felt like doing nothing”) was measured on a 5-point Likert scale ranging from 1 = none of the time to 5 = most of the time. Higher scores indicated higher levels of depressive symptoms (α = .91).
Behavioral Inhibition
Behavioral Inhibition Scale (BIS) was assessed using the well-validated BIS/BAS scale (Carver & White, 1994), and was used as a proxy for measuring anxiety (Gray, 1970, 1982). The BIS assesses sensitivity to unpleasant stimuli/situations. It included 7 items (e.g., “I worry about making mistakes”) measured on a 4-point Likert scale ranging from 1 = strongly disagree to 4 = strongly agree. Higher scores indicated higher behavioral inhibition (α = .72).
Stress
To assess stress, participants completed a 25-item measure of daily hassles from Willoughby (2008). Participants were asked to indicate the frequency of being bothered by daily hassles with friends, peers, and work (e.g., “not having enough money”, “not having enough time”). Responses ranged from 1 = almost never bothers me to 3 = often bothers me. Scores were averaged such that higher scores represented higher stress (α = .84). This measure has demonstrated good internal consistency among undergraduates (Hamza & Willoughby, 2013).
Sleep Problems
Sleep problems were assessed using the Insomnia Severity Index (ISI; Morin, 1993 – see Bastien et al., 2001 for a validation study of the ISI). Four items assessed the severity of symptoms: difficulty falling asleep, staying asleep, problems waking up too early, and problems staying awake, with responses ranging from 1 = no problem to 5 = very severe problems. Additionally, one item assessed the degree to which participants were satisfied with their sleep patterns on a 5-point Likert scale, ranging from 1 = very satisfied to 5 = very dissatisfied. The extent of participant’s daytime impairment as a result of their sleep patterns also was assessed, based on a 4-point Likert scale, ranging from 1 = rarely interferes to 4 = very often interferes (α = .77). Responses were averaged (with sleep pattern responses recoded to a 5-point scale) such that higher scores indicated more sleep problems.
Statistical Analyses
Analyses were conducted with R (R Core Team, 2017). The first goal of this study was to assess the prevalence of graduating versus dropping out of university. University Registrar data (or survey data in the case of students who left the university) were accessed and coded as graduated or dropped out. We also coded when participants left university (i.e., after 1st, 2nd, 3rd year, etc.). These data formed the basis first for a logistic regression analysis examining which Year 1 student characteristics and behaviors best predicted dropping out rather than graduating, and then a regression analysis examining which Year 1 student characteristics and behaviors best predicted staying longer at university prior to leaving (for example, staying into the 4th year before dropping out). For students who worked at a paying job in their first year of university, we also examined whether working longer hours at the job was predictive of dropping out of university. The second goal of this study was to examine the student characteristics and behaviors that were associated with the main predictors of graduating versus dropping out. To address this question, a series of regression analyses were conducted. All analyses included sex and parental education as covariates.
Results
Preliminary Analyses
Enrollment status indicated that 805 students (79% of the sample) graduated within the 7 years, with 56% of these 805 students graduating by the end of Year 4 and 37% by the end of Year 5. In contrast, 212 students (21% of the sample) dropped out of university prior to graduating, with 38%, 37%, 14%, and 12% leaving at the end of the 1st, 2nd, 3rd, and 4th year of university, respectively.
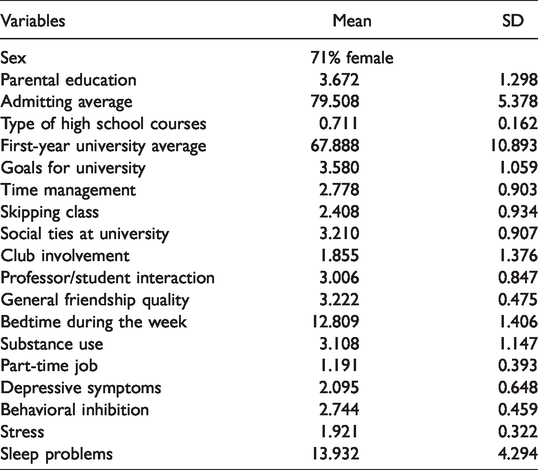
Descriptive statistics for the study variables are listed in Table 1. Figure 1 shows the correlations among the study variables. The strongest correlations were between admitting average (from high school) and first-year university grades, r = .570, between depressive symptoms and stress, r = .541, and between depressive symptoms and sleep problems, r = .532. Being female was moderately correlated with stress, r = .332 – all other correlations between the study variables and either sex or parental education were small or trivial (Cohen, 1988). There were no issues with multicollinearity among the study variables.
Means and Standard Deviations for Year 1 Study Variables.

Correlation Table of First-Year Student Characteristics and Behaviors.
Primary Analyses
What student characteristics and behaviors best predict graduating versus leaving university prior to graduation?
A binary logistic regression was conducted to examine which variables best predicted graduating versus dropping out of university. The regression analysis was significant, χ2(19) = 228.193, p < .001, R2 = .243. See Table 2 for regression results. The strongest predictor of dropping out by far was having lower first-year academic grades, β = −1.163, p < .001, followed by lower involvement in clubs, β = −0.213, p = .041, and fewer social ties, β = -0.209, p = .043. No other variables were significant.
Results of Logistic Regression Predicting Graduation Versus Dropped Out.
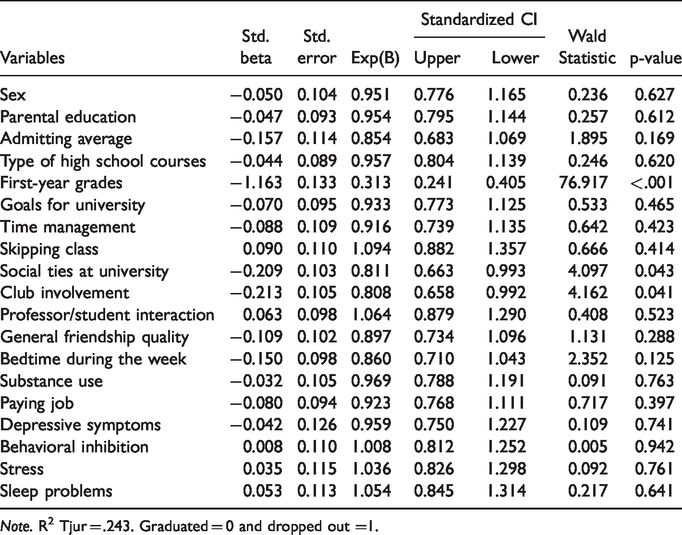
Note. R2 Tjur = .243. Graduated = 0 and dropped out =1.
For students who leave university prior to graduation, what characteristics and behaviors best predict leaving later?
A regression analyses examining whether any student characteristics and behaviors predicted how long students stayed at the university before dropping out (e.g., after 1st year, 2nd year, etc.) was not significant, F(19,192) = 1.193, p = .267.
Did the number of hours that students work at a paying job predict whether students graduated or dropped out of university?
For students who indicated that they worked at a paying job in the first year of university, a logistic analysis was conducted to see if the number of hours worked each week predicted graduating versus dropping out. The analysis was not significant, χ2(3) = 1.943, p = .584, R2 = .010
What student characteristics and behaviors are associated with academic grades in Year 1?
Given that first-year academic grades were a strong predictor of whether a student graduated versus dropped out, we conducted a regression analysis to explore which student characteristics and behaviors were associated with higher first-year grades. The regression analysis was significant, F(18,998) = 51.175, p < .001, R2 = .480. See Table 3 for regression results. The variables which had significant associations with academic grades in Year 1, in order of effect size, included a higher admitting average (senior high school grades), β = 0.444, p < .001, less skipping of classes, β = -0.160, p < .001, higher behavioral inhibition, β = 0.137, p < .001, fewer social ties, β = −0.112, p < .001, fewer depressive symptoms, β = −.107, p = .001, not working at a paying job, β = −0.093, p < .001, more satisfaction with level of professor/student interaction, β = 0.093, p < .001, better time management, β = 0.092, p = .001, greater proportion of “university” level courses in high school, β = 0.088, p < .001, higher school goals, β = 0.071, p = .005, and less substance use, β = −0.060, p = .030.
Results of Regression Predicting First-Year University Grades.
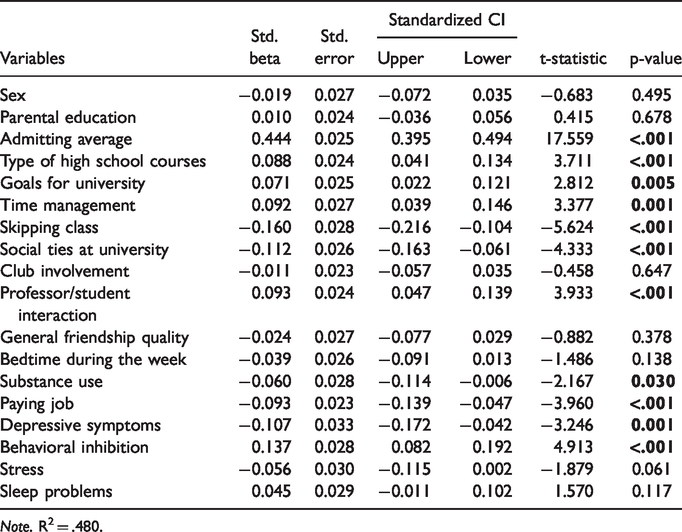
Note. R2 = .480.
What student characteristics and behaviors are associated with social ties at Year 1?
Given that social ties in university also predicted whether a student graduated versus dropped out, we conducted a regression analysis to explore which student characteristics and behaviors were associated with higher university social ties. The regression analysis was significant, F(18,998) = 16.826, p < .001, R2 = .233. See Table 4 for regression results. The variables which had significant association with social ties in Year 1, in order of effect size, included higher general friendship quality, β = 0.218, p < .001, higher goals for university, β = 0.185, p < .001, lower first-year academic average, β = −0.165, p < .001, higher substance use, β = 0.138, p < .001, not working at a paying job, β = −0.129, p < .001, higher admitting average, β = 0.113, p = .001, higher club involvement, β = 0.097, p = .001, more skipping of classes, β = 0.099, p = .005, less stress, β = −0.086, p = .017, more satisfaction with level of professor/student interaction, β = 0.057, p = 049, and greater parental education, β = 0.057, p = .048.
Results of Regression Predicting Social Ties at University in Year 1.
Note. R2 = .233.
What student characteristics and behaviors are associated with club involvement at Year 1?
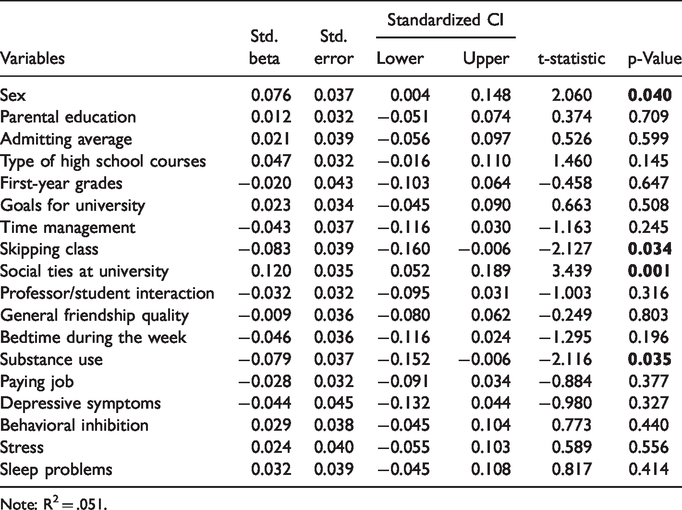
Club involvement also predicted dropping out of university instead of graduating. We conducted a regression analysis examining which student characteristics and behaviors were associated with higher club involvement in the first year of university. The regression analysis was significant, F(18,998) = 2.952, p < .001, R2 = .051, although the effect size was trivial. See Table 5 for regression results. The variables which had significant associations with greater club involvement in Year 1, in order of effect size, included higher social ties at university, β = 0.120, p = .001, less skipping of classes, β = -0.083, p = .034, less substance use, β = -0.079, p = .035, and being female, β = 0.076, p = .040.
Results of Regression Predicting Club Involvement in Year 1.
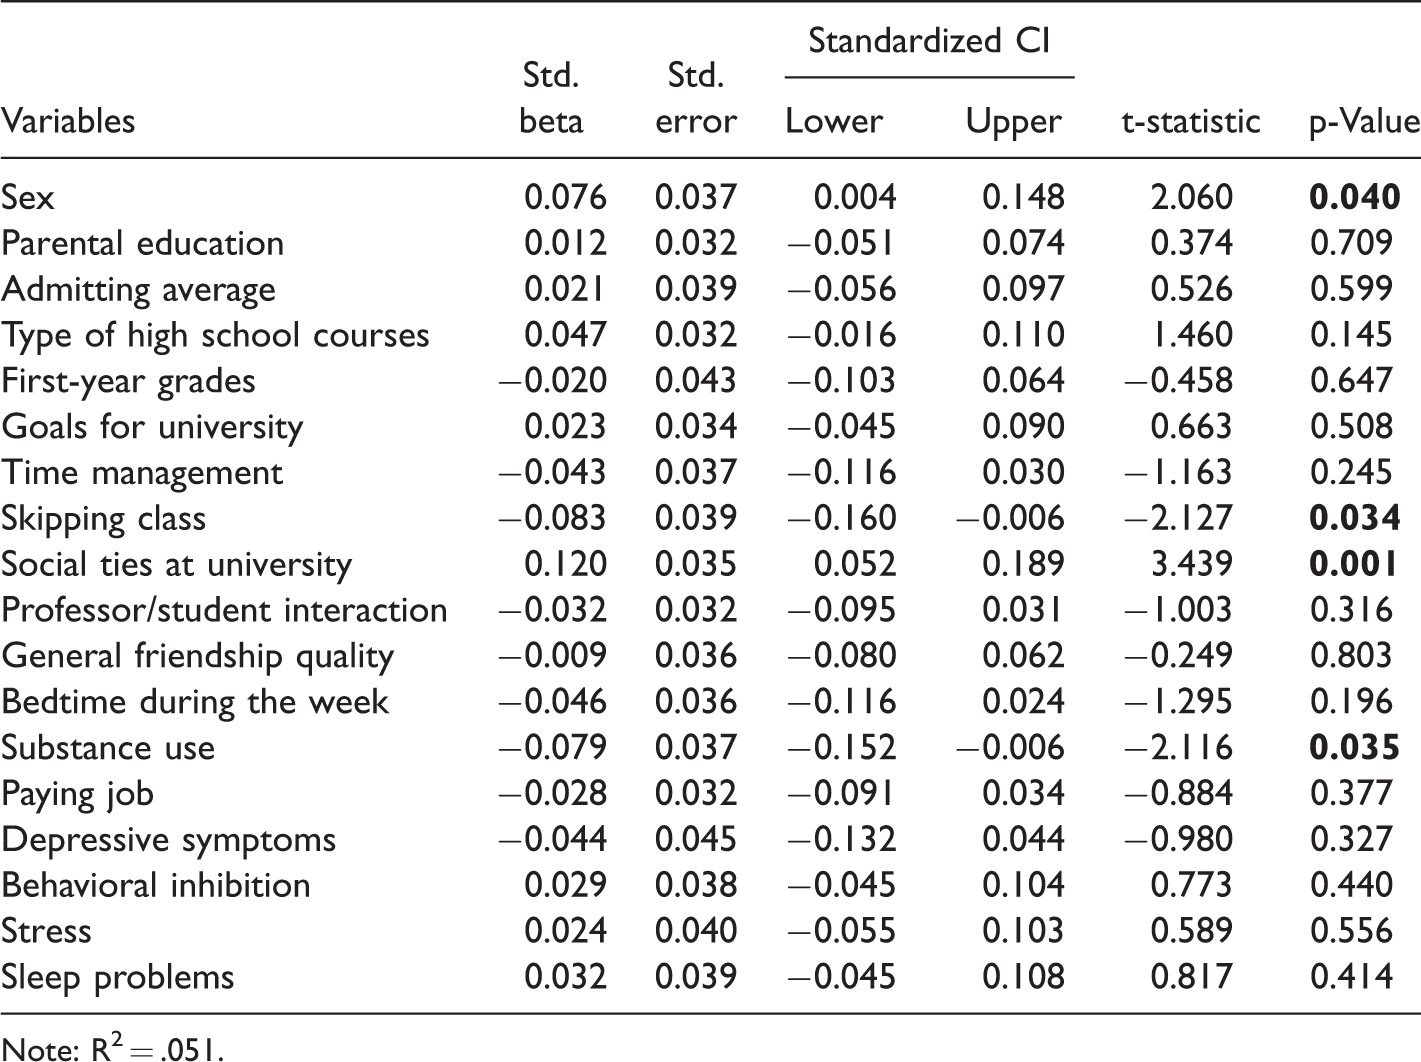
Note: R2 = .051.
Discussion
Despite the growing importance of obtaining a university degree, a large number of students drop out of university. Previous research on retention has been limited by focusing only on a few relevant domains and by a lack of long-term longitudinal data that fully captures students’ graduation and dropout patterns. The current 7-year longitudinal study aimed to address these limitations by providing a comprehensive, theory-driven examination of the different domains associated with student retention. The present study examined which indicators across five domains (academic engagement, social engagement, social support, student behaviors, and psychological adjustment) best predicted graduating versus leaving prior to graduation.
Retention Rate
Overall, the retention rate in our sample was 79%, placing the dropout rate of 21% at the lower end of the range of rates reported in other studies (i.e., 15 to 40%; Nguyen, 2012; Wei & Horn, 2013). The strength of our study was that we assessed participants’ enrollment status over seven years (including those who left the university) allowing us to include students who took breaks from university but came back and graduated in six or seven years, or those who transferred to another university and graduated from there.
Academic Engagement
The strongest predictor of graduation by far was first-year grades, aligning with previous findings (e.g., DeBerard et al., 2004). Therefore, the best way to promote graduation is to support students to achieve higher first-year grades. In turn, the best predictor of first-year grades is a higher admitting average (i.e., average for high school courses used for admission to university) (e.g., Friedman & Mandel, 2009; Torenbeek et al., 2011). Thus, it would be beneficial to provide academic support to high school students in order to help encourage better grades. In a recent study, Galla et al. (2019) found that self-regulation (e.g., the ability to resist temptations, regulate emotions, and pursue long terms goals) was an important predictor of high school grades. This idea is consistent with our results showing that goals in university predict better university grades; in other words, fostering students’ motivations and goals before they attend university may help improve high school grades and in turn improve performance at university. Additionally, students who took a greater proportion of U courses in high school, which are designed to prepare students for university, had higher grades in university than those who took a lower proportion. Thus, students who plan to enter university programs, therefore, should be encouraged to take courses designed to prepare them for success in university courses
Further, students with better first-year grades tend to prioritize their academic commitments, even when doing so may hinder their social experience. Our results indicate that higher university-related goals, class attendance and time management were associated with better grades, while substance use and more social ties were associated with lower grades. Thus, some students who are heavily involved in social activities in first year may not yet be able to balance social and academic activities. This may result in time management difficulties, skipping class, and externalizing behaviors such as drinking alcohol, which affects their academic performance. Learning how to balance social and academic activities is an issue for first-year university students as they transition into a new environment. Universities would benefit from supporting forms of social engagement that do not hinder academic achievement, such as club involvement, which could help students engage in social activities and achieve a sense of belonging (Strayhorn, 2018) without necessarily affecting their academic pursuits.
Social Engagement
Beyond first-year academic grades, social engagement at university (e.g., greater social ties and greater club involvement) significantly predicted graduation. This finding supports theories highlighting that retention is related to both academic and social factors (e.g., Astin, 1999; Bean, 1980; Pascarella & Terenzini, 2005). Specifically, students who are more integrated into the university likely feel a strong sense of belonging and increased social support, translating into a higher commitment to completing one’s degree (e.g., Ishitani & DesJardins, 2002; Strayhorn, 2018).
Although social ties are important for predicting retention, for some students having strong social ties may come at the expense of academic performance. Students may sacrifice some of their academic responsibilities to gain social ties at university, such as going out with new friends rather than studying or going to class, resulting in a lower first-year average. Students with better social ties may recognize the importance of university (e.g., they have high university goals), but may value their social experience over getting high grades.
Despite some academic costs associated with greater social ties, there also are positive factors associated with this type of social engagement. For example, greater social ties is associated with better friendship quality and club involvement. Students with better friendships in general (including outside the university) may have the social skills to easily gain friendships within the university. Further, social engagement in one area (e.g., better social ties) is associated with social engagement in other areas (e.g., greater club involvement), both of which are important predictors of retention.
A promising social avenue for retention that was not associated with any academic costs is club involvement. In fact, greater club involvement was associated with better class attendance and less substance use. Club involvement may provide students with more opportunities to meet like-minded individuals, thus encouraging them to remain at university. Given this, clubs may be important investments for both universities and students. Overall, the integration of a student’s social life within the university context (e.g., through club involvement or social ties) may serve as a deterrent for dropping out. Universities can directly target this by providing more frequent and diverse opportunities for students to bond through shared participation in a valued activity. First-year students also should be made aware of the benefits of social engagement and encouraged to seek out more opportunities to get involved within the university.
We also found that time commitments outside of the university may disrupt student success. For example, working part-time may hinder both academic (grades) and social (social ties) engagement at university. When students work outside the university, this takes time away from their ability to study, socialize, and become involved and integrated in university life. One way to address this issue could be to increase opportunities for financial aid. If students had greater assistance, they may not need to spend as much time working outside the university, and the factors that are important for graduation (social ties and academic performance) could improve.
Psychological Adjustment
Of note, while depressive symptoms were associated with lower first-year grades, behavioral inhibition (anxiety) with higher first-year grades, and less stress with greater social ties, psychological adjustment was not a prominent predictor in any of the analyses, including whether students graduated or dropped out. This finding contradicts some previous research where mental health significantly predicted retention (Arria et al., 2013; Wintre & Bowers, 2007), although these studies did not include the same multi-domain set of indicators used in the current study. It also could be that it is only a minority of students who experience mental health difficulties to such an extent that it affects their ability to succeed both academically and socially at university. Their numbers may not be large enough to impact the results in this study. One way to test this in future studies is to conduct a person-centred analysis which specifically explores whether there are distinct subgroups of students who have different patterns of characteristics and behaviors within the larger sample. If there is an identifiable group experiencing mental health problems, they can be targeted for intervention and followed over time to see if there are short and/or long-term negative effects.
Limitations
It is important to acknowledge the limitations of our study. First, our analysis only included predictors measured during the first year of university. It is possible that students experience changes in the variables across their time in the institution and this change may be important for predicting retention longitudinally. On the other hand, we were directly predicting graduation/dropout; thus, including variables after Year 1 in the analysis is problematic given that those who drop out of university would be missing key variables (i.e., grades, social ties at university, club involvement, class attendance, etc.). Additionally, we did not explore interactions amongst variables. There may be specific combinations of variables that are particularly influential in predicting retention. For example, students with mental health difficulties that are self-medicating via substance use may be an especially vulnerable group. Future research should investigate such interactions for a more nuanced understanding of how variables influence retention.
Further, although we tried to include as many potential predictors as possible, there likely are other important variables that we did not include. For example, students with physical disabilities and international students may face unique challenges in the university context that were not captured in our analyses. Our study may be limited by a sample consisting of students from a single university. The medium-sized, public university environment may provide different challenges and benefits than other institutions. Additionally, the retention rate in our sample was 79%, a rate consistent with the university as a whole (Maclean’s, 2018), but at the higher end of retention rates reported in the literature (e.g., Nguyen, 2012; Wei & Horn, 2013). Thus, the sample from our university may not be representative of all universities. At the same time, most post-secondary institutions have similar goals and structures, and thus it is unlikely that the results of our study would differ dramatically if tested elsewhere.
Despite the aforementioned limitations, this study used rigorous methods to provide a detailed model of retention. Graduation and dropout were assessed after seven years, providing a more accurate picture of retention compared to previous research, which has largely focused on first to second-year retention or four-year models. Clearly, many students take longer than four years to graduate. Seventy-nine percent of students in our sample had graduated by Year 7, indicating that some of these students would be incorrectly categorized as dropouts in studies that do not examine retention on a longer timeframe. By extending our assessment period, we were able to capture graduation or dropout status for almost all of the students in our sample.
Conclusion
Overall, our study included a comprehensive multi-domain set of predictors to investigate retention across seven years. By including predictors across a range of domains, including academic, social, and psychological, we were able to assess which variables were the most strongly associated with retention. The findings from this study suggest that first-year academic average, social ties at university, and club involvement are important predictors of retention. This is important, as it allows universities to focus their efforts in more efficient, targeted ways and provides future post-secondary students with concrete areas to prioritize.
Footnotes
Declaration of Conflicting Interests
The authors declared no potential conflicts of interest with respect to the research, authorship, and/or publication of this article.
Funding
The authors disclosed receipt of the following financial support for the research, authorship, and/or publication of this article: This work was supported by Social Sciences and Humanities Research Council of Canada (Grant No. 435-2014-1929).
