
Abstract
This article presents a mixed methods approach that integrates quantitative and qualitative methods to analyze why the four largest minorities in the Netherlands—Turks, Moroccans, Antilleans, and Surinamese—respond differently to items treating cultural topics. First, we conducted latent class factor analyses on a large data set to assess whether these minorities respond differently to the items and to distinguish respondents with different types of response styles. These analyses indicate that group differences between minorities can partially be explained by response styles and that some respondents prefer to select the extreme categories whereas others prefer adjacent categories. Then, we selected interviewees from the same cultural groups and classified them according to the response profiles derived from the quantitative study. The qualitative study shows that extreme responders use different strategies to answer survey questions than do adjacent responders.
Studies on people’s values, attitudes, and opinions use surveys as the key instrument to measure these characteristics. Survey instruments intended for making comparisons among national cultures or cultural groups within nations should be equally applicable across cultures to validly compare attitudes. Unfortunately, it has been shown repeatedly that survey results are not always comparable across cultures (e.g., Van de Vijver and Leung 1997). Many studies illustrate that response differences to attitude questions—particularly those dealing with culturally sensitive topics—can be attributed to cultural differences in language (Gibbons et al. 1999), acculturation (Marin et al. 1992), or response styles (e.g., Harzing 2006). For instance, Moors (2004) has demonstrated that due to a heterogeneous response behavior, survey responses among the Moroccan and Turkish minorities in Belgium are incomparable.
To explore such group differences in response behavior, one ideally needs statistical methods that simultaneously measure the underlying attitudes and detect the group specific response behavior. In this article, we use the latent class factor approach (LCFA) to take into account group differences in response styles as well as in attitudes (Moors 2003; Morren et al. 2011). Other similar approaches can also detect and correct for these group differences (Meade and Lautenschlager 2004; Steenkamp and Baumgartner 1998). Strong points of LCFA are that strict statistical assumptions need not be met for its application and variables of different measurement levels to be included in a model. For detailed information about the statistical properties, we refer to the web appendix (available at http://fmx.sagepub.com/). Although LCFA provides insight into the magnitude and the correlates of this differential response behavior, it does not clarify how the response processes underlying the differential response behavior operate. Therefore, we integrate statistical modeling and cognitive interviewing: In study 1, we estimate a statistical model on data from a large-scale nationally representative survey to detect the magnitude of group differences in responding. In study 2, we conduct cognitive interviews in a small purposive sample of respondents to study the response process in more detail. We integrate both data sets by inferring the response style of the interviewees from the statistical model and comparing the interviewees’ explanations for their response behavior in the cognitive interview accordingly. In this particular application of the mixed method approach, we aim to find an answer to the following research questions: Which respondents endorse what type of response style, and, specifically, is response style usage systematically related to cultural background? Is the response process for respondents with a particular response style systematically different from the response process of other respondents?
Study 1: Analysis of Large-Scale Survey Data to Assess Measurement Equivalence and Detect Response Style
Latent Variable Modeling to Assess Cross-Cultural Comparability
Within the latent variable modeling approach, attitudes are approached as complex theoretical constructs for which multiple empirical indicators reflecting several important aspects of the attitude are needed for a valid and reliable measurement (Bollen 2002). An attitude is modeled as a latent—unobserved—variable (also called factor or trait) for which survey questions (hereafter called items) are the indicators or observed variables. Covariates are included in this basic modeling approach to investigate differences between groups, as shown in Figure 1.
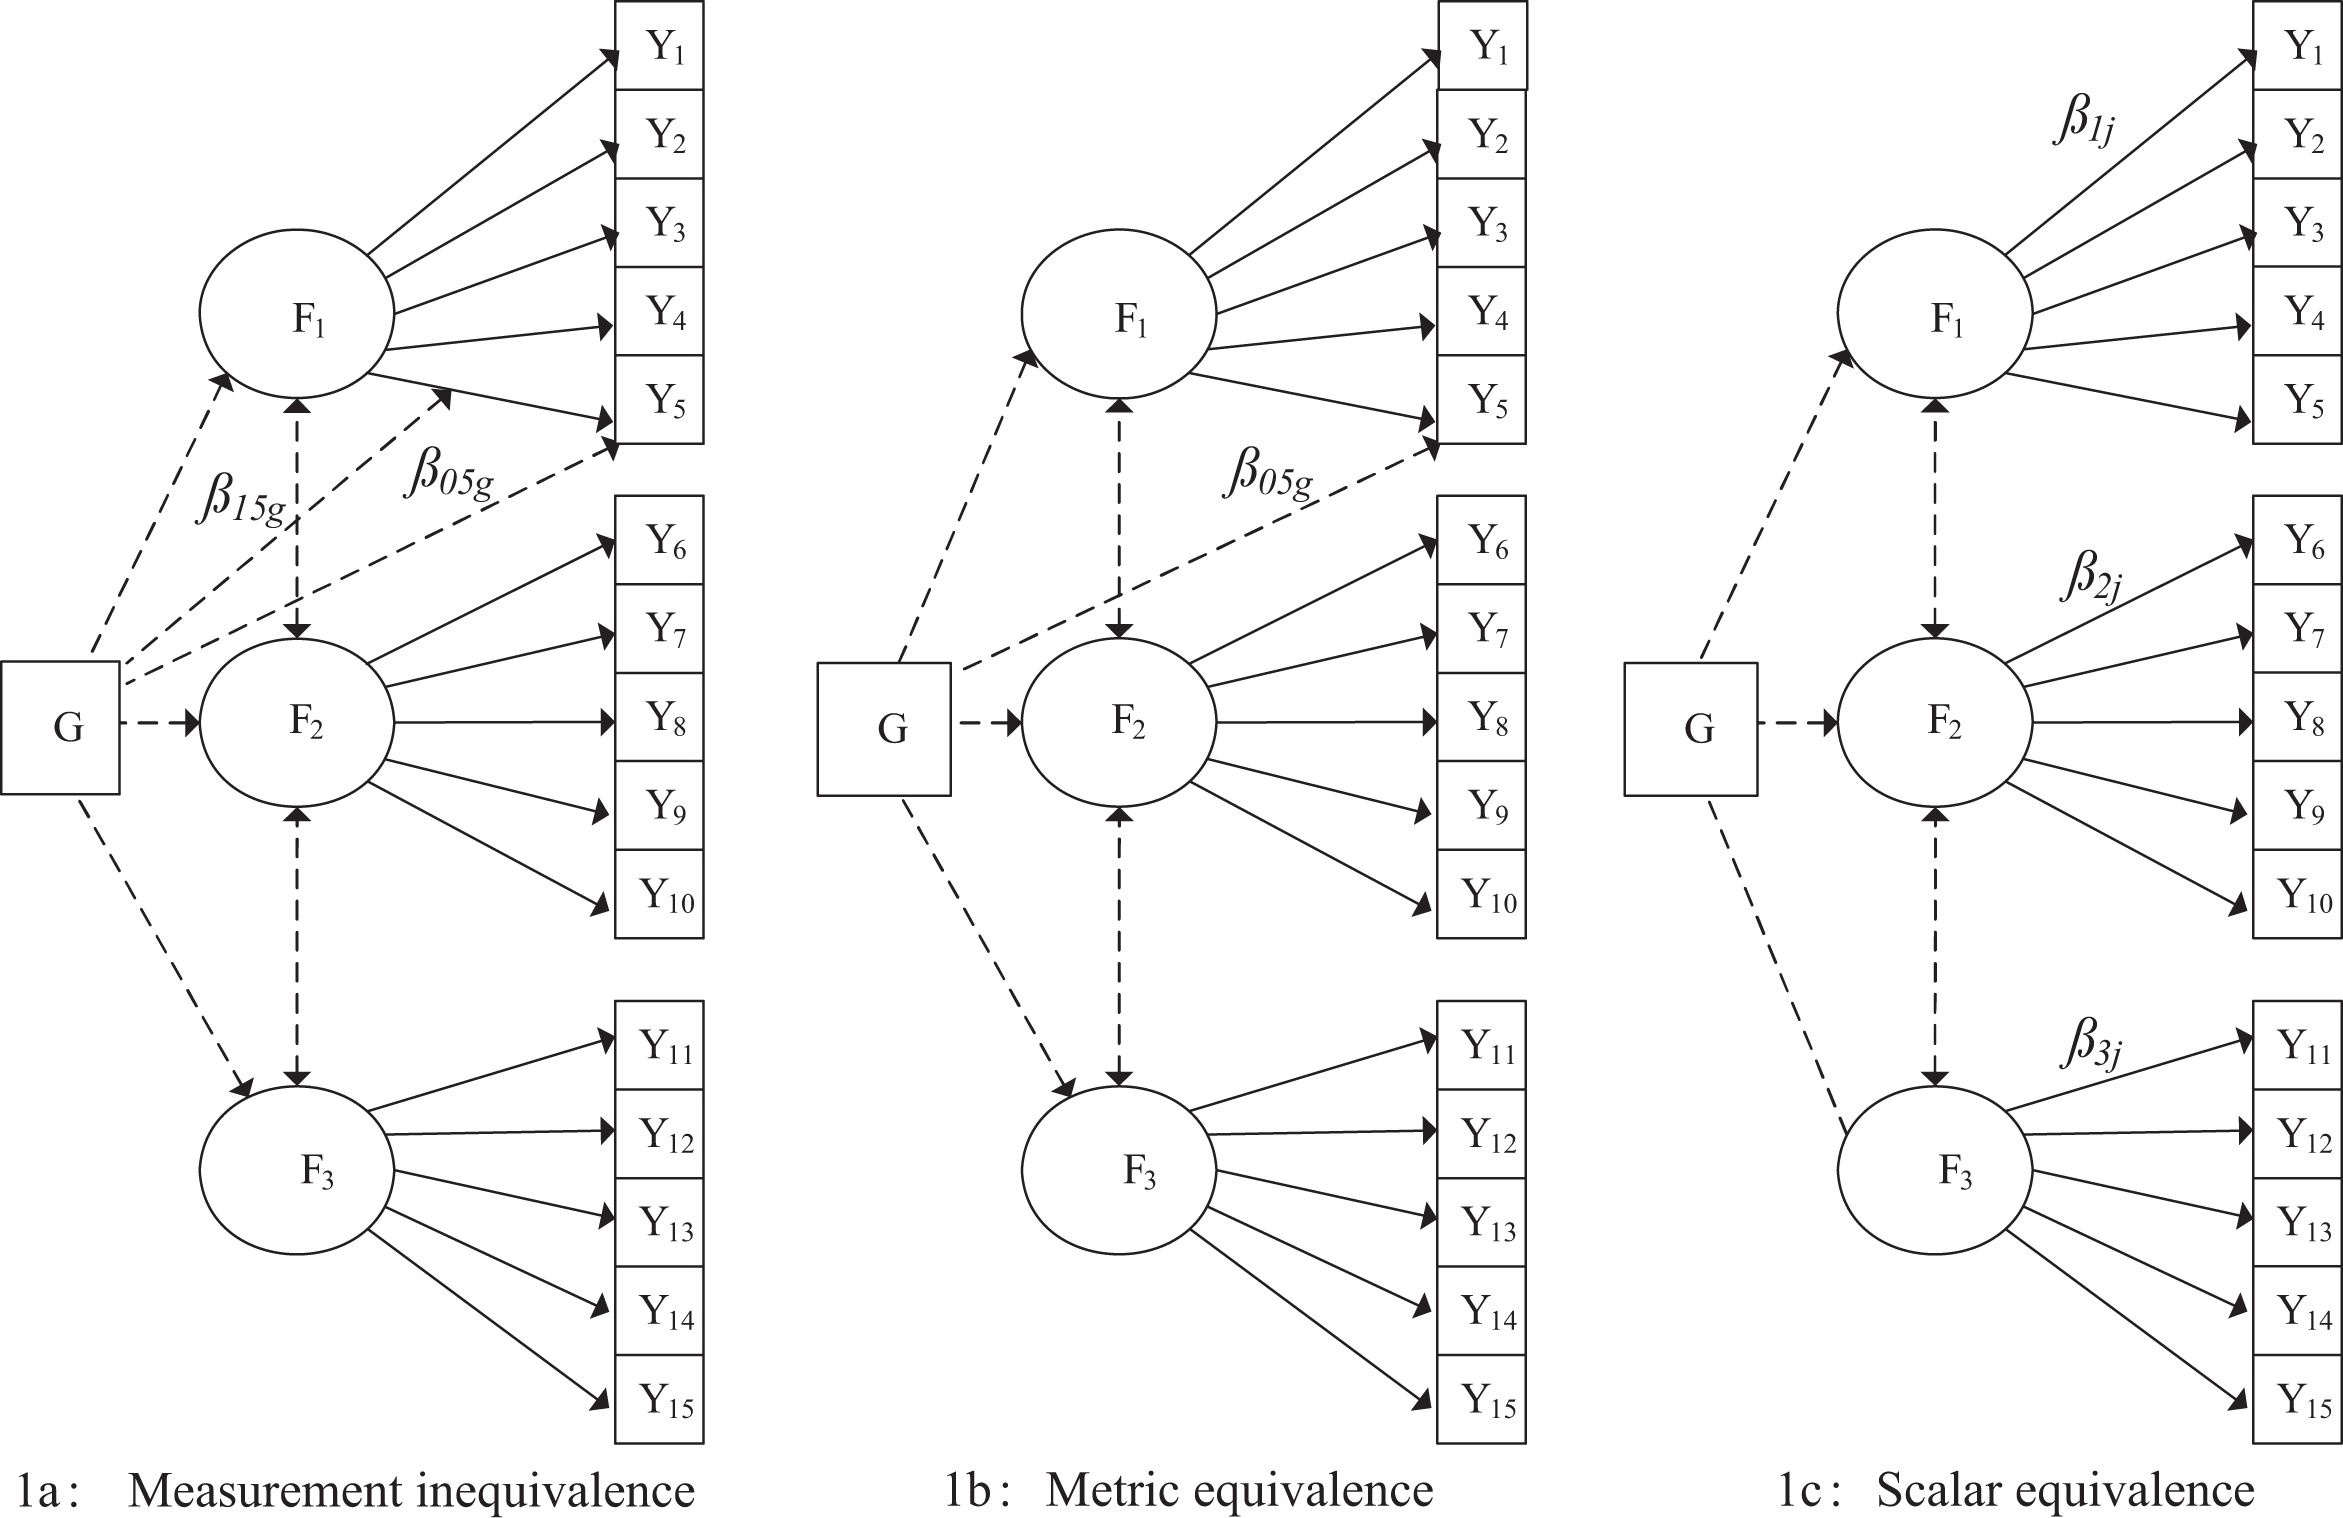
The latent variable model and measurement equivalence.
Here, Y 1 to Y 15 represent the item responses that are directly related to the latent variables measuring the attitudes F 1, F 2, and F 3, and indirectly related to the observed group variable G. The systematic variance among the item responses is captured by the factor loadings β1j , β2j , and β3j (index j refers to an item). It is assumed that the five items in the first item subset do not relate directly to the second and third attitude; that is, the item parameters β2j and β3j are fixed to zero. Likewise, the parameters β1j and β3j are fixed to zero for items Y 6 to Y 10 and parameters β1j and β2j are fixed to zero for items Y 11 to Y 15.
If respondents with similar attitude levels respond differently to the items given his or her group membership, the measurements are inequivalent (model A) or partially equivalent (model B). Measurements inferred from respondents whose responses are similar irrespective of their group membership are scalar equivalent (model C). Note that measurement equivalence allows for group differences in attitudes but not for group differences in the measurement of these attitudes. Formally, model A allows for group differences in both factor loadings and intercepts, model B for group differences in intercepts, and model C restricts the responses to be equivalently related to the attitudes across groups. In Figure 1, violation of scalar equivalence is indicated by the direct effect β05 g (dashed arrow) of G on item Y 5, and a violation of metric equivalence is indicated by the direct effect β05 g and the interaction effect on the relationship β15 g between item Y 5 and factor F 1, meaning that G moderates the association between the fifth item and the first factor. We test for scalar equivalence by fixing the group-specific parameters β05 g and β15 g to zero; to test for metric equivalence, only β15g is fixed to zero. Even though in Figure 1, the group parameters are only indicated for item Y 5, the group variable G is usually assumed to affect all items simultaneously.
We applied study 1 to a secondary data set collected in 2002 among heads of the households in the four largest ethnic minorities in the Netherlands, namely Turkish, Moroccan, Surinamese, and Antillean people. While most people immigrated for economical and educational reasons, Surinamese and Antilleans came from Dutch colonies and were therefore more acquainted with the Dutch language, culture, and heritage than the Turks or Moroccans (CBS 2005). We include 15 items from this Social Position and Utility Use of Ethnic Minorities (SPVA) survey, each having five ordered response categories that range from totally agree to totally disagree. These items operationally define three attitudes, namely attitude toward the Netherlands, endorsement of traditional family values, and autonomy of children within the family. Given the substantive nature of these constructs, the groups are expected to be subject to culturally specific sources of measurement error and possibly to derive their answers from diverse response processes.
To investigate explanations for violations of measurement equivalence, we control for the following covariates: language use during the interview to measure meaningfulness of language (Gibbons et al. 1999); generation of immigration to measure acculturation (Marin et al. 1992); age, gender, level of income, and education (Light et al. 1965). Following Moors (2003), we also include a latent response style factor to control for heterogeneous response behavior (i.e., the respondents’ tendency to answer differently than expected based on their attitudes).
In all models, the effect of attitudes on item responses is distinguished from the effects of the control variables by estimating models in which only one item subset is affected by one attitude, while all items are simultaneously affected by the control variables. By comparing the statistical fit of models with and without these covariates, we investigate to what extent the covariates form a reasonable explanation of measurement inequivalence. To compare between models, we use the Bayesian Information Criterion (BIC), which introduces a penalty for the sample size and the number of parameters (Burnham and Anderson 2004) and is the most widely used measure for model selection in latent class analysis (Magidson and Vermunt 2004).
The best model in terms of fit and parsimony has the lowest value of BIC. According to the BIC, only the model including the response style factor explains part of the measurement inequivalence; the models including the other control variables remain measurement inequivalent. For an extensive description of these models and the results, see the web appendix (available at http://fmx.sagepub.com/).
First, without controlling for a response style, the ethnic minorities interpret the items differently given their attitude; close inspection of the parameters shows that these differences are visible in the intercepts as well as the factor loadings that indicates full measurement inequivalence (also indicated by model A having the lowest BIC value). Furthermore, we find that the style factor accounts for the group differences in the factor loadings: The BIC values decrease between model ARS and model BRS, indicating that the model assuming metric equivalence should be preferred. Even though group differences in the intercepts (not reported here) also decrease substantially once a control for response style is included, scalar equivalence is not attained. Note that the cultural group membership also influences response style directly: The Surinamese respond significantly less extremely than the other groups; the other groups do not differ significantly in their style of responding (see web appendix, available at http://fmx.sagepub.com/).
Based on a post hoc interpretation of the parameters of the response style factor, we conclude that this style factor measures two related types of response style. First, a person who scores high on the style factor is more likely to select the extreme categories than other respondents with similar attitudes. We refer to this response style as the Extreme Response Style (ERS), defined as the tendency to select extreme categories irrespective of the item content across a large range of unrelated or weakly related survey questions. Second, close inspection of the parameters shows that a person who scores low on the style factor avoids the extreme categories and selects the adjacent categories agree and disagree. Here, this response style is referred to as the Adjacent Response Style (AdjRS) and should not be confused with the tendency to select the midpoint category (midpoint responding) or to select the categories around the midpoint category (response range; see Baumgartner and Steenkamp 2001).
The style factor is specified as a latent variable with three ordered classes, of which class 3 represents ERS and the class at the other endpoint (class 1) represents AdjRS. The middle class (class 2) defines a position in between these two endpoints. We interpret this position as a mild response style and treat these respondents as not endorsing any response style. Based on the item responses of a respondent, we can compute the probability of belonging to each of these three classes. Typically, we would assign a respondent to the most likely class. Practically, this means that respondents who preferably select extreme categories are assigned to class 3 (12%), and those who prefer to select adjacent categories are assigned to class 1 (46%). The remaining respondents are assigned to class 2. To validate the ERS (AdjRS) class from model BRS, we related these classes with an ERS (AdjRS) index based on all 55 five-point Likert-type items from the SPVA survey. The interitem correlation is .066 (variance = .026), indicating no substantive overall relationship between the items. As suggested by Greenleaf (1992), an ERS index is obtained as the proportion of items answered in the extreme categories (one or five). Moreover, the AdjRS index is computed as the proportion of items answered in the adjacent categories (two or four). The ERS and AdjRS indices correlate highly with the style factor, that is .85 and –.84 (both significant at p < .001) respectively, demonstrating the validity of our interpretation of the factor.
Study 2: Cognitive Interviewing to Explore the Response Process of Individuals Who Use a Response Style
Data Collection
Cognitive interviews were held from December 2009 until May 2010 among 24 interviewees, recruited via different contact persons, organizations, and personal contacts to avoid overlap in social background. Due to privacy restrictions, it was not possible to contact the original respondents from the large-scale survey. We aimed for a heterogeneous sample (see Table 2), as we found from study 1 that the style of responding was not systematically related to socioeconomic characteristics. The interviews were conducted in Dutch and lasted 45 minutes on average. During eight interviews, a research assistant was present who also helped with transcribing and coding. Five interviews were excluded from further analyses because two were used as a pilot, two were conducted within the same household, and one was conducted in another language using a translator.
We first ask the interviewees to answer the survey questions used in study 1 in a similar fashion of a regular survey interview: The respondent is asked to select one answer category that reflects his or her opinion best without providing further explanation. Based on the responses that interviewees give to the survey questions, we are able to apply the results obtained in study 1 to determine whether they use a particular response style. After the interviewees have given their initial response, we probe them retrospectively about a selection of questions proven to elicit inequivalent answers among minorities in study 1. We also probe the questions to which the interviewees show problems in the first interview phase. In general, less-educated respondents had difficulty understanding the purpose of the cognitive interviews. More specifically, they could not see why they should explain their answers given during the first interview phase. Presumably, a straightforward think-aloud interview would have been more suitable, but we persisted with the two-phase interview to maintain comparability with the other interviews.
Coding Scheme
All interviews were recorded and transcribed by the first investigator and a trained research assistant. To analyze the qualitative data from the interviews, we developed a code list by integrating data- and theory-driven codes. First, we approached the interview transcripts by open coding (Miles and Huberman 1994). However, the resulting coding scheme was not helpful in answering the research questions posed earlier. Therefore, we coded the interviews again, now including thematic codes based on the theory of psychology of the survey response (Tourangeau et al. 2000). We paid special attention to elements indicated by previous research to the widespread occurrence of ERS in cross-cultural research: (1) sociocultural characteristics of respondents such as language use, acculturation (Gibbons et al. 1999; Marin et al. 1992); and (2) the type and content of questions (i.e., number of categories, labeling, language; Hui and Triandis 1989; Ralston et al. 1995). The integration of both coding schemes was considered satisfactory and after several debriefings among members of the research team, this led to the final version of the code list.
Classification of the Interviewees in the Cognitive Interviews
We integrate quantitative and qualitative methods by calculating individual latent scores for the interviewees in the cognitive interviews based on their responses to the 15 items in Table 1 and the posterior probabilities (i.e., the probability belonging to a class given these responses) inferred from the analysis of the survey data. For two important reasons, we do not use the best-fitting model BRS for obtaining the posterior probabilities but instead use the most parsimonious model model CRS that assumes scalar equivalence.
Mean Observed Item Response per Ethnic Group (N = 3,549).
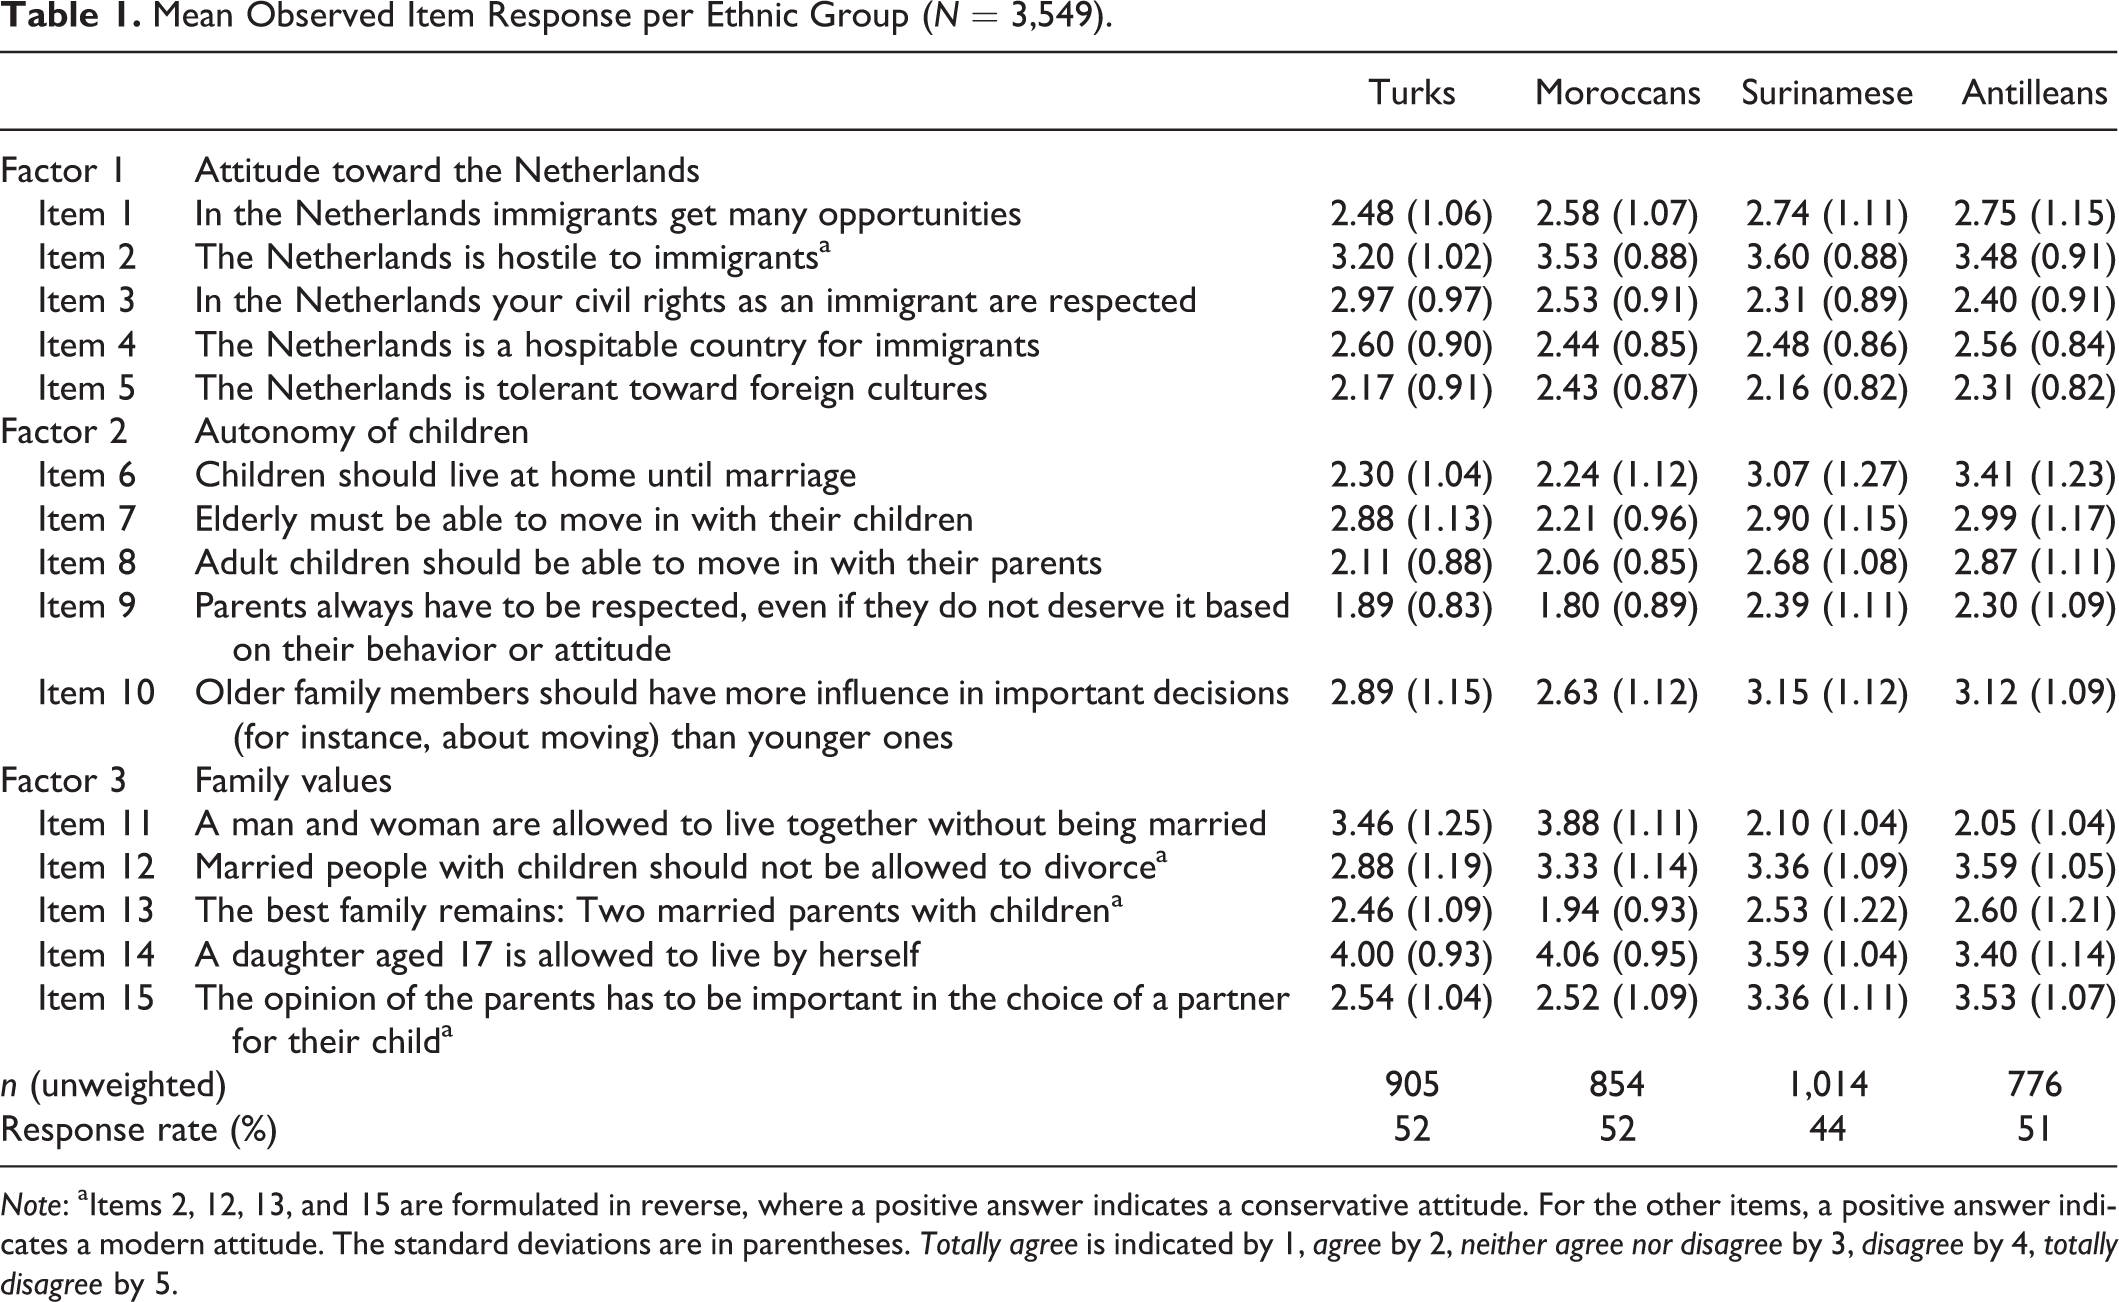
Note: aItems 2, 12, 13, and 15 are formulated in reverse, where a positive answer indicates a conservative attitude. For the other items, a positive answer indicates a modern attitude. The standard deviations are in parentheses. Totally agree is indicated by 1, agree by 2, neither agree nor disagree by 3, disagree by 4, totally disagree by 5.
The Classification of a Selection of Interviewees in the Cognitive Interviews.

Note: Interviewees are labeled by the first letter of their ethnicity and a number. Lower education includes primary education, the lower level of high school, and the lower level of professional education. Intermediate education includes intermediate level of high school and intermediate level of professional education. High education includes high level of high school and higher professional and academic education. Immigration stands for the generation that immigrated, # stands for the number of extreme or midpoint responses to the 15 items.
First, the number of parameters increases considerably when allowing for group differences in models ARS and BRS. This makes the classification of respondents according to model BRS more uncertain than the classification of respondents according to the more simple model CRS. Second, great uncertainty exists with respect to the nature of the resulting sample as we use purposive sampling in the qualitative part of the study. This means that using a relatively simple and parsimonious model may be more appropriate. Based on these considerations, we decided to use the parameters from model CRS for the classification of respondents in study 2. The class assignments for the response style factor serve as the basis for the comparison among the respondents’ explanations for their answers.
Table 2 reports the estimated response style of the interviewees, the number of extreme and adjacent responses in their response patterns, and demographic information. The interviewees are presented in the order of the assigned positions on the RS style factor.
Results
Extreme and Adjacent Responders
To understand why some respondents employ a response style and others do not, a clear understanding of the response process is crucial. Presumably, many respondents have problems with the attitude statements because they leave a lot of space for interpretation. We observe that respondents narrow down the possible interpretations to answer these items by: (1) having a critical attitude toward the item wording or survey process in general; (2) carefully weighing arguments in mapping the answers; or (3) excluding personal information in the arguments. Apparently, these response strategies are used as heuristic tools to solve a problem by finding the best possible answer (Krosnick 1991), also referred to as an educated guess (Tversky and Kahneman 1974). The most important difference between the respondents with and without a response style was that the first group applies these response strategies systematically to all questions. The use of language proves to be a complicating factor: Some respondents do not clearly distinguish between extreme and adjacent categories. Below we describe the response strategies.
Critical Attitude
Findings indicate that adjacent responders are very critical toward the items and the survey process. Interviewees T17 and S22 focus on the auxiliary verbs used in each item; interviewee A12 repeatedly expresses distrust toward the survey process in general and to the formulation of the items specifically: “All these questions are trick questions.” Interviewee S20 persistently argues throughout the interview that she does not want to exclude the possibility of other norms and values. Compared to other interviewees, adjacent responders are more sensitive and extreme responders are less sensitive toward the auxiliary verbs that determine the grammatical mood of the item. The problem addressed about “have to” is that—although a person can relate to the item content—it is possible to disagree with the obligation expressed by this auxiliary verb. The verbs “should” or “ought to” are problematic for some interviewees because they feel that they cannot agree or disagree with a recommendation expressed by this auxiliary verb: “Who are we to judge other people’s lives?” Finally, the auxiliary verb “is allowed to” is viewed by some interviewees as a limitation to a person’s freedom to act according to his or her own standards. The differences in sensitivity toward these auxiliary verbs between adjacent and extreme responders and the other interviewees are illustrated in Table 3.
Interviewees’ Inconvenience, with the Auxiliary Verbs Used in the Questions (Expressed in %).

Note: The numbers are obtained by dividing the words used to address the auxiliary verbs in the survey questions by the total number of words used during the second phase of the interview (to correct for the individual differences of the total number of words).
aObligation is expressed by the auxiliary “have to” or “must.”
bRecommendation is expressed by the auxiliaries “should” or “ought to.”
cPossibility is expressed by “could,” “might,” or “is allowed to.”
Table 3 reports the percentage of words used by nine interviewees to address their inconvenience with the auxiliary words in the question. On average, the extreme responders spent 1.9% of the interview on explaining the influence of auxiliary verbs; adjacent responders spent 15.2%; and the other interviewees spent 4.7%. Although Gibbons et al. (1999) find that meaningfulness of item wording is associated with the language in which the interview is conducted, we observe no systematic relation between language proficiency and sensitivity to auxiliary verbs.
Careful versus Abrupt Argumentation
In line with our previous findings, adjacent responders respond more carefully than extreme responders: They contemplate the multiple meanings of words and select a category, often reluctantly, after weighing their arguments. Two adjacent responders in our sample feel ambiguous toward the items and find it difficult to select a response category that reflects their opinion. Interviewee T17 has doubts about selecting categories because she feels that many answers are possible. For example, she discusses her answer to item 2 as follows: “If you take everything in consideration, I believe that—during the last few years—we have evolved in that direction.” After hesitation, she selects the midpoint category as she cannot know how this process will proceed. Interviewee A12 is annoyed with the vague formulation of the questions and responds to these questions by emphasizing that not all minorities are treated the same: “Some cultures yes, other cultures no.” However, many interviewees without a response style express similar problems with the item wording and also elaborate on the precise meaning they attach to the words. But, unlike the extreme and adjacent responders, they do not systematically select the same response categories.
The extreme responders react rather emotionally and abruptly instead of carefully weighing their arguments. For instance, in response to item 2, an extreme responder (M3) becomes agitated about the aggressive language used addressed to minorities by people in the street and at a national level by certain Dutch politicians. Interviewee A9 argues differently but with equal intensity to the same item: “If the Netherlands would be hostile toward foreigners, do you think I would get a house? No! Do you think I would get an allowance? No!” In general, the extreme responders give strong reactions to the item content without considering the precise item wording.
Personal Argumentation
Even though respondents with AdjRS and without a response style display sensitivity toward the wording of the questions, the findings indicate that they respond differently to the item content. Throughout the interview, one adjacent responder shuns giving any personal information, while another adjacent responder only once relates to his personal situation but in a rather hypothetical way: He argues that he would take care of his parents if they didn't live in Curaçao (A12). On the other hand, the other interviewees often explain their answers using personal experiences. Below we compare two interviewees’ answers to item 15:
Many questions you ask concern issues in our personal surroundings, parents often have a very, um, . . . well, yes, an opinion that interferes with their children’s opinion, and therefore I believe that [the influence of parents in the children’s choice] should not be important. (M2)
It plays a great role in our community, but I do not believe that that should be a leading role, so, um, . . . so, yes in my view they should have a voice but, umm, . . . not the choice itself [. . .], given my reasoning I think I agree. (T17)
Although these answers look very similar, interviewee M2 thinks of people in her surroundings and gives several examples subsequently (not shown here). In contrast, interviewee T17 (subject to AdjRS) refers to her personal surroundings in a more abstract way; she does not—explicitly—integrate her personal experiences into her judgment. We argue that interviewee T17 simplifies the response process by systematically excluding her personal experiences from her answers. As interviewee M2 thinks about her personal experiences, she makes an effort to regard each question separately. These findings may be generalized to the other interviewees, as the percentages in Table 4 illustrate.
Interviewees’ Personal and General Arguments (Expressed in %).
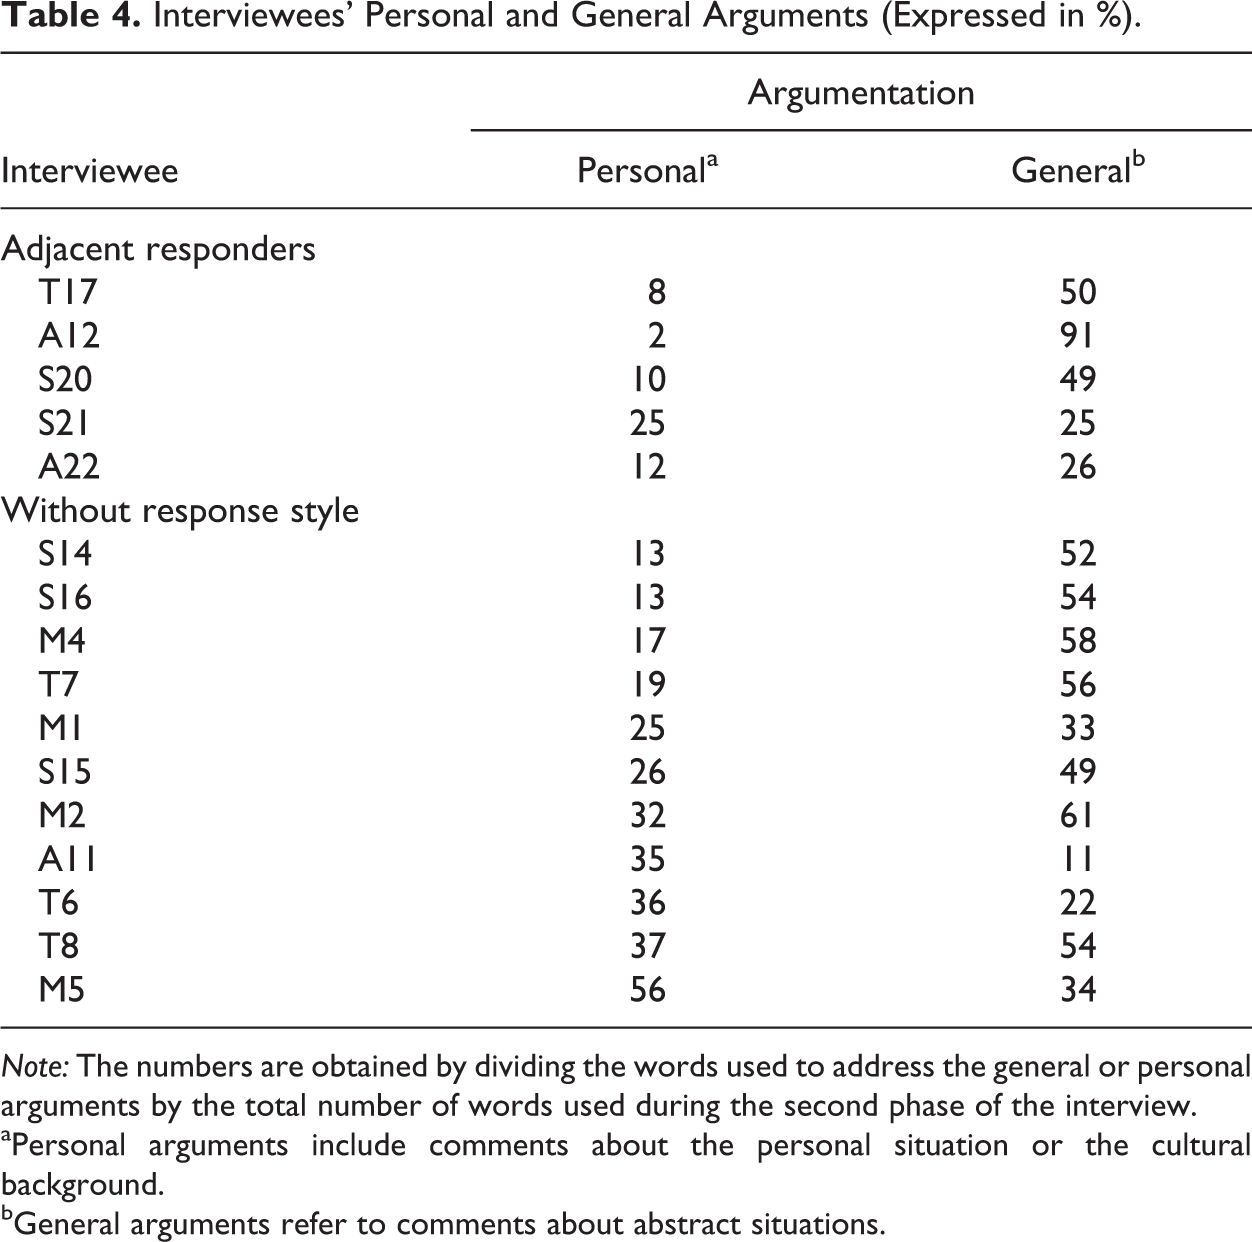
Note: The numbers are obtained by dividing the words used to address the general or personal arguments by the total number of words used during the second phase of the interview.
aPersonal arguments include comments about the personal situation or the cultural background.
bGeneral arguments refer to comments about abstract situations.
As seen in Table 4, adjacent responders spend the smallest amount of words on personal arguments. This leads us to suggest that including personal arguments in the answers impedes AdjRS, which is illustrated by interviewee M4 who retrospectively changes his answer to “totally agree”: “I didn’t think of a family situation at first, [. . .] that is the difference I guess. So earlier I answered without considering my own family and when I think about it now, I come to a different conclusion.” Adjacent responders S20 and S21 do not fit into the pattern by equally using personal and general arguments while avoiding extreme categories altogether (see language). Extreme responders are excluded from Table 4 because we could not detect a general pattern: Some extreme responders use more personal arguments; others use more general arguments.
Mapping
When we probe about mapping judgments to the response scale (i.e., the selection of response categories that best reflect the judgment), extreme responders react differently than adjacent responders and interviewees without a response style:
As can be seen in Box 1, interviewees mention heuristics in how they deal with response categories: Extreme responders have rather fixed ideas about their response pattern, while adjacent responders use a more nuanced language. These results suggest that extreme responders reflect less often on their own response behavior than other interviewees who select extreme categories occasionally, although they prefer nuance.
Interviewees Reflect on Their Own Response behavior
As Muslim [. . .], I always totally agree [with what Gods prescribes or forbids]” and “God created me [. . .] so if he gives you advice and you say no, I don’t agree, yes, that sounds funny. (M3)
I never choose extreme categories [. . .] I also think it is my character that I don't like to totally exclude things. (T17)
I am a free-thinking man. (A12)
I decide not to use totally agree or totally disagree because this leaves room for discussion, or debate or eh . . . interpretation so to say. (M5)
Adjacent responders claim they do not like extreme categories because they do not want to exclude contradicting situations, arguments, or people’s behavior. Six interviewees without a response style argue similarly but nonetheless occasionally select extreme categories, mostly to family-related questions (10 of the 12) or in addressing personal situations (8 of the 10). Other aspects of the response process also seem to influence the tendency to select or to avoid extreme categories. Extreme responders are less articulate about the reasons for selecting categories, and, after probing, two of the three extreme responders are unable to explain their extreme answers. In contrast, adjacent responders consistently avoid the extreme categories.
Language
Among the less-educated ethnic Antillean and Surinamese interviewees, seven of the nine interviewees do not clearly differentiate between extreme and adjacent categories. Presumably, this can be explained by cultural differences in language usage. Van de Vijver and Phalet (2004) suggest that—similar to African American respondents (Bachman and O’Malley 1984)—Surinamese respondents may have developed their own variation on the Dutch language, which has stronger connotations. The languages of these groups, Papiamento and Surinaams (Sranantongo), are rather expressive. Being used to expressing themselves more extremely in their mother tongue may lead interviewees to regard the difference between “totally agree” and “agree” less strongly than the other minorities. For example, interviewee S16 argues: “Actually, I don’t really care whether I agree or totally agree.” Interviewees A10 and A9 do not differentiate between the extreme and adjacent categories, which could also be connected to their response style, as both are extreme responders. In short, 8 of the 10 ethnic Surinamese and Antillean respondents either explain vaguely or do not explain at all how they perceive the difference between extreme and adjacent categories.
In line with Gibbons et al. (1999) and Hui and Triandis (1989), we suggest that cultural background influences susceptibility to a response style via the meaningfulness of language. In the Antillean and Surinamese cultures, language is used in a more extreme way than in the Dutch culture. This may induce these respondents to overlook the difference between extreme and adjacent categories. In contrast, of the 10 ethnic Moroccans and Turkish interviewees, only 1 remarks that he does not perceive a clear difference between the categories.
Conclusions
In this article, we have found that the incomparability of responses across culturally diverse groups can be partially explained by a response style. The response style itself was found to be systematically related to cultural groups. In study 1, we showed by analyzing a large data set quantitatively that this style factor measures a synthesis of avoiding extreme categories, on one hand, and a preference for extreme categories, on the other. As this response style could explain much of the variance in responding across the cultural groups, we further investigated this response style in study 2, using semistructured interviews in which we focused on the cognitive aspects of the response process. We integrated the quantitative and qualitative results by classifying the participants in the cognitive interviews according to the types of responders inferred from a model estimated on the large data set. Subsequently, we compared the arguments given in the cognitive interviews for the interviewees who exhibited a preference for extreme categories—the extreme responders—for adjacent categories—the adjacent responders—or without a clear preference.
Using this sequential mixed method design, we found that the response style is the outcome of different response strategies. First, extreme responders less precisely considered the item wording than adjacent responders and interviewees without a response style. In contrast, adjacent responders more carefully considered the precise item formulation than the other respondents. Second, adjacent responders carefully weighed arguments for and against when responding. In contrast, extreme responders and interviewees without a response style weighed their arguments to a lesser degree. Third, some adjacent responders persistently shunned personal information in their argumentation. Fourth, and most importantly, even though extreme responders, adjacent responders, and interviewees without a response style all displayed these response strategies to some extent, extreme and adjacent responders systematically translated these response strategies into selecting certain categories across a diverse range of questions. Finally, the findings suggest that extreme responding might be related to cultural heritage. Respondents with a Surinamese and Antillean ethnic background especially seem to disregard the difference between extreme and adjacent categories. However, this finding should be studied further as these conclusions are based on a small sample and must be interpreted with care.
This article illustrates that latent class factor models is a powerful and straightforward method to derive response profiles from large-scale surveys, which can subsequently be used to classify respondents who were not initially included in the survey but purposely selected. Furthermore, cognitive interviews can be used to evaluate items after the survey has been conducted. In this case, we recommend integrating the findings from the cognitive interviews with the survey findings by classifying the interviewees based on the model estimates.
We have shown that interviewees have problems with the vague formulation of the attitude statements. Complex syntaxes and auxiliary verbs cause special problems as they increase the number of meanings that can be attached to the questions. Interviewees can agree with one meaning and simultaneously disagree with another meaning. In the design of attitude statements, we recommend avoiding auxiliary verbs, as these were repeatedly mentioned by interviewees as creating problems in interpreting the entire sentence. We also recommend avoiding examples, as respondents tend to focus on these examples and do not respond to other possible fields to which the topic could apply. Next, make sure that the words in the questions are understood in the way that the researcher intends, as some words have double meanings, especially for the ethnic minorities. Finally, we recommend formulating the sentence as simply as possible to avoid using auxiliary verbs, examples, and subordinate clauses, as the use of subordinate clauses is confusing to many respondents.
Footnotes
Declaration of Conflicting Interests
The author(s) declared no potential conflicts of interest with respect to the research, authorship, and/or publication of this article.
Funding
The author(s) disclosed receipt of the following financial support for the research, authorship and/or publication of this article: This research was supported by a grant from the Netherlands Organization for Scientific Research (NWO), grant number 400-05-164.
References
Supplementary Material
Please find the following supplemental material available below.
For Open Access articles published under a Creative Commons License, all supplemental material carries the same license as the article it is associated with.
For non-Open Access articles published, all supplemental material carries a non-exclusive license, and permission requests for re-use of supplemental material or any part of supplemental material shall be sent directly to the copyright owner as specified in the copyright notice associated with the article.