
Abstract
Labor-related work stoppages in professional sports have the potential to alienate fans—but whether they generate sustained reductions in demand remains an open question. Existing evidence generally indicates work stoppages may negatively impact attendance but only for a short period of time. Focusing on the 1994, 2004, and 2012 lockouts in the National Hockey League, this article finds evidence consistent with sustained decreases in attendance following the 1994-1995 lockout and revenue following the 2004-2005 and 2012-2013 lockouts. Back-of-the-envelope estimates suggest work stoppages may still be optimal even if there is a sustained negative impact on fan demand.
Keywords
The National Hockey League (NHL) has long battled relative anonymity in the American professional sports scene. As Ernest Lupinacci put it: “Of the four major sports, guess which one is Ringo” (Allen, 2005, p. 1C). Yet, it is the NHL that arguably reigns as the current standard-bearer on one issue in major professional sports—labor strife. For many years, Major League Baseball (MLB) was the figurehead for dysfunctional labor relations in professional sports, enduring eight labor disputes from 1972 to 1995 resulting in the loss of 1,728 games and the cancellation of the 1994 World Series. However, over the last two decades, MLB has avoided further work stoppages and labor relations have been relatively benign. The same cannot be said of the NHL. Ten years after losing nearly half of the 1994-1995 hockey season to a lockout, the NHL became the first major professional sports league in America to lose an entire season to a work stoppage. When labor and management failed to reach a new collective bargaining agreement (CBA) in September 2012, management declared another lockout which lasted roughly 4 months and reduced the 2012-2013 hockey season from 82 to 48 games. In total, the NHL has lost 2,182 games (approximately two full seasons) and a Stanley Cup play-off to three protracted work stoppages and, in the process, has supplanted MLB as the poster child of labor unrest in professional sports.
To the casual observer, earning such a distinction would seem unappealing to labor and management as work stoppages involve sizable upfront costs and the potential for substantial long-run costs if consumer demand is permanently altered. The immediate costs are transparent—players forego salary and owners forego operating income. These costs, accounting for some degree of uncertainty due to the unknown length of the work stoppage a priori, are estimable based on existing contracts and team financial records. Less transparent and more difficult to estimate are the potential costs associated with fan reaction. If consumer demand is damaged by a work stoppage, future revenues and thus potential salary pools will be adversely impacted, increasing the costs of work stoppages to owners and players. Fans are frustrated when play is disrupted by labor strife and threats not to return when play resumes are common. What is unclear is the extent to which fans follow through on these threats. Better understanding the magnitude and duration of fan defections, if any, may influence the willingness of players and owners to initiate future work stoppages by allowing for more reliable estimates of the cost of these interruptions.
A handful of papers have addressed fan reaction to labor strife in American professional sports. Schmidt and Berri (2002) found the 1972 MLB strike had no impact on attendance and that decreases resulting from the more protracted 1981 and 1994-1995 strikes were short lived, effectively gone within 2 years of return to play. Broadening their analysis to include work stoppages in the National Football League and the NHL, Schmidt and Berri (2004) again find no evidence of a long-term negative fan reaction. They conclude that the lack of a “credible” threat from fans makes it likely that work stoppages will remain a part of the professional sports landscape.
Coates and Harrison (2005) also found attendance decreased, though not to the same magnitude as Schmidt and Berri, immediately following the 1981 and 1994-1995 strikes and—to a lesser extent—following MLB strikes and lockouts that did not result in the cancelation of games. These effects are all short lived, further supporting the idea that labor conflicts do not have sustained negative impacts on consumer demand in professional sports. Matheson (2006) provides evidence to the contrary. Noting that the years following the 1994-1995 MLB strike were characterized by a flurry of new stadium construction, Matheson argues that analysis of the impact of the strike should account for the potential positive influence of these new venues on attendance. Controlling for this countervailing impact on fan demand, Matheson found that the 1994-1995 strike did have a sustained negative impact on MLB attendance.
While the existing literature favors the idea that negative fan reaction to work stoppages in professional sports are short-lived, Matheson’s findings imply more work needs to be done. Along these lines, this article assesses the impact of the 1994-1995, 2004-2005, and 2012-2013 lockouts on NHL attendance and revenues. We find evidence consistent with, though not conclusive of, a negative fan response to work stoppages in the NHL. Intervention analysis reveals an underlying decrease in attendance demand following the 1994-1995 lockout and revenue regressions suggest a negative impact resulting from the 2004-2005 and 2012-2013 lockouts. Using ad hoc calculations we also show that lockouts may still be optimal for owners even if fans are not just making empty threats.
The Lockouts
Unease over rapid salary growth precipitated the 1994-1995, 2004-2005, and 2012-2013 lockouts. Lavoie (2006, p. 544) shows that from 1988 to 1994 the average NHL player salary rose from US$180,000 to US$730,000, significantly outpacing growth in per team revenues. Concerned that escalating salaries would diminish competitive balance and threaten the viability of small market teams, owners sought a payroll cap and luxury tax. When the players’ union rejected these demands, the owners initiated a lockout prior to the 1994-1995 season. The 103-day lockout ended with owners securing a salary cap for rookie contracts and restricted salary arbitration in exchange for unrestricted free agency for players at least 32 years old. The new CBA was seen as a marginal victory for owners, but it proved useless in reigning in salaries over the next decade.
The 1994-1995 CBA did nothing to alter the prisoner’s dilemma that owners confronted regarding player salaries. As a group, it was in the owners’ best interest to refrain from offering increasingly lucrative contracts, but the opportunity for a team to improve their standing by attracting elite players induced owners and general managers to repeatedly deviate from the collectively optimal outcome. With owners and general managers unwilling to practice self-restraint, the average NHL salary had risen to US$1.79 million by the 2002-2003 season and player costs claimed 67% of total revenues, more than double the share from 1988 to 1989 (Lavoie, 2006, p. 545). As the CBA expired in 2004, the NHL was edging toward financial disaster as three teams had filed for bankruptcy and several teams were nearing default. In an independent financial assessment of the NHL, Arthur Levitt (2004), former chairman of the Securities and Exchange Commission, found that teams had lost a combined US$273 million during the 2002-2003 NHL season. While the players union disputed the magnitude of the losses, their offer of a 5% across-the-board reduction in player salaries was an implicit acknowledgment of financial difficulties (Leadley & Zygmont, 2006). The owners balked at the offer, arguing that greater concessions were required. When negotiations stalled another lockout ensued. After 301 days and the loss of the 2004-2005 season, the players’ union capitulated, agreeing to a 24% reduction in salaries and a hard payroll cap that limited the players’ share of total revenues to no more than 57%. 1 Owners now had an enforcement mechanism to help them avoid the prisoner’s dilemma outcome and stem salary growth.
The NHL experienced substantial revenue growth in the years after the 2004-2005 lockout. According to Staudohar (2013), league revenue grew from US$2.2 billion for the 2005-2006 season to US$3.3 billion for the 2011-2012 season. Average player salary kept pace but did not exceed revenue growth. Nevertheless, many teams continued to struggle financially with nearly half of the league posting losses during the 2011-2012 season. This time the owners blamed the division of revenues stipulated in the 2005 CBA, whereby the players received up to 57% of revenues. The owners sought to reverse this split during initial negotiations for the new CBA in the summer of 2012 but the players’ union refused to acquiesce and both parties dug in their heels. When little progress had been made on this issue by the time the CBA expired in September 2012, the owners declared another lockout. After 119 days filled with acrimonious negotiations, political maneuvering and threats of legal action, the owners and players’ union finally approved a new CBA that called for a 50–50 split of revenues.
Players emerged the real winners of the 1994-1995 lockout while the 2004-2005 and 2012-2013 lockouts were generally viewed as victories for owners. Hockey fans lost every time. This group had the potential to exact revenge on players and owners by taking their consumer dollars elsewhere when play resumed. While threats of this nature were common, the extent to which consumers followed through is unclear.
The willingness of players and owners to subject fans to three lengthy work stoppages in 20 years suggests they believe such threats are largely hollow. There does not appear to have been a great deal of trepidation among teams regarding fan reaction to the 1994-1995 lockout. The New York Rangers director of communications went so far as to characterize the lockout as “just kind of a bump in the road” (Hochberg, 1995, p. F1). Aside from rolling out a trendy “Game On!” advertising campaign, the NHL did little else to lure fans back to the game. Concern following the 2004-2005 lockout appears to have been somewhat more palpable as the average ticket price fell 7.5% (NHL Games Get More Affordable, 2005) and the NHL hired “four agencies to help revive interest in professional hockey” (Elliott, 2005, p. 7). NHL commissioner Gary Bettman issued an apology to fans following the 2012-2013 lockout and the teams offered various short-term promotions (Dosh, 2013), but ticket prices were actually 5.7% higher than the previous season (Greenburg, 2013), suggesting owners were not overly concerned that fans would stay away from the game. So how did consumers respond? We turn to the data for the answers.
Intervention Analysis
We begin by extending Schmidt and Berri’s (2004) analysis of NHL attendance to include the potential the impact of the 2004-2005 and the 2012-2013 lockouts. The data Schmidt and Berri used on league wide attendance for 1960-2000, obtained from Total Hockey (Total Sports, 2000), was extended through the 2014-2015 season using data available on the ESPN (2013) website. A graph of unadjusted total league attendance in Figure 1 suggests both that the NHL’s popularity has soared over the last 50 years, with total attendance increasing roughly tenfold, and that the 1994-1995, 2004-2005, and 2012-2013 lockouts had no noticeable adverse impacts on attendance. Adjusting the data to control for league expansion, Figure 2 replicates and extends Schmidt and Berri’s (2004, p. 347) graph of per team attendance in the NHL up through the 2014-2015 season. 2 The story is much the same—it appears that lockouts had no lasting impact on attendance.

Total National Hockey League attendance.
Attendance per National Hockey League (NHL) team (scaled to 1992 per team attendance). Data sources: Total Hockey: The Official Encyclopedia of the National Hockey League (2000) and NHL attendance reports from ESPN’s website.
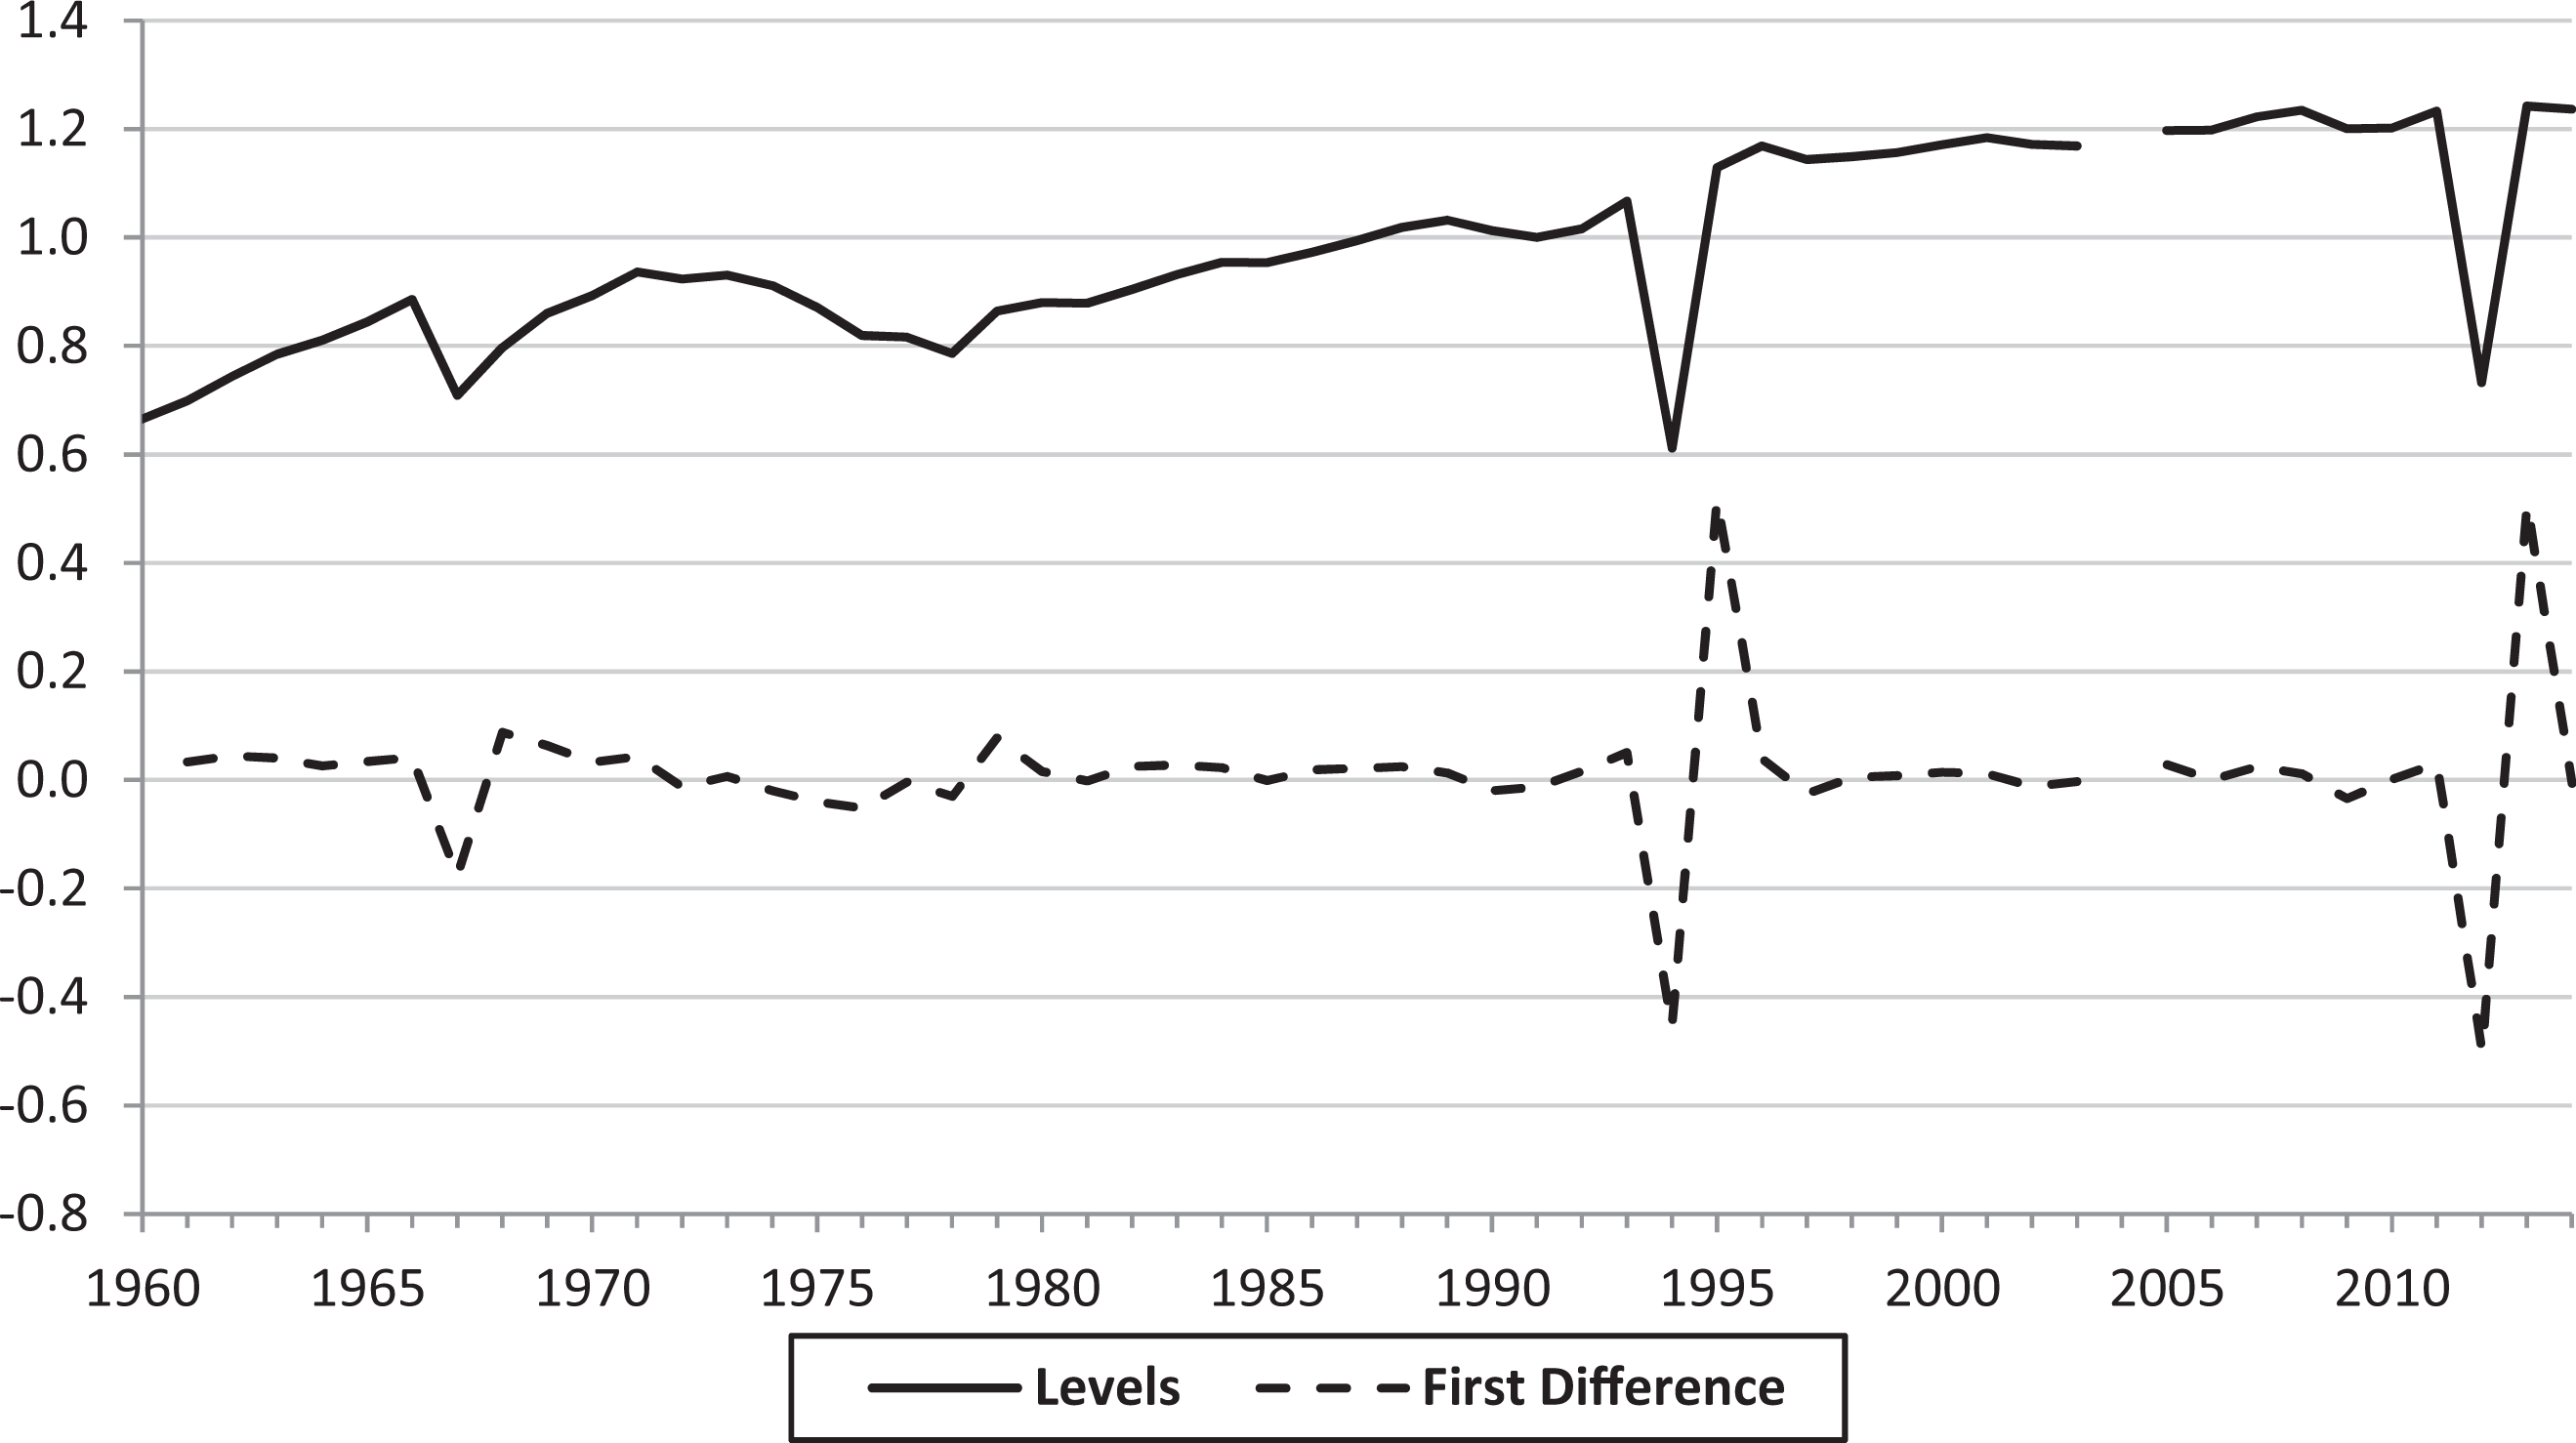
The next step for Schmidt and Berri was intervention analysis. Regressing the first difference of scaled per team attendance on dummy variables for the 1994-1995 and 1995-1996 seasons, they found that the drop in attendance during the lockout-shortened 1994-1995 season was neutralized by a corresponding increase in attendance the following season. Their estimates are consistent with observations gleamed from the graphs—the 1994-1995 work stoppage had no lasting impact on NHL attendance. We repeated this analysis for the 1960-1961 through 2014-2015 seasons using the following specification:

where, again following Schmidt and Berri (2004), yt is the first difference of scaled per team attendance. The z67 variable is equal to one for the 1967-1968 season and 0 for all other seasons. This variable controls for the significant decline in per team attendance that season which coincided with the NHL’s expansion from 6 to 12 teams. The z94 dummy variable controls for the negative shock resulting from the lockout-shortened 1994-1995 season while the z95 dummy variable controls for the subsequent rebound the following season (1995-1996). Similarly, z12 controls for the negative shock resulting from the lockout-shortened 2012-2013 season and z13 controls for the subsequent rebound the following season (2013-2014). We added a dummy variable for the 2005-2006 season, z05, to pick up any impact of the lockout that wiped out the entire 2004-2005 season. The first column of results in Table 1 shows that our estimates for z94 and z95 are nearly identical to Schmidt and Berri. The estimate for z05 is not statistically significant, and we cannot reject that the sum of z12 and z13 is 0 which suggests that the decline in the 2012-2013 season was fully recovered in the 2013-2014 season. Again, these results are evidence that fans do not punish teams for work stoppages in professional sports. 3
National Hockey League Intervention Analysis (1960-2014).
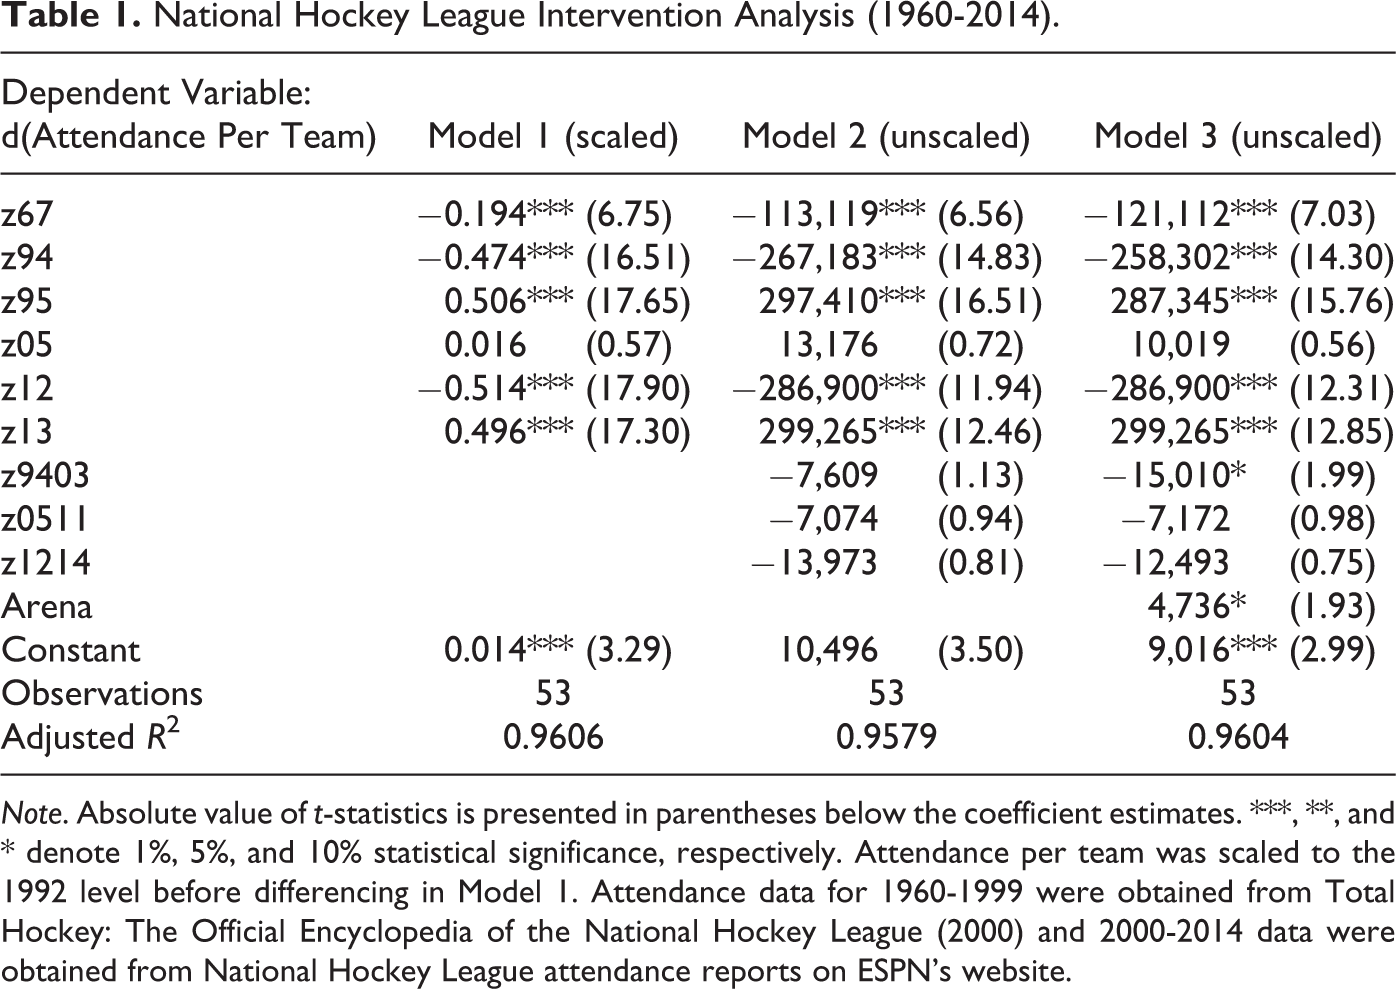
Note. Absolute value of t-statistics is presented in parentheses below the coefficient estimates. ***, **, and * denote 1%, 5%, and 10% statistical significance, respectively. Attendance per team was scaled to the 1992 level before differencing in Model 1. Attendance data for 1960-1999 were obtained from Total Hockey: The Official Encyclopedia of the National Hockey League (2000) and 2000-2014 data were obtained from National Hockey League attendance reports on ESPN’s website.
Matheson (2006) found evidence of a countervailing factor at play in MLB where widespread stadium construction masked a long-term negative fan reaction to the 1994-1995 strike. Perhaps a similar effect existed in the NHL which also experienced an extended period of new arena construction following the 1994-1995 lockout. Hockey fans turned off by the lockout may have been replaced by fans intrigued by these new arenas. To control for this potential effect, an Arena variable was added to the model reflecting the number of new arenas opened in a given year. 4 Two other dummy variables, z9403, z0511, and z1214, were added to capture lasting impacts on attendance growth resulting from the lockouts. For ease of exposition and to align with Matheson’s estimation approach, subsequent regressions used the first difference of “unscaled” attendance per team as the dependent variable. 5 Estimates from Model 2 again indicate no negative fan reaction as we cannot reject that the sum of z94 and z95 is 0 or that the sum of z12 and z13 is 0 and none of the other lockout impact variables (z05, z9403, z0511, and z1214) are statistically significant.
Adjusting the model to control for new arenas yields interesting results. As expected, new arenas increase attendance with each new venue providing an attendance boost of roughly 4,700 per team according to Model 3. More intriguing for this analysis is the statistically significant coefficient estimate for one of the long-run impact variables. The estimate for z9403 indicates that attendance growth was about 15,000 less per team per year after the 1994-1995 lockout relative to years prior to the lockout. As Matheson (2006) found to be true in MLB, it appears that new arenas concealed an underlying downward adjustment in attendance following the 1994-1995 NHL lockout. 6 Fans may actually follow through on threats not to return.
Such a statement could be made with greater conviction if there were evidence of additional decline in attendance growth following the 2004-2005 and 2012-2013 lockouts. The graphs in Figure 1 provide no such evidence nor do the results in Table 1 as the coefficient estimates for z05, z0511, and z1213 are not statistically significant. Controlling for new arenas has little effect on these estimates, suggesting that arena construction did not conceal negative fan reaction to the 2004-2005 and 2012-2013 lockouts. This is not surprising as only two new NHL arenas have opened since 2005.
It is possible that attendance demand decreased following the 2004-2005 lockout while actual attendance was relatively unaffected. Decreasing fan preferences could have been offset by decreasing ticket prices. The quantity of tickets demanded at any given price may have fallen, but the actual number of tickets purchased could have remained constant given the widespread ticket price reductions rolled out for the 2005-2006 season. 7 Underlying changes in demand may also be masked by consistently high attendance if fan demand regularly exceeds arena capacity, as is the case for many NHL teams. 8,9 Changes in the number of fans who want to attend but cannot obtain tickets would indicate fluctuations in demand but would not be reflected in attendance figures. To account for potential shortcomings in attendance analysis, we adopt a different analytical approach in the next section to continue examining the impact of fan reaction to lockouts in the NHL.
Revenue Impact
Revenue may provide a better measure of fan reaction to lockouts as it encompasses movements in attendance and prices. Earlier studies had little choice but to focus on attendance as sufficient revenue data was unavailable. This limitation is eroding as financial data are available at the team level for the 1989-1990 through 2014-2015 seasons from studies published in Financial World and Forbes magazines. 10 We use this data to examine the extent to which the lockouts have impacted the revenues generated by NHL teams.
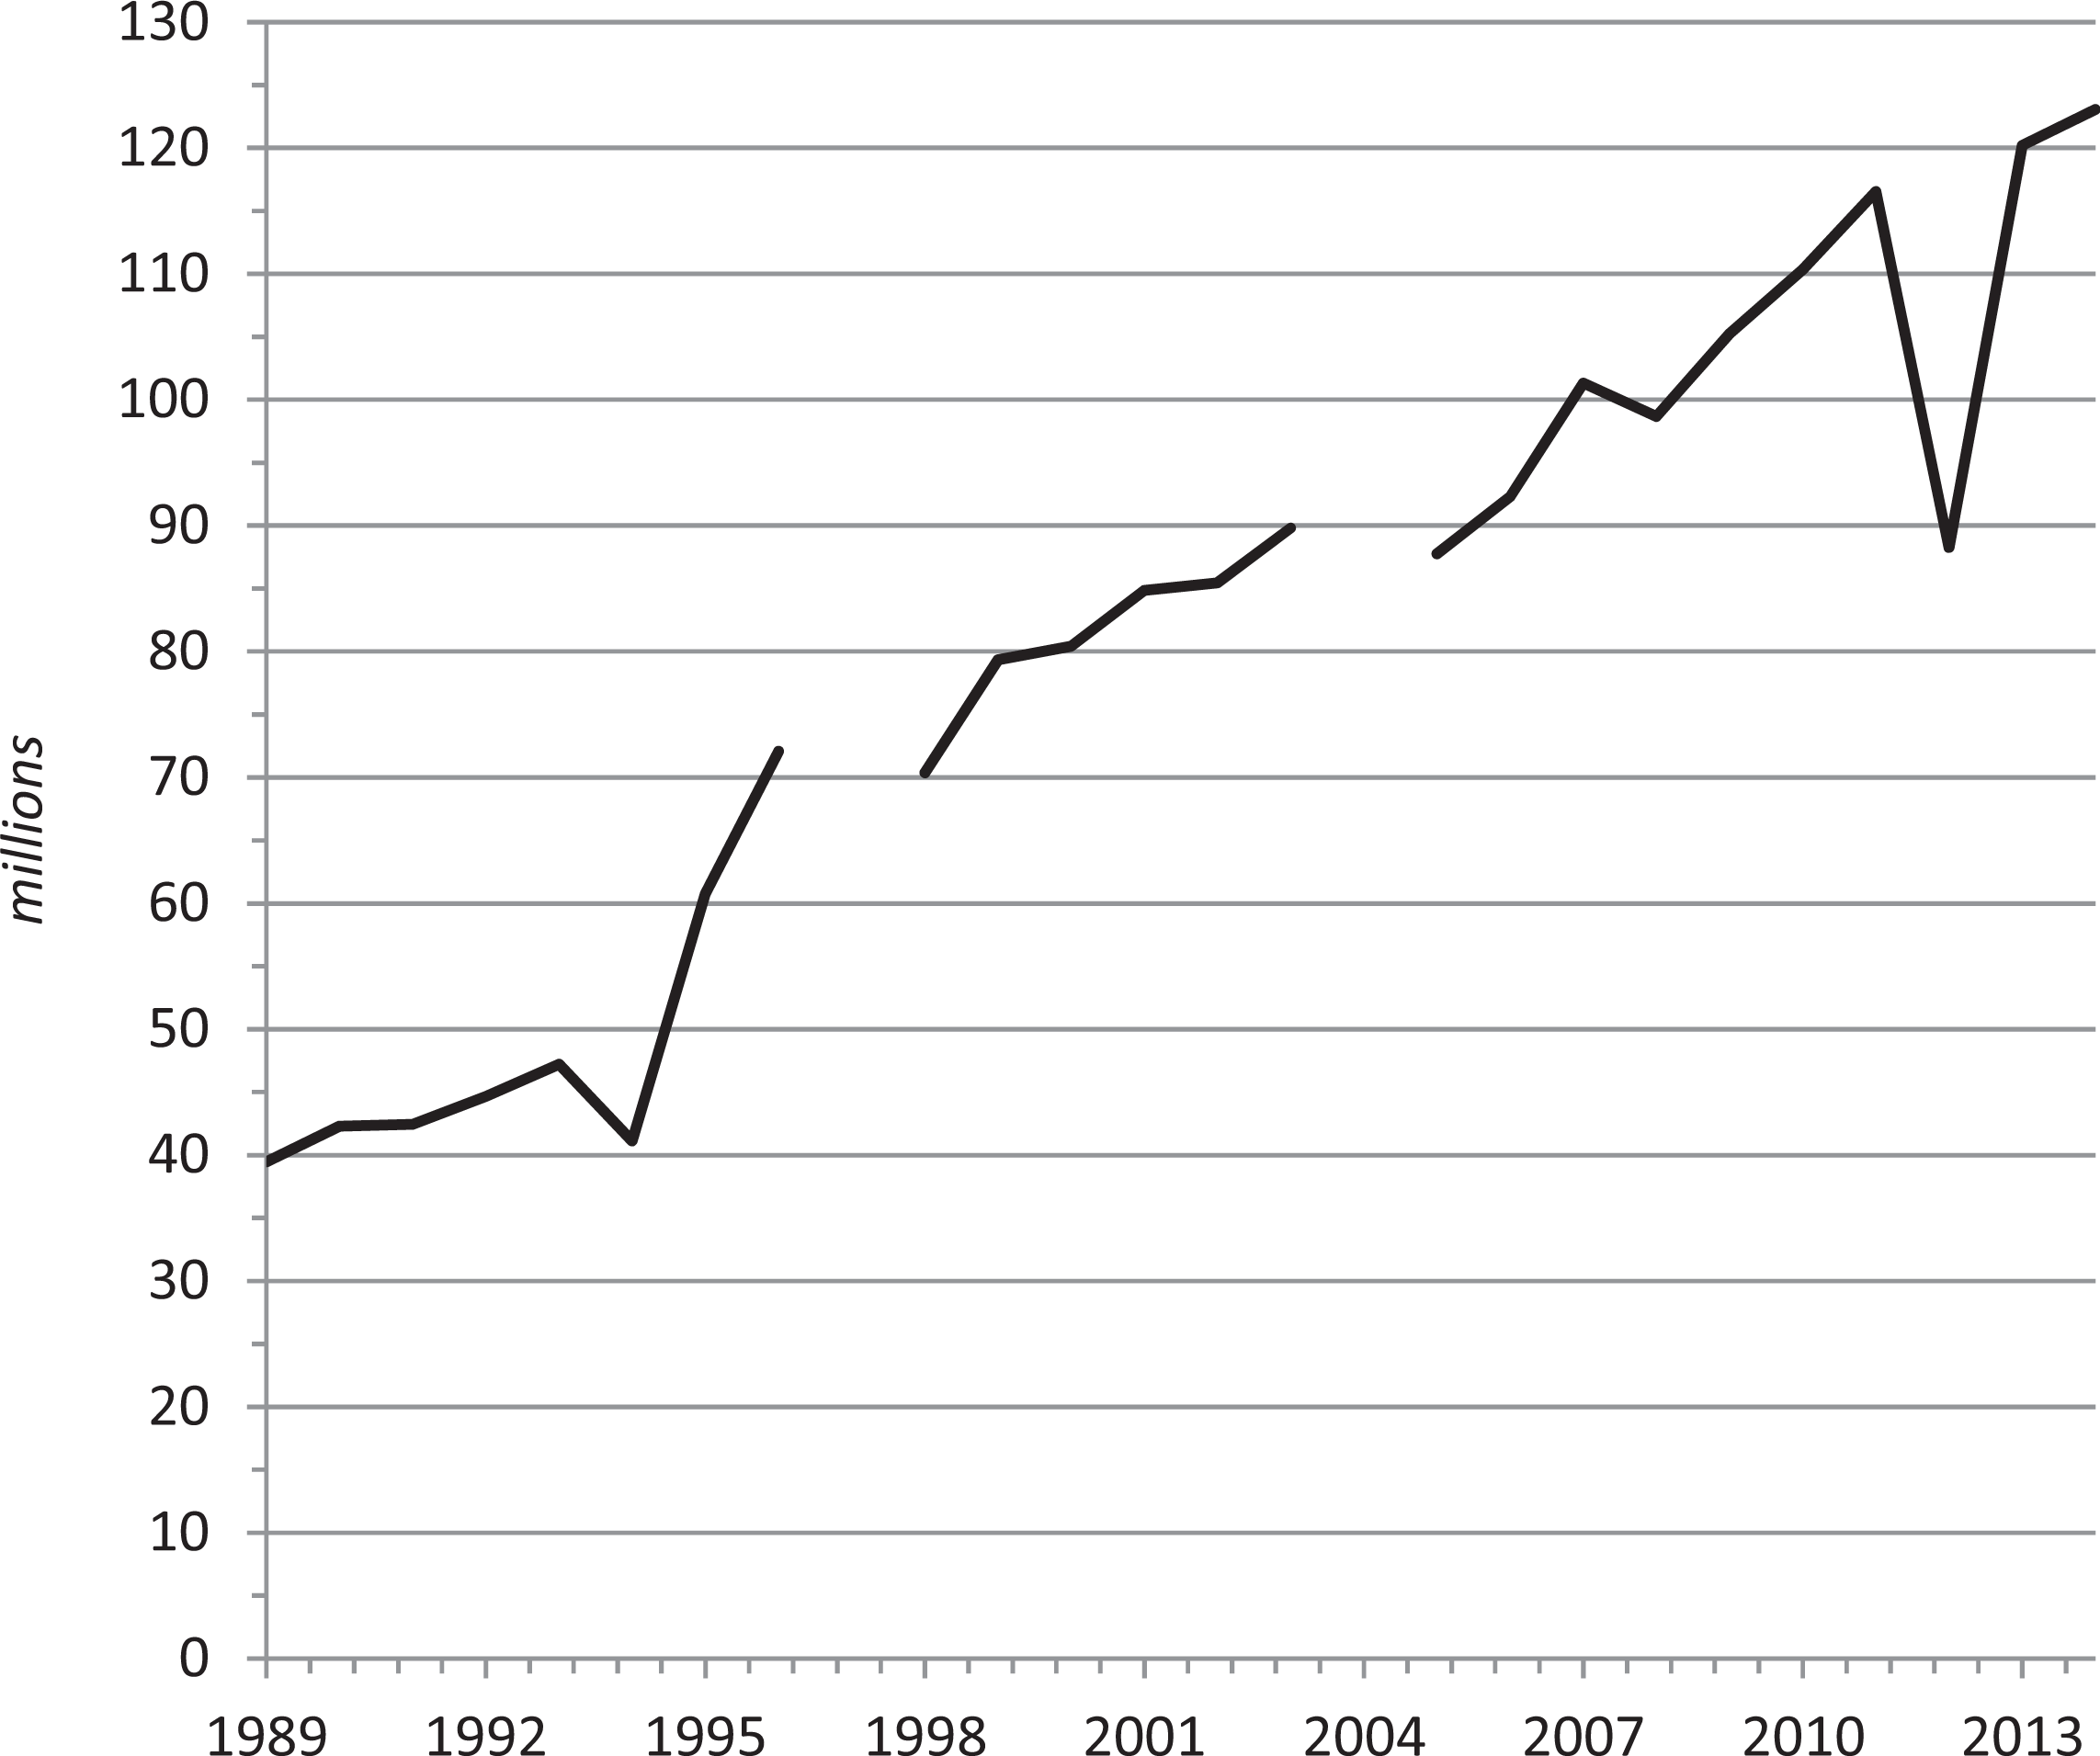
The graph of per team revenues in Figure 3 shows a general upward trend over time. A predictable decrease during the 1994-1995 lockout-shortened season is followed by surprisingly large increases in 1995-1996 and 1996-1997. According to the graph, revenue growth appears to have accelerated rather than decelerated following the 1994-1995 lockout. Following the 2004-2005 lockout, revenue dipped slightly in 2005-2006 before resuming an upward trajectory. Aside from another expected decline resulting from the abbreviated 2012-2013 season, the most recent lockout also appears to have done little to alter the upward trend in per team revenues. To control for other factors, we compiled data on potential determinants of revenue generation in the NHL. From the existing literature on NHL attendance demand, we culled a list of commonly identified factors including market and arena characteristics, current and prior year team performance, and the degree of violence with which a team plays.
11,12
These factors were incorporated into the following model of revenue for team i in market j and year t:
Revenue per National Hockey League team (2013 dollars). Data sources: Rodney Fort’s Sports Business Data.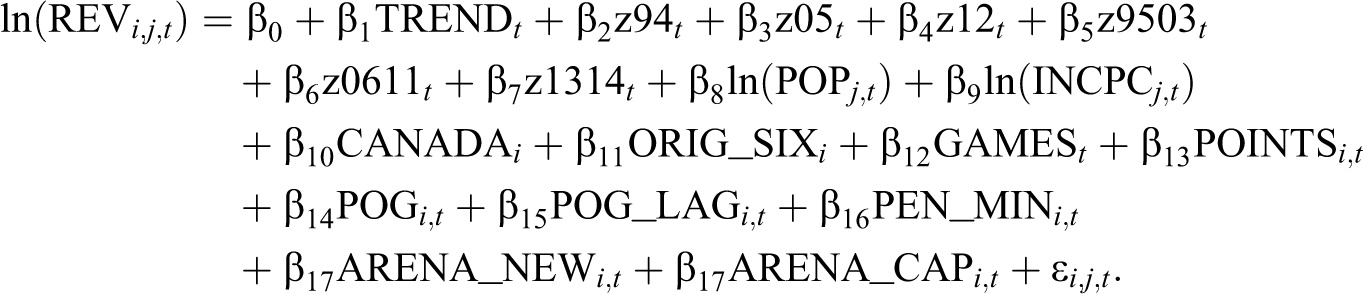
Variable Definitions.
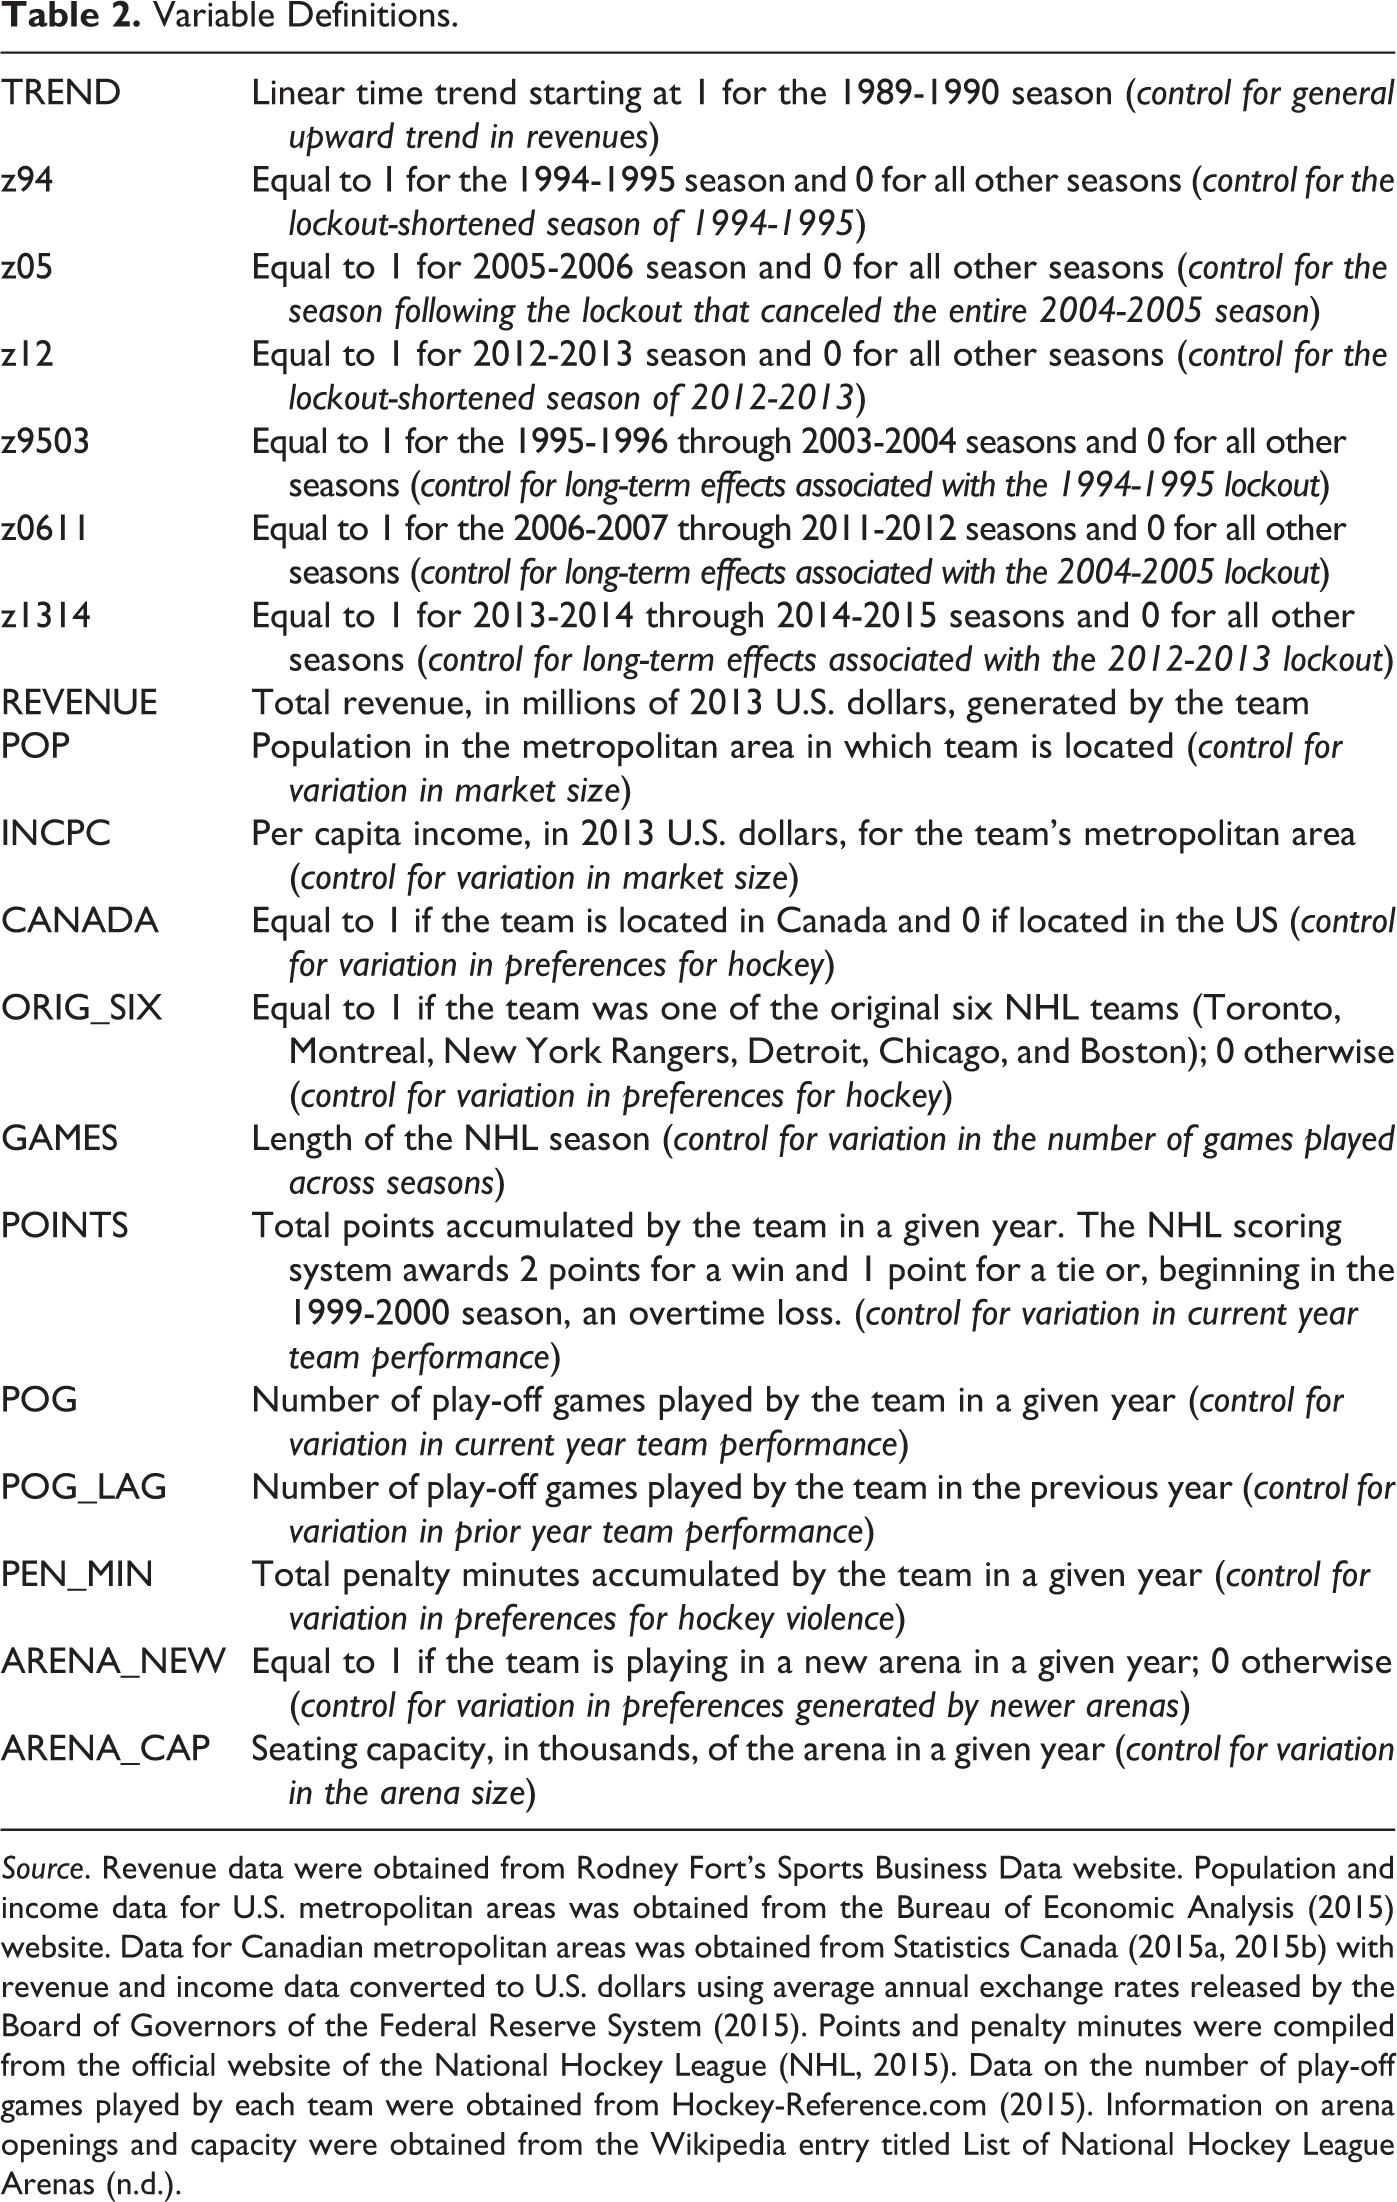
Source. Revenue data were obtained from Rodney Fort’s Sports Business Data website. Population and income data for U.S. metropolitan areas was obtained from the Bureau of Economic Analysis (2015) website. Data for Canadian metropolitan areas was obtained from Statistics Canada (2015a, 2015b) with revenue and income data converted to U.S. dollars using average annual exchange rates released by the Board of Governors of the Federal Reserve System (2015). Points and penalty minutes were compiled from the official website of the National Hockey League (NHL, 2015). Data on the number of play-off games played by each team were obtained from Hockey-Reference.com (2015). Information on arena openings and capacity were obtained from the Wikipedia entry titled List of National Hockey League Arenas (n.d.).
Descriptive Statistics (1989-1990 Through 2014-2015a Seasons).
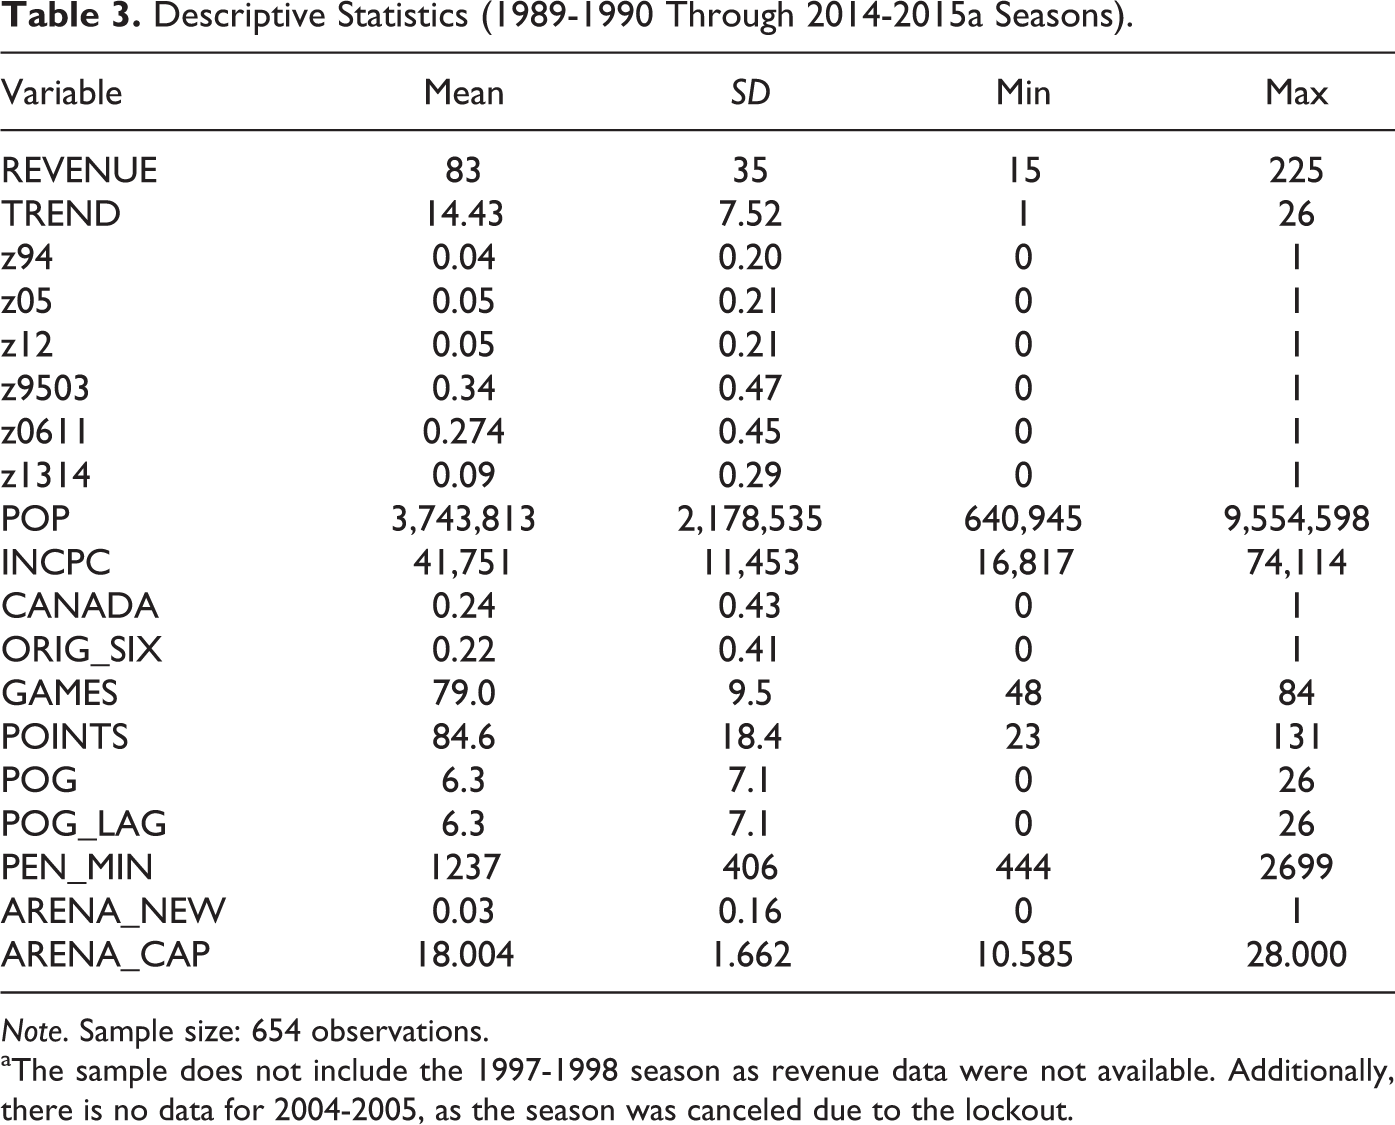
Note. Sample size: 654 observations.
aThe sample does not include the 1997-1998 season as revenue data were not available. Additionally, there is no data for 2004-2005, as the season was canceled due to the lockout.
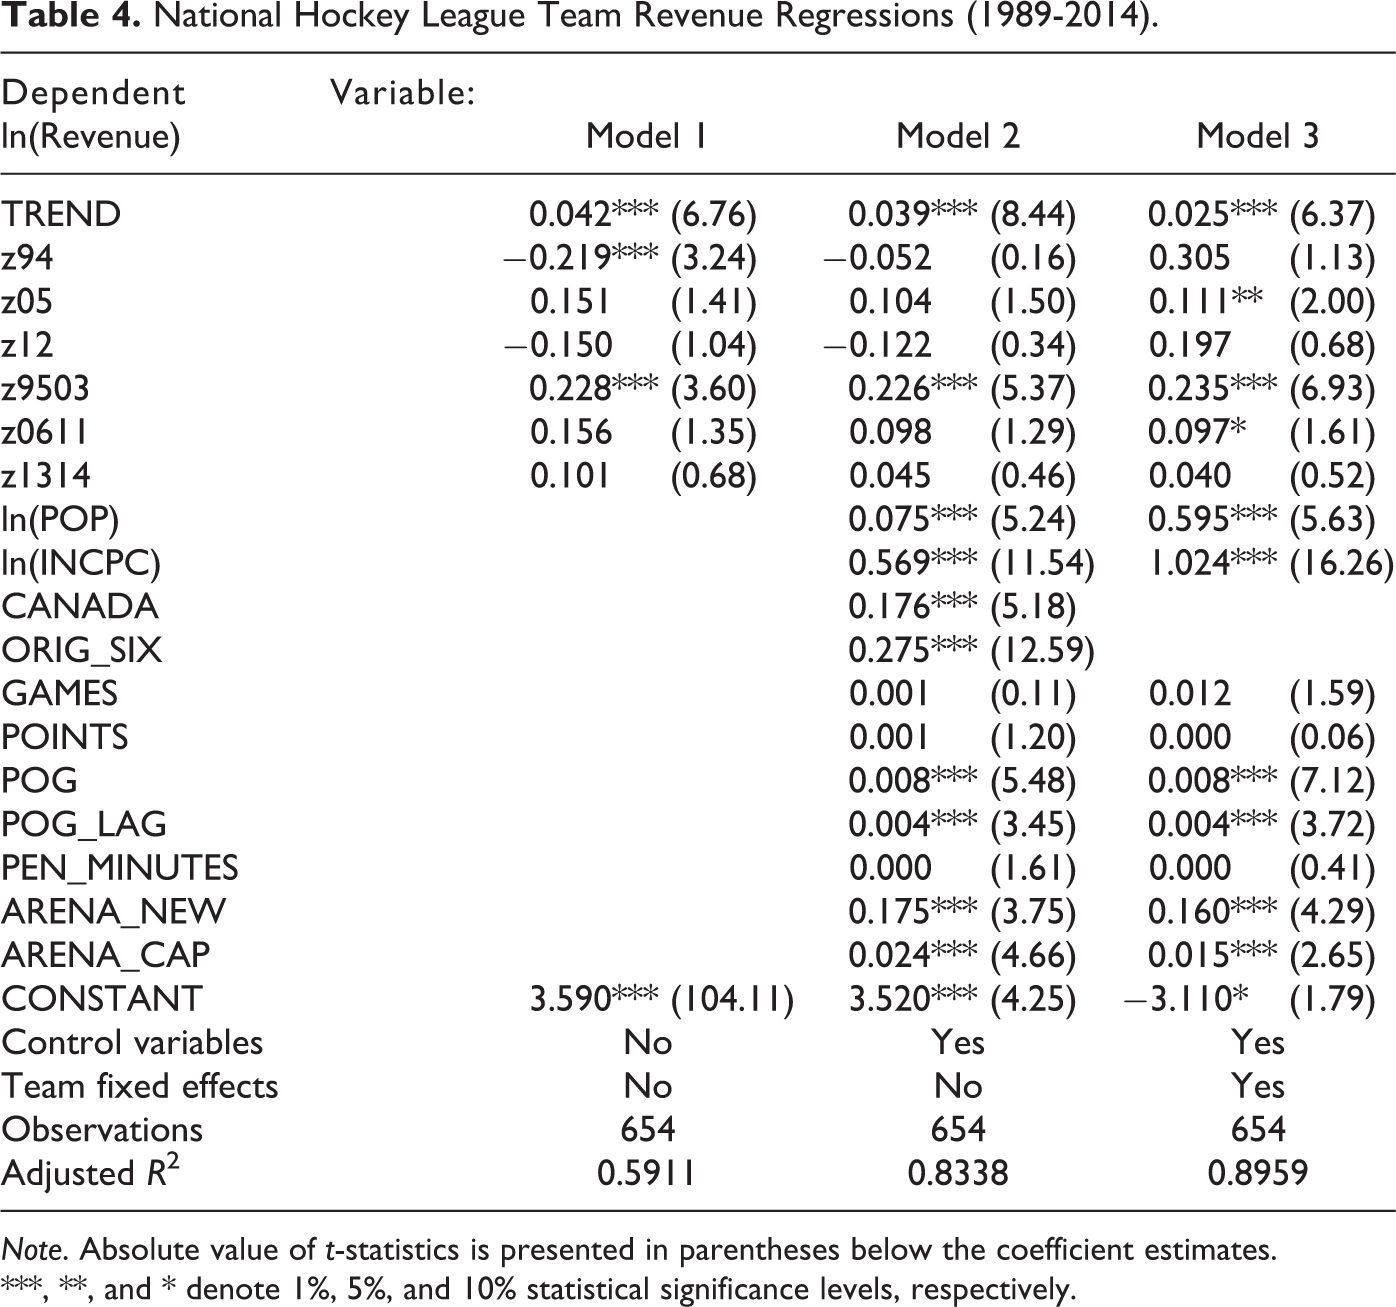
Regression results from three different specifications are presented in Tables 4. The first model included only the trend and time variables while the second model added in the control variables and the third model incorporated team fixed effects. The results are fairly robust across the specification, so we focus on Model 3 as it yielded the highest adjusted R2. As shown in Table 4, the control variables behave as expected with teams located in areas with stronger preferences for hockey or in larger or more prosperous markets generating greater revenues. Revenues also increase with arena size, the opening of a new arena and team performance in the current and prior seasons. 13
National Hockey League Team Revenue Regressions (1989-2014).
Note. Absolute value of t-statistics is presented in parentheses below the coefficient estimates.
***, **, and * denote 1%, 5%, and 10% statistical significance levels, respectively.
Returning to Table 4, the coefficient estimates for the TREND variable show that per team revenue has drifted upward over time—increasing at roughly 2-4% per year. This result is consistent with the graph in Figure 3 as is the initial negative coefficient estimate for z94. However, as shown in Models 2 and 3, z94 loses its statistical significance once season length and other factors are accounted for in the regression equation. This suggests that there was no immediate negative backlash from fans following the 1994-1995 lockout. There also appears to have been no long-term negative impact as the z9503 coefficient indicates revenues were approximately 26% higher in the eight seasons following the first lockout (1995-1996 through 2003-2004) than in the five seasons preceding the lockout (1989-1990 through 1993-1994). 14 Is this evidence that the lockout actually increased fan demand? Not likely, particularly in light of our earlier findings that this lockout generated a sustained underlying decrease in attendance. Nevertheless, it is difficult to imagine obtaining such a large positive coefficient for z9503 if the 1994-1995 lockout had a strong lasting detrimental impact on revenues. The NHL appears to have emerged unscathed from its first lockout and instead entered a prolonged period of revenue prosperity.
At first blush, the coefficient estimates for z05, z12, z0611, and z1314 seem to indicate that there were also no negative impacts resulting from subsequent lockouts in 2004-2005 and 2012-2013. However, it is important to remember that the excluded group in these regressions is the 1989-1990 through 1993-1994 seasons. While estimates for z05 and z0611 from Model 3 indicate revenues in the 2005-2006 season and the 2006-2007 through 2011-2012 seasons were approximately 10% higher relative to the excluded group, this actually represents a decrease from the 1995-1996 through 2003-2004 seasons in which revenues were approximately 26% higher relative to the excluded group. F-tests reveal that the coefficients for z05 and z0611 are not statistically different from each other but are both statistically different from the z9503 coefficient. In other words, there was an immediate and lasting decrease in revenues following the 2004-2005 lockout. Similar conclusions can be drawn for the 2012-2013 lockout as the coefficient estimates for z12 and z1314 are not statistically significant. Compared to the positive and statistically significant coefficient estimate for z0611, the lack of statistical significance for z12 and z1314 indicates that revenues decreased again following the 2012-2013 lockout. It appears that fans may not have been as forgiving following the second and third lockouts as they were following the first.
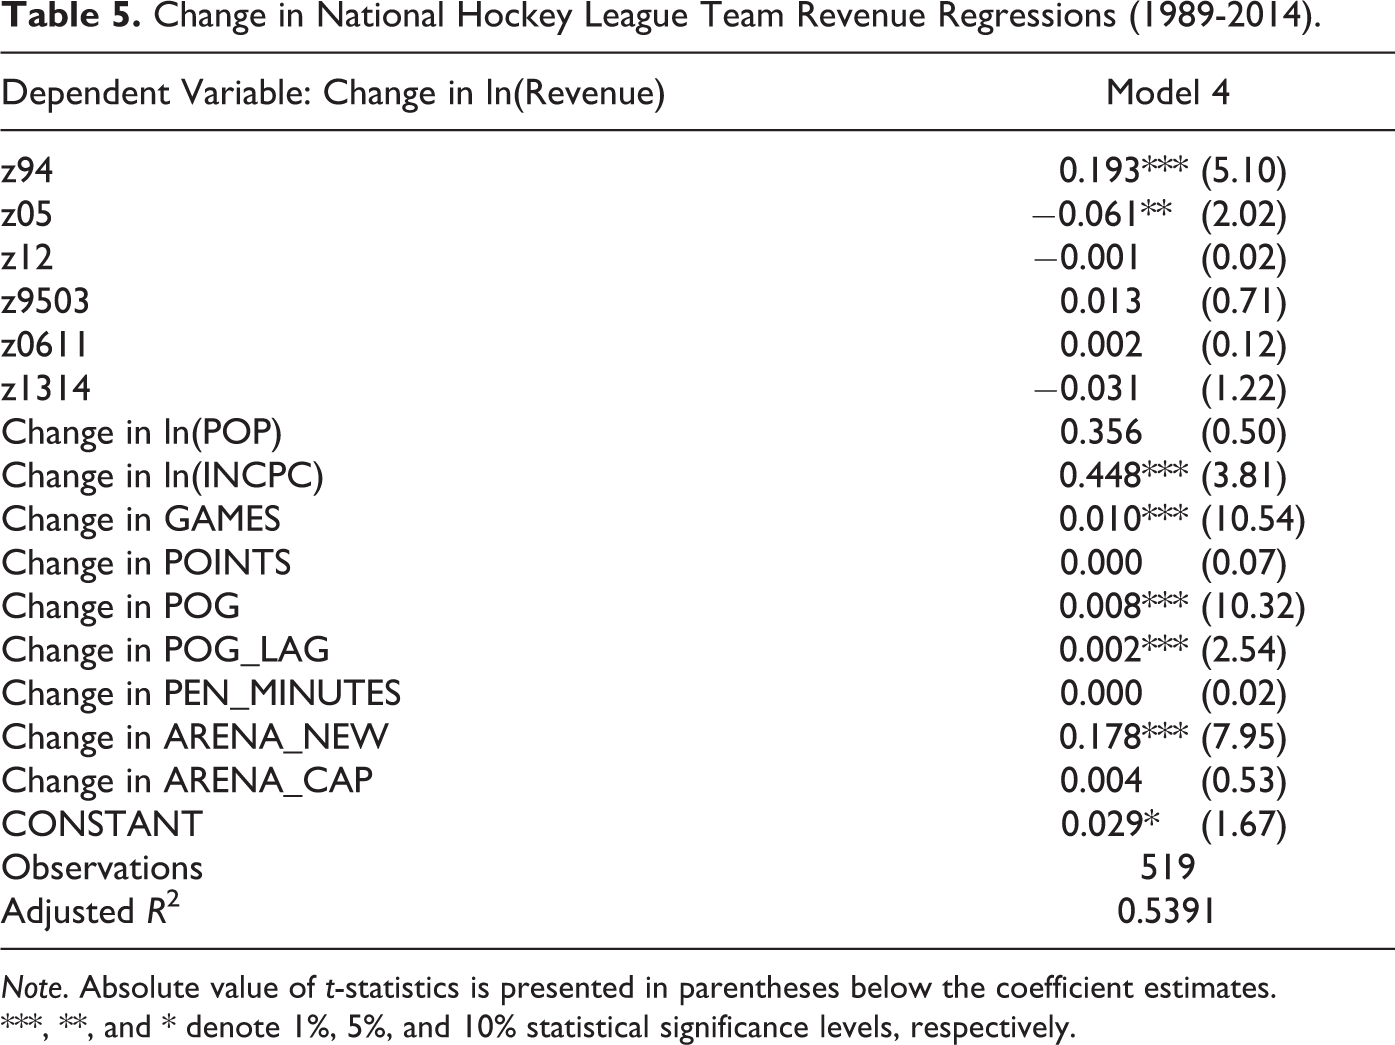
Thus far, the analysis in this section has focused on teasing out the effects of lockouts on the level of revenue. It is also possible that the lockouts affected revenue growth. To examine this possibility, we regressed the change in log revenue, a measure of revenue growth, on the time dummy variables and changes in the control variables. The results are presented in Table 5. The coefficient estimate for z94 suggests that revenue actually grew at a higher rate in the 1994-1995 season relative to the previous five seasons. However, this change was short lived as revenue growth returned to the prelockout level for the 1995-1996 through 2003-2004 seasons. Revenue growth in the first season following the 2004-2005 lockout was down, but this impact disappeared again after 1 year. The third lockout appears to have had no short-run or long-run impact on revenue growth as both z12 and z1314 are not statistically significant. In general, the lockouts do not appear to have influenced the rate of revenue growth in the NHL.
Change in National Hockey League Team Revenue Regressions (1989-2014).
Note. Absolute value of t-statistics is presented in parentheses below the coefficient estimates.
***, **, and * denote 1%, 5%, and 10% statistical significance levels, respectively.
Was the 2004-2005 Lockout Worth It?
The previous two sections provided some evidence consistent with NHL fans following through on attendance threats, but it is far from decisive. However, even if the evidence were conclusive, owners may still find lockouts to be profitable. It is not the existence of a lingering negative impact but rather the magnitude of the impact that is crucial. A lockout will be the optimal choice for owners as long as the expected costs savings to be gained from a more favorable CBA outweigh the expected revenue loss from decreases in future fan demand.
Back-of-the-envelope calculations may provide insight into the type of cost–benefit analysis that is relevant for owners considering a lockout. Using the estimates from Model 3, we calculated predicted revenues for the 2005-2006 through 2011-2012 seasons. In these calculations, the z9503 coefficient was used in place of the z05 and z0611 coefficients to obtain predicted revenues for a scenario in which the 2004-2005 lockout did not occur. Subtracting actual team revenues over this period from these what-if predictions yields the estimates of lost future revenues presented in the second column of Table 6. These lost future revenues would be offset by cost savings concessions obtained from the players in the 2005 CBA. To obtain predicted player costs for the 2005-2006 through 2011-2012 seasons under a no lockout scenario, a 4% annual growth rate was applied to actual player costs from the 2003-2004 season. 15 Subtracting actual from predicted costs yielded estimates of the owners’ cost savings attributable to the 2004-2005 lockout. These estimates are presented in the third column of Table 6. The final column reveals the aggregate annual impact. On average, the estimated benefit to owners over the 7-year period was US$23 million per team. This estimate rises to US$116 million per team when using the less conservative 7% annual growth rate in player costs that the NHL experienced during the 1999-2000 through 2003-2004 seasons. Forgone income from games lost to the lockout are also absent from this calculation, though their incorporation may increase the estimated savings to owners as average operating losses were reported for the 2001-2002, 2002-2003, and 2003-2004 seasons.
Per Team Cost Savings and Lost Future Revenues (Values Are in Millions of 2013 Dollars).

Note. Lost future revenues are the difference between estimated revenues from a scenario in which the 2004-2005 lockout did not occur and actual revenues obtained from Rodney Fort’s Sports Business Data (2016). Savings from lower player costs are the difference between estimated player costs from a scenario in which the 2004-2005 lockout did not occur and actual player costs obtained from Rodney Fort’s Sports Business Data (2016). Estimated player costs for the 2005-2006 through 2011-2012 seasons were obtained by applying a 4% annual growth rate to the actual player costs in the 2003-2004 season.
According to these rough estimates the 2004-2005 lockout was very profitable for owners despite the possibility that it may have resulted in a sustained decrease in fan demand. This is unwelcome news for fans as it suggests that even if their threats not to return are credible, work stoppages may still persist.
Concluding Remarks
Schmidt and Berri (2004, p. 356) concluded that work stoppages had no “permanent impact upon attendance in these sports.” Matheson (2006) found evidence to the contrary, suggesting a need for greater research. This study finds that the first work stoppage in the NHL may have had a negative impact on attendance but not on revenue—a broader measure of fan demand. However, our estimates suggest that subsequent work stoppages in the NHL did have significant and lasting negative impacts on revenue. We posit that the scale of evidence has shifted slightly toward work stoppages having a lasting negative effect on fan demand. More work needs to be done. Fortunately for researchers and to the chagrin of fans, professional sports continue to serve up new opportunities for research.
Would the knowledge that fan demand is negatively impacted by lockouts and strikes alter the behavior of owners and players in collective bargaining? The answer depends on the extent to which it would impact the cost–benefit analysis of owners and players. The greater the decline in fan interest, the larger the expected costs to both parties. Owners will face lower revenue streams which would translate to smaller salary pools for players. A better understanding of the size of these expected costs could impact the decisions of both parties. Nevertheless, even if the expected decline in consumer interest is large, strikes and lockouts are not likely to forever disappear. If players and owners are far enough apart in collective bargaining, as they appear to have been prior to the 2004-2005 and 2012-2013 lockouts, the expected benefit may be sufficiently large such that a work stoppage is the optimal choice for both parties.
Footnotes
Declaration of Conflicting Interests
The author(s) declared no potential conflicts of interest with respect to the research, authorship, and/or publication of this article.
Funding
The author(s) received no financial support for the research, authorship, and/or publication of this article.