
Abstract
Do people specifically seek to live among political co-partisans when they relocate? Does the partisan composition of the neighborhood affect their level of residential satisfaction? Drawing on survey data and a survey-embedded experiment, I find that people have a clear preference for co-partisans. Both Republican and Democrat identifiers prefer more co-partisans in their neighborhood. Although the preference is not the primary factor in deciding where to settle, the partisan composition of a neighborhood does affect an individual’s sense of neighborhood satisfaction. Results from a survey-embedded experiment show that respondents’ subjective satisfaction is sensitive to objective facts about their neighborhood. Respondents’ satisfaction slightly decreases when told their neighborhood has a higher presence of members of the opposite party than perceived.
Which presidential candidate would win in New York City? Who would carry upstate New York? Even casual political observers can guess these answers with fair accuracy. In recent years, geography has become a stronger predictor of electoral outcomes. One popular theory to explain the increasing connection between location and electoral outcomes is that people residentially sort themselves by partisan preferences (Bishop, 2008). The “homophily” tendency explains why people prefer neighbors who share their beliefs, lifestyle, and political preferences. As a result of self-selection, homogenous communities emerge. Bishop contends that these communities are more likely to elect political candidates who are more ideologically extreme. This in turns explains why there are fewer electorally competitive districts and why Congress has become more ideologically polarized over time.
Two recent studies empirically examine the role of partisanship in residential choice. Using a panel data that track all registered voters who moved in seven states, Cho, Gimpel, & Hui (in press) find that voters tend to relocate to neighborhoods that have a larger presence of co-partisans. That is, other socioeconomic characteristics being equal, a registered Republican (Democrat) is more likely to resettle in a neighborhood with a larger presence of registered Republicans (Democrats). This partisan sorting pattern is more evident among long-distance movers than short-haulers. Using another data set and methodology, McDonald (2011) reports a similar finding. Although these two studies appear to corroborate Bishop’s theory, they raise fundamental questions about the causal mechanism behind the observed relationship. On one hand, the connection between partisan preference and residential choice may be real and “causal” in nature, that is, people do consider neighborhood partisan composition and they prefer to relocate to ones that match their partisan preference. On the other hand, the connection between partisan preference and residential choice can be purely spurious. Migrants do not deliberately take partisan composition into consideration or meticulously look for co-partisans as neighbors but resettle into neighborhoods with other co-partisans merely through some common exogenous considerations (e.g., it may be a shared preference for open space, larger houses, better school districts, smaller local government, or lower taxes that brings Republican voters to suburbs; and the shared love for vibrant city life or cultural diversity that brings Democrats to cities). And it is purely incidental that people who share similar political preferences end up as neighbors.
More importantly, Bishop’s account is at odds with a large volume of literature on migration and residential mobility that indicates the opposite. The Census Bureau has three routine surveys—Current Population Survey, American Housing Survey, and American Community Survey—that measure Americans’ mobility and residential preferences. In addition, multiple surveys and longitudinal studies, such as the Detroit area study, Moving to Opportunity for Fair Housing Demonstration, and Los Angeles Family and Neighborhood Survey, have been deployed to investigate the dynamics of residential choices and satisfaction. A rich body of literature has documented how various socioeconomic push-and-pull factors, as well as life cycle experiences, can drive residential decisions, but partisanship is rarely discussed as a factor. The absence of discussion raises the question of the relative importance of partisan preference in residential choice.
The goal of this article is to fill the gap in the literature by examining the role of neighborhood partisan composition in residential preference and satisfaction. Using surveys and embedded experiment, I examine the role of partisan preference in residential choice and satisfaction. Confirming the tenor of prior literature, I find that neighborhood partisan makeup is of low importance in residential choice. This does not, however, suggest that people are insensitive or indifferent to their political environment. My embedded experiment illuminates how people react to new information about the partisan composition of their neighborhood. I find that people have a clear preference for neighbors who share the same partisanship and ideology. A larger presence of Republicans in the neighborhood is welcomed by Republican identifiers but not Democrats. Similarly, a larger presence of liberals is preferred by respondents who self-report as liberals and disapproved of by those who claim to be conservatives. This homophily preference is stable and is not affected by new information about one’s neighborhood partisan composition. On the contrary, new information about neighborhood partisan orientation, especially information that contradicts one’s initial perception, can slightly alter one’s overall level of residential satisfaction. Among Democrats and Republicans, respondents report a higher level of satisfaction when they learn that they have underestimated the support for their own party in the neighborhood, and a lower level of satisfaction if told that they have underestimated the support for the opposite party.
Literature on Residential Preferences and Satisfaction
Regarding factors that drive residential choices and satisfaction, in this section, I begin by reviewing the literature on residential mobility and relocation decisions. The literature can be divided into three parts, which correspond to the three stages involving residential mobility. The first stage starts with the question, to move or not? This area of literature examines the push-and-pull factors that affect residential mobility. Mobility decisions can be triggered by external factors, such as a distressed labor market, damaged properties after a natural disaster, a death in the family, crimes in the neighborhood, or an influx of members from a different ethnic group (Bonnet, Gobillon, Laferrere, 2010; Crowder, Hall, & Tolnay, 2011; Hipp, 2011; Kirschenbaum, 1996; Shaw & Baker, 2010; Xie & Mcdowall, 2008). They can also be driven by personal considerations, such as a desire to live in a better neighborhood, to live in warmer weather or to be close to family members (Rappaport, 2007; Sergeant & Ekerdt, 2008). This strand of literature also addresses how residential mobility varies over the course of an individual’s life cycle. Important life-course events, such as attending college, getting married or divorced, or going into retirement, can trigger relocation decisions (McAuley & Nutty, 1982; Speare & Goldscheider, 1987; Yee & Arsdol, 1977). In addition, these events can also alter one’s preferences for type of neighborhood. Young couples starting a new family may prefer suburbs for bigger houses, better school districts or more green space, whereas older residents would place more emphasis on accessibility to shops and medical care than the size of the house.
Once a decision to move has been made, the second aspect of the literature focuses on where to resettle. This area of literature discusses the factors that determine residential choices. Hoshino (2011) reports that residential preferences are heterogeneous and that people hold multiple, or even conflicting priorities. Affordability typically constrains the options available to migrants. The growth in income inequality in the past two decades has led to an increase in residential sorting by income (Fischer, Stockmayer, Jon Stiles, & Hout, 2004). Gentrification, especially in established communities where the supply of land is limited, often “prices-out” residents with lower purchasing power. The availability of jobs and employment opportunities further confine the range of options for migrants. People also “vote with their feet” by selecting neighborhoods that best reflect their preference for taxation and level of public services (John, Dowding, & Biggs, 1995; Percy & Hawkins, 1992; Tiebout, 1956). Apart from neighborhood safety, population density of the neighborhood, and the amount of green and open space are some of the other noneconomic factors that people consider when they relocate (Hur & Morrow-Jones, 2008; Hur, Nasar, & Chun, 2010).
Preference for racial composition of the neighborhood has been identified as one of the key elements in determining relocation decision. According to the social group theory, people have a preference for members in their social group and are more likely to reject members from the out-groups. Several studies have documented the racial disparities in the preference for neighborhood racial composition (Clark, 2009; Farley, Fielding, & Krysan, 1997; Krysan & Farley, 2002; Schieman, 2009; Swaroop & Krysan, 2011). Whites prefer to reside in communities that have a low presence of non-White minorities. Latinos and Blacks prefer integrated neighborhoods where their co-ethnics have a sizeable presence. Extending this study to examine the attitudes of native-borns, Crowder et al. (2011) reports that natives are more likely to move out in response to a growing presence of immigrants. Harris (2001) argues that the motivation for Whites to live in nonintegrated communities should not be taken as group-directed racism. Rather, it is motivated by the perceived level of crime and other social problems associated with a higher concentration of minorities. Schelling (1971) shows that, regardless of intentions, as long as people have a slight preference for the racial composition of their neighborhood, residential sorting will occur and will result in complete racial segregation over a period of time. Residential sorting by race creates segregated neighborhoods. Massey and Denton (1993) call the phenomenon “American Apartheid,” as individuals in these desolate, hypersegregated neighborhoods experience significantly more social and economic deprivation than those in economically and racially integrated neighborhoods.
The last aspect of the residential literature examines factors that contribute to one’s overall satisfaction and sense of belonging once a migrant has settled into a place. Studies have found that there are two sources of satisfaction. The “inner” source comes from one’s satisfaction with one’s home or immediate physical environment, whereas the “outer” source derives from one’s satisfaction with the larger community. Rioux and Werner (2011) study factors that affect elderly residents’ sense of residential satisfaction. In addition to the conditions of the home, physical environment, and accessibility to services, they report that elderly residents also value their relations with neighbors. This finding is not unique to the elderly population. Other studies that examine the general adult population also report that a perception of social cohesion, community spirit, better quality-of-life and involvement in community activities are related to higher levels of satisfaction (Comstock et al., 2010; Dassopoulos & Monnat, 2011; Lee & Guest, 1983; Parkes, Kearns, & Atkinson, 2002).
The vast body of literature covers multiple aspects pertaining to relocation, but partisanship is hardly discussed as a key decision factor or as a determinant of residential satisfaction. Nor does the political science literature address this question. The bulk of the political science literature focuses primarily on the contextual effects of neighborhood partisan composition on individual behaviors. In his seminal work, Migration and Politics, Brown (1988) examines the interplay between an individual’s political preference and neighborhood context. He reports that migrants who move into “politically congruent” neighborhoods are more likely to have their political attitudes reinforced, whereas those who relocate to communities that do not share their political beliefs are subject to strong pressure to modify their political beliefs and party identification in accordance with their new environment. Other studies enrich the literature by documenting how neighborhood partisan composition can affect voters’ political participation, party identification, as well as public opinion and racial attitudes (Cho, 2003; Cho, Gimpel, & Dyck, 2006; Durand & Eckart, 1976; Gimpel, Dyck, & Shaw, 2004; McClurg, 2006; Pattie & Johnston, 2000).
Data and Experimental Setup
This article attempts to address the gap in the literature by investigating the role of partisan preference in residential choice and satisfaction through direct response survey questions and embedded experiment. The data come from the 2010 Congressional Cooperative Election Study (CCES). CCES is an Internet-based survey and its respondents are a representative sample of adults in America. 1 In addition to the common content that gathers respondents’ demographics and general political predispositions, it contains modules independently developed by a number of universities. The survey questions and embedded experiment presented in this article appear in two separate modules, which I refer to as Module A and Module B.
Residential Choice
What are the factors that affect residential choice? I use a 2010 CCES module (Module A) to examine the question. Module A consists of 1,000 respondents. Respondents were first asked a screening question of whether they had moved residentially in the past 5 years. Those who had (n = 337) were asked the follow-up question:
“When you moved from somewhere else, what were the primary considerations in choosing your current residential location?”
They were presented with a table with 16 items (which will be described in detail in the next section). These items capture potential factors in determining their current residential choice. Unlike the typical census questions, this CCES module explicitly asks respondents whether the presence of co-partisans play a role in their residential choice. The sequence of these items was randomly rotated to ensure that the ordering in the table does not bias the responses. For each item, a respondent can give a score between 1 and 10, with a higher number indicating that the factor is more important in choosing his or her current location. The goal of this module is to examine whether preference for co-partisans plays a role in residential choice; and if it does, what its relative importance compared to other conventional socioeconomic factors identified in the migration literature is.
Preference for Co-Partisans
Do people prefer to have a larger presence of co-partisans in their neighborhood? Does the neighborhood partisan composition affect their level of satisfaction and sense of belonging? A researcher can devise survey instruments to answer these two questions, correlate self-reported level of satisfaction with an aggregate measure of partisan composition in one’s neighborhood and examine the degree of correlation. Such a design has several drawbacks. Previous studies on survey responses suggest that direct responses may not be reliable measurements of latent preferences. Respondents may be reluctant to reveal their true preferences and decide to provide what they deem as “socially desirable” responses (Berinsky, 2002; Phillips & Clancy, 1972; Randall & Fernandes, 1991). Different from self-censoring, respondents may sometimes not be aware of their true feelings or preferences. When approached by a researcher with an unfamiliar question, they may simply make up their responses on the fly and give inconsistent responses (Lacy, 2001; Zaller & Feldman, 1992). Nonetheless, endogeneity can pose an inference problem. Respondents who are happy with their neighborhood are likely to report a higher level of satisfaction. It is hard to tease out whether the higher level of neighborhood satisfaction is attributable to a larger presence of co-partisans. To overcome these empirical obstacles, I devised an experiment in Module B to examine how respondents react to new information about the partisan composition of their neighborhood. The intuition is that if partisanship does matter, exposure to new information about the partisan makeup of their neighborhood will affect respondents’ levels of satisfaction, as well as their preference for co-partisans.
Module B contains 2,000 respondents. The experimental setup is depicted in Figure 1. All respondents were first asked to report their perception of the partisanship makeup of their neighborhood. Two thirds of the respondents were randomly assigned to the treatment group and received a correction about the partisan makeup. Both the treatment and control group respondents were then asked follow-up questions about their feelings toward their neighborhood. Because randomization ensures that none of the respondents’ sociodemographic characteristics or attitudes (either observed or not) are correlated with the treatment condition, any differences in the outcomes between the treatment and control group can therefore be interpreted as the effect of updated information about neighborhood partisan composition on residential preference and satisfaction.
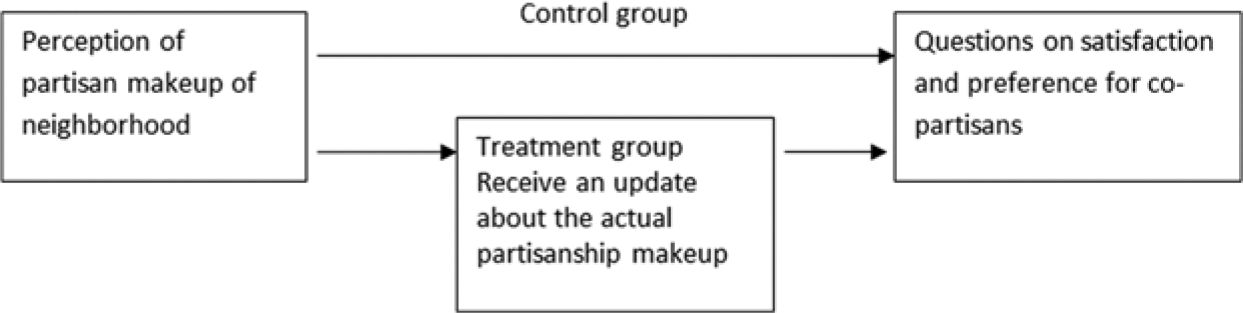
Graphic depiction of experimental setup.
The experimental setup encounters two empirical challenges. The first pertains to the definition of “neighborhood,” as different geographic scales of neighborhood may illicit different responses (Rich, 2009; Wong, Bowers, Williams, & Simmons, 2012). Zip code is used as a proxy for neighborhood, as it is the smallest geographic unit available in the survey. This choice is dictated by the constraint of CCES data. The second concerns the measurement of neighborhood-level partisan composition, as partisan composition data are not easily available at small geographic units. Research Review Board protocol mandates that the information given in any surveys must be factually correct. It is, hence, impossible to devise an experiment in which respondents are given random or false information about their neighborhood partisan composition. Because there was no data available on the party registration or presidential vote share at the zip code level for all 50 states when this study was conducted, 2 I used the share of campaign donations to the presidential candidates in the 2008 election as a proxy for the partisan composition of the neighborhood.
The campaign donations data are obtained from the Federal Election Commission Web site. I aggregated the total amount of dollars donated to the Democratic and Republican presidential candidates during the election cycle at the zip code level and computed the share of donation given to all Democratic candidates. Campaign donation may not accurately reflect the true partisan composition of the neighborhood in terms of political preferences for several reasons. Those who give money may not have the same background characteristics as those who vote. Previous studies suggest that richer residents’ political preferences often deviate from those of median voters (Bartels, 2008; Gelman, 2009). The presence of a few generous donors can also distort my measure from the true neighborhood partisan composition, although this concern can partially be remediated by the fact that Obama was tremendously successful in garnering small-amount donations from a broad spectrum of voters. The bottom line, however, is that the experiment is not about the actual composition but how respondents react when their perceived composition is challenged. The main subject of interest is whether people’s residential preference and satisfaction are tied to their neighborhood partisan composition.
Module B consisted of three parts. All respondents began with the same question:
“Among the residents in
The bold type and underline appear on the computer screen. Respondents were presented with a slide-bar on the computer screen whereby they could choose what proportion of the donations went to the Democratic candidates. The screen also displayed the numbers in text, for example, “60% donated to Democratic presidential candidates; 40% donated to Republican presidential candidates.” The slide-bar was designed such that the two proportions always add up to 100%. Two thirds of the respondents were randomly assigned to the treatment group and received a correction. On the screen, they could see their own answer and the correct answer in red font. Respondents in the control group did not receive any corrections. Both groups then proceeded to the third part of the module, which contains a series of questions measuring their residential preferences and neighborhood satisfaction. All respondents were presented with the same leading question, which read:
“Thinking about the
The bold type and underline in this text also appeared on the computer screen. Underneath this leading question was a table that included eight items that appeared in random order:
This place is a reflection of me
This is my favorite place to be
I really miss it when I am away too long
I feel happiest when I am here
I would move somewhere else if I could
I don’t really fit in with the people who live here
I wish there could be more Republicans who live here
I wish there could be more liberals who live here
Respondents were given five choices, “strongly disagree,” “disagree,” “neither agree or disagree,” “agree,” and “strongly agree.” Identical to the practice in the first module, the ordering of these items in the table was randomized to ensure that the sequencing did not bias the results. Instead of having “Republicans” and “Democrats” in the last two items, I included “Republicans” and “liberals.’ The primary motivation of this was to examine if responses are comparable when respondents are primed on ideology rather than political party. Due to limited assigned space on the CCES survey, I was not able to include both pairs (Republicans and Democrats; conservatives and liberals). Excluding these two political items, I combined the rest of the six items to form an index, which I refer to as the “neighborhood satisfaction index.” I reversed the direction of the fifth and sixth item to make recoding consistent. A respondent who “strongly agrees” with the first four items and “strongly disagrees” with the fifth and sixth items would receive a combined score of 12 points on the index. A respondent who takes a neutral position and answers “neither agree nor disagree” on all items would receive a score of 0. Theoretically, this neighborhood satisfaction index ranges from −12 to 12, with higher numbers representing a higher level of satisfaction and sense of belonging to the present neighborhood. 3 I created two additional dependent variables, namely, preference for more Republicans or liberals in neighborhood, from the last two political items. Each ranges from −2 to 2, where a higher score represents preference for more Republicans or liberals.
Results: Role of Partisanship in Residential Choice
In Module A, respondents who had moved within the past 5 years were asked to consider the factors that went into choosing their current residence. The 16 factors are shown in Figure 2. Respondents can score each factor between 1 and 10, where 10 indicates that the factor is the “most important” and 1 indicates “least important.” Based on their answers to the seven-point party identification question, I classified the respondents into three partisan groups: Republican identifiers, Democratic identifiers, and independents or third party identifiers. Figure 2 uses three distinct symbols to display the means for all the respondents (in black dots), and the means for Republican and Democratic respondents (in circle and triangle, respectively). The items are arranged in descending order of importance in the figure.
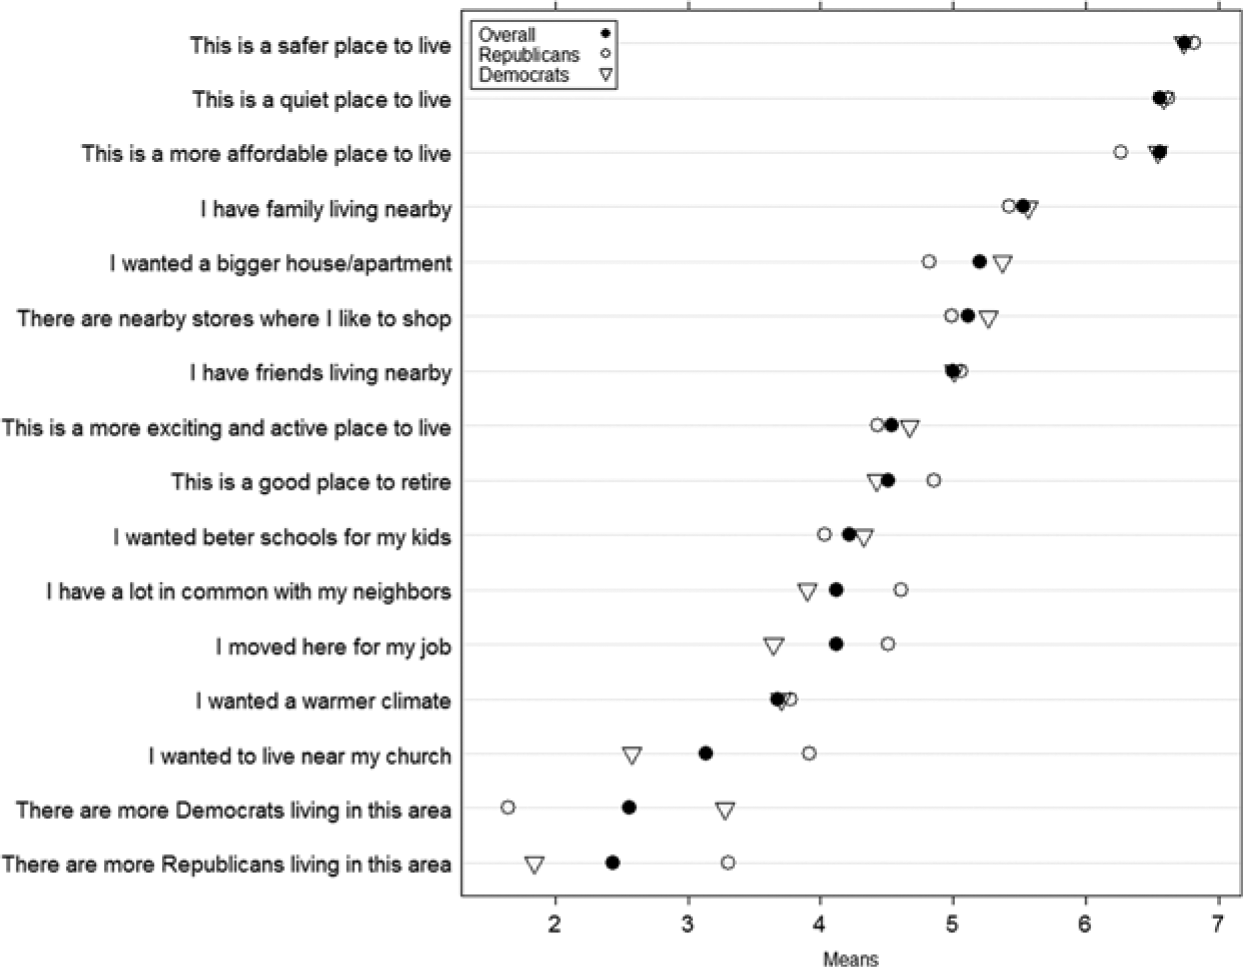
Reasons for choosing current residential location.
Regardless of party affiliation, safety, quietness, and affordability are the top three predominant factors among all the considerations, and people also factor in being closer to their social networks. Proximity to shops, families, and friends are secondary concerns. These items were rated as more important than factors such as better schools or proximity to work place. The ordering may be influenced by the fact that some respondents began considering a move with a city already in mind, then shopped among neighborhoods within that city and looked for one that would offer them a balance of safety, convenience and affordability. Hence, school district and proximity to work become less relevant in choosing their precise street and dwelling. It is significant to note that Democrats and Republicans are not substantively different in these preferences. Their group means are comparable to the overall means, as illustrated by the overlapping symbols.
Party affiliation plays a much stronger role in the last three items in Figure 2. Republican identifiers are more likely to report that they chose their current place of residence for its proximity to church. There is a clear preference for co-partisans. Republicans prefer to be in a place with more Republicans, and Democrats with Democrats. Confirming the prior literature on migration, the preference for co-partisans is the least important factor in choosing where to reside, with an average mean of only 2.5, whereas the means for the three most important factors are at least 6.5. Abrams and Fiorina (2012) query the significance of the role of partisan preference in residential choice. Citing studies on social networks, they note that people often do not know their neighbors; even among those who know their neighbors, they rarely discuss politics with them. In the cyber age, as well as in a society with decreasing social capital, it seems rather unlikely that residents would make an effort to seek co-partisans as neighbors. Results from Module A confirm their skepticism. Partisan preference does not figure as a major relocation factor.
Results: Preference for Co-Partisans
In response to the question, “I wish there could be more Republicans who live here,” the numbers reveal homophily preference. Among Republican identifiers, 58% answer either “agree” or “strongly agree.” In contrast, nearly 75% of Democratic identifiers either disagree or strongly disagree with the statement. As for independents, 65% of them take a neutral position. In response to the second question, “I wish there could be more liberals who live here,” over 80% of Republican identifiers disagree with the statement, with an overwhelming majority (65%) answering “strongly disagree.” As for Democrats, 43% either agree or strongly agree with the statement. Among independents, 54% take a neutral position and 36% disagree with the statement. Republican identifiers prefer more co-partisans in the neighborhood, whereas the idea is disliked by Democrats. A mirrored pattern is observed when using political ideology: respondents favor residents who share similar political beliefs and resist those who hold the opposite values.
Since the two dependent variables both have five ordinal categories that range from “strongly disagree” (−2) to “strongly agree” (2), I estimate the treatment effect with ordered logit using the following equation:
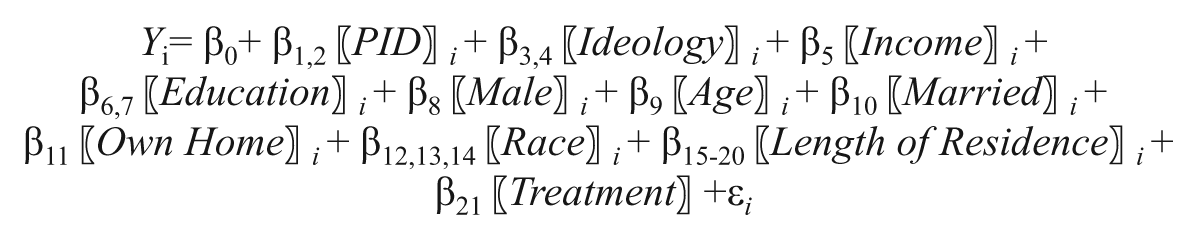
In addition to estimating the treatment effect, Equation 1 includes additional covariates to illuminate how variation in party identification, ideology, income, education, gender, age, marital status, home ownership, and length of residence at current address predict responses. I include two dummies for party identification, namely Republican and Democratic identifiers. The baseline consists of the independents. For ideology, respondents are classified into three groups. The first group consists of those who either did not report an ideological preference or reported themselves to be “middle of the road.” The other two groups are the conservatives and liberals. For education, the reference group is those who have acquired high school education or less. The two other categories are those who had some college education and those who graduated from college with at least a bachelor’s degree. I have four racial group dummies for Hispanics, Blacks, Asians, and Others.
For ease of interpretation, I convert the logit coefficients to odds ratios and present the results in Figures 3 and 4. Odds ratios larger than 1 indicate a higher probability of agreeing with the statement. In both cases, the treatment condition is not statistically significant, as the 95% confidence interval includes the value of 1. In other words, getting updated information about the neighborhood partisan makeup does not change one’s desire for a larger presence of Republicans or liberals. Party identification and self-reported ideology placement are the two predictors of responses that matter. Respondents who identity with the two major political parties are more likely to prefer neighbors of the same party affiliation and ideology.
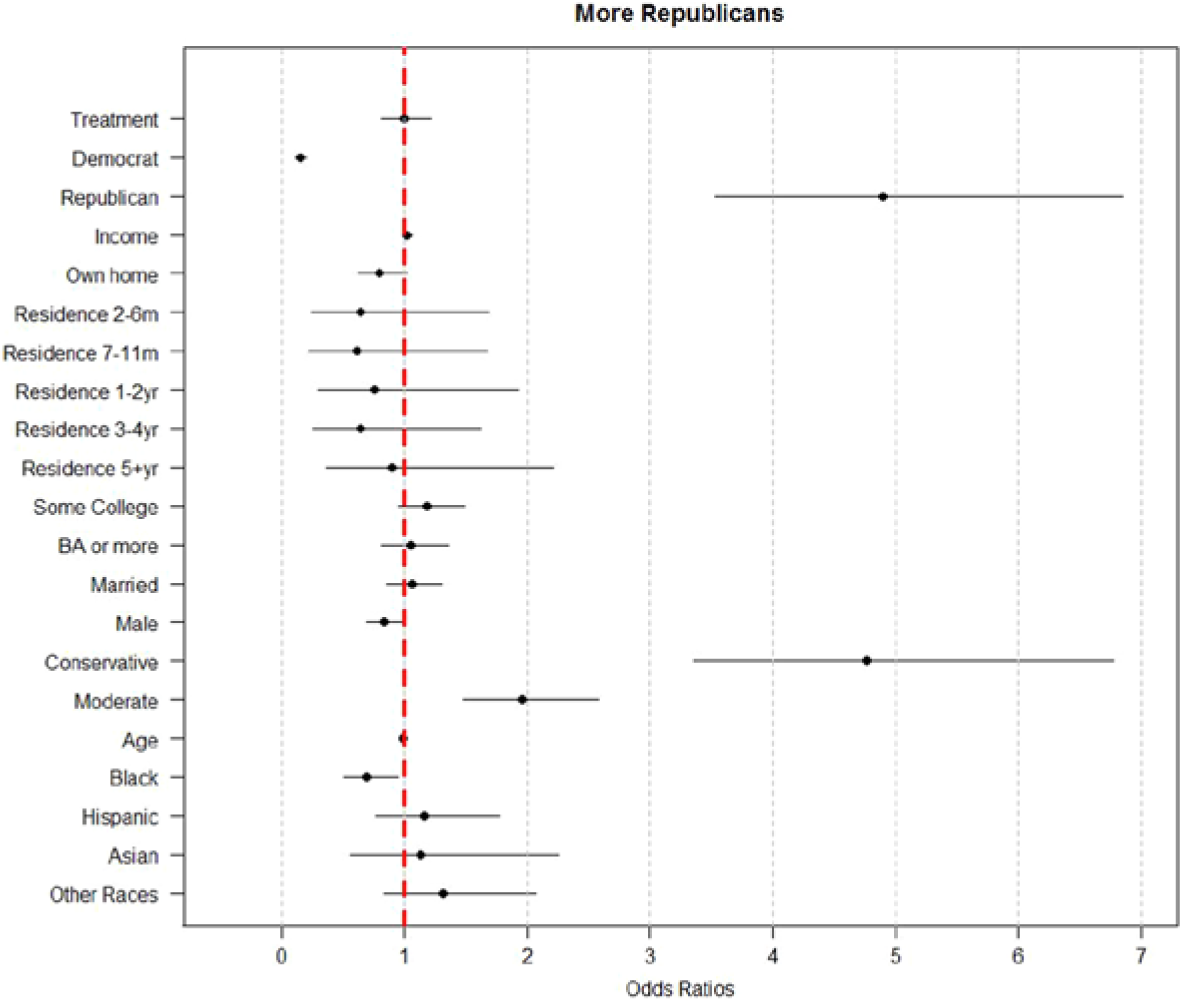
Treatment effect on preference for neighbors who share similar partisan preference.
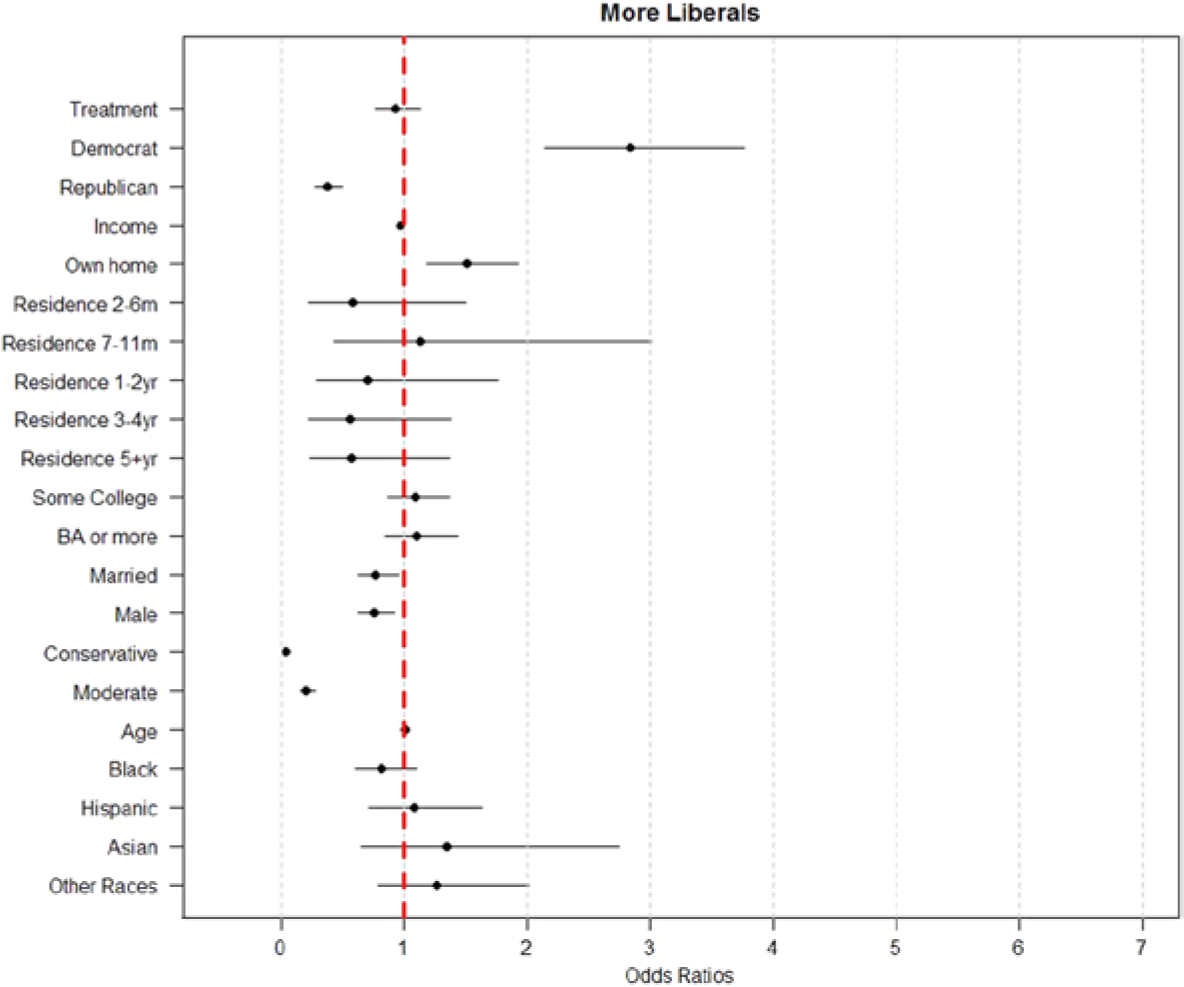
Treatment effect on preference for neighbors who share similar political belief.
Results: Neighborhood Satisfaction
Turning to neighborhood satisfaction, I use ordinary least squares to estimate Equation 1, as the dependent variable is a combined index that theoretically ranges from −12 to 12, with higher numbers indicating higher levels of satisfaction and sense of belonging. Among all respondents, the overall mean is 1.6 with a standard deviation of 5.1. The average scores for Independents, Democrats, and Republicans are 0.24, 1.5, and 2.1, respectively. The discrepancy in satisfaction across party identification remains even after I control for variation in sociodemographic characteristics across respondents. The regression coefficients with 95% confidence intervals are presented in Figure 5. Home ownership has a positive coefficient. This is expected, as home owners seem likely to need to feel comfortable with the neighborhood before making a financial commitment. Compared to White respondents, Asian and Black respondents also report higher levels of neighborhood satisfaction. Contrary to the previous two figures, treatment condition is statistically significant at the 0.05 level in Figure 5.
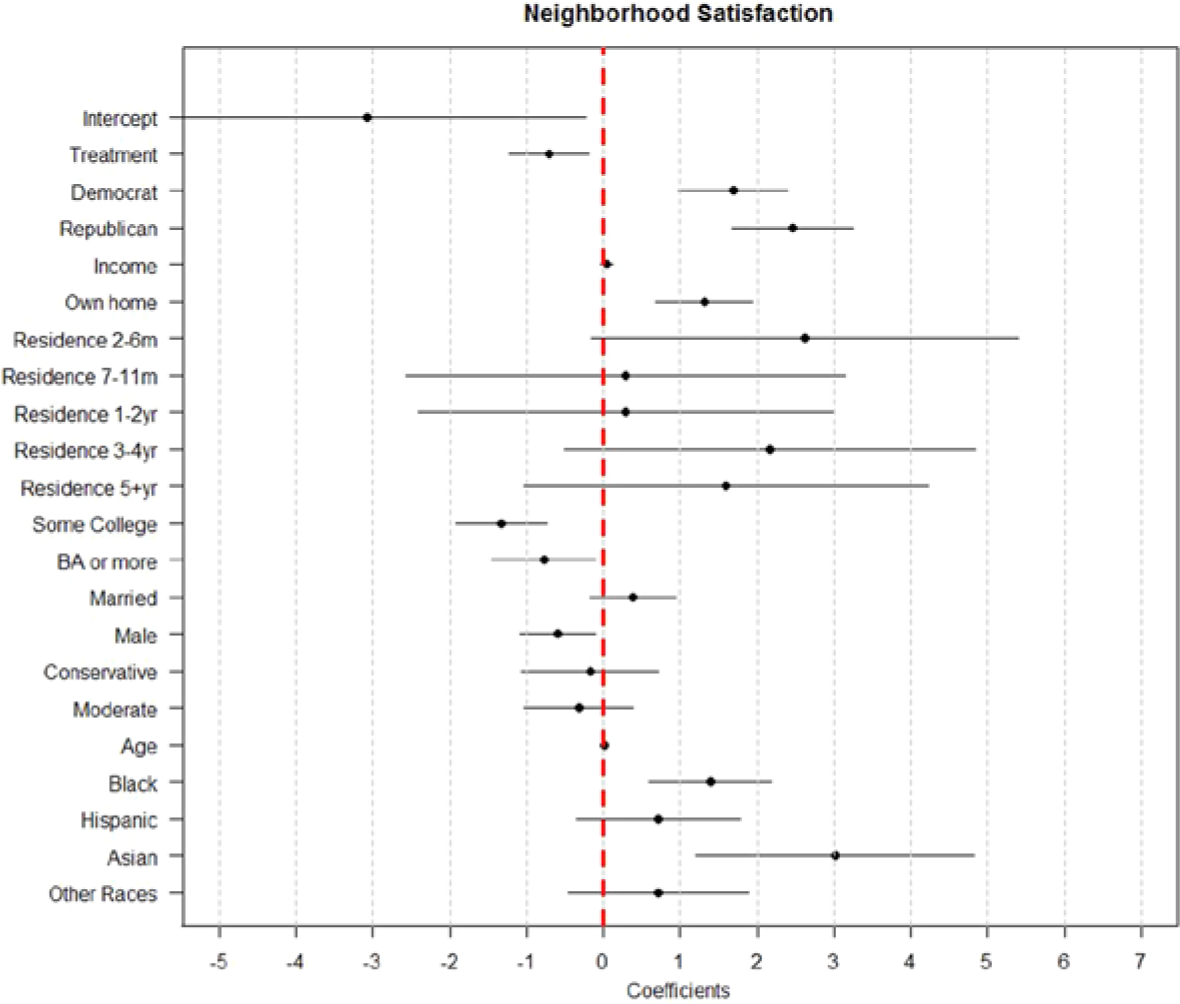
Treatment effect on residential satisfaction.
To further analyze how the treatment condition alters respondents’ level of neighborhood satisfaction, I classified the respondents into three types, under-estimators, over-estimators, and correct-estimators, based on the difference between respondents’ own perception and the information about the actual share of donations given to the Democratic Party candidates. On average, respondents underestimated the Democratic share by about 20 percentage points. Partisanship is uncorrelated with accuracy of perception. Republicans, Democrats and independents are equally likely to hold false impression. Among all respondents, about 70% underestimated the share of contributions to the Democratic Party and at least 15% overestimated.
The full regression results are presented in Table 1. Figure 6 highlights the findings from the first three columns (model without demographic covariates) from Table 1 with three bar plots. Each plot contrasts the overall satisfaction by treatment condition and three types of respondents. The dark color bars and shaded bars represent the mean satisfaction of the control and treatment groups, respectively. Among the Republican identifiers who initially underestimated the share of donations to the Democratic Party, compared to their counterparts in the control group (i.e., Republican identifiers who initially underestimated but did not receive any correction), their level of satisfaction dropped by 1.35 when they were told the actual share is higher than expected. The difference is statistically significant at the level of 0.05. Although not all treatment effects are statistically significant at the level of 0.05, the patterns reveal interesting dynamics about how the factual information alters their satisfaction. Among the Republican identifiers who guessed correctly, the correction lowers their satisfaction slightly by 0.97. And among the Republican identifiers who initially overestimated the Democratic leaning of their neighbors, their overall satisfaction slightly increased when they realized the actual share was lower than they perceived.
Treatment Effects by Types, With and Without Covariates.
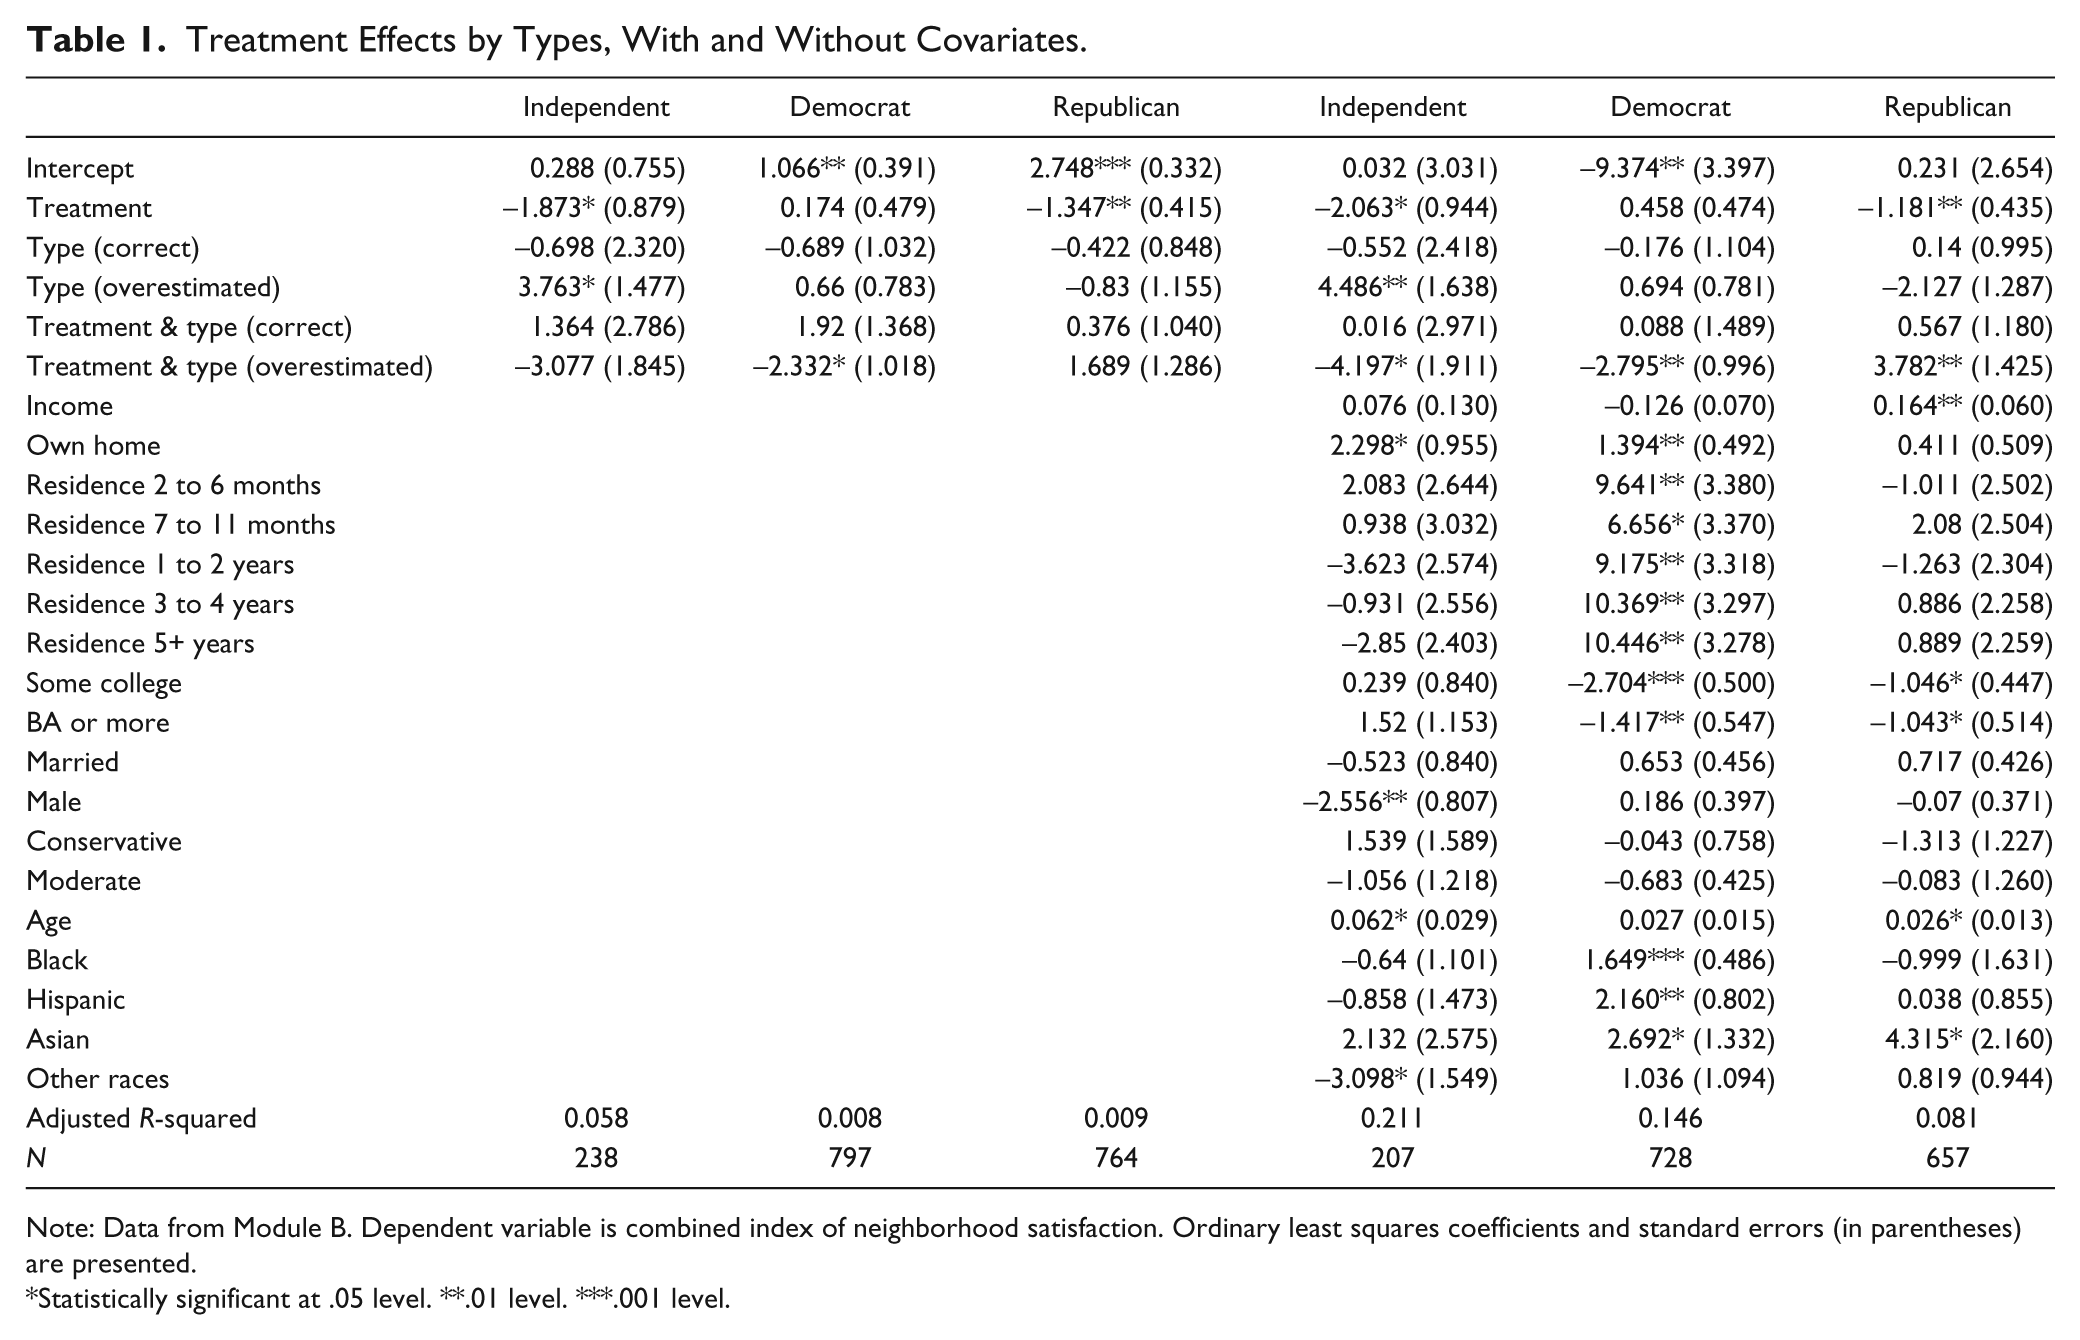
Note: Data from Module B. Dependent variable is combined index of neighborhood satisfaction. Ordinary least squares coefficients and standard errors (in parentheses) are presented.
Statistically significant at .05 level. **.01 level. ***.001 level.
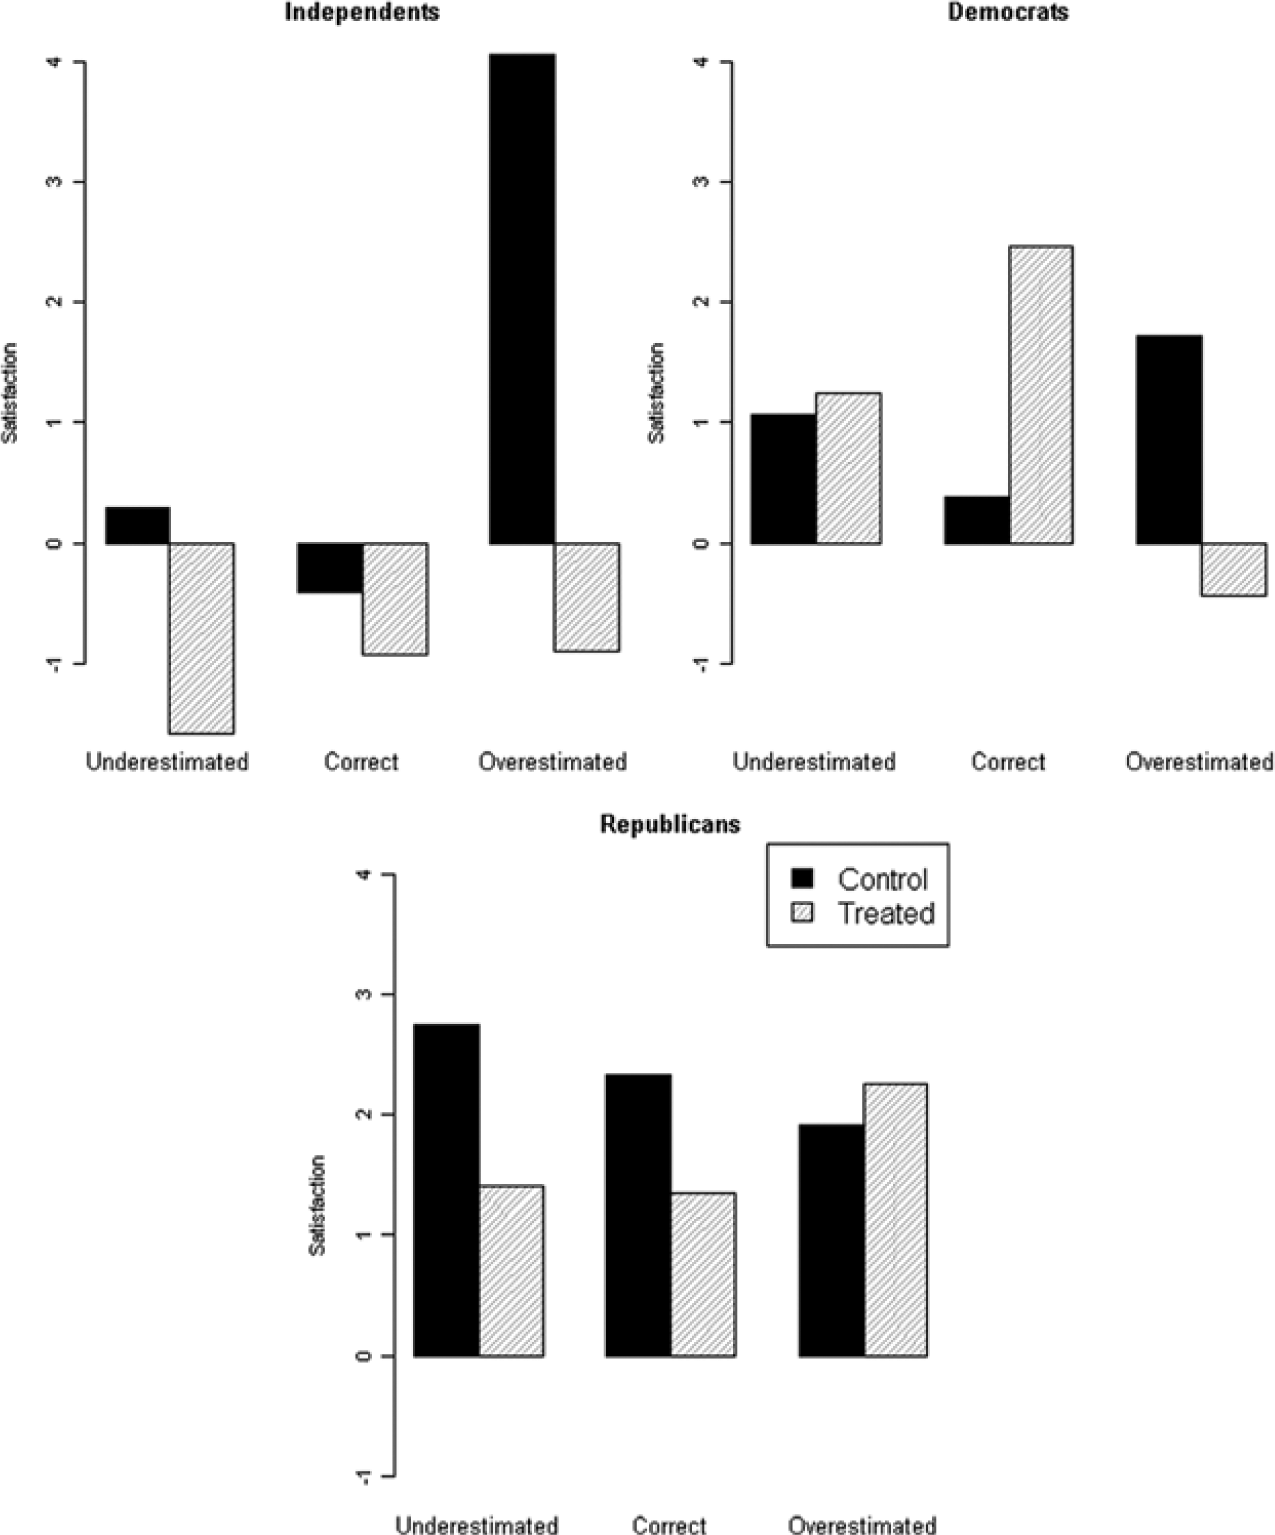
Contrast group means by party identification, type, and treatment condition.
The trend is the reverse for the Democratic identifiers. On average, when respondents learned that the actual share was either the same or higher than they had initially perceived, their level of satisfaction was generally higher than those who did not receive the information. For those who learned that they had overestimated the share, the group mean was 2.16 lower than the Democratic over-estimators who did not receive the information. In other words, finding out that the neighborhood is actually less pro-Democratic Party than expected makes these Democratic identifiers less satisfied with their neighborhood. Among independents, the treatment effects are all negative. Respondents in the treatment group reported lower satisfaction, regardless whether they had previously over- or underestimated the Democratic leaning in the neighborhood. The reaction seems to reflect their political preferences. Although many independents are indeed “closet partisans” (Keith, 1992), the fact that they choose to proclaim independence over affiliating with a political party reveals a desire to appear as less partisan. Learning that their neighbors favor a political party makes them feel less satisfied with the neighborhood.
Discussion
Existing literature on residential choices suggests that people residentially sort themselves on the basis of race, income, social class, and cultural preferences. The question at hand is whether researchers should add another factor, partisan preference, to the existing list. In this article, I use two brand-new modules in the 2010 CCES to answer this question. Although people have a genuine preference for more co-partisans in their neighborhood, the preference is not a priority. The desire for more co-partisans is not sufficiently strong to affect actual relocation decisions. In deciding where to live, conventional criteria such as safety, convenience, and proximity to families and friends remain more important than partisan preference. Nice neighborhoods attract everyone, regardless of partisanship or political beliefs. In term of residential satisfaction, the survey experiment reveals that people are not indifferent to their neighborhood partisan environment. However, it is important to put the results into context. The small sample size within treatment categories may have inflated the standard errors of the treatment effects. Putting this concern aside, most of the treatment effects are less than half a standard deviation of the empirical mean of the dependent variable. These results echo the same theme—while preference for co-partisans is genuine, it is not the most important determinant for residential relocation or satisfaction.
These findings question the extent to which people consciously seek out co-partisans to create homogenous partisan enclaves, as well as the extent to which residential sorting is responsible for the recent increase in political polarization in Congress. To be clear, my finding does not rule out the possible occurrence of geographic sorting. Although people do not appear to pick their neighbors by partisanship, Democrats and Republicans can still sort themselves into different locales. Some respondents in Module A said they chose their current homes to be close to families and friends, and studies on social network and family dynamics reveal that family members and close friends are likely to share similar political preferences (Lewis, Gonzalez, & Kaufman, 2012; Wimmer & Lewis, 2010). Thus, migration can perpetuate the geographic divide despite the fact that the moves are ostensibly nonpartisan in nature.
Contrary to the Michigan model which believes partisanship is developed early in life and is an “unmoved mover,” the life-long openness theory argues partisanship is far less stable and is subject to short-term and contextual influences. As discussed in the literature review section, previous studies have established a connection between neighborhood partisan context and individual behaviors, it seems feasible that, through conversion, persuasion, or social learning, residents can acquire the local political norm over time. This process is incremental and slow. Geographic divide can be gradually exacerbated when significant fractions of residents in different locales are converted to opposing political parties. With a high mobility rate (on average, 15% of adults moved annually, about 40% of adults moved at least once in 5 years), 4 I suspect self-selection probably plays a relatively bigger role in explaining growing geographic divide than contextual influence as residents often do not stay long in a place to allow political relearning to complete. However, testing this theory will require longitudinal data and my cross-sectional survey data cannot speak to this theory.
This experiment has two external limitations. The lowest level of geography available in CCES is zip code and the only political information easily accessible at the zip code level is campaign donation. Despite these constraints, the CCES remains a valuable venue for embedded experiment as it has a national representative sample. The results have higher external validity than other opt-in surveys such as Mechanical Turk (Berinsky, Huber, & Lenz, 2012). Researchers can transplant this survey-embedded experiment to a field experiment by showing respondents actual pictures of their neighborhood and informing them of the party registration or electoral outcomes of their immediate neighbors. If the experiment is replicated at such a finer level of geography, I would hypothesize that the effect would be stronger as respondents are likely to be more responsive to their immediate environment.
The embedded experimental module raises one interesting question. People often have little factual knowledge of their neighborhoods. Although they may pick up cues from local media, newspapers, campaign propaganda, or through interacting with neighbors, one cannot help but wonder what the consequences would have been if people were exposed to more information about their neighborhood. It is worthwhile to further explore the effect of repeated exposure to information that goes against respondents’ preexisting perceptions. An alternative research design might be able to provide multiple treatments and contrast the effect to those who only received a single treatment. Previous studies have established a linkage between neighborhood satisfaction and length of tenure at current residence (Clark & Ledwith, 2006; Parkes & Kearns, 2003; Speare, 1974). Those who are unhappy with their neighborhoods are more likely to leave. Economists and demographers have developed “tipping point” models to examine how the entrance of members from a different racial group can exert pressure on existing residents to leave (Card, Mas, & Rothstein, 2008; Schwab, 1979; Wang, 2011). Analysts can expand these models by estimating a tipping point model based on partisan composition. Understanding how the changing partisan composition may pressure individuals with an incongruent political affiliation to leave can shed new light on the interplay between contextual environment and individual behaviors.
In sum, I show that although partisan preference is relatively less important as a relocation factor, people are not indifferent to their neighborhood partisan composition. When given choices, people generally prefer neighbors who share similar political preferences. Upon receiving information about the neighborhood partisan makeup that contradicts their initial perception, people’s overall level of neighborhood satisfaction can be slightly altered. The findings in this article fill the gap in the migration literature by studying the role played by partisan preference in determining residential satisfaction, a topic that has long been under-explored in the migration literature.
Footnotes
Acknowledgements
I thank Prof. James Gimpel for sharing the module data. I am responsible for all the numbers and figures, as well as interpretation of the numerical findings reported in this article.
Declaration of Conflicting Interests
The author declared no potential conflicts of interest with respect to the research, authorship, and/or publication of this article.
Funding
The author received no financial support for the research, authorship, and/or publication of this article.